Dynamic transition in supercritical iron
Abstract
Recent advance in understanding the supercritical state posits the existence of a new line above the critical point separating two physically distinct states of matter: rigid liquid and non-rigid gas-like fluid. The location of this line, the Frenkel line, remains unknown for important real systems. Here, we map the Frenkel line on the phase diagram of supercritical iron using molecular dynamics simulations. On the basis of our data, we propose a general recipe to locate the Frenkel line for any system, the recipe that importantly does not involve system-specific detailed calculations and relies on the knowledge of the melting line only. We further discuss the relationship between the Frenkel line and the metal-insulator transition in supercritical liquid metals. Our results enable predicting the state of supercritical iron in several conditions of interest. In particular, we predict that liquid iron in the Jupiter core is in the “rigid liquid” state and is highly conducting. We finally analyse the evolution of iron conductivity in the core of smaller planets such as Earth and Venus as well as exoplanets: as planets cool off, the supercritical core undergoes the transition to the rigid-liquid conducting state at the Frenkel line.
pacs:
61.20.Gy, 61.20.Ne, 64.60.KwMost abundant among heavy non-volatile elements in the Universe, iron has been extensively studied in its solid and liquid forms. Where experiments are not feasible, computer modeling is used to understand properties of liquid iron at high temperature and pressure (see, e.g., Ref. alfe ) at which iron exists in the core of planets such as Earth as well as giants such as Jupiter. It is worth to note that even the location of melting line of iron is not well established from experiment, but computer simulation helps to clarify the experimental results premelting Little is known about iron properties in the supercritical region because iron’s critical point is located at severe (P,T) conditions. Yet here, in the supercritical state, many interesting surprises await, including the contemplated percolation-driven metal-insulator transition (for review, see, e. g., Ref. likalter ) and recently proposed dynamic, thermodynamic and structural transitions widominit ; simeoni ; phystoday ; frenkel4 ; frenkel3 ; frenkel2 ; frenkel1 ; frenkel5 .
Until recently, it has been held that no difference between a gas and a liquid exists above the critical point. Instead, the supercritical state has been viewed as qualitatively the same everywhere on the phase diagram, with no distinct changes of properties with varying pressure and temperature sbook . Yet the idea that the boiling line can be meaningfully extended above the critical point has been long intriguing. For example, the Widom line, the line of maxima of correlation length widominit , continues in the supercritical region and vanishes not far above the critical point. In this approach, a short bunch of lines, each corresponding to lines of maxima of different physical properties such as heat capacity, compressibility, thermal expansion and so on, starts from the critical point and ends quite close to it nowidom ; nowidom1 . The alternative demarcation of the supercritical state, the Frenkel line, is not related to the existence of the critical point frenkel4 , and separates two physically distinct states at arbitrarily high pressure and temperature above the critical point phystoday ; frenkel4 ; frenkel3 ; frenkel2 ; frenkel1 ; frenkel5 .
The main idea behind the Frenkel line (FL) is that regardless of how far one is above the critical point, the crucial difference in atomic dynamics can still be ascertained. Accordingly, the FL demarcates the transition between the liquid-like regime where particle dynamics consists of both oscillations and ballistic jumps between quasi-equilibrium positions and the gas-like regime where the oscillatory component is lost and the motion is purely ballistic as in the gas. This change in dynamics leads to a dramatic change of all major system properties, including diffusion, viscosity, thermal conductivity, speed of sound, specific heat, structure as well as the ability to maintain solid-like shear modes at any frequency phystoday ; frenkel4 ; frenkel3 ; frenkel2 ; frenkel1 . Since the existence of shear modes is associated with rigidity, the transition at the FL is the transition between the “rigid” liquid and “non-rigid” gas-like fluid.
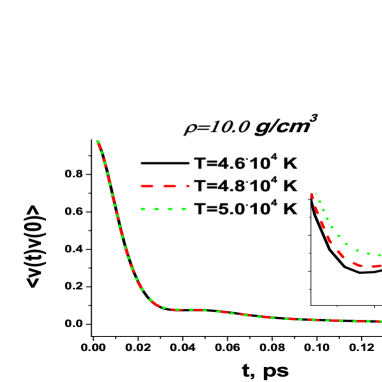
Microscopically, the change of dynamics at the FL can be unambiguously quantified by the disappearance of the minima in the velocity autocorrelation function, signalling the loss of oscillatory component of motion frenkel4 .
The FL has been calculated for model systems such as Lennard-Jones (LJ) and soft-sphere liquids frenkel4 ; frenkel3 ; frenkel3 ; frenkel2 ; frenkel1 ; frenkel5 . An important question is whether one can propose a general and simple recipe for drawing the FL on the phase diagram for any liquid, without detailed system-specific calculations. In this paper, we answer this question positively, and use iron, with its non-trivial many-body interactions, as an important case study. We subsequently discuss the relationship between the FL and percolation transition in supercritical fluids as well as transitions between conducting and insulating states. We finally point the relevance of our results to the evolution of iron conductivity and emergence of magnetic fields in planets and exoplanets at various stages of their evolution.
We have used classical molecular dynamics (MD) simulations with 3456 atoms interacting via many-body embedded atom potential belonoshko optimized for the liquid iron. Liquids were first equilibrated for 1 ns in the constant volume and temperature ensemble, and subsequently used for production runs in the constant energy ensemble with a smaller-than-usual timestep (0.2 fs) in order to properly resolve the velocity autocorrelation function at high temperature. We have simulated several density and temperature points in significant excess of the critical point.
A representative example of the velocity-autocorrelation function (VAF) is shown in Fig. 1a. We observe the transition between two regimes with and without minima of the VAF, corresponding to the loss of the oscillatory component of atomic motion frenkel4 . This transition defines a point at the FL in (,) or (,) coordinates, where is pressure and is density.
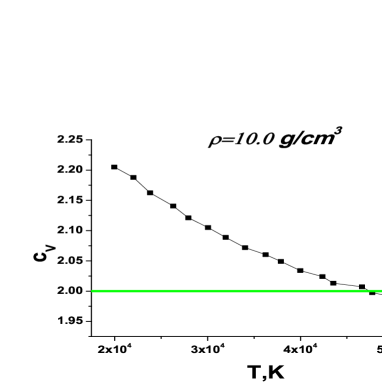
In addition to the dynamic VAF criterion, the FL can be located using the thermodynamic criterion: (). Indeed, liquids support solid-like shear modes at frequency , where is liquid relaxation time, the average time between atomic jumps at one point in space frenkelhimself . As discussed above, the FL corresponds to the loss of oscillatory component of motion and ( is the shortest vibration period), implying that the system loses its ability to support shear modes at all available frequencies. This gives the system energy of ( kinetic energy and potential energy of the remaining longitudinal mode) and kt2008 . It is important to note that here we neglect the anharmonic effects. Although it is not very precise, it does not alter the qualitative behavior of the system. In Fig. 1b, we show a representative , calculated as temperature derivative of the energy along an isochore.
In Fig. 2, we show the FL calculated using both dynamic and thermodynamic criteria and find a very good agreement between the two calculations. This serves as an important self-consistency check. The agreement is similar to that we observed earlier for the simple LJ system frenkel4 .
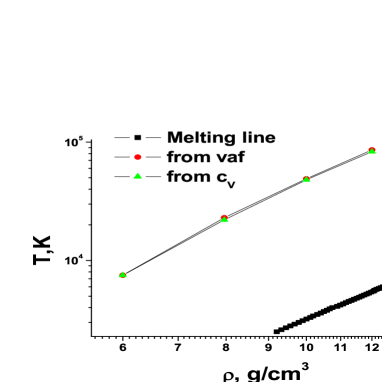
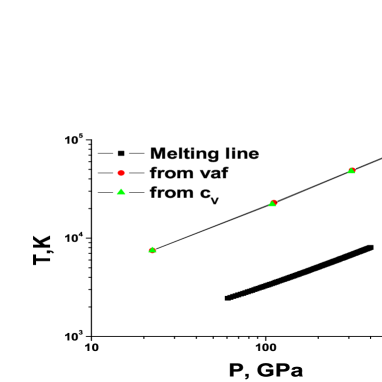
In Fig. 3, we show the FL on the phase diagram together with the melting line and the critical point. The melting line is plotted using the data from previous calculations belonoshko , and the critical point is taken as K (with uncertainty of K) and g/cm3 crit ; crit1 . The boiling line has been calculated from the law of corresponding states and previous data for the LJ system lj-lg . We observe that the FL crosses the boiling line at approximately g/cm3 and K, or and , which in units relative to the critical point is very similar to what was previously found in the LJ system frenkel4 .
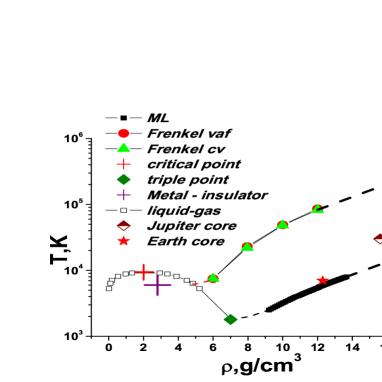
Locating the FL for iron is our first result. It immediately enables one to predict the state of the supercritical liquid in several cases of interest. For example, pressure and temperature of iron in the Jupiter core is Mbar and K jupiter . Using our MD simulations, we have calculated the corresponding density g/cm3. We observe that the location of this point on the phase diagram is below the FL (see Fig. 3), implying that liquid iron in the center of Jupiter core is in the rigid liquid state rather than in the gas-like non-rigid fluid state, with all physical implications for the major properties discussed above. The same is the case for iron in the Earth core which lies even further down from the FL as compared to Jupiter in Fig. 3. This is an important assertion for constructing models of planet interiors and understanding essential effects such as, for example, diffusion, viscosity, convection and thermal conductivity jupiter . Notably, this includes conductivity and generation of magnetic field.
An interesting observation is that the rigid-liquid state of iron in planets corresponds to current conditions only. At the early stages of planet evolution, core temperatures were significantly higher, implying that supercritical iron existed in the gas-like non-rigid fluid state (see Fig. 3) where all major properties are qualitatively different as discussed above. The same applies to younger and hotter exoplanets. We therefore propose that as planets and exoplanets cool off, supercritical iron in the core may undergo the transition at the FL. One important consequence of this transition is related to conductivity and magnetic fields.
We now explore whether the FL can be drawn for any liquid without detailed system-specific simulations such as VAF or . There is a theoretical argument that after a certain pressure threshold, the FL should be parallel to the melting line in the double-logarithmic plot. Indeed, at high pressure the intermolecular interaction is reduced to its repulsive part only whereas the cohesive attracting part no longer affects interactions. For the repulsive potential (so called soft spheres system) scaling of pressure and temperature is well-known: system properties depend only on the combination of , where is uniquely related to . Consequently, const on all (,) lines where the dynamics of particles changes qualitatively. The qualitative change of dynamics takes place on both FL and melting lines. Therefore, the FL and melting lines are parallel to each other in the double-logarithmic plot. This has been ascertained in direct simulations for the simple LJ liquid frenkel4 ; frenkel3 .
The important question is whether the parallelism of the FL and melting lines exists for systems where interactions are not reduced to pair power-law interactions. Iron is an important system in this respect: the embedded-atom potential we use belonoshko includes many-body terms so that the energy of interaction between an atomic pair depends on the location of many other atoms. Importantly, we observe in Figure 2 that the FL and the melting lines are parallel in the double-logarithmic plot. This implies that as far as scaling is concerned, interactions can be well approximated by power-law dependence in a fairly large pressure and temperature range despite the apparent complexity of interactions as in iron weiron .
Combined with the earlier results for the LJ and other simple systems frenkel4 , this result enables us to propose a simple and general way to locate the FL: it starts slightly below the critical point (slightly below as mentioned above) and runs parallel to the melting line at high pressure limit. We note at this point that by its nature, the FL is not related to the critical point and its overall existence. Indeed, we have recently shown that the transition at the Frenkel line takes place in the soft-sphere system where no boiling line and critical point exist altogether frenkel4 .
We now focus on the relationship between the FL and atomic arrangements in iron. Since early proposals ashcroft , the structure of liquid metals is considered to be well described by a collection of hard spheres of some effective diameter at a given density. Several methods to determine were proposed that employ the position of the first peak of structure factor . We find the location of the first peak along both the FL and the melting line and show the corresponding in Fig. 4. We observe that decreases with temperature. Interestingly, the packing fraction of spheres, , is constant along both lines (see Fig. 5). We observe that at the melting line, . This is close to the earlier result that melting in the system of hard spheres corresponds to hsmelting . This suggests a novel melting criterion: melting corresponds to the packing fraction of hard spheres at the hard-spheres melting line, an insights that warrants further consideration.


Importantly, we observe that at the FL (see Fig. 5). We have used our earlier data for the LJ liquid and soft spheres with frenkel4 , and have repeated the same procedure for calculating along the Frenkel line for these systems. In Fig. 5 we observe that similar to iron, for the LJ liquid at the FL.
In case of soft spheres phase diagram becomes effectively one dimensional. Both melting and Frenkel lines are defined via equations with . Melting of soft spheres with corresponds to hoover , while Frenkel line is characterized by . Barker diameter of soft spheres can be expressed as
| (1) |
From this formula one can see that packing fraction of effective hard spheres is simply proportional to and constant along the Frenkel line. The magnitude of at the Frenkel line is which is also very close to the results for LJ and iron.
The importance of is that it corresponds to the appearance of the percolating cluster in the system of overlapping spheres likalter . This coincidence is meaningful in the following sense. Below the FL, the presence of oscillatory component means that atomic clusters can be well-defined, and typically exist during liquid relaxation time . For example, the recent work identified the abundance of different stable clusters in a high-temperature liquid, and further established that the concentration of the tetrahedral clusters at the FL is 15–17 %, close to the percolation threshold in the system composed from tetrahedra kolyaroma . In contrast, above the FL where the oscillatory component of motion is lost and atoms move ballistically as in a gas, the concentration of effective spheres does not reach the percolation limit.
The latter circumstance is important for understanding metal-insulator transitions in liquids. These transitions are based on the percolation transition in the system of charged effective hard spheres (for review, see, e.g., Ref. likalter ). Here, metallic and insulating states in the liquid emerge at packing fractions above and below the percolating threshold, respectively. It is therefore important that the experimental metal-insulator transition in liquid iron ( g/cm3, K metins1 ; metins4 ) is located not far from the FL (see Fig. 3). We note that the metal-insulator transition has also been observed in liquid mercury likalter . Once the FL line in mercury is drawn similarly to that in Fig. 3 and following our general recipe for locating the FL discussed above, the proximity of the FL to the experimental metal-insulator transition becomes apparent likalter . One should note, however, that due to high degree of ionization nonmetallic state of liquid iron still has quite high conductivity metins1 ; metins4 .
We can now assert the state of conductivity of supercritical iron at different pressure and temperature conditions. Using the above density of iron in the core of Jupiter, we calculate , and find that is above the percolating threshold of 0.3. We therefore predict that iron in the Jupiter core is conducting.
We similarly find that in the Earth core corresponds to the highly conducting core, the result consistent with current understanding. However, we noted above that in the early hotter Earth, iron in the core could be above the FL, and therefore existed in the low conducting state. This has important consequence for understanding of the evolution of the Earth’s magnetic field: the magnetic field emerged at early stages of Earth evolution when cooling.
In summary, we proposed a general recipe to locate the Frenkel line in the supercritical region of the phase diagram using iron as an important case study. We discussed the relationship between the FL and the metal-insulator transition in supercritical liquid metals. This enables predicting the conducting state of iron in Jupiter and smaller planets such as Earth. We further discussed the evolution of core conductivity and associated evolution of magnetic fields: as planets and exoplanets cool off, supercritical core undergoes the transition to the rigid-liquid conducting state at the Frenkel line.
Acknowledgements.
Y. F. thanks the Russian Scientific Center at Kurchatov Institute and Joint Supercomputing Center of Russian Academy of Science for computational facilities. The work was supported in part by the Russian Foundation for Basic Research (Grants No 14-02-00451, 13-02-12008, 13-02-00579, and 13-02-00913), the Ministry of Education and Science of Russian Federation (project MK-2099.2013.2) and grant of the Government of the Russian Federation 14.A12.31.0003.References
- (1) G. A. de Wijs et al, Nature 392, 805 (1998).
- (2) S. V. Starikov and V. V. Stegailov, Phys. Rev. B 80, 220104(R) (2009).
- (3) A. A. Likal ter, Sov. Phys. Usp. 35 (7), 591 (1992); A. A. Likal ter, Phys. Usp. 43, 777 (2000).
- (4) L. Xu et. al., PNAS 102, 16558 (2005).
- (5) G. G. Simeoni et al, Nature Phys. 6, 503 (2010).
- (6) V. V. Brazhkin and K. Trachenko, Physics Today 65(11), 68 (2012).
- (7) V. V. Brazhkin, Yu. D. Fomin, A. G. Lyapin, V. N. Ryzhov, E. N. Tsiok, and K. Trachenko, Phys. Rev. Lett. 111, 145901 (2013).
- (8) V. V. Brazhkin, Yu. D. Fomin, A. G. Lyapin, V. N. Ryzhov, and K. Trachenko, Phys. Rev. E 85, 031203 (2012).
- (9) V. V. Brazhkin, Yu. D. Fomin, A. G. Lyapin, V. N. Ryzhov, and K. Trachenko, Pis ma Zh. Eksp. Teor. Fiz. 95, 179 (2012) [JETP Lett. 95, 164 (2012)].
- (10) V. V. Brazhkin, A. G. Lyapin, V. N. Ryzhov, K. Trachenko, Yu. D. Fomin, and E. N. Tsiok, Usp. Fiz. Nauk 182, 1137 (2012) [Phys. Usp. 55, 1061 (2012)].
- (11) D. Bolmatov, V. V. Brazhkin, Yu. D. Fomin, V. N. Ryzhov, and K. Trachenko, J. Chem. Phys. 139, 234501 (2013).
- (12) W.G. Hoover, S.G. Gray, and K.W. Jonson, J. Chem. Phys. 55, 1128 (1971).
- (13) E. Kiran, P. G. Debenedetti, and C. J. Peters, Supercritical Fluids: Fundamentals and Applications, NATO ASI Ser., Ser. E Vol. 366 (Kluwer Academic Publishers, 2000).
- (14) V. V. Brazhkin, Yu. D. Fomin, A. G. Lyapin, V. N. Ryzhov, and E. N. Tsiok, J. Phys. Chem. B 115, 14112 (2011).
- (15) V. V. Brazhkin, Yu. D. Fomin, V. N. Ryzhov, E. E. Tareyeva, and E. N. Tsiok, Phys. Rev. E 89, 042136 (2014).
- (16) A.B. Belonoshko, R. Ahuja and B. Johansson, Phys. Rev. Lett. 84, 3638 (2000).
- (17) J. Frenkel, Kinetic Theory of Liquids (Oxford University Press, New York, 1946).
- (18) K. Trachenko, Phys. Rev. B 78, 104201 (2008).
- (19) M. Beutl, G. Pottlacher and H. Jäiger, lnternational Journal of Thermophysics 15, 1323 (1994).
- (20) I.L. Iosilevskii, Yu.G. Krasnikov, E.E.Son and V.E. Fortov, ”Thermodynamics and Transport in Nonideal Plasma”, Moscow (2002) (in Russian).
- (21) V. N. Korobenko and A. D. Rakhel, Phys. Rev. B 85, 014208 (2012).
- (22) V. N. Korobenko and A. D. Rakhel, Journal of Experimental and Theoretical Physics 112, 649 655(2011).
- (23) Yu.D. Fomin, V.N. Ryzhov and V.V. Brazhkin, J. of Phys. Cond. Matt. 25, 285104 (2013).
- (24) B. Smit, J. Chem. Phys. 96, 8639 (1992).
- (25) N. W. Ashcroft and J. Lekner, Phys. Rev. 145, 83 (1966).
- (26) W.G. Hoover and F.R. Ree, J. Chem. Phys. 49, 3609 (1968).
- (27) R. E. Ryltsev and N. M. Chtchelkatchev, Phys. Rev. E 88, 052101 (2013).
- (28) J.M. McMahon, M.A. Morales, C. Pierleoni and D.M. Ceperley, Rev. of Mod. Phys. 84, 1607 (2012).