Cosmic evolution of gas content and accretion
Abstract
In the present universe, the gas is a minor component of giant galaxies, and its dominant phase is atomic (HI). During galaxy evolution in cosmic times, models predict that gas fractions were much higher in galaxies, and gas phases could be more balanced between molecular (H2) and atomic (HI). This gaseous evolution is certainly a key factor to explain the cosmic evolution of the star formation rate density. Star formation efficiency might also vary with redshift, and the relative importance of these factors is not yet well known. Our current knowledge of cosmic evolution of gas from molecular observations at high-z is reviewed and confronted to simulations.
1 Introduction
The abundance of gas observable in galaxies today can be expressed with dimensionless numbers, normalised with the critical density of the universe. While stars in galaxies account for = 3 10-3 (e.g. Fukugita et al. 1998), the HI gas contributes by 3.5 10-4 (Zwaan et al. 2005), and the molecular gas by 1.2 10-4 (Young et al. 1995, Sauty et al. 2003, Keres et al. 2003, Saintonge et al. 2011).
Theoretical considerations and semi-analytical models predict that the molecular-to-atomic gas ratio decreases regularly with cosmic time in galaxies (Obreschkow & Rawlings, 2009, Obreschkow et al. 2009). The phase transition to molecular hydrogen can be formulated in terms of pressure (Blitz & Rosolowsky 2006), and the surface density and consequently the pressure is higher in high-z galaxies. The modelisation leads to a dependency of H2/HI varying as (1+z)1.6. This is essentially due to the expectation that the size of galaxies is growing as (1+z)-1 with cosmic time.
The evolution with z of in galaxies is not yet known from emission, but can be derived from the damped Lyman- absorption in front of quasars, since these systems are thought to correspond to galaxies. Albeit with large error bars, the abundance of HI appears about constant from z=4 to z=0 (Zwaan et al. 2005). It is however expected to experience a strongly varying phase at higher z, when cold gas settles in galaxies, through accretion and cooling, mergers, etc. At these early epochs, molecules might have difficulties to form, since metals and dust are building up slowly, but the exact processes are not yet well known.
What is better known is the cosmic evolution of star formation rate density, from UV to far-infrared light, and its decrease by a factor 20 since z=2 (e.g. Hopkins & Beacom 2006, Bouwens et al. 2011). How does this SFR evolution relate to the cosmic cold gas evolution? Is it linked to HI or H2 density, or/and to the star formation efficiency (SFE)?
2 High-z molecular observations
Since about 20 years now, molecular gas is observed in high redshift galaxies. Due to the lack of sensitivity, mostly lensed galaxies were first discovered (cf the review by Solomon & vanden Bout 2005). More and more ”normal” objects, on the main sequence of star forming galaxies are observed now, and this will increase considerably with ALMA. The detection of CO lines at high redshift is made easier by the existence of the rotational ladder, where the flux of the higher transitions can be much higher than the fundamental line. This is not the sase of the HI gas and the only 21cm line, which will have to wait SKA to be detectable at high redshift.
2.1 Starbursts and ULIRGs
Until very recently, only very luminous galaxies in the far-infrared (LIRGs and ULIRGs) were detected in the CO lines at high redshift, due to limited sensitivity. In the local universe, it is now well established that ULIRGs are starbursts triggered by galaxy interactions and mergers (e.g. Solomon et al. 1997). At high redshift, the global star formation rate is increasing rapidly, and even ULIRG are not all starbursts. It is thought now that the starburst mode is likely to represent only 10% of the stars formed at z=2, the cosmic peak of the star formation activity (Rodighiereo et al. 2011).
Already Greve et al. (2005) showed that the SFE (defined by the ratio of FIR luminosity, taken as an indicator of SFR, to the CO luminosity, indicator of the gas mass) was increasing significantly with redshift, reaching maxima around z=2 for submillimeter galaxies (SMG) with an SFE up to 2 orders of magnitude higher than for local LIRGs. The gas consumption time-scale, being the inverse of the SFE, could then fall to 20 Myrs, instead of the average 2 billion yrs locally.
The redshift range between z=0.2 and z=1 is very important for the cosmic gas evolution, since it is the period when the cosmic star formation density drops by a factor 10, and it corresponds to 40% of the universe age. Unfortunately, this domain was not easily observed because of atmospheric lines, and the need of sensitive 2mm instruments. A sample of 69 ULIRG was observed in different CO lines with the IRAM-30m precisely in this redshift range (Combes et al. 2011, 2013). From the galaxies where the gas excitation is known, and from the dust masses derived from the continuum emission, the adoption of the ULIRG CO-to-H2 conversion factor is justified (e.g. Solomon et al. 1997). This ratio is 5.7 times smaller than the standard ratio adopted for Milky Way-like galaxies. The average molecular mass is however 1.45 1010 M⊙, an order of magnitude higher than in the Milky Way.
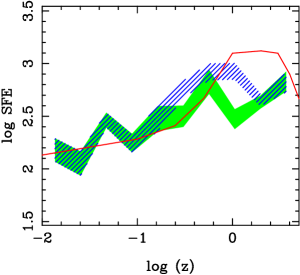
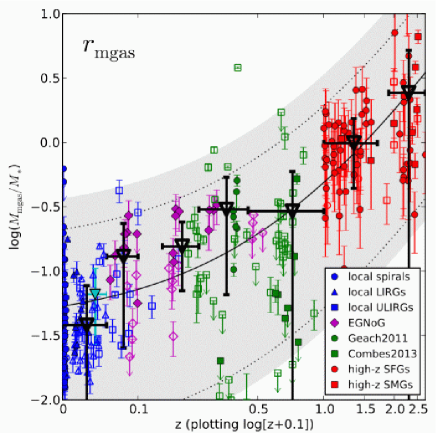
Compiling this sample with other LIRGs and ULIRGs, both the molecular gas to stellar mass ratio and the SFE significantly increase with redshift, by factors of 3 from z = 0 to 1, as shown in Figure 1, suggesting that both factors play an important role and complement each other in cosmic star formation evolution.
2.2 Main sequence galaxies
Not all star forming galaxies at z=1-2 have a high SFE. Some galaxies, selected only from their optical colors, were detected in the CO lines with surprising high CO luminosities (Daddi et al. 2008). These galaxies, although still in the ULIRGs range, have a low gas excitation (Dannerbauer et al. 2009), and are relatively extended. They are interpreted as disk-like galaxies with steady star formation rate, while the most excited ULIRGs are nuclear starbursts. It is possible that the Milky Way-like conversion ratio applies for these objects, which will further lower their SFE. However, the adoption of a bimodal conversion ratio leads to an artificial bimodal star formation regime, separating the starbursts from the more quiescent disks with a gap of an order of magnitude in gas consumption time-scales. In reality, there must exist a continuous conversion ratio, according to gas density, temperature, and other factors like metallicity, and the SF regimes are certainly continuous too.
A continuity of galaxy properties between the two modes of star formation, main sequence and starburst, is developed further by Daddi et al. (2013) and Sargent et al. (2014). Although starbursts have larger SFE, it is not easy to know whether the cause is a lack of gas (may be the consequence of a short boost of star formation), or an excess of young stars. If the starburst is triggered by a merger, numerical simulations show that gas is driven inwards by gravity torques from the outer reservoir, and more gas is then observable (e.g. Di Matteo et al. 2007, Montuori et al. 2010). An excess of fresh gas in star forming galaxies is also supported by the fundamental mass-metallicity relation, which precisely depends on SFR (Manucci et al. 2010). Starbursts have also a larger molecular gas to stellar mass ratio, so their elevated SFR is both due to a larger gas content and a larger SFE. The latter could be due to the larger central concentration of the gas, and this will be clarified through resolved SFR/gas density studies.
The PHIBSS large program on the IRAM interferometer (Tacconi et al. 2010, 2013, see also this conference) has targeted a sample of massive star forming galaxies, likely to be on the main sequence as defined in the stellar mass-SFR diagram (e.g. Wuyts et al. 2011). From the 52 CO-detected objects at z=1-3, the gas mass fraction is found to increase with z, up to 50%, and decrease with mass. Most of the objects look like disks with regular rotation, and are more steady star forming disks than starbursts, without any interaction or merger. Since the molecular gas depletion time-scale is typically 0.7 Gyr and varies as (1+z)-1, the star formation must be fueled by gas accretion episodes, which are frequent at high and moderate redshift (e.g. Combes 2014). The resolved Kennicutt-Schmidt relation obtained in a few objects is compatible with a linear relation, and a depletion time-scale lower at high-z (Freundlich et al. 2013, Genzel et al. 2013).
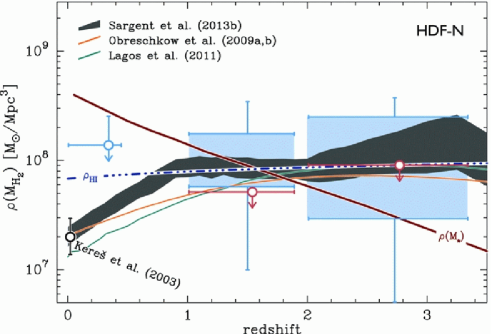
In all these massive star forming galaxies, atomic gas cannot be dominating the cold gas, since the sum of the molecular and stellar masses are so close to the dynamical mass. Unless the CO-to-H2 conversion factor is largely in error, the H2/HI ratio has indeed increased with z, as predicted by models. Another recent study supports this conclusion: Decarli et al. (2014) have carried out a blind molecular line survey in the Hubble Deep Field North, scanning the whole 3mm band with the IRAM interferometer. Their blind detection of 17 CO lines, together with the upper limit obtained by stacking the observations towards spectroscopically identified objects, constrain the CO luminosity functions at the corresponding redshifts. They deduce that optical/MIR bright galaxies contribute less than 50% to the star formation rate density at 1 z 3. Their derived evolution of the H2 mass density is compared to models in Figure 2.
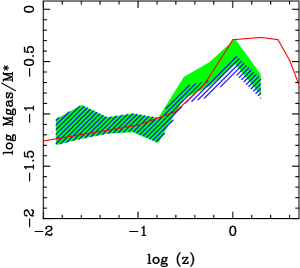
A recent 870m continuum survey with ALMA of SMG in the Extended Chandra Deep Field South (Swinbank et al. 2014) has discovered that the well detected sources (S 2mJy) are in average ULIRGs with SFR=300 M⊙/yr. The extrapolation of the counts down to S 1mJy show that these sources contribute to 20% of the cosmic star formation density over z=1-4. Deriving H2 masses from dust masses, the average SFE is found rather high, with depletion time-scale of 130 Myr. This is to be compared to the compilation by Bauermeister et al. (2013), who observed normal star forming galaxies in the redshift range z=0.05-0.5. They find a depletion time-scale for normal galaxies of 760 Myr, and for starbursts 60 Myr. Their derived molecular gas to stellar mass ratio is plotted in Figure 3, and is compatible with the model-expected behavior.
3 Models and simulations
Semi-analytical models (SAM) have been run, within the standard CDM model, to compute the cosmic evolution of the cold gas content in galaxies. Lagos et al. (2011) show that the best recipe to control the phase transition from atomic to molecular is the pressure model (Blitz & Rosolowsky 2006), rather than the theory-based model from Krumholz et al. (2009) taking into account UV-dissociation of molecules and their reformation on grains. In their best fit model, the H2/HI ratio rises above one at high redshift, as in Obreschkow et al. (2009). Fu et al. (2010, 2012) claim that the Krumholz et al. (2009) recipe is better, but on a limited mass range. Their best fit requires that the depletion time-scale remains 1-2 Gyr at high redshift.
Using a simple phenomenological model, Feldmann (2013) claims that the relation between SFR and H2 content is likely to be linear at all redshift. This assumption provides the best fit to the data, i.e. the cosmic star formation history, the evolution of the mass-metallicity relation, and the gas-to-stellar mass ratio in galaxies. This means that the variation of SFE with redshift might be too little to be sensitive. Models where the SFR relation is non-linear with gas density produce too much stars and metals early on to be compatible with the observations. To obtain the right star formation histories, gas accretion must be limited to a halo mass range between a critical minimum mass Mc(z), below which photoionisation limits the baryon fraction, and an upper limit M2 1012 M⊙, above which the gas is heated by shocks in entering the galaxy (Birnboim & Dekel, 2003). At early epochs, for redshifts higher than 2, the gas accretion time-scale is very short, and the SFR not enough to consume the accreted gas, which accumulates in galaxies. After z=2, the SFR has increased to its maximum; within the halo mass range between Mc and Mshock, the depletion time-scale is comparable to the accretion time-scale, and the SFR is limited by gas accretion (Bouché et al. 2010). In this global model, an equilibrium settles between gas inflow and outflow, and star formation rate, equalling depletion time to accretion time. Stellar masses, metallicity, and cosmic gas evolution are moderated by this equilibrium.
The relation between SFR and stellar mass on the main sequence has been examined in detail from 25 studies in the literature, and the corresponding slope is a decreasing function of cosmic time (Speagle et al. 2014). The star formation histories derived from these are delayed- models, where the SFR is first increasing linearly with time in the first half of the universe age, and then decreasing exponentially.
With a SAM approach Popping et al. (2012, 2014) also tested several recipes for the molecular gas and star formation evolution; either pressure-based, or metallicity-based models represent rather well observations, with some variations for low mass galaxies. To compare with high-z observations, they deduce their gas content from their SFR, through inversion of the Kennicutt-Schmidt (KS) relation, but in this case the best fit is for a density-dependent SFE. Also, the CO-to-H2 conversion factor should be continuous, as a function of the galaxy physical properties.
That the SFE should depend on gas surface density (non-linear KS relation) is certainly a solution to explain why SFE varies with redshift. Galaxies were more compact at high z (Newman et al. 2012, Morishita et al. 2014), so not only their surface density was higher for a given gas content, but also their dynamical time was shorter, which favors the dynamical triggers. Another feature is the volumic density dependency, which could play a role, even for a linear KS relation. It has already been observed that SFE is declining with radius in galaxy disks at z=0, possibly due to gas disk flaring (Bigiel et al. 2010, Dessauges-Zavadsky et al. 2014).
There are still large uncertainties on key factors to determine the cosmic evolution of cold gas content in galaxies: not only the SFR laws as a function of density, the phase transition between atomic and molecular gas, but also the star formation efficiency, regulated by feedback mechanisms due to supernovae or AGN, the quenching due to environment, slowing down the gas accretion. We are just at the beginning of the ALMA era, and our knowledge on these physical processes will progress exponentially.
Acknowledgements.
My great thanks to the organisers, David Block, Ken Freeman and Bruce Elmegreen for this wonderful meeting with wide scientific interests. The European Research Council is gratefully acknowledged for the Advanced Grant Program Num 267399-Momentum.References
Bauermeister A., Blitz L., Bolatto A., et al. 2013, ApJ, 768, 132
Bigiel, F., Leroy, A., Walter, F., et al. 2010, AJ, 140, 1194
Birnboim Y., Dekel A.: 2003 MNRAS 345, 349
Blitz L., Rosolowsky E.: 2006, ApJ 650, 933
Bouché N., Dekel A., Genzel R. et al. 2010, ApJ 718, 1001
Bouwens, R. J., Illingworth, G. D., Oesch, P. A. et al. : 2011 ApJ 737, 90
Combes F., García-Burillo S., Braine J. et al. 2011, A&A, 528, A124
Combes F., García-Burillo S., Braine J. et al. 2013, A&A, 550, A41
Combes F., 2014, Arkansas conf. , arXiv:1309.1603
Daddi E., Dannerbauer, H., Elbaz, D. et al. 2008, ApJ 673, L21
Daddi E., Sargent M. T., Béthermin M., Magdis G., 2013, IAUS, 295, 64
Dannerbauer, H., Daddi, E., Riechers, D. A. et al. 2009, ApJ 698, L178
Decarli, R., Walter, F., Carilli, C. et al. 2014 ApJ 782, 78
Dessauges-Zavadsky M., Verdugo C., Combes F., Pfenniger D.: 2014, A&A in press
Di Matteo, P., Combes, F., Melchior A-L., Semelin, B.: 2007, A&A 468, 61
Feldmann R. 2013, MNRAS 433, 1910
Freundlich J., Combes F., Tacconi L. et al. 2013, A&A 553, A130
Fu, J., Guo, Q., Kauffmann, G., Krumholz, M. R. 2010, MNRAS 409, 515
Fu, J., Kauffmann, G., Li, C., Guo, Q. 2012, MNRAS 424, 2701
Fukugita M., Hogan C. J., Peebles P. J. E., 1998, ApJ, 503, 518
Genzel, R., Tacconi, L. J., Kurk J. et al. 2013, ApJ 773, 68
Greve. T. R., Bertoldi, F., Smail, I. et al. 2005, MNRAS, 359, 1165
Hopkins A. M., Beacom J. F.: 2006, ApJ 651, 142
Keres, D., Yun, M. S., Young, J. S. 2003, ApJ, 582, 659
Krumholz M. R., McKee C. F., Tumlinson J.: 2009 ApJ 699, 850
Lagos C. d P., Baugh C. M., Lacey C. G. et al. 2011, MNRAS 418, 1649
Mannucci, F., Cresci, G., Maiolino, R. et al. 2010, MNRAS 408, 2115
Montuori M., Di Matteo, P., Lehnert, M. D., Combes, F., Semelin, B.: 2010, A&A 518, A56
Morishita T., Ichikawa, T., Kajisawa, M.: 2014, ApJ 785, 18
Newman A. B., Ellis, R. S., Bundy, K., Treu, T. : 2012, ApJ 746, 162
Obreschkow D., Croton D., de Lucia G. et al. 2009, ApJ 698, 1467
Obreschkow D., Rawlings S.: 2009, ApJ 696, L129
Popping G., Caputi K. I., Somerville R. S., Trager S. C., 2012, MNRAS, 425, 2386
Popping G., Somerville R. S., Trager S. C., 2014, arXiv:1308.6764
Rodighiero, G., Daddi, E., Baronchelli, I. et al. 2011, ApJ 739, L40
Saintonge, A., Kauffmann, G., Kramer, C. et al. 2011, MNRAS 415, 32
Sargent, M. T., Daddi, E., Bethermin, M et al. : 2014, ApJ in press, arXiv1303.4392
Sauty S., Casoli, F., Boselli, A. et al. 2003, A&A, 411, 381
Solomon P., Downes D., Radford S., Barrett J.: 1997, ApJ 478, 144
Solomon, P. M., Vanden Bout, P. A.: 2005, ARA&A 43, 677
Speagle J. S., Steinhardt C. L., Capak P. L., Silverman J. D: 2014, ApJ sub arXiv1405.2041
Swinbank A. M., Simpson J. M., Smail I., et al. 2014, MNRAS, 438, 1267
Tacconi L. J., Genzel R., Neri R. et al. 2010 Nature 463, 781
Tacconi L. J., Neri R., Genzel R. et al. 2013, ApJ 768, 74
Walter F., Decarli R., Sargent M. et al. 2014, ApJ, 782, 79
Wuyts, S., Förster Schreiber, N. M., van der Wel, A. et al. 2011, ApJ 742, 96
Young, J. S., Xie, S., Tacconi, L. et al. 1995, ApJS 98, 219
Zwaan, M. A., Meyer, M. J., Staveley-Smith, L., Webster, R. L.: 2005, MNRAS 359, L30