X-ray spectral and timing behavior of Scorpius X-1. Spectral hardening during the flaring branch
Abstract
We present an analysis of the spectral and timing properties of X-ray emission from the Z-source Sco X-1 during its evolution between the Horizontal (HB) and Flaring (FB) branches observed with the Rossi X-ray Timing Explorer during the 1996 – 2002 period. We find that the broad-band (3 – 250 keV) energy spectra during all spectral states can be adequately reproduced by a model, consisting of two Comptonized components and an iron-line. We suggest that the seed photons of 0.7 keV coming from the disk and of temperature 1.8 keV coming from the neutron star (NS) are each upscattered by hot electrons of a “Compton cloud” (herein Comptb1 and Comptb2 components respectively with which are associated similarly subscripted parameters). The photon power-law index is almost constant () for all spectral states. In turn, demonstrates a two-phase behavior with the spectral state: is quasi-constant at the level for the HBNB and is less than 2, namely in the range of , when source traces the FB. We also detect a decrease from 1.8 keV to 0.7 keV during the FB. We interpret this apparent quasi-stability of the indices during the HBNB in the framework of the model in which the spectrum is determined by the Comptonized thermal components. This established for the Comptonized spectral components of the Z-source Sco X-1 is similar to that was previously found in the atoll sources 4U 1728-34, GX 3+1 and 4U 1820-30 and the Z-source GX 340+0 through all spectral states. However we interpret the index reduction phase detected during the FB in Sco X-1 within the framework of a model in which the spectrum at the FB is determined by high radiation pressure from the NS surface.
1 Introduction
The neutron stars (NSs) in X-ray binaries offer a unique opportunity to study the properties of matter under the most extreme conditions. These sources show a variety of observational manifestations which can be used to verify different theoretical models. The Z sources being related to NSs in X-ray binaries radiating close to the Eddington limit (), sometimes show properties similar to black holes (BHs). For example, the Z source Scorpius X-1, hereafter Sco X-1, exhibits a strong hard tail in its X-ray spectrum which for a long time was considered to be a unique BH signature (Rothschild et al., 1980).
Sco X-l and other Z sources GX 349+2, GX 340+0, GX 17+2, GX 5-1 and Cyg X-2 form a group with a similar behavior for three spectral branches (Hasinger & van der Klis 1989). However there are differences in the detailed observational behavior of these Z sources. As Sco X-l and GX 17+2 and GX 349+2 show strong flares in the intensity during the flaring branches (FB), while GX 340+0, Cyg X-2 and GX 5-1 undergo dips in the FB (Hasinger & van der Klis 1989, Penninx et al. 1991, Kuulkers et al. 1994). It is worth noting that the normal branch (NB) properties are similar for these two groups of Z sources, but horizontal branch (HB) and FB properties are fundamentally different.
These distinct observational appearances between these two groups are not fully understood. An interesting suggestion has been made by Lin et al. (2009), hereafter LRH09, and Homan et al. (2010) based on observations of the transient NS source XTE J1701-462. They found that this source showed characteristic features of a Z source, and then an atoll source when the luminosity decreased. They claimed that the initial Cyg-like behavior was followed by Sco-like one when the luminosity decreased and then they concluded Cyg and Sco types depended on the luminosity.
Sco X-1 is the brightest persistent X-ray source in the sky and the first identified as a X-ray extrasolar source (Giacconi et al. 1962). It is located at a distance of 2.80.3 kpc (Bradshaw et al. 1999) and its binary orbit has a low inclination angle to the Earth observer and thus is suitable for a study of the flaring events in Z-sources. This binary system consists of an old, weakly magnetized neutron star with a mass 1.4 in which accreting matter is transferred through Roche lobe overflow from a low-mass companion (recently identified as a M-class star of 0.4 M⊙, see details in Steeghs & Casares 2002). Sco X-1 is a prototype of the class of low-mass X-ray binaries (LMXBs), which emit close to the Eddington limit for a 1.4 M⊙ NS ( ergs s-1).
Sco X-1, similar to other Z sources, shows quasi-periodic oscillations (QPOs) along all the branches of its color-color diagram (CCD). Extensive timing analysis of Sco X-1 with EXOSAT indicate that the QPO phenomenon is closely related to the transition of Sco X-1 between different spectral states [e.g., van der Klis et al., 1987a,b; Middleditch & Priedhorsky, 1986; Priedhorsky et al. 1986; Hasinger et al. 1989, hereafter HPM89, and Hertz et al., 1992). In particular, the transition between the HB NB and the FB states is characterized by variations in QPO frequency between 6 Hz and 16 Hz (with no intensity correlation). When Sco X-1 enters into the prolongated NB state the QPO frequency settles at 6 – 8 Hz range (anti-correlated with intensity). Low frequency noise (LFN) component of the power spectrum becomes stronger when the source intensity increases at the FB and at the same time the QPOs disappear. In turn, Dieters & van der Klis (2000) using EXOSAT, deteregard cted, an abrupt increase of the QPO frequency from 6 Hz to 10 Hz, a so called rapid excursions near soft apex in hardness-intensity diagram (HID) along with grand transitions from 8 Hz to 21 Hz when the object went from the lower FB to the upper FB.
Based on the RXTE observations van der Klis et al. (1996) reported the discovery of 45 Hz QPOs, mostly prominent in the middle of the NB. Casella et al. (2006) detected a monotonic (smooth) increase of the QPO centroid frequency from 4.5 – 7 Hz (at the NB) to 6 – 25 Hz (at the FB), which can indicate to the same nature of these low frequency QPOs. The power spectrum of Sco X-1 also includes a pair of QPOs, which frequencies are in the range 800 – 1100 Hz, the so called kHz QPOs. The peak frequency separation is weakly frequency-dependent (Zhang et al. 2006).
The physical interpretation of these timing features is not unique, and the related scientific debate is still open. Apart from detailed knowledge of timing properties of Sco X-1, the spectral studies have been not so extensive. This is mostly caused by the brightness of Sco X-1 that prevents this source from direct observation with the high resolution X-ray satellites, e.g., Chandra and XMM-Newton. However, a significant progress was achieved in this regard due to the detailed investigations of broad-band spectra of Sco X-1 based on RXTE observations by D’Amico et al. (2001), Barnard et al. (2003), Bradshaw et al. (2003), D’Ai et al. (2007) and Church et al. (2012). These authors demonstrated that X-ray spectrum of Sco X-1 is well fit by a two-component model consisting of a thermal component, related to the NS, and a Comptonized component, associated with an extended accretion disk corona. In addition, a broad emission line with a Gaussian profile is applied to this model in all spectral states. However, the results of this analysis and their interpretation depend on the energy band considered and the adopted spectral model for the thermal and Comptonized components.
In particular, D’Amico et al. (2001) studied only the high energy band above 20 keV using High Energy X-Ray Timing Experiment (HEXTE) data and tried to find a correlation between the X-ray hard tail emission in the spectra of Sco X-1 with the position of the source along Z-track. However, they did not find any apparent correlation using a bremsstrahlung component and a simple - component in their spectral model. Furthermore, D’Amico et al. (2001) claimed a non-thermal origin of the hard tail. In turn, Bradshaw et al. (2003) used only the Proportional Counter Array (PCA) data in the moderate energy range 3 – 18 keV, applying a model consisted of a blackbody emission and a Comptonization component [BMC, Shrader & Titarchuk (1998)]. They studied an evolution of X-ray spectrum of Sco X-1 as a function of accretion rate and, in particular, detected an increase of the absorption at low energies a factor of 2 when the object moved from the HB to NB/FB vertex. Barnard et al. (2003) used the data from the PCA and HEXTE, applying a blackbody component and a cutoff power law to the data in the energy range 2.5 – 50 keV. In the framework of this model, the so-called Birmingham model [Church & Bal̀uciǹska-Church (2001)] they studied an evolution of the blackbody emission (from the NS) and Comptonized emission (from an extended accretion disk corona) between different spectral states. Church et al. (2012) also used data from PCA and HEXTE, showing that the spectrum, in the energy range 2 – 50 keV, can be approximated by a soft component plus a cutoff power law and a broad line. As a result, they revealed the apparent non-monotonic behavior of mass accretion rate in Sco X-1 along Z-track. They also argued that the mass accretion rate increase is a function of the neutron star temperature. D’Ai et al. (2007) also analyzed the mass accretion rate variations studying energy spectra from selected regions in the Z-track of the CD. They demonstrated that X-ray spectra of Sco X-1 based on PCA & HEXTE observations can be adequately fitted by a three-component model, consisting of a soft thermal component (), a thermal Comptonization component (//) and a power-law component (pegpwrlw).
Revnivtsev & Gilfanov (2006) also studied the contribution of the boundary layer in the emergent X-ray spectrum of NS LMXBs as a function of the Z-track position. They fitted the spectra of various NS sources using two Comptonization () components, one is related to the NS emission and another to the transition layer. Gilfanov & Revnvitev (2005) also argued that the boundary layer is the source of rapid variability based on Fourier-Revolved spectral component analysis.
In this Paper we present the analysis of the RXTE observations during 1996 – 2002 for Sco X-1. In §2 we present the list of observations used in our data analysis. In §3 we provide results of our X-ray spectral analysis and in §4 we interpret the observed X-ray spectral properties using the transition layer model. We make our final conclusions in §5.
2 Data Reduction and Analysis
We have used publicly available RXTE data from Sco X-1 obtained from May 1996 to May 2002. In total, these data are derived from 60 observations taken at distinct spectral states of the source. Standard tasks of the LHEASOFT/FTOOLS 5.3 software package were utilized for data processing. For spectral analysis we used PCA Standard 2 mode data, collected in the 3 – 23 keV energy range, using the most recent release of PCA response calibration (ftool pcarmf v11.7). The standard dead time correction procedure has been applied to the data. We also used data from the HEXTE detectors to construct the background-subtracted broad-band spectra. Only data in the 19 – 250 keV energy range were used for the spectral analysis in order to account for the uncertainties of the HEXTE response and background determination. The data are available through the GSFC public archive (http://heasarc.gsfc.nasa.gov). In Table 1 we list the groups of observations covering complete range of the source evolution during different spectral state events.
We have thus made an analysis of RXTE observations of Sco X-1 spanning seven years for six intervals indicated in Table 1. To model the spectral evolution of the source we made spectra on an appropriate timescale. This timescale should be short enough to describe a spectral evolution, but be long enough to provide a realible statistics. We selected regions in the color-color diagrams (CCDs) (see Figs. 1 and 2) for each observational data set and create the CCD-selected spectra. For our analysis we use version 6.0 of the FTOOLS package and version 12.1 of XSPEC. A systematic error of 0.5% have been applied to all analyzed spectra to account for the absolute calibration uncertainties. We have also used data from the All-Sky Monitor (ASM) on-board RXTE to construct a long baseline 3 – 10 keV light curve bracketing the PCA and HEXTE observations.
ASM (2 – 12 keV) light curve of Sco X-1 demonstrates irregular flaring activity with the intervals of more frequent flares as well as the intervals of reducing flaring. Thorough analysis of the flares detected in such a manner shows that the spacing of adjacent flares varies between 0.3 and 2.5 days in most cases. Less frequently flares have much larger gaps about 10 days. Because of this we have chosen the observational sets consisting flaring patterns for our detailed analysis of Sco X-1.
3 Results
3.1 Color-color and hardness-intensity diagrams of Sco X-1
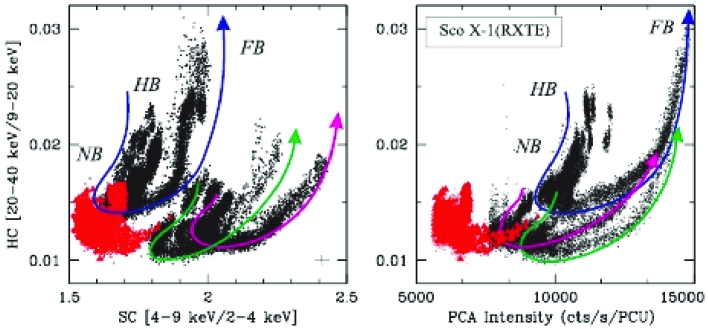
We investigate the light curves with 16s time binning for four energy channel ranges 5 – 10, 11 – 24, 25 – 54 and 55 – 107. These energy ranges correspond to energies 1.94 – 4.05 keV, 4.05 – 9.03 keV, 9.03 – 20.3 keV, and 20.3 – 39.99 keV, respectively. We constructed CCDs of the source using the energy-dependent light curves and defined the soft color (SC) as a ratio of count rates in the 4.05 – 9.03 keV and 1.94 – 4.05 keV energy bands, while the hard color (HC) is defined as a ratio of count rates in the 20.3 – 39.99 keV and 9.03 – 20.3 keV energy ranges. Note that above channel-to-energy conversion is given for epoch 3, which is presented for most of our data ( – ; see Table 1). For the data set the energy ranges are slightly shifted taking into account the change of the instrumental epoch of the satellite (epoch 5), which lead to a little shift on the HC and on the SC axes.
The obtained CCDs and HIDs hardness intensity diagrams are shown in Fig. 1 for available RXTE data of Sco X-1 using bin size 16 s. They present a family of tracks, which are characterized by a clear -like shape. The left part of -like track is related to the horizontal (HB) and normal (NB) branches, while the right part of this -like track corresponds to the flaring branch (FB). The sharp minimum of such a -like track is the so called soft apex (or NB/FB vertex), where the luminosity of Sco X-1 notably decreases. The typical error bars for the colors are shown in the bottom right corner of left panel; errors in the intensity are negligible.
As one can see from this Figure the CCDs and HIDs provide a family of Z-cycles for all data sets (see Table 1). It is worth noting that these particular sets partly overlap each other. The sets with strong flaring activity are pointed out by black points, while the sets with reduced flaring activity are highlighted by red points. The “reduced flaring activity” set shows underdeveloped Z-cycle. Three typical tracks with directions of HBNBFB transitions for strong flaring activity sets are indicated by corresponding bended arrows. The shifted Z-tracks in CCD and HID can be seen as a NB/FB vertex shift. The evolution of the NB/FB vertex position in Sco X-1 cannot be described as one-to-one correspondence with X-ray luminosity as in the case of XTE J1701-462, when the position of NB/FB vertex (at Sco-like stage) moves with X-ray luminosity with a decrease of SC and HC (see Fig.5 of LRH09). In order to understand the X-ray evolution of Sco X-1 one needs to investigate the Z-track behavoir using spectral (§. 3.3) and timing analysis (§ 3.6) together.
3.2 Evolution of spectral hardness throughout all Z-branches of Sco X-1
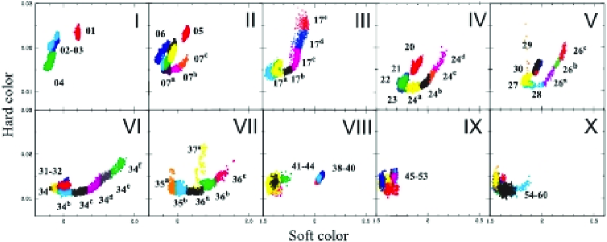
Evolution sequences along the CCD and HID tracks of Sco X-1 are presented in Figs. 2 and 3 in ten panels for corresponding subgroups of successive observational intervals. In particular, in Fig. 2 we indicate selected regions using different colors which are related to the CCD-resolved spectra. We label the spectra through a progressive numbering (according to Table 2, first column).
As seen from Fig. 2, the CCD tracks are extended, in particular, related to the FB (see II – VII panels). It is worth noting that the source moves back and force along Z-track for these particular observations. We select regions in the CCDs for each observational data set, marked with superscripts, e.g. “a”, “b” etc. In contrast, relative compact areas are seen in I, VIII, IX, X panels. During these observations the source evolves around a short Z-track segment and thus one can conclude that the spectral variability is small for these observational segments. Using these selection criteria we eleborated the time intervals, which we applied to extract the relevant spectra for the PCA and HEXTE data sets.
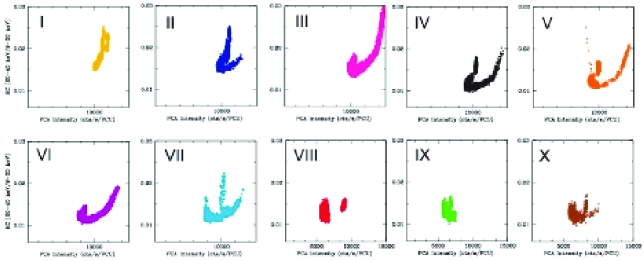
The Z-shape evolution and its shift can be clearly seen in Fig. 3. The evolution of the HID tracks as a function of the count rate in (9 – 20 keV) energy band is characterized by a significant HC variability (0.01HC0.03). One can see a well-developed FB for high intensities (I – VII groups), while a moderate HC variability (0.01HC0.016) is observed for relatively lower intensities (VIII – X groups).
Note that the FB in Sco X-1 is associated with a monotonic increase of the HC with respect to the total intensity from the bottom of the flaring branch to the top (botFB and topFB respectively). This behavior of the HID is in contrast to that in the dipping Z-source GX 340+0, which shows only a slight increase and sometimes even a decrease of the HC with the total flux during the entire FB [see Hasinger & van der Klis (1989); Kuulkers & van der Klis (1996) and Seifina et al. (2013), hereafter STF13].
It is also very interesting to compare our study of CCD and HID for Sco X-1 with those obtained by LRH09 for XTE J1701-462. Whereas the energy bands used for CCD and HID are different in LRH09 and our investigations for Sco-like Z-tracks their evolutions demonstrates changes of the track shape and its positions are similar. In particular, LRH09 found that the position of NB/FB vertex of Z-track for XTE J1701-462 is shifted approximately along inclined line with positive and negative inclinations for CCD and HID, respectively. (e.g., see panels II and III of Fig. 5 in LRH09). The shapes of Z-track for XTE J1701-462 evolves (in CCD and HID) while its -shape morphology remains, having clear elements of the HB, NB and FB and well-determined NB/FB vertex. In contrast, the HC of NB/FB vertex in Sco X-1 changes with X-ray intensity (compare and line tracks in Fig. 1) as that in XTE J1701-462, but then the HC increases with the intensity.
3.3 Spectral Analysis
Z-sources vary on timescales of minutes to hours. This is a subject of many previous investigations of Sco X-1 (see, for example, van der Klis et al., 1996; Bradshaw et al., 2003; Barnard et al., 2003; Belloni et al., 2004). Here we concentrate on specific properties of Sco X-1 related to the hard X-ray emission. The source + background spectra have been compared with the background spectra for both the PCA and HEXTE in order to estimate the significance of the hard tail detection and to obtain the high energy component of the spectrum as best as possible. In addition, we excluded the intervals, which do not provide significant signal for high energy range (30 keV).
As the first trial, we tested a model that consisted of an absorbed thermal component , a thermal Comptonization component Comptb (Farinelli et al. 2008) and a Gaussian line component. But this model [)] gave a poor description of about 60% of the data, in particular, of the FB spectra. Significant negative residuals at low energies (less than 4 keV) and greater than 30 keV suggest a presence of additional emission components. Because of this reason and following suggestions by Farinelli et al. we also attempted a two-Comptb model . As a result of these efforts we have found satisfactory fits for all available sets of the data (during all spectral states).
The Comptb model describes an emergent spectrum as a convolution of an input or seed black body spectrum having the normalization and the seed photon temperature with a Comptonization Green function. Similar to the ordinary Bbody XSPEC model, the normalization is a ratio of the source luminosity to square of the distance
| (1) |
It is worthwhile to emphasize that the Comptb model is an updated version of the COMPTT model of XPEC (see Titarchuk 1994) but with only difference that the main parameters in the former model are the seed photon temperature , the electron temperature , the spectral index and parameter related to the illumination fraction of the Compton cloud by soft (seed) photons .
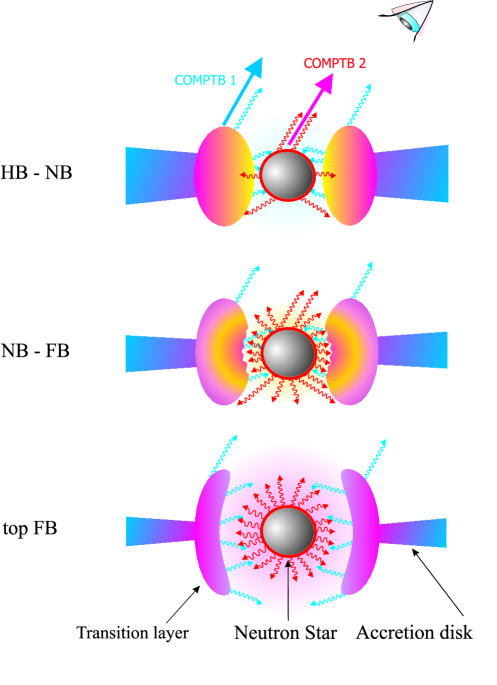
This model describes a scenario in which a Keplerian disk is connected to the NS through the transition layer (TL) [see the description of this scenario in Titarchuk et al. (1998)]. In Figure 4 we illustrate our spectral model in application to Sco X-1. We assume that accretion into the NS takes place when the material passes through the two main regions: a geometrically thin accretion disk [for example, standard Shakura-Sunyaev disk, see Shakura & Sunyaev (1973)] and the TL, where the NS surface and soft disk photons are upscattered off hot electrons. In our picture the emergent thermal Comptonization spectrum is formed in the TL, where disk photons of temperature and soft photons from the NS photosphere of temperature are scattered off the TL hot electrons giving rise to two Comptonized components, herein Comptb1 and Comptb2, respectively. Red and blue photon trajectories, shown in Fig. 4, correspond to the soft (seed) and hard (upscattered) photons, respectively.
In the framework of the applied model , the free parameters of the model are: , ; , ; , which are related to the Comptonized fractions , ; and ; the normalizations of the BB components and of the and respectively. We also add to our model a Gaussian component, whose parameters are a centroid energy , the width of emission line and normalization .
It should be noted that we fixed certain parameters of the models: , which are related to the index of the low energy part of the spectrum, namely , and because we neglect an efficiency of the bulk inflow effect vs the thermal Comptonization for NS accretion. The bulk inflow Comptonization should take place very close to NS surface. However if the radiation pressure in that vicinity is sufficiently high then the bulk motion is suppressed. On the other hand if mass accretion is quite low then the effect of the bulk motion is negligible. Generally, the bulk effect in NSs is a rare event. We also use a fixed value of hydrogen column cm-2, which was found by Christian & Swank (1997). We also fixed the value of the parameter to 2 when the best-fit values of because in any case of a Comptonization fraction approaches unity and further variations of do not improve fit quality any more.
Note that in a case of the two-Comptb model, we deal with two seed-photon temperatures, in which a low value of the temperature cannot be determined, because the PCA low-energy threshold ( 3 keV) is above the peak of the disk seed-photon blackbody which temperature, typically 0.7 keV in LMXBs, [see Barret 2001, Seifina & Titarchuk (2011), Seifina & Titarchuk (2012), Seifina, Titarchuk & Frontera (2013)]. The results of these fits to the - model are reported in Table 2.
Generally, the adopted spectral model for Sco X-1 exhibits a fidelity throughout all the data sets used in our analysis. Namely, a value of reduced , where is a number of degree of freedom, is less than or about 1.0 for most observations. For a small fraction (less than 2%) of spectra with high counting statistics reaches 1.4. However, it never exceeds a rejection limit of 1.5 (for 90% confidence level). Note that the energy range for the cases, in which we obtain the poor fit statistics (one among 98 CCD-resolved spectra with =1.46 for 87 d.o.f), are related to the iron line region. The line width does not vary much and previous measurements suggest that it is in the range of 0.7 – 0.8 keV. Therefore, we fixed of component at a value of 0.8 keV. In this approach we detected only a moderate contribution of the component into the spectrum throught all Z spectral states except for some ones at NB/FB vertex region. It is worth noting that LRH09 also detected a weak iron line emission line in the spectrum of XTE J1701-462 during all Z-states with some increase at the lower part of the NB.
3.4 Spectral properties as a function of Z-track stage
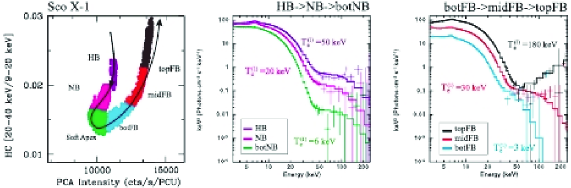
In Figure 5, on the left panel we present the HID where the branches are traced out by arrows as HBNBbottomFB (on the left part) and then from the bottomFB to the topFB (on the right part). Here we also point out different regions of Z-track in HID by different colors. In the central and right panels we show six representative spectral diagrams for the and parts of -shaped Z track respectively. In the central panel the spectra correspond to RXTE observations 20053-01-01-03 (green, botNB) 20053-01-01-06b (pink, NB, see Table 2) and 20053-01-01-00 (violet, HB). On the right panel we present three other spectral diagrams for the right part of Z track from (botFBtopFB). The corresponding data are taken from RXTE observations 20053-01-01-02e (bright blue, Table 2), botFB), 20053-01-02-01a (red, midFB, Table 2) and 20053-01-02-04 (black, topFB). The corresponding data are taken from RXTE observations 20053-01-01-02e (, botFB, Table 2), 20053-01-02-01a (red, midFB, Table 2) and 20053-01-02-04a-b (black, topFB, Table 2). Using this Figure one can see changes of the spectral shape for the HB, NB and FB spectral branches. In particular, the hard tail gradually decreases when the source moves from the HB through the NB to the botNB. However, the hard emission becomes stronger when the source evolves from the botNB to the topFB (see the left and right panels of Fig. 5).
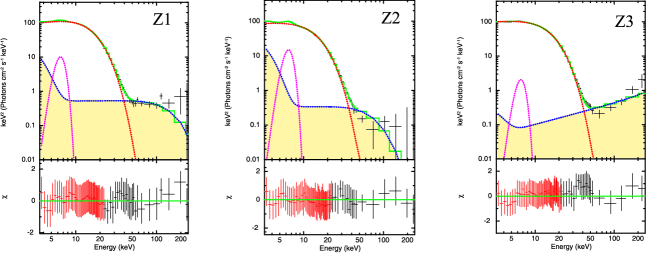
In Figure 6 we also show three representative spectral diagrams for different states along the Z-track. For these spectra data are taken from RXTE observations 20053-01-01-00 (HB) 20053-01-01-06b (NB, Table 2) and 20053-01-01-02e (FB, Table 2). The data are shown by black points and the spectral model components are displayed by blue, red and purple lines for , , and respectively. Yellow shaded areas demonstrate an evolution of between the HB, NB and FB branches when monotonically increases from 3 keV to 180 keV. In this Figure one can clearly see changes of spectral shape in the energy range greater than 30 keV and the relative contribution of Comptonized components for different Z-branches. In particular, the NB panel demonstrates the relative softening of the component in comparison of that presented in the HB panel. While the FB panel shows the hardening of Comptb1 component in comparison of that seen in the HB-NB panels. We also detect a relative growth of the Gaussian iron line emission at the bottom of the NB (as one can see from panel of Fig. 6).
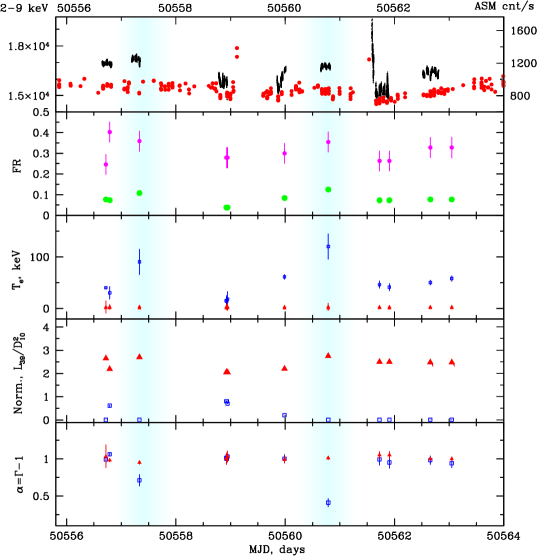
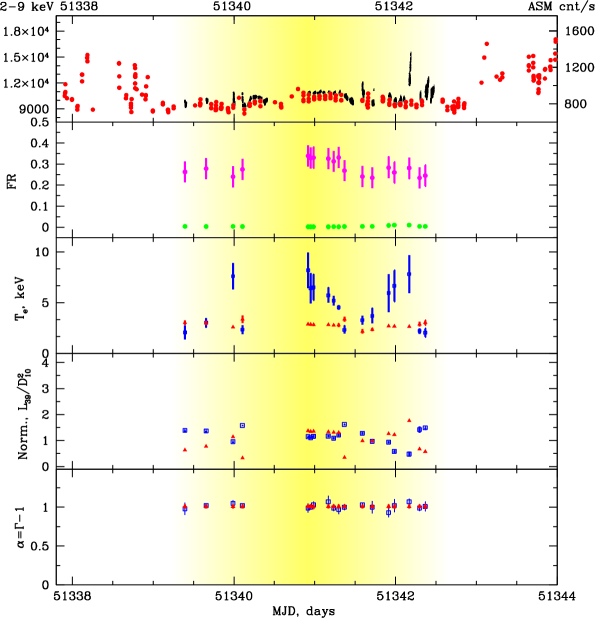
Spectral changes are also seen in Figs. 7 and 8, which show strong and reduced flaring activity sets as a function of time. In particular, the electron temperature ( points) ranges between 20 keV and 50 keV during the HB and NB states (see MJD 50556, 50561 – 50562) and then it decreases to 5 keV at the apex (see MJD 50559 in Fig. 7 and MJD 51341 in Fig. 8). reaches its maximum at 200 keV during the FB (see MJD 50557, 50560 marked with blue vertical strips in Fig. 7). On the other hand, the normalizations and are only weakly correlated with the variations of flux ratio coefficient FR and count rate in the 2 – 9 keV energy band ( points), which is presumably related to the NS emission that dominates during all spectral states (see Fig. 7). The normalization is low variable from 0.4 to 3 in units of (where is the luminosity of the seed blackbody component in units erg s-1 and is distance in units 10 kpc). The X-ray contribution from the Comptonizaton of the seed photons coming from the disk is weaker by factor 2 than that related to the seed photons coming from the NS surface, during all spectral states (Fig. 7). It is worth noting that the energy spectral indices shown in the bottom panels of Figures 7 – 8 only slightly vary with time about a mean value of one except for index at the FB intervals (marked by vertical strips in Fig. 7). At that time the index significantly decreases down to 0.3 [see MJD 50557, 50560 in Fig. 7]. These changes are also seen in Fig. 9 along the total Z-cycle of Sco X-1.
We can compare our spectral results on Sco X-1 with the spectral evolution of XTE J1701-462. In particular, LRH09 used a spectral model which was consist of BB, MCD (multicolor disk), and a CBPL (Comptonized broken power law) components to fit the spectrum of XTE J1701-462. In this model they found that the spectrum of XTE J1701-462 on the HB of Z-stage shows a hard tail (see Fig. 13 in LRH09) which can be explained by Comptonization of the soft photons originated in the innermost disk region. We obtain a similar result for the Sco X-1 case. Namely, using our Comptonization component (), indicated by the yellow shaded area in Fig. 6 (left panel), we reveal a hard emission in the HB stage. Furthermore, LRH09 found that the spectra of XTE J1701-462 corresponding to the HB/NB vertex, NB and NB/FB vertex did not have the Comptonized component (in their terms, CBPL component). In Sco X-1 we detect the Comptonized component () at the NB but it is rather weak (see the central panel of Fig. 6). In the FB the spectrum of XTE J1701-462 was mainly characterized by BB+MCD components and with some indication to a weak hard emission (see Fig. 13 in LRH09). In contrast to LRH09, we detect the strong Comptonized component () at the FB of Sco X-1 spectrum up to 250 keV (see the right panel of Fig. 6). Furthermore, the photon index of is surprisingly decreased during the FB, which is an indication of the hardening of X-ray emission in Sco X-1. It is interesting to note that another Z-source GX 340+0 does not show a significant Comptonized component at the FB state (see STF13). Such a difference can be related to different distances to these sources ( kpc, kpc, kpc). Thus the proximity of Sco X-1 to the Earth provides us a unique opportunity to study the FB stage for Z-sources.
3.5 Z-state evolution of X-ray spectral parameters in Sco X-1 as a function of the electron temperature
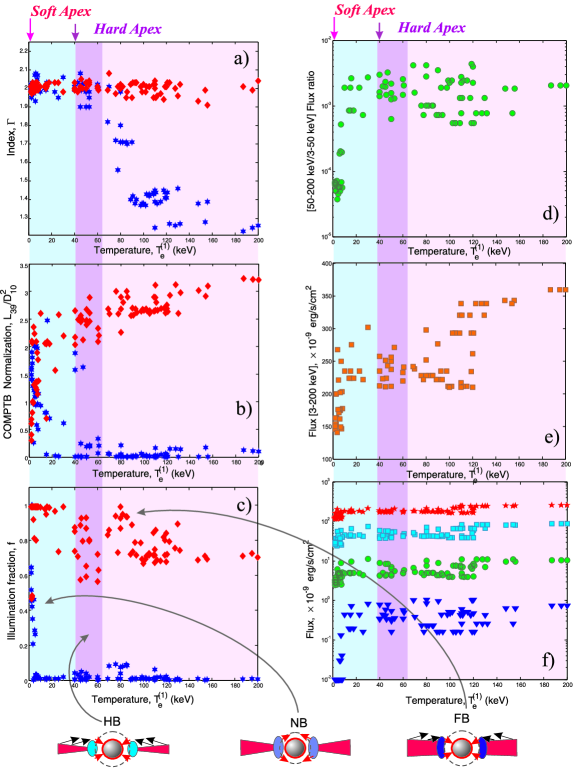
In Figure 9 we present the dependencies of the photon index , of the normalization , of the illumination fraction , of the flux ratio and of the X-ray flux on the electron temperature . Here we mark the HB and NB states by a and vertical strips, respectively. In addition, the and apexes are indicated by arrows and a vertical strip highlights the interval of mid-topFB stage where the photon index of the component significantly decreases (from to ). As it is clearly seen from this Figure the FB, NB and HB stages of Z-cycle can be related to a change of (in the framework of our model).
3.5.1 The FB
The FB of the Sco X-1 spectrum is characterized by a wide range of the electron temperature (from 5 to 200 keV). High and low values of the occur at the topFB and near apex respectively (see hardness-intensity diagram on the left part of Fig. 5). The photon index shows a specific behavior during the FB. In Fig. 9 (see panel , points) one can see that decreases from 2 to 1.3 when the total X-ray flux increases (see panel ). In contrast, the Comptonized component of X-ray spectrum (Com 2) shows that only slightly varies around 2 (see red points in panel ). When the object goes into the midFB [see vertical strip in panel of Fig. 9] the COMPTB normalization drops by a factor of 4 – 5, reaching the lowest level (, panel , points). On the other hand monotonically increases and exceeds (see panel , points). At this stage we find that and of the Comptonized component drop. In the FB the illumination fractions of both components and are quite different. While values of are low (, points), those of is high (, points of panel ). The mid-topFB spectra are characterized by a high hardness ratio (see panel ) and high level of the 3 – 250 keV flux ( erg/s/cm2, see panel ). Note also that the source behavior during the FB was evaluated using CCD-resolved and HID intervals, shown in Fig. 2 and 3. Different Z cycles belong to different areas in CCD and HID although the FB spectral properies for them are similar and almost independent of Z cycle change.
3.5.2 The NB/FB vertex
The NB/FB vertex of Z-track for Sco X-1 (indicated as “ apex” in Figure 5) is associated with the lowest value of the electron temperature ( keV). This apex is a boundary between two phases for the photon index behavior, (at the NB-HB) and (at the FB). Panel of Fig. 9 demonstrates that at this apex ( points) and ( points) are both equal to 2. Moreover, the apex (NB/FB vertex) is characterized by sharp changes of the normalizations and the illumination factors for both Comptonized components and as variations of are small (see panels and of Fig. 9). As one can see from this Figure that and anticorrelate with each other when increases. For the Comptonized component Com 1 the normalization decreases from to and decreases from 0.6 t 0.05 when increases from 3 to 40 keV (see panels and respectively). While the normalization of the Comptonized component increases from to a fraction increases and saturates at unity (see panels and respectively). In the NB/FB vertex (soft apex) the spectra of Sco X-1 are characterized by lower values of flux ratio and the 3 – 200 keV flux (see panels and respectively).
3.5.3 The NB
The NB of Z-track for Sco X-1 (indicated by vertical strip in Fig. 9) is associated with a specific range of the electron temperature . When the source transits from HB/NB vertex ( apex) to NB/FB vertex ( apex, see left panel of Fig. 5) monotonically decreases from 40 keV to 5 keV. The photon indices , throughout NB state are around 2 (see and points of panel in Figure 9). The COMPTB normalization parameters () monotonicaly increase by a factor of 5 during the NB (see panel of Fig. 9). The hard Comptonized component (Com 1) is characterized by a significant illumination fraction only in the vicinity of apex, but then throughout the rest of the NB is extremely low. While the illumination fraction related to the second Comptonization component (Com 2) is high () over the NB (see the left bottom panel of Fig. 9). The NB spectra of Sco X-1 are characterized by a variable flux ratio (see panel ) and a wide range of the 3 – 200 keV flux [ erg/s/cm2, panel ]. Note also that in the NB the spectrum is relatively soft (see middle panel of Fig. 6).
3.5.4 The HB
The HB of Z-track, indicated by vertical strip in Fig. 9, is associated with a small range of the electron temperature ( keV). The photon indices , throughout the HB are around 2 ( and points of panel in Figure 9). The COMPTB normalization of component remains at the level of ( points in panel ), while the component is dominant [see points, ]. In the HB the fraction is variable in a wide range (from 0.6 to 1), while the fraction is extremely low (, see panel ). In the HB the spectra are characterized by a high flux ratio (see panel ) and a relatively high 3 – 200 keV flux [ erg/s/cm2, see panel ]. Note also that in this state the spectrum has a hard tail characterized by , in contrast to the FB hard tail, for which is in the range from 1.4 to 2.
Thus, our analysis allows us to separate the contributions of the two zones related to the hard and soft Comptonized components, one is related to the transition layer and another to the NS emission. Furthermore, we detect a significant increase of the in the FB, in contrast to other atoll and Z sources in which the electron temperature usually reduces during events [see e.g. Seifina & Titarchuk (2012), Church et al. (2014)].
3.6 Timing properties of Sco X-1 during NB-HB-FB evolution
The timing properties of Sco X-1 have been extensively studied previously and well documented by many authors [e.g., van der Klis (1994)]. However, given our new and unique approach to model the spectral evolution of Sco X-1 we have chosen to perform a joint spectral-temporal analysis for CCD-selected intervals to search for deeper physical insight. The RXTE light curves have been analyzed using the powspec task from FTOOLS 5.1. The timing analysis RXTE/PCA data was performed in 2 – 13 keV energy range using the binned mode. The time resolution for this mode is 1/128 s. We found that the shape of the power density spectrum (PDS) at high frequencies is dominated by dead-time effects (see also Zhang et al. 1995) which, in the case of Sco X-1 at a count rate 25 000 counts/s/PCU, are large, uncertain and not well understood to predict a real shape of the PDS high-frequency part. Because of this we use PDSs only up to about 100 Hz (see Fig. 10). The normalization parameter of Powspec was set to -2, such that Poisson (white) noise is subtracted and the remaining power integrates to give the excess variance in the lightcurve. To investigate an evolution of the source timing properties and use it for Z-branch identification we modeled the PDSs using analytic models and the minimization technique in the framework of QDP/PLT plotting package111http://heasarc.gsfc.nasa.gov/ftools/others/qdp/qdp.html.
From the lower NB to the FB Sco X-1 shows a monotonic increase of the very low frequency noise below 1 Hz (VLFN). The shape of a high frequency noise (HFN) component can be fit by the exponentially cut-off power law (). The HFN rms amplitude, in contrast to VLFN, decreases along the Z-track (from 7% to 3%).
In addition to the noise continuum we found in the PDSs quasi-periodic oscillations (QPOs) between 5 Hz and 20 Hz, that can be modeled by Lorentzians. In particular, we detected reliable QPOs with centroid frequency near 6 Hz when the source moves along the NB. We also found a continuous increase of QPO frequency from 6 Hz to 15 Hz when the source moves from the NB to the FB. Then, during the FB QPO frequency steeply increases from 10 Hz to 20 Hz and finally disappears at the highest count rates. Note that almost the same timing behavior was detected in another observation with EXOSAT [Predhorsky et al., 1986; Dieters & van der Klis (2000)] and with RXTE [van der Klis et al. (1996), Casella et al. (2006)]. One can relate these QPO frequency changes over the FB and its absence at the of the FB with significant changes of the energy spectra of Sco X-1 (see § 3.7). Hereafter we use these timing signatures along with spectral signatures (§ 3.4) for the additional identification of Z-branch of Sco X-1.
3.7 Correlation between timing and spectral properties during spectral state transitions
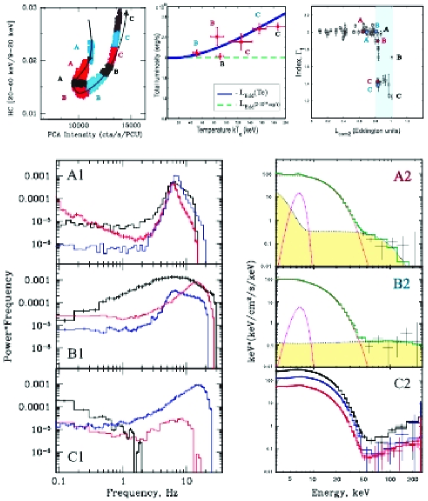
We consider the main properties of the power spectra along with those of the energy spectra. We find a specific behavior of and the low QPO changes during the FB. Namely, we detect a significant change of at the FB from quasi-constancy around that is established for the HB-NB phases. To investigate the timing changes during this index change () we present the results of the FB state analysis for a time interval of MJD=5055650821 ( set). On the top of Fig. 10, ( panel) we show the HID corresponding to this time interval, as // points A, B, and C mark moments at MJD = 50557.2/50556.6/50819.6a, 50818.7a/50817.8/50558.7a and 50816.9c/50817.8b/50820.9e related to different phases of Z-branches. Here supersripts indicate the corresponding CCD-resolved intervals (in accordance to Table 2).
As already mentioned above the hardness intensity diagram (HID) of Sco X-1 consists of two branches of -shaped Z-track. The power and energy spectra of the left branch (HB-NB-Soft apex) are presented at the bottom panels A in Fig. 10, while that of the right branch (soft apex-botFB-midFB-topFB) are shown at two bottom panels B and C. The FB can be divided into three segments: (B , B ), (B , C ) and (C , C ). The FB (lower part) stage is associated with the canonical along the Z-track. As we argue above (see §3.4) we do not find significant differences of the energy spectra between the NB point (A ) and the FB points (B /). While the time variability properties for these points in the HID are very different (for comparison see the bottom left and right panels of Fig. 10).
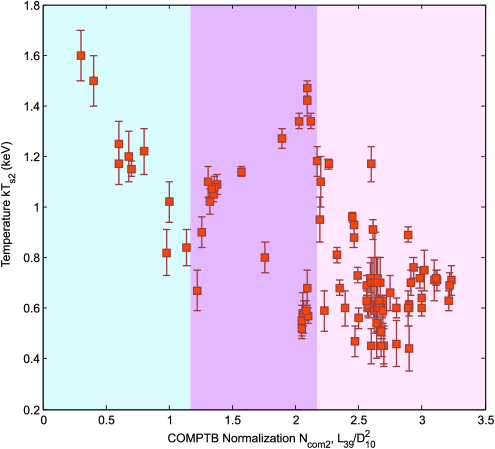
The NS seed photon temperature is about 1.5 keV when Sco X-1 is around the botNB and the botFB (see Fig. 11 for values). On the other hand a significant decrease of from 1.5 to 0.7 keV was detected when the source transits from the soft to hard apex and from the midFB to the topFB states. This significant change of in the FB is a clear indication of the NS photospheric expansion due to high radiation pressure from the NS during this phase.
On the panels of Fig. 10 we show PDS for 3 – 13 keV band ( column), which are presented along with spectra [plotted as ] fitted to our model (right column) for A (), B () and all C points of the HID shown on the left upper panel. The strong and broad the Normal Branch Oscillations (NBOs) are seen at 210 Hz [peaked at 6 Hz, FWHM=11.24.1 Hz, rms=5.31.0% (A ) and FWHM=9.73.5 Hz, rms=4.81.2% (A ), respectively] during the NB state. For the of the FB (B , B , see left upper panel) the related PDS (see left bottom panel B1) shows two QPO peaks at 10 Hz and 7 Hz respectively when the source moves from the bottom FB to the middle FB. On the other hand PDSs of the FB (B , C points in the upper left panel) show broad flaring branch oscillations (FBOs) around 7 Hz (FWHM=12.23.4 Hz, rms=7.51.4%) along with VLFN (5 % rms). As Sco X-1 moves from the to the of the FB we can clearly see an increase of the QPO frequency from 6 Hz to at most 20 Hz (FWHM=10.22.5 Hz, rms=5.31.2% for point C ). The highest QPO frequency measured (21 Hz) was found during a flare in January 1998 data (C point). Finally, on the of the FB (C ) we do not find any QPO feature but only the strengthened VLFN component (3 % rms).
Note that the similar QPO frequency evolution between 8 Hz to 5 Hz when the source goes from the botFB to the midFB was previously detected with EXOSAT by Dieters & van der Klis (2000), however they did not detect any energy spectral changes. In contrast, due to the broad-band RXTE coverage we discover significant changes of energy spectra at high energy range ( keV) along with this excursions.
On the right bottom panels of Fig. 10 we present spectra for 3250 keV energy range (panels A2, B2, C2), related to the corresponding PDSs (see panels A1, B1, C1). The data are shown by black points and the spectral model components are displayed by dashed , and lines for the , and components respectively. Yellow shaded areas demonstrate an evolution of the component during the state transition. In particular, the energy spectra for the groups A and B are very similar, while for group C they show significant changes at high energy band ( keV). For C // points on the left upper panel we present all corresponding energy spectra on the low right panel to demonstrate the spectral evolution for the and Comptonized components. The comparison of the energy spectra in B2 and C2 panels reveals a noticeable decrease of photon index for the group C. Furthermore, one can see that PDS in the C case is completely different of that seen in the B case.
4 Interpretation of the observed spectral properties
Before to proceed with the interpretation of the observations, let us briefly summarize them as follows. (1) The spectral data of Sco X-1 are well fit by two soft and hard Comptonized (Comptb) components for all analyzed HB, NB and FB spectra. (2) The soft Comptonized component is dominant throughout all spectral states (see Table 2, and two normalization panels in Figures 7 and 8). (3) The high energy tail of the spectra X-ray can be fit by the hard Comptonized component.
We find a very unique drop of when Sco X-1 is in the FB and the luminosity of Sco X-1 is close to the critical value . This fact is very surprising with respect to other NS LMXBs [e.g., 4U 1728-34 (ST11), 4U 1820-30 (TSF13), GX 3+1 (ST12), GX 340+0 (STF13)], which all demonstrate the constancy of the index (). However, it is important to note that all these sources, besides Sco X-1, were observed at a sub-critical regime throughout all spectral states, while in Sco X-1 we find the source is at the Eddington regime. To take into account this peculiarity, we explore the situation when the luminosity reaches its critical value, which is applicable to the FB of Sco X-1 case.
4.1 Energy release in the NS transition layer and the spectral index of the emergent spectrum
As Farinelli & Titarchuk (2011), hereafter FT11, pointed out the energy release in the transition layer (TL) determines the spectral index of the emergent spectrum. Namely, FT11 [see also Zel’dovich & Shakura (1969)] demonstrated that the energy flux per unit surface area of the TL (corona) can be found as
| (2) |
where , and are the plasma (electron) temperature, the radiation density distributions in the TL and its Thomson optical depth respectively.
We obtain the energy distribution as a solution of the diffusion equation
| (3) |
where is the speed of light; for and for . If one compares this equation with that similar in FT11 he/she finds that here we assume that the gravitational energy release takes please only in the part of the TL, because the high radiation (plus magnetic) pressure from the NS finally stops the accretion flow. We should also add the two boundary conditions at the inner TL boundary (which can be a surface of NS) and the outer boundary . They are correspondingly:
| (4) |
| (5) |
Using the expression for (see Eq. 3 and below) we find the solution of equations (3-5)
| (6) |
and
| (7) |
Thus integration of gives us
| (8) |
It is easy to see that we obtain the identical result with that in FT11 for . Now we can estimate the Comptonization Y-parameter in the transition layer (TL) using Eqs. (2) and (8). We rewrite Eq. (2) using the mean value theorem as
| (9) |
where is the mean temperature in the TL. Substitution of formula (8) in Eq. (9)
| (10) |
leading to the estimate of Y-parameter in the TL [see a definition of Y-parameter in Rybicki & Lightman (1979)]
| (11) |
Now we use this formula for Y-parameter for the determination of the spectral index . Namely we can write (see FT11)
| (12) |
We rewrite the asymptotic form of this equation when as
| (13) |
Thus one can see that the spectral index when and . In Figure 10 (the upper right panel) we present the observed dependences of the photon spectral index of the Comptonized component () and thus one can see that is indeed significantly less than (or ) when the observed luminosity coming from the TL inner part is around 1 and higher. This leads us to suggest that in this case the gravitational energy release takes place only in the TL outer region where .
Now we show that the critical luminosity , at which the radiation force equals to the gravitational force, higher than Eddington one for the electron temperature keV.
4.2 Temperature correction of scattering cross-section for critical luminosity calculation
In order to explain the observed dependencies of vs and vs (see Fig. 10 central and right upper panels) we have to estimate the critical luminosity for a given plasma characteristic and its presumed spectrum . To do this we should calculate the weighted electron cross section , using relativistic photon-Maxwellian electron cross section Wienke (1985) for the normal chemical abundance
| (14) |
Then the critical luminosity (which is the Eddington luminosity when ) for a given electron temperature one can find using an equality of the gravitational force and the radiation force
| (15) |
We calculate for and then we make a plot vs (see solid line in the central upper panel) and we see that this theoretical dependence passes through all observed data points (, ).
We also show here the level of the Eddington luminosity, assuming that (see a dashed horizontal line in the upper central panel of Fig. 10). It is clear to see from this plot that the critical luminosity is higher than for higher temperature and the electron temperature correction of the scattering cross-section explains an increase of vs .
4.3 Comparison between spectral characteristics of Z-sources and atoll sources
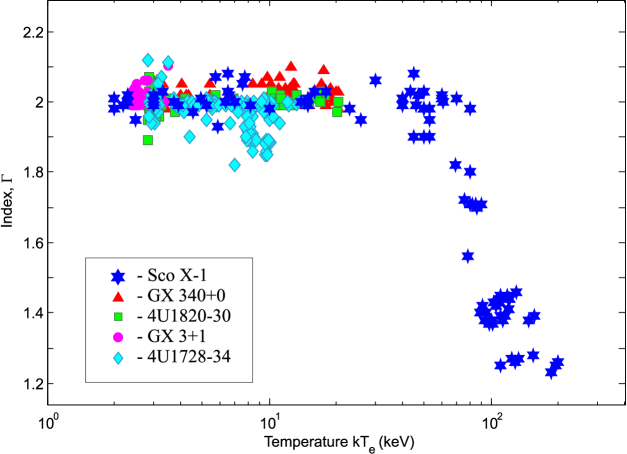
Now we know the correlations between spectral, timing properties for a variable mass accretion rate observed in X-rays in Sco X-1 during the evolution across the HB-NB-FB track. We identify a new kind of the spectral index behavior in this source in relation to other known NS LMXBs. For this reason, it is interesting to compare Sco X-1 with other NSs and find similarities and differences between them. Therefore we present a comparative analysis for five sources: Z-sources Sco X-1, GX 340+0 (STF13) and atoll sources GX 3+1 (ST12), 4U 1820-30 (TSF13), 4U 1728-34 (ST11) using the same spectral model which consists of the Comptonized continuum and the Gaussian line components. It is also interesting to compare our findings on Sco X-1 with spectral behavior of the unique NS source XTE J1701-462 since both objects show spectral transitions in the super Eddington luminosity regime.
4.3.1 Quasi-constancy of the photon index at sub-Eddington regime and a reduction of the photon index at the high luminosity state
Z-sources Sco X-1, GX 340+0 and sources, GX 3+1, 4U 1820-30, 4U 1728-34 demonstrate a similar behavior of vs in the sub-Eddington regime, namely the quasi-constancy of spectral index which is distributed around 2. It is important to emphasize that we consider here the spectral behavior, which is related to the Comptonization region which in our scenario is the transition layer (TL). According to FT11, ST11, ST12 and STF13, this result can probably indicate that the gravitational energy release takes place in the whole TL, namely for these five sources and that is much higher than the cooling flow of the soft disk photons (see Eqs. 11-12).
However, for Sco X-1 we test a wider range of the luminosity than it in other Z and atoll sources (see above). In particular, Sco X-1 allows us to establish the index behavior at the critical luminosity regime, when the emergent luminosity is even higher than the Eddington luminosity. We find that the photon index of the TL region significantly decreases when the source accretes close to the Eddington regime, which takes place in the FB (see Figs. 10, 12). Namely, in this mid-topFB stage, the Comptonization tail is characterized by the reduced value of the photon index () and the high electron temperature of the TL ( keV keV). Despite its low level of normalization the Comptonized component is firmly detected at least up to 200 keV in the FB. Moreover the fraction of the high energy emission increases when increases and drops from 2 to 1.3. It should be emphasized that the only Sco X-1 among other Z-sources achieves the critical luminosity regime (see the dark blue points in Fig. 12). In turn, it is reasonably to compare this result on and Z sources with spectral properties of a unique source XTE J1701-462 (LRH09) involving both and Z stages of evolution as well as reaching the Eddington luminosity. Whereas LHR09 apply different models to spectral fit of XTE J1701-462 emission, their model assumes the role of weak Comptonization by the so called CBPL component (i.e. a constrained BPL with keV and ) in states and by BPL in states. In the frame of that model the observations of XTE J1701-462 in states are dominated by the BPL component with photon index , while in states the photon index often reaches its hard limit and ranged up to in the spectral fit with the CBPL model, i.e. is normally greater than 2. This disrepancy with our results for and Z sources (for which in our model) can be related to different model composition and to different energy range used for spectral fit. In fact, LRH09 analyzed XTE J1701-462 spectrum from 3 keV only up to 80 keV.
4.3.2 Spectral hardness and electron temperature variability for atoll and Z-sources: comparison with XTE J1701-462
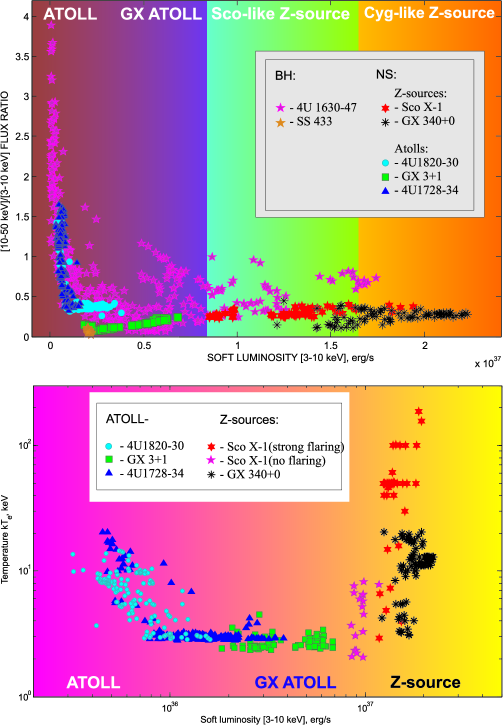
In order to compare evolution properties of Sco X-1 and GX 340+0 with atolls and BHC sources we plot in Fig. 13 (upper panel) HC (10-50 keV/3-50 keV) versus the luminosity in the 3 – 10 keV range [the hardness-luminosity diagram (HLD)] for seven sources: Z-sources Sco X-1, GX 340+0 (STF13) and sources GX 3+1(ST12), 4U 1820-30 [Titarchuk et al. (2013), hereafter TSF13], 4U 1728-34 (ST11) and BHC sources SS 433 (ST10), 4U 1630-47 (STS14).
As it is seen from Fig. 13, upper panel, these NS and BH binaries trace specific tracks in this HLD. We find that various types of NS LMXB subclasses can be well traced by the soft X-ray luminosity. More specifically, the spectral hardness HC of different types of NS LMXB subclasses (atolls, GX atolls, Sco-like Z-sources and Cyg-like Z-sources) is a function of the luminosity in soft energy range from 3 to 10 keV. In this way a Z-source traces its Z-branches at higher mass accretion rates, while atolls are observed at lower mass accretion rate values (). Note that we assume that is proportional to mass accretion rate. We should point out that atolls and BHs are similar when their luminosities are relatively low while Z sources are entirely different from BHs. It is interesting that BHs span almost the whole X-ray luminosity range as is covered by various typed of NS LMXB subclasses. Figure 13 ( panel) shows that Z sources are more luminous than BHs in their soft states.
It is interesting that a Cyg-like Z-source (e.g., GX 340+0) traces its Z-branches at some higher than Sco-like Z-sources (e.g., Sco X-1). In turn, bright atolls (e.g., GX 3+1) trace its color-color diagrams (usually, between lower banana to upper banana) at some higher than ordinary atolls (e.g., 4U 1728-34, 4U 1820-30). In this aspect it is interesting to review and investigate the spectral properties of XTE J1701-462 [see Homan at el. (2010)]. This source is a unique X-ray source to study its spectral characteristics along outburst phases with different properties of NS systems versus its luminosity. It shows all the flavors of NS systems: firstly appears as a Z source, then it shows features of atoll source and finally it fades. Homan at el. (2010) found that an initial Cyg-like behavior followed by Sco-like as the luminosity fell. Thus they concluded that Cyg/Sco like types depend on luminosity. They also compared the observed tracks for XTE J1701-462 with those found in the various NS LMXB subclasses and suggested that for the Z and atolls can be linked through changes in a single variable parameter, namely the mass accretion rate for the wide variety in behavior observed in NS-LXMBs with different luminosities.
We also compare the electron temperature variations along spectral state changes for different NS LMXB subclasses (see Fig. 13, bottom panel). As one can see that is also traced by . The electron temperature in atolls is usually related to relatively lower luminosity, while that in Z-sources corresponds to the luminosity very close the Eddington one. In fact, this diagram demonstrates a clear difference between atoll and Z-sources. The similar correlations were found by Lin et al. (2009) and Homan et al. (2010) for the case of XTE J1701-462. They claimed that for 2006 – 2007 outburst events the luminosity was a good parameter to track a gradual evolution of the CCD and HID tracks and allowing them to relate the observed properties to other NSs. In particular, they detected XTE J1701-462 with Z-source properties in terms of its CCD and HID when the source was at high luminosity phase. On the hand XTE J1701-462 exhibited its atoll properties when its luminosity becomes smaller.
5 Conclusions
In this Paper, we study the correlations between spectral, timing properties, and mass accretion rate observed in X-ray source Sco X-1 with RXTE. We find that the broad-band energy spectra of Sco X-1 during all Z-states can be adequately reproduced by an additive model, consistent of two Comptonized components with different seed photon temperatures (for example, keV and keV). We should also include an iron-line represented by a Gaussian component to the model in order to obtain reliable fits.
Our approach to modeling the X-ray spectra of Sco X-1 allows us to separate the contributions of two distinct zones of the spectral formation related to the and Comptonized components along the Z track which is possibly driven by mass accretion rate . In fact, the observed soft photon luminosity which is determined by normalization parameters of the Comptonized components (see Eq. 1) is proportional to . We observe an increase of the and (Fig. 9) from the to the in the CCD (see Fig. 1) which can indicate to an increase of mass accretion rate from the lower normal branch to the upper normal branch.
The normalization parameter is related to the soft (NS) Comptonized component, and is related a total mass accretion rate . One can see from Fig. 9, panel b there, how the total mass accretion rate, or , increases when increases and using Fig. 1 one can also see how the hardness ratio increases from the lower FB to the upper FB. We should also point out that a comparative analysis using our model shows that various NS LMXBs are also well traced by soft luminosity in the energy range from 3 to 10 keV.
Our spectral analysis also allows us to reveal the stability of both photon indices and around 2 during the HB/NB/botFB states, while the decrease of is observed in the mid-topFB. during this mid-topFB segment. We interpret the detected quasi-stability of the indices of Comptonized components about a value of 2 during the HB – NB – botFB in the framework of the model in which the gravitational energy release occurs in the TL and when that is much higher than the soft (disk) flux. This index stability phase is now established for the Comptonized spectral components of Sco X-1 over the HB – NB – botFB. This result is similar to those were previously found in the sources 4U 1728-34, GX 3+1, 4U 1820-30 and Z-source GX 340+0 through all spectral states. The new index reduction phase detected over the FB in Sco X-1 for the hard component we interpret in the framework of the model in which the gravitational energy release takes place only in some outer part of the transition layer. But in its lower part the soft photon illumination increases (mainly by NS soft photons) which is followed by a decrease of the plasma temperature. As a result the electron cross-section increases and the radiation pressure reaches its critical value and thus it stops the accretion flow (see §4).
Note during this index reduction stage the X-ray spectrum of Sco X-1 exhibits the electron temperature increase from 60 keV to 180 keV. It is important to emphasize that in BH sources the index increases up to a saturation level when the luminosity increases. This behavior is opposite to that seen in Sco X-1.
We are very grateful to the referee whose constructive suggestions help us to improve the paper quality.
References
- Alpar et al. (1992) Alpar M. A., Hasinger G., Shaham J., Yancopoulos S., 1992, A&A 257, 627
- Barnard et al. (2003) Barnard, R., Church, M. J., & Bal̀uciǹska-Church, M. 2003, A&A, 405, 237
- Barret (2001) Barret, D. 2001, Adv. Space Res., 28, 307
- Belloni et al. (2004) Belloni, T., Parolin, I., & Casella, P. 2004, A&A, 423, 969
- Borozdin et al. (1999) Borozdin, K., Revnivtsev, M., Trudolyubov, S., Shrader, C., & Titarchuk, L. 1999, ApJ, 517, 367
- Bradshaw et al. (1999) Bradshaw, C. F., Fomalont, E. B., & Geldzahler, B. J. 1999, ApJ, 512, L121
- Bradshaw et al. (2003) Bradshaw, C. F., Geldzahler, B. J., & Fomalont, E. B. 2003, ApJ, 592, 486
- D’Amico et al. (2001) D’Amico, F., Heindl, W. A., Rothschild, R. E., & Gruber, D. E. 2001, ApJ, 547, L147
- Casella et al. (2006) Casella, P., Belloni, T., and Stella, L., 2006, A&A, 446, 579
- Church & Bal̀uciǹska-Church (2001) Church, M. J., & Bal̀uciǹska-Church, M. 2001, A&A, 369, 915
- Church et al. (2014) Church, M. J., Gibiec, A. & Bal̀uciǹska-Church, M. 2014 MNRAS, 438, 2784
- Church et al. (2012) Church, M. J., Gibiec, A., Bal̀uciǹska-Church, M. & Jackson, N. K. 2012 A&A, 546, 35
- Church et al. (2006) Church, M. J., Halai, G. S., & Bal̀uciǹska-Church, M. 2006, A&A, 460, 233
- Christian & Swank (1997) Christian, D. J., & Swank, J. H. 1997, ApJS, 109, 177
- Dieters & van der Klis (2000) Dieters, S., & van der Klis, M. 2000, MNRAS, 311, 201
- D’Ai et al. (2007) D’Ai, A., Z̀ycki, P., Di Salvo, T., Iaria, R., Lavagetto, G. & Robba, N. R. 2007, ApJ, 667, 411
- Giacconi et al. (1962) Giacconi, R., Gursky, H., Paolini, F. R., & Rossi, R. 1962, Phys. Rev. Lett., 9, 439
- Gilfanov & Revnivtsev (2005) Gilfanov, M. & Revnivtsev, M. 2005, Astronomische Nachrichten, 326, 812
- Gilfanov et al. (2003) Gilfanov, M, Revnivtsev, M., and Molkov, S. 2003, A&A 410, 217
- Farinelli & Titarchuk (2011) Farinelli, R. & Titarchuk, L., 2011, A&A, 525, 102 (FT11)
- Farinelli et al. (2008) Farinelli, R.; Titarchuk, L.; Paizis, A. & Fronter, F. 2008, ApJ, 680, 602
- Hasinger et al. (1989) Hasinger, G., & van der Klis, M. 1989, A&A, 225, 79
- Hasinger et al. (1989) Hasinger G., Priedhorsky W.C., & Middleditch J., 1989 Astrophys. J., 337, 843 (HPM89)
- Hertz et al. (1992) Hertz P., Vaughan B., Wood K.S., Norris J.P., Mitsuda K., Michelson P.F., & Dotani T., 1992 Astrophys. J., 396, 201
- Homan et al. (2010) Homan, J., van der Klis, M., Fridriksson, J. K., 2010, ApJ, 719, 201
- Homan et al. (2007) Homan, J., van der Klis, M., Wijnands, R., et al., 2007, ApJ, 656, 420
- Jonker et al. (1998) Jonker, P. G., Wijnands R., van der Klis, M., Psaltis, D., Kuulkers, E. & Lamb, F.K. 1998, ApJ, 499, L191
- Kuulkers & van der Klis (2000) Kuulkers, E & van der Klis, M. 2000, A&A, 356, L45
- Kuulkers & van der Klis (1996) Kuulkers, E. & van der Klis, M. 1996, A&A, 314, 567
- Kuulkers et al. (1996) Kuulkers, E., van der Klis, M. & Vaughan, B. A. 1996, A&A, 311, 197
- Kuulkers et al. (1994) Kuulkers, E., van der Klis, M., Oosterbroek, T., Asai, K., Dotani, T., van Paradijs, J. & Lewin, W. H. G., 1994, A&A, 289, 795
- Lin et al. (2007) Lin, D., Homan, J., Remillard, R., & Wijnands, R. 2007, Astron. Tel., 1183
- Lin et al. (2009) Lin, D., Remillard, R. A., Homan, J., 2009, ApJ, 696, 1257 (LRH09)
- Middleditch & Priedhorsky (1986) Middleditch J., & Priedhorsky W.C. 1986 ApJ, 306, 230
- Penninx et al. (1991) Penninx, W., Lewin, W.H.G., Tan, J., Mitsuda, K., van der Klis, M., & van Paradijs, J. 1991, MNRAS., 249, 113
- Priedhorsky et al. (1986) Priedhorsky W., Hasinger G., Lewin W.H.G., Middleditch J., Parmar A., Stella L., & White N., 1986, Astrophys. J., 306, L91
- Rothschild et al. (1980) Rothschild, R.E. et al. 1980, Nature, 286, 786
- Revnivtsev & Gilfanov (2006) Revnivtsev, M., & Gilfanov, M. 2006, A&A, 453, 253
- Rybicki & Lightman (1979) Rybicki, G. B. & Lightman, A. P. 1979, Radiative Processes in Astrophysics (New York: Wiley)
- Sanna et al. (2010) Sanna, A., Mndez, M., Altamirano, D., Homan, J., et al. 2010, MNRAS, 408, 622
- Seifina, Titarchuk & Shaposhnikov (2014) Seifina, E., Titarchuk, L. & Shaposhnikov, N. 2014, ApJ, submitted (STS14)
- Seifina, Titarchuk & Frontera (2013) Seifina, E., Titarchuk, L. & Frontera, F. 2013, ApJ, 766, 63 (STF13)
- Seifina & Titarchuk (2012) Seifina, E. & Titarchuk, L. 2012, ApJ, 747, 99 (ST12)
- Seifina & Titarchuk (2011) Seifina, E. & Titarchuk, L. 2011, ApJ, 738, 128 (ST11)
- Seifina & Titarchuk (2010) Seifina, E. & Titarchuk, L. 2010, ApJ, 722, 586 (ST10)
- Shakura & Sunyaev (1973) Shakura, N.I., & Sunyaev, R.A. 1973, A&A, 24, 337
- Shaposhnikov & Titarchuk (2004) Shaposhnikov, N. & Titarchuk L. 2004, ApJ, 606, L57
- Shrader & Titarchuk (1998) Shrader, C. & Titarchuk, L. 1998, ApJ, 499, L31
- Smale et al. (1997) Smale, A. P., Zhang, W., & White, N. E. 1997, ApJL, 483, L119
- Steeghs & Casares (2002) Steeghs, D., & Casares, J. 2002, ApJ, 568, 273
- Strohmayer (1998) Strohmayer, T. 1998, in American Institute of Physics Conference Series, 397 (astro-ph/9802022v1)
- Titarchuk & Osherovich (1999) Titarchuk, L.G. & Osherovich, V.A. 1999, ApJ, 518, L95
- Titarchuk et al. (2013) Titarchuk, L., Seifina, E. & Frontera, F. 2013, ApJ, 767, 160 (TSF13)
- Titarchuk et al. (1998) Titarchuk, L., Lapidus, I.I. & Muslimov, A. 1998, ApJ, 419, 315
- Titarchuk (1994) Titarchuk, L. 1994, ApJ, 434, 570
- van der Klis et al. (1996) van der Klis, M. et al., 1996, ApJS, 469, L1
- van der Klis (1994) van der Klis, M., 1994, A&A, 283, 46
- van der Klis et al. (1987a) van der Klis M., Jansen F., Van Paradijs J., Lewin W. H. G., Sztjano M., Trmper J., 1987a, ApJ, 313, L19
- van der Klis et al. (1987b) van der Klis M., Stella L., White N., Jansen F., & Parmar A.N., 1987b, ApJ, 316, 411
- van Paradijs (1978) van Paradijs, J. 1978, Nature, 274, 650
- Wienke (1985) Wienke B., 1985, A&A, 152, 336
- Wijnands & van der Klis (1999) Wijnands, R., & van der Klis, 1999, ApJ, 512, L39
- Zel’dovich & Shakura (1969) Zel’dovich, Ya. B. & Shakura, N.I. 1969, Sov. Astronomy, 13, 175
- Zhang et al. (2006) Zhang, C. M., Yin, H. X., Zhao, Y. H., Zhang, F., & Song, L. M. 2006, MNRAS, 366, 1373
- Zhang et al. (1995) Zhang, W., Jahoda, K., Swank, J. H., Morgan, E. H., & Giles, A. B. 1995, ApJ, 449, 930
| Number of set | Dates, MJD | RXTE Proposal ID | Dates UT |
|---|---|---|---|
| R1 | 50227-50228; 50522, 50815 | 100611 | 1996 May 24 – 25, 1997 March 15; 1998 Jan 2 |
| R2 | 50556-50562; 50816-50821 | 200531,2,3 | 1997 April 18 – 24; 1998 January 3 – 8 |
| R3 | 50820-50821; 50963-50999 | 300361,2,3,4; 300351,2 | 1998 Jan 7 – 8; May 30 – July 5 |
| R4 | 51186-51194 | 400202 | 1999 Jan 1 – 16 |
| R5 | 51339-51342 | 407061,3,5 | 1999 Jun 10 – 13† |
| R6 | 52413.9-52414 | 700152 | 2002 May 19 21:55:44 – 23:45:28† |
| No. | Observational | MJD, | , | N | Eline, | (d.o.f.) | ||||||||
|---|---|---|---|---|---|---|---|---|---|---|---|---|---|---|
| ID | day | keV | keV | keV | keV | |||||||||
| 01 | 10061-01-01-00 | 50227.865 | 1.03(2) | 16(4) | -2.0(5) | 2.47(3) | 1.42(6) | 1.01(3) | 2.94(1) | 2.00†† | 2.09(1) | 5.99(4) | 1.18(5) | 1.21(87) |
| 02 | 10061-01-01-01 | 50228.003 | 1.00(3) | 7(2) | -1.6(2) | 1.97(8) | 1.27(4) | 1.00(1) | 2.97(4) | 2.00†† | 1.89(2) | 6.02(6) | 0.76(7) | 0.93(87) |
| 03 | 10061-01-02-00 | 50522.766 | 0.98(4) | 80(3) | -1.40(1) | 0.21(7) | 1.17(2) | 1.00(2) | 3.05(1) | 2.00†† | 2.26(1) | 6.12(6) | 0.80(9) | 1.14(87) |
| 04 | 20053-01-02-05 | 50556.570 | 0.99(3) | 40(1) | -1.36(7) | 0.004(2) | 0.72(8) | 1.03(6) | 2.89(5) | 0.84(5) | 2.65(9) | 6.79(7) | 0.22(7) | 1.02(85) |
| 05 | 20053-01-01-00 | 50556.639 | 1.06(1) | 30(5) | -1.69(8) | 0.61(8) | 0.95(9) | 0.98(1) | 2.99(2) | 2.00†† | 2.19(4) | 6.3(2) | 0.51(9) | 1.16(87) |
| 06 | 20053-01-01-01 | 50557.183 | 0.71(4) | 90(10) | -2.01(4) | 0.004(1) | 0.45(7) | 0.95(1) | 3.01(1) | 0.9(1) | 2.7(1) | 6.46(9) | 0.30(5) | 1.32(87) |
| 07a | 20053-01-01-02a | 50558.774 | 1.01(2) | 15(4) | -2.0(1) | 0.8(2) | 0.55(6) | 1.00(3) | 2.79(2) | 1.27(5) | 2.05(4) | 6.39(8) | 0.72(7) | 1.02(87) |
| 07b | 20053-01-01-02b | ….. | 1.00(3) | 14(3) | -2.1(2) | 0.8(1) | 0.58(8) | 1.01(2) | 2.82(2) | 1.63(8) | 2.06(7) | 6.54(7) | 0.83(7) | 1.04(87) |
| 07c | 20053-01-01-02c | ….. | 1.03(2) | 18(6) | -1.9(1) | 0.7(2) | 0.52(4) | 1.03(3) | 2.93(3) | 1.82(9) | 2.05(6) | 6.29(9) | 0.91(7) | 1.01(87) |
| 08 | 20053-01-01-03 | 50559.841 | 1.00(3) | 61(2) | -2.34(8) | 0.2(1) | 1.1(1) | 0.99(2) | 2.86(1) | 0.23(8) | 2.2(1) | 6.4(1) | 0.59(6) | 1.19(87) |
| 09 | 20053-01-01-04 | 50560.641 | 0.41(3) | 120(10) | -1.68(7) | 0.001(1) | 0.66(7) | 1.01(1) | 3.03(3) | 0.72(7) | 2.75(2) | 6.46(9) | 0.10(2) | 1.03(87) |
| 10 | 20053-01-01-05 | 50561.576 | 0.99(4) | 46(3) | -1.29(3) | 0.003(1) | 0.56(4) | 1.05(2) | 2.86(1) | 1.10(5) | 2.50(3) | 6.70(5) | 0.44(5) | 1.16(85) |
| 11 | 20053-01-01-06 | 50562.509 | 0.98(3) | 50(2) | -1.90(4) | 0.007(2) | 0.47(6) | 1.00(1) | 2.93(1) | 1.11(6) | 2.47(2) | 6.93(9) | 0.37(6) | 0.97(85) |
| 12 | 10061-01-03-00 | 50815.621 | 1.01(2) | 70(5) | -1.05(8) | 0.05(1) | 0.72(6) | 1.08(3) | 2.92(3) | 0.78(6) | 2.59(4) | 6.78(8) | 0.33(7) | 1.23(87) |
| 13a | 20053-01-02-00a | 50816.887 | 0.44(6) | 120(10) | -2.0(9) | 0.002(1) | 0.44(9) | 0.95(1) | 2.76(1) | 0.73(4) | 2.9(1) | 6.72(7) | 0.75(6) | 1.25(85) |
| 13b | 20053-01-02-00b | ….. | 0.45(5) | 120(10) | -2.0(9) | 0.001(2) | 0.45(8) | 0.94(2) | 2.77(1) | 0.65(3) | 2.7(2) | 6.67(4) | 0.73(4) | 1.26(85) |
| 13c | 20053-01-02-00c | ….. | 0.44(4) | 110(10) | -2.0(9) | 0.001(1) | 0.46(9) | 0.95(1) | 2.65(2) | 0.78(4) | 2.8(1) | 6.52(8) | 0.74(6) | 1.23(85) |
| 13d | 20053-01-02-00d | ….. | 0.46(6) | 120(10) | -2.0(9) | 0.001(1) | 0.45(7) | 0.96(1) | 2.93(1) | 0.92(1) | 2.6(3) | 6.87(9) | 0.72(3) | 1.26(85) |
| 14a | 20053-01-02-01a | 50817.931 | 0.39(7) | 156(8) | -2.3(4) | 0.19(9) | 0.71(8) | 0.91(2) | 2.85(6) | 0.35(7) | 3.10(2) | 6.96(8) | 0.45(5) | 1.16(85) |
| 14b | 20053-01-02-01b | ….. | 0.39(7) | 149(7) | -2.0(4) | 0.17(8) | 0.75(8) | 0.93(2) | 2.93(5) | 0.34(6) | 3.02(4) | 7.10(9) | 0.44(6) | 1.14(85) |
| 15 | 20053-01-02-020 | 50818.773 | 0.90(4) | 50(5) | -1.39(6) | 0.003(1) | 0.7(1) | 1.00(4) | 2.93(4) | 0.82(5) | 2.67(8) | 6.90(8) | 0.2(1) | 1.00(85) |
| 16a | 20053-01-02-030a | 50819.623 | 0.71(2) | 85(5) | -1.01(5) | 0.001(1) | 0.60(3) | 0.95(2) | 2.85(1) | -0.17(5) | 3.0(2) | 7.02(9) | 0.13(3) | 1.06(85) |
| 16b | 20053-01-02-030b | ….. | 0.72(1) | 76(4) | -1.00(6) | 0.001(1) | 0.64(3) | 0.97(1) | 2.81(2) | -0.18(7) | 3.0(1) | 6.93(4) | 0.14(2) | 0.08(85) |
| 16c | 20053-01-02-030c | ….. | 0.71(2) | 82(9) | -1.06(5) | 0.002(1) | 0.60(4) | 1.01(3) | 3.17(1) | -0.26(5) | 2.8(2) | 7.01(7) | 0.15(2) | 1.01(85) |
| 16d | 20053-01-02-030d | ….. | 0.70(1) | 86(5) | -1.03(4) | 0.001(1) | 0.61(2) | 0.98(2) | 2.80(1) | -0.15(6) | 2.9(3) | 7.02(9) | 0.14(3) | 1.06(85) |
| 16e | 20053-01-02-030e | ….. | 0.71(2) | 80(7) | -1.10(5) | 0.001(1) | 0.60(3) | 1.00(1) | 2.87(3) | -0.09(7) | 2.9(2) | 6.95(8) | 0.14(2) | 1.11(85) |
| 17a | 30036-01-01-000a | 50820.562 | 0.26(2) | 120(10) | -4.05(4) | 0.15(9) | 0.71(4) | 1.00(1) | 3.04(2) | 0.49(2) | 3.12(2) | 6.29(6) | 0.84(7) | 1.05(87) |
| 17b | 30036-01-01-000b | ….. | 0.26(3) | 120(10) | -4.03(5) | 0.16(8) | 0.72(3) | 1.04(1) | 3.15(3) | 0.47(3) | 3.11(3) | 6.35(7) | 0.74(8) | 1.16(87) |
| 17c | 30036-01-01-000c | ….. | 0.27(3) | 110(10) | -4.16(4) | 0.15(7) | 0.76(4) | 1.03(1) | 3.07(2) | 0.58(2) | 2.93(3) | 6.76(5) | 0.54(9) | 1.12(87) |
| 17d | 30036-01-01-000d | ….. | 0.28(2) | 100(10) | -4.07(3) | 0.17(9) | 0.70(5) | 0.99(2) | 3.06(1) | 0.39(4) | 2.91(4) | 6.21(8) | 0.86(8) | 0.99(87) |
| 17e | 30036-01-01-000e | ….. | 0.27(3) | 110(9) | -4.03(4) | 0.14(8) | 0.72(4) | 1.02(1) | 3.02(2) | 0.46(3) | 2.98(3) | 6.19(7) | 0.93(9) | 1.08(87) |
| 18a | 20053-01-02-04a | 50820.955 | 0.23(3) | 190(10) | -2.2(3) | 0.12(8) | 0.71(6) | 1.01(2) | 2.86(1) | 0.39(5) | 3.23(8) | 7.00(9) | 0.39(7) | 1.18(85) |
| 18b | 20053-01-02-04b | ….. | 0.25(2) | 195(9) | -2.1(1) | 0.11(9) | 0.69(5) | 0.99(1) | 2.81(2) | 0.42(4) | 3.22(7) | 6.95(8) | 0.40(6) | 1.17(85) |
| 18c | 20053-01-02-04c | ….. | 0.26(3) | 200(10) | -2.2(2) | 0.10(7) | 0.63(4) | 1.04(1) | 2.87(1) | 0.37(5) | 3.21(9) | 6.99(9) | 0.41(9) | 1.09(85) |
| 19 | 30036-01-02-000 | 50821.555 | 1.01(2) | 60(10) | -2.78(5) | 0.07(2) | 1.47(3) | 1.00(1) | 2.94(2) | 0.11(4) | 2.09(2) | 6.00(5) | 0.91(8) | 1.17(87) |
| 20 | 30035-01-01-00 | 50963.019 | 1.01(3) | 40(2) | -2.25(6) | 1.58(9) | 1.18(6) | 0.99(2) | 3.08(1) | 0.75(6) | 2.17(4) | 6.4(1) | 0.35(2) | 1.26(87) |
| 21 | 30035-01-02-000 | 50964.018 | 1.08(2) | 45(5) | -1.69(3) | 0.24(1) | 0.96(2) | 1.00(1) | 2.81(1) | 0.13(2) | 2.45(2) | 6.7(1) | 0.30(1) | 1.19(87) |
| 22 | 30035-01-05-00 | 50965.018 | 1.02(3) | 60(5) | -1.7(1) | 0.33(4) | 0.81(3) | 1.01(2) | 2.81(2) | 0.41(5) | 2.33(4) | 6.7(1) | 0.30(2) | 1.15(87) |
| 23 | 30035-01-03-00 | 50965.085 | 1.03(4) | 50(2) | -1.7(2) | 0.19(1) | 0.93(1) | 1.03(1) | 2.81(1) | 0.16(2) | 2.46(2) | 6.7(1) | 0.31(3) | 1.25(87) |
| 24a | 30035-01-06-00a | 50966.019 | 0.98(3) | 53(5) | -1.7(4) | 0.20(4) | 0.88(4) | 1.02(3) | 2.73(9) | 0.60(8) | 2.46(5) | 6.71(4) | 0.30(2) | 1.04(87) |
| 24b | 30035-01-06-00b | ….. | 0.90(2) | 53(5) | -1.7(4) | 0.21(3) | 0.89(3) | 1.04(2) | 2.75(8) | 0.59(6) | 2.89(6) | 6.68(3) | 0.35(3) | 0.98(87) |
| 24c | 30035-01-06-00c | ….. | 0.95(3) | 53(5) | -1.7(4) | 0.19(4) | 0.91(4) | 1.03(3) | 2.76(9) | 0.61(8) | 2.61(5) | 6.69(4) | 0.32(2) | 1.01(87) |
| 25 | 30035-01-04-00 | 50966.083 | 0.99(4) | 3.9(1) | -3.0(9) | 0.26(3) | 0.68(3) | 1.00(1) | 2.67(5) | 1.05(5) | 2.40(9) | 6.73(8) | 0.39(8) | 1.17(87) |
| 26a | 30035-01-07-00a | 50996.268 | 1.00(1) | 3(1) | 3.0(8) | 1.7(2) | 0.58(5) | 0.98(2) | 2.7(2) | -0.03(1) | 2.63(8) | 6.71(4) | 0.36(7) | 1.31(87) |
| 26b | 30035-01-07-00b | ….. | 0.95(2) | 2.5(2) | 3.0(8) | 1.9(1) | 0.57(3) | 0.99(1) | 2.8(1) | -0.06(2) | 2.97(8) | 6.75(4) | 0.38(3) | 1.30(87) |
| 26c | 30035-01-07-00c | ….. | 0.99(2) | 3(1) | 3.0(8) | 1.8(2) | 0.59(4) | 0.97(2) | 2.7(2) | -0.04(1) | 2.83(8) | 6.69(4) | 0.37(5) | 1.28(87) |
| 27 | 30035-01-08-00 | 50997.268 | 1.01(3) | 40(5) | -2.42(2) | 1.88(6) | 1.34(3) | 1.00(1) | 3.01(2) | 0.45(6) | 2.03(2) | 6.10(8) | 0.46(2) | 1.23(87) |
| 28 | 30035-01-09-00 | 50998.268 | 0.90(4) | 45(3) | -3.0(8) | 0.004(1) | 0.69(4) | 1.01(1) | 3.08(1) | 0.89(8) | 2.56(6) | 6.72(4) | 0.29(1) | 1.05(87) |
| 29 | 30035-01-10-00 | 50999.268 | 0.98(3) | 50(6) | -3.0(9) | 0.001(1) | 0.60(7) | 1.03(2) | 2.89(7) | 0.27(6) | 2.39(2) | 6.72(4) | 0.73(2) | 1.19(87) |
| 30 | 30035-01-11-00 | 50997.402 | 1.02(2) | 47(8) | -2.26(2) | 1.63(6) | 1.34(3) | 1.00(1) | 3.09(1) | 0.59(8) | 2.12(3) | 6.2(1) | 0.34(5) | 1.15(87) |
| 31 | 40020-01-01-00 | 51186.402 | 0.45(4) | 110(10) | -1.19(7) | 0.005(1) | 0.60(7) | 1.02(3) | 2.83(1) | 0.4(2) | 2.89(9) | 6.4(1) | 0.65(7) | 1.23(87) |
| 32 | 40020-01-01-01 | 51186.920 | 1.03(2) | 43(6) | -1.5(1) | 0.01(1) | 0.73(3) | 0.98(2) | 2.82(2) | 0.38(4) | 2.49(3) | 7.24(6) | 0.34(5) | 1.28(87) |
| 33a | 40020-01-01-020a | 51187.469 | 0.95(3) | 26(3) | -2.0(2) | 0.011(3) | 0.60(4) | 1.03(1) | 2.78(3) | 0.44(5) | 2.58(4) | 6.67(8) | 0.78(6) | 1.21(87) |
| 33b | 40020-01-01-020b | ….. | 0.56(2) | 78(9) | -2.1(2) | 0.008(2) | 0.61(2) | 1.01(1) | 2.79(3) | 0.43(6) | 2.59(2) | 6.71(2) | 0.81(7) | 0.98(87) |
| 33c | 40020-01-01-020c | ….. | 0.42(3) | 91(8) | -2.0(3) | 0.009(1) | 0.61(4) | 1.03(2) | 2.78(3) | 0.44(5) | 2.57(4) | 6.72(4) | 0.80(9) | 1.15(87) |
| 33d | 40020-01-01-020d | ….. | 0.40(4) | 80(9) | -2.3(2) | 0.009(1) | 0.63(4) | 1.02(1) | 2.78(3) | 0.41(2) | 2.56(3) | 6.69(9) | 0.75(7) | 1.20(87) |
| 33e | 40020-01-01-020e | ….. | 0.40(3) | 94(9) | -2.1(3) | 0.009(1) | 0.59(3) | 1.03(2) | 2.79(3) | 0.40(5) | 2.62(4) | 6.77(7) | 0.81(8) | 1.19(87) |
| 34a | 40020-01-01-030a | 51188.260 | 0.44(4) | 100(10) | -2.1(2) | 0.010(1) | 0.7(1) | 1.01(1) | 2.55(1) | 0.40(2) | 2.61(2) | 6.97(7) | 0.50(6) | 1.18(87) |
| 34b | 40020-01-01-030b | ….. | 0.43(5) | 100(10) | -2.0(3) | 0.009(1) | 0.7(1) | 1.01(2) | 2.56(1) | 0.42(5) | 2.60(4) | 6.94(6) | 0.49(8) | 1.20(87) |
| 34c | 40020-01-01-030c | ….. | 0.44(4) | 110(10) | -2.0(2) | 0.008(2) | 0.7(2) | 1.03(1) | 2.54(2) | 0.41(4) | 2.63(3) | 6.96(9) | 0.50(7) | 1.16(87) |
| 34d | 40020-01-01-030d | ….. | 0.43(2) | 110(10) | -2.1(3) | 0.008(1) | 0.6(2) | 1.02(1) | 2.56(1) | 0.40(5) | 2.64(2) | 6.78(8) | 0.49(7) | 1.18(87) |
| 34e | 40020-01-01-030e | ….. | 0.43(4) | 110(10) | -2.2(3) | 0.009(3) | 0.7(1) | 1.01(2) | 2.55(2) | 0.40(6) | 2.65(3) | 6.62(9) | 0.50(8) | 1.17(87) |
| 34f | 40020-01-01-030f | ….. | 0.43(4) | 100(10) | -2.1(2) | 0.009(2) | 0.6(1) | 1.01(1) | 2.56(3) | 0.39(5) | 2.65(2) | 6.56(9) | 0.47(6) | 1.18(87) |
| 35a | 40020-01-01-04a | 51188.804 | 0.39(3) | 110(12) | -1.7(2) | 0.04(1) | 0.60(3) | 0.97(2) | 2.75(1) | 0.33(1) | 2.69(2) | 6.49(9) | 0.92(5) | 1.08(87) |
| 35b | 40020-01-01-04b | ….. | 0.38(2) | 110(15) | -1.7(1) | 0.03(3) | 0.61(2) | 0.98(3) | 2.76(2) | 0.35(2) | 2.67(3) | 6.47(8) | 0.94(6) | 1.09(87) |
| 35c | 40020-01-01-04c | ….. | 0.38(3) | 120(12) | -1.8(2) | 0.02(1) | 0.60(1) | 0.96(1) | 2.75(1) | 0.34(1) | 2.66(4) | 6.48(5) | 0.93(7) | 1.09(87) |
| 35d | 40020-01-01-04d | ….. | 0.37(4) | 120(15) | -1.9(3) | 0.03(2) | 0.63(2) | 0.98(3) | 2.73(1) | 0.35(2) | 2.68(3) | 6.47(8) | 0.92(6) | 1.08(87) |
| 36a | 40020-01-01-05a | 51189.152 | 0.41(2) | 120(10) | -2.1(2) | 0.04(1) | 0.63(2) | 1.01(2) | 2.77(2) | 0.32(3) | 2.69(4) | 6.46(7) | 0.93(7) | 1.15(87) |
| 36b | 40020-01-01-05b | ….. | 0.38(4) | 100(15) | -2.0(3) | 0.03(2) | 0.62(1) | 1.02(1) | 2.79(3) | 0.30(3) | 2.66(3) | 6.47(8) | 0.90(5) | 1.25(87) |
| 36c | 40020-01-01-05c | ….. | 0.39(4) | 110(10) | -1.9(4) | 0.03(1) | 0.63(2) | 1.00(1) | 2.78(1) | 0.31(2) | 2.66(4) | 6.46(7) | 0.92(8) | 1.28(87) |
| 37a | 40020-01-01-060a | 51191.785 | 0.98(4) | 10(3) | -0.09(3) | 0.93(1) | 1.17(7) | 1.01(1) | 3.04(6) | 1.89(2) | 2.6(1) | 6.47(7) | 0.42(5) | 1.02(87) |
| 37b | 40020-01-01-060b | ….. | 0.38(6) | 90(9) | -2.1(2) | 1.02(1) | 0.52(4) | 1.03(2) | 2.68(1) | 0.57(3) | 2.68(4) | 6.59(3) | 0.89(7) | 1.23(87) |
| 37c | 40020-01-01-060c | ….. | 0.37(4) | 110(10) | -2.1(2) | 0.06(1) | 0.54(3) | 1.01(3) | 2.65(2) | 0.56(2) | 1.64(3) | 6.49(4) | 0.68(4) | 1.26(87) |
| 37d | 40020-01-01-060d | ….. | 0.98(3) | 23(5) | -2.1(2) | 0.02(1) | 1.14(2) | 1.03(2) | 2.60(1) | 1.45(4) | 1.57(2) | 6.52(3) | 0.83(9) | 1.16(87) |
| 37e | 40020-01-01-060e | ….. | 0.99(6) | 15(5) | -0.06(2) | 0.04(1) | 1.15(3) | 1.02(2) | 2.08(5) | 1.74(2) | 0.7(1) | 6.45(5) | 0.76(7) | 1.19(87) |
| 38 | 40020-01-01-07 | 51192.852 | 0.41(5) | 120(10) | -2.2(4) | 0.06(4) | 0.59(5) | 1.01(2) | 2.94(1) | 0.60(3) | 2.69(4) | 6.5(2) | 0.43(6) | 1.08(87) |
| 39 | 40020-01-03-00 | 51193.787 | 0.80(3) | 80(10) | -2.0(2) | 0.05(3) | 0.51(3) | 1.02(3) | 3.01(2) | 0.82(9) | 2.68(3) | 6.9(1) | 0.32(8) | 1.12(87) |
| 40 | 40020-01-03-01 | 51194.860 | 0.82(2) | 69(7) | -2.1(3) | 0.06(4) | 0.45(4) | 0.99(1) | 2.95(1) | 0.69(5) | 2.68(3) | 6.5(1) | 0.39(7) | 0.93(87) |
| 41 | 40706-02-01-00 | 51339.384 | 0.98(4) | 2.0(3) | -0.08(3) | 1.4(1) | 1.17(8) | 1.01(1) | 3.04(9) | 2.00†† | 0.6(1) | 6.27(9) | 0.42(5) | 1.00(87) |
| 42 | 40706-02-03-00 | 51339.642 | 1.02(1) | 3(1) | -0.14(9) | 1.4(1) | 1.22(9) | 0.98(2) | 3.01(8) | 2.00†† | 0.8(1) | 6.23(8) | 0.42(6) | 1.06(87) |
| 43 | 40706-02-06-00 | 51339.976 | 1.05(2) | 7.6(5) | -1.83(6) | 0.96(9) | 0.84(7) | 1.03(1) | 2.59(1) | 2.00†† | 1.14(2) | 6.39(5) | 0.65(4) | 1.29(87) |
| 44 | 40706-01-01-000 | 51340.092 | 1.02(1) | 2.3(2) | 0.26(9) | 1.58(5) | 1.6(1) | 1.01(1) | 3.4(1) | 2.00†† | 0.3(1) | 6.3(1) | 0.42(5) | 1.33(87) |
| 45 | 40706-02-08-00 | 51340.908 | 0.99(3) | 8.2(7) | -1.83(7) | 1.15(8) | 1.09(4) | 0.99(2) | 2.88(1) | 2.00†† | 1.38(1) | 6.18(8) | 0.46(5) | 0.76(87) |
| 46 | 40706-02-09-00 | 51340.939 | 1.00(1) | 6.4(6) | -1.6(1) | 1.11(9) | 1.05(3) | 1.02(3) | 2.85(2) | 2.00†† | 1.35(2) | 6.22(7) | 0.44(6) | 1.08(87) |
| 47 | 40706-02-10-00 | 51340.974 | 1.03(2) | 6.5(4) | -1.58(5) | 1.16(8) | 1.08(4) | 1.03(2) | 2.84(2) | 2.00†† | 1.36(1) | 6.18(9) | 0.45(5) | 1.12(87) |
| 48 | 40706-02-12-00 | 51341.155 | 1.07(4) | 5.7(3) | -0.45(9) | 1.17(9) | 1.07(3) | 1.01(1) | 2.82(3) | 2.00†† | 1.34(2) | 6.19(7) | 0.46(6) | 0.92(87) |
| 49 | 40706-02-13-00 | 51341.222 | 0.99(2) | 5.2(2) | -0.4(2) | 1.09(8) | 1.02(5) | 0.98(2) | 2.78(4) | 2.00†† | 1.32(3) | 6.23(8) | 0.44(7) | 0.93(87) |
| 50 | 40706-02-14-00 | 51341.288 | 0.97(3) | 4.53(9) | -0.07(9) | 1.2(1) | 1.10(6) | 0.99(1) | 2.79(7) | 2.00†† | 1.31(9) | 6.18(8) | 0.46(6) | 0.78(87) |
| 51 | 40706-01-02-00 | 51341.355 | 1.00(2) | 2.3(2) | 0.2(1) | 1.62(7) | 1.5(1) | 1.01(1) | 3.4(1) | 2.00†† | 0.4(1) | 6.32(7) | 0.43(5) | 1.34(87) |
| 52 | 40706-02-16-00 | 51341.576 | 1.03(1) | 3.3(2) | -0.27(8) | 1.28(9) | 1.02(8) | 0.98(3) | 2.17(9) | 2.00†† | 1.0(1) | 6.32(6) | 0.54(5) | 1.04(87) |
| 53 | 40706-02-17-00 | 51341.699 | 1.00(4) | 3.7(3) | -0.58(9) | 0.97(8) | 0.82(9) | 1.03(4) | 2.36(7) | 2.00†† | 0.98(9) | 6.32(7) | 0.49(4) | 1.03(87) |
| 54 | 40706-02-18-00 | 51341.905 | 0.93(3) | 5.9(8) | -1.50(8) | 0.94(9) | 0.90(6) | 1.02(1) | 2.71(2) | 2.00†† | 1.26(2) | 6.32(7) | 0.45(5) | 0.94(87) |
| 55 | 40706-02-19-00 | 51341.972 | 1.02(4) | 6.6(5) | -1.5(3) | 0.58(7) | 0.67(8) | 0.99(2) | 2.67(1) | 2.00†† | 1.22(9) | 6.38(8) | 0.43(5) | 1.23(87) |
| 56 | 40706-02-21-00 | 51342.155 | 1.07(2) | 7.8(6) | -1.6(1) | 0.5(1) | 0.80(6) | 1.01(1) | 2.65(3) | 2.00†† | 1.76(3) | 6.69(7) | 0.54(4) | 1.18(87) |
| 57 | 40706-02-23-00 | 51342.287 | 0.99(2) | 2.2(1) | 0.03(1) | 1.4(2) | 1.2(1) | 0.98(2) | 2.89(9) | 2.00†† | 0.68(9) | 6.32(6) | 0.50(7) | 0.83(87) |
| 58 | 40706-01-03-00 | 51342.354 | 1.01(3) | 2.0(1) | 0.26(9) | 1.49(8) | 1.25(9) | 1.01(1) | 3.03(8) | 2.00†† | 0.6(1) | 6.39(7) | 0.50(5) | 1.18(87) |
| 59 | 70015-01-01-00 | 52413.913 | 1.01(4) | 4.9(3) | -1.9(2) | 2.0(1) | 0.59(8) | 1.02(3) | 2.78(2) | 0.63(9) | 2.23(5) | 6.41(9) | 0.4(1) | 0.86(87) |
| 60 | 70015-01-01-01 | 52413.982 | 1.08(3) | 6.5(4) | -1.9(1) | 2.01(9) | 0.68(7) | 0.99(1) | 2.68(2) | 0.6(1)3 | 2.09(4) | 6.3(1) | 0.7(1) | 1.17(87) |
† The spectral model is ;†† when parameter , this parameter is fixed at 2.0 (see comments in the text), ††† normalization parameters of components are in units of , where is the source luminosity in units of 1039 erg/s, is the distance to the source in units of 10 kpc and component is in units of in line, of Gaussian component is fixed to a value 0.8 keV (see comments in the text), was fixed at value of 3 cm-2 (Christian & Swank, 1997). Some data sets, although having the same proposal number, contain observation separated by time intervals. In these cases we collected all the observations close in just one CCD interval (see Fig. 1), and distinguish the relative CCDs by a superscripts (e.g., “a”, “b” etc), following the proposal number
| Source | Alternative | Class4 | Distance, | Presence of | , | |||
|---|---|---|---|---|---|---|---|---|
| name | name | kpc | kHz QPO | keV | keV | |||
| 4U 1617-15 | Sco X-1 | Z, Sp, B | 2.87 | +8 | 3-180 | 0.3-3.4 | 0.4-1.8 | 0.08-1 |
| 4U 1642-45 | GX 340+0 | Z, Sp, B | 10.59 | +12 | 3-21 | 0.08-0.2 | 1.1-1.5 | 0.01-0.5 |
| 4U 1744-26 | GX 3+1 | Atoll, Sp, B | 4.510 | none13 | 2.3-4.5 | 0.04-0.15 | 1.16-1.7 | 0.2-0.9 |
| 4U 1728-34 | GX 354-0 | Atoll, Su, D | 4.2-6.411 | +14 | 2.5-15 | 0.02-0.09 | 1.3 | 0.5-1 |
| 4U 1820-30 | … | Atoll, Su, - | 5.8-815 | +16 | 2.9-21 | 0.02-0.14 | 1.1-1.7 | 0.2-1 |
| XTE J1701-462 | … | Atoll+Z, Su, - | 8.817 | +18 | … | … | 1-2.7 | … |
References: (1) STF13; (2) ST12; (3) ST11; (4) TSF13; (5) LRH109; (6) Classification of the system in the various schemes (see text): Sp = supercritical, Su = subcritical, B = bulge, D = disk; (7) Bradshaw et al. (1999); (8) Zhang et al. (2006); (9) Fender & Henry (2000), Christian & Swank (1997); (10) Kuulkers & van der Klis (2000) (11) van Paradijs (1978); (12) Jonker et al. (1998); (13) Strohmayer (1998); (14) Titarchuk & Osherovich (1999) (15) Shaposhnikov & Titarchuk (2004) (16) Smale et al. (1997) (17) Lin et al. (2007), Lin et al. (2009) (18) Sanna et al. (2010)