PMS and ZAMS stars associated with the dark cloud LDN 1655
Abstract
We give results of a low-resolution optical spectroscopic study of the bright nebulous stars conforming the tight stellar trapezium embedded in IRAS06548-0815, of the exciting star of IRAS06547-0810, and of the stars associated with reflection nebulae (R- or N-stars) NJ065703.0-081421, NJ065714.1-081016,IRAS06548-0815 D and IRAS06548-0815 G, all objects scarcely observed and apparently pertaining to the dark cloud LDN 1655. Our results given here combined with the corresponding 2MASS near infrared photometry enables us to estimate a photometric distance to LDN1655 of 1.9 kpc and to locate the trapezium stars on the () or HR diagram in an attempt to disclose about their true nature.
The spectroscopy of IRAS06548-0815 (catalog ) revealed two classic T Tauri, two Herbig Ae/Be stars, four weak-line T Tauri stars, and two probable lithium-rich stars. Additionally, we found that the R-star IRAS06547-0810 (catalog ) is excited by a single B1(V) star, that IRAS06548-0815 (catalog ) D is excited by a SpT. B2/B3(V) star, NJ065703.0-081421 and NJ065714.1-081016 are excited by a B3/B4(V) emission star and an A6(V) star, respectively. The brightest near infrared source of the trapezium, IRS1, has an infrared luminosity comparable to a highly reddened O8(V) star (A). The second brightest near infrared source of the trapezium, IRAS06548-0815 (catalog ) C is, optically, a single classical T Tauri star of spectral type K4/K5, but is a resolved binary in the 2MASS band, both components being of about the same brightness.
1 Introduction
The purpose of our spectroscopic survey of selected objects associated with the dark cloud LDN1655 (Lynds 1962) is threefold: i) to detect its concomitant pre-main sequence stars, if any (i.e. to our knowledge, no such young stars have been reported in the literature), mainly the stars associated with IRAS06548-0815, ii) to derive a photometric distance to the cloud LDN1655 on hand of its associated (young blue) nebulous stars and iii) to locate its presumed young stars in the Hertzprung-Russell Diagram. On the following, we give a brief review of previous findings of the region.
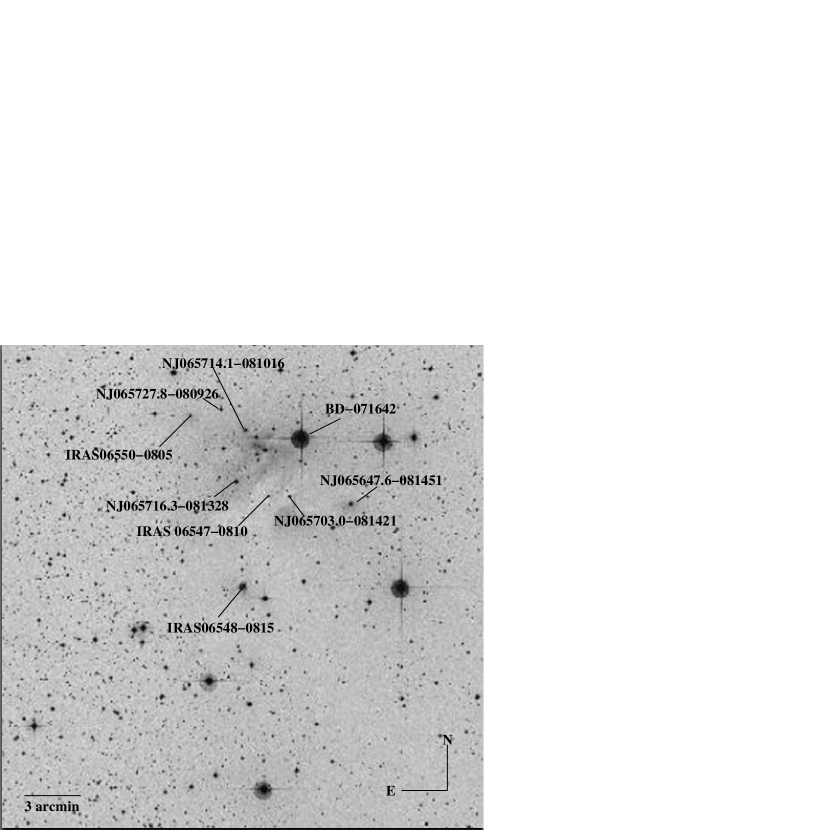
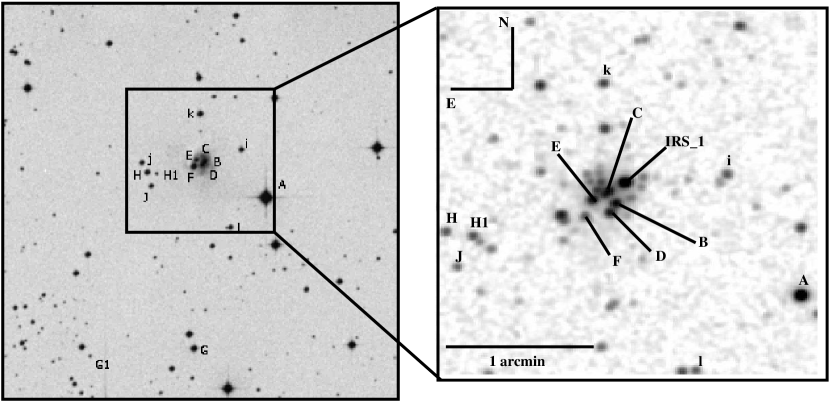
A quick inspection of the red POSS image of the region revealed a diffuse HII region obscured by a “hammer-shaped” dust lane in its foreground, the latter containing IRAS06548-0815 (catalog ) and IRAS06547-0810 (catalog ), among other infrared sources and stars associated with reflection nebulosity (N- or R-stars, see Figure 1). Star BD-071642 (catalog ) (, an A2V star at a distance pc, this paper) is the apparent brightest optical object of the region shown in Figure 1, located at its top-center section. The infrared source IRAS06548-0815 (catalog ) stands out from the other sources of the region because of its mid infrared colors and morphology: it is a compact Orion-like trapezium111The distance to any two stars of the trapezium is comparable to its size. entangled in reflection nebulosity (Magnier et al. 1999). The trapezium contains at least five nebulous stars, reminiscent of other similar very young stellar ensembles studied by our group (e.g. Chavarría-K et al. 1987, 1989, 2005; Moreno-Corral et al. 1993, 2002, 2006; see also Gyulbudaghian 1995), its stellar constituents could be medium and low-mass young stars. In support of this and considering that such clusters are loosely bound and hence subject to disruption by gravitational pull, the tightness of IRAS06548-0815 stellar aggregate (angular and linear diámeter , pc, respectively, assuming a distance to LDN1655 kpc, see ) signalizes us that gravity has not had the time to disperse it. In addition, T Tauri stars are known to drift from their birth places typically with (e.g. Herbig 1977). Thus, the cluster crossing time for the case of IRAS06548-0815 is yr (i.e. about the time required by an adiabatic perturbation to cross the primitive knot), which is to be considered approximately the age of the complex. Yet no report about the nature of its constituyents was found in the literature by us, except for two failed studies in radio wavelengths searching for massive (young) star formation (Codella et al. 1995; Magnier et al. 1999). Moreover, a closer inspection of the 2MASS near-infrared (NIR) images of IRAS06548-0815 revealed us a tight spherical cluster of stars tightly packed into a small volume (stellar density pc-3, see Figure 2), remembrancing other (bright H) knots of known youth.
Little is known about the region. Besides the information given in the Dark Nebulae Catalog (LDN, Lynds 1962) and the IRAS Point Source Catalogue (Neugebauer et al. 1988), only other five references covering the time span from 1850 to 2011 were retrieved from the ADS, namely Maddalena et al. (1986), Codella et al. (1995), Hilton & Lahulla (1995), Magnier et al. (1999) and Magakian (2003), but non of them discuss the nature of the associated nebulous stars.
Regarding IRAS06547-0810, besides the Dark Cloud Nebulae and the IRAS catalog, no other references were retrieved by SIMBAD. Only a single star is seen to be associated with the source in both POSS (blue & red) prints, and in the off-set guider monitors of the 2.1 and 0.84 m telescopes, as well as in the 2MASS infrared images. From its infrared colors, the infrared source seems a normal reddened blue star and is located about half way on the dust-lane (i.e. LDN 1655) joining IRAS06548-0815 with BD-07 (c.f. Figure 1). Spectroscopy of IRAS06547-0810, together with that of other R- or N-stars in the region and their corresponding near infrared photometry enables us to directly estimate the distance to LDN1655, which has not been done previously.
This paper is organized as follows: describes the observations and reduction techniques; contains the spectroscopic results of the optically bright stars associated with IRAS06548-0815, and of the (single) stars exciting IRAS06547-0810, NJ065703.0-081421 and NJ065714.1-081016; in we derive a distance to LDN 1655, based on our spectroscopic results and the 2MASS photometry; in we locate the bright stars associated with IRAS06548-0815 and LDN 1655 in the Hertzprung-Russell diagram; in we discuss the expected errors; and finally, in we discuss our results and give our conclusions.
2 Observations and data reduction
2.1 The observations
In January 2006 we acquired low-resolution spectra ( at H) of the brightest stars associated with IRAS06548-0815. We used the Italian Boller & Chivens spectrograph attached to the f/7.5 Cassegrain focus of the 2.1-m telescope of the Sierra San Pedro Mártir National Astronomical Observatory (SPMO), with the SITE #3 CCD light detector. a array with pixel size , and a CuHeNeAr arc lamp to calibrate in wavelength the dispersion axis. The detector was masked for our convenience to a width of 275 pixel perpendicular to the dispersion or right ascension axis. The plate scale is 0.347 ”/pix. This CCD detector is linear over a wide dynamical range222more details in www.astrossp.unam.mx/Instruments/ccds/ccdcal/, with no significant fringing even by Å. The slit had an effective aperture of 150 m (or , sky projected). A diffraction grating with a 600 lines mm-1 ruling and blazed at was used in the first order for the observations. The grid angle was fixed at , optimizing the spectral resolution by the H region (spectral resolution = 3.9 Å ). The central wavelength of the spectrograms was Å and the spectral range covered was ÅÅ, with a dispersion of 2.07 Å , but since the detector’s surface normal was tilted with respect to the optical axis in the dispersion direction, the spectral resolution degraded accordingly and the spectrograms became noiser and wider at wavelengths shorter than about 5500 Å, concentrating our analysis at longer wavelengths than this. The spectral region observed was leaned to the yellow-red spectral region where the NaI-D, H, LiI Å, CaI Å, the [OI], [NII] and [SII] nebular lines are, as well as the TiO bands. Typically we obtained spectrograms with S/N ratio (i.e. mÅ precision in the measured line equivalent widths). Stars G and G1 (see Figure 2) seemed to be nebulous in the off-set guider monitor with an integration time of 15 s and were included in the present survey.
A second run was allotted to the program in February 2008 with the SPMO 84 cm telescope (f/15). The B&Ch spectrograph (model 26767) was attached to its Cassegrain focus, provided with a Bausch & Lomb diffraction grid (ruled to 400 lines mm-1 and blazed at to optimize first-order observations). The CCD SITE #3 and its respective housing were used to register the spectrograms. The spectrograph’s slit had discrete width settings: we used the 80 m (131 sky-projected) slit width, since it met better our requirements. The seeing was measured from the (guided) FWHM intensity tracings and was 5, normally 10. The grid angle was set at to embrace the spectral range of the 2006 observing run at the 2.1 m telescope. The same CuHeNeAr arc lamp was used to calibrate in wavelength the dispersion axis. The resulting dispersion and resolution at H were 3.07 Å/pixel and 6.1 Å, respectively. The same alignment issue of the detector we had in the previous run at the 2.1 m telescope persisted, combined with more serious alignment problems of the dewar with spectrograph. As a result of this, the spectrogram tracings flared for shorter wavelenghts, making them useless for our purposes at wavelenghts Å. The sky-projected pixel size was 0393 at H. S/N ratio of the spectrograms was typically (i.e. mÅ precision in the line equivalent width measurements), about 10 for the weaker stars. In the 2008 run the observations were near their limit of detection in a reasonable integration time ( sec) for a useful spectrogram.
2.2 Data reduction
The reduction of the spectrograms was done following standard procedures with IRAF333Image Reduction and Analysis Facility by NOAO, operated by AURA, Inc. (NSF-USA). software package (Massey et al. 1992). The resulting spectrograms were normalized for spectral classification purposes. Once a broad classification was estimated, to obtain the finer spectral types of the program stars, a cross-comparison of the problem spectrograms with those of Jacob et al. (1984) and the SPMO libraries of spectrograms of stars with known MK spectral types was carried out, and when necessary, assisted by the Moore (1945) multiplet table for line identification purposes (see also Chavarría-K et al. 1979). The TiO band heads were also considered, particularly for the noisier spectrograms of the cooler stars. Except for the Balmer lines and the NaI-D and CaI resonance lines, the ratio of different lines for an even finer effective stellar temperature or luminosity determination were senseless because of the noise of the spectrograms (see Figures 3 to 5). The resulting spectral types of program stars are given in Table 1, column 4. The brighter and weaker stars had uncertainties in their classification of about 1 and 2 – 2.5 subclasses, respectively, and their assumed luminosity classes are given in parenthesis (see also ).
3 Spectroscopic results
Figures 3, 4 & 5 display normalized intensity spectrograms of the program stars, shifted vertically by arbitrary amounts and where strong Hα lines were truncated to enhance weaker photospheric lines and for clarity purposes. Table 1 summarizes the resulting MK spectral classification and the nature of the program stars. The nature of a given program star was ascribed taking into account its morphology, its MK spectral class, line emission spectra and the intensity of the LiI resonance absorption compared with the CaI absorption line (i.e. the W(LiI)/W(CaI) line ratio). From medium and high resolution spectra of a representative sample of T Tauri stars we call the attention to the reader that, Wichmann et al. (1999) conclude that medium-resolution spectroscopy ( Å) is a robust tool to single out stars with high lithium content.None of their Li-rich stars observed with medium-resolution proved wrongly classified with the follow up high dispersion data.
The spectral survey of the IRAS06548-0815 region revealed previously unknown pre-main sequence stars: we found two Herbig-emission stars, two classic T Tauri and four weak-line T Tauri stars, and two probable lithium-rich stars. Additionally we found that IRAS06547-0810 is excited by a single B1 V star associated with reflection nebulosity, and that NJ065703.0-081421 and NJ065714.1-081016 are an A6 Vp star and a B3/B4 V star, respectively. For other relevant data of the program stars, consult Table 1.
| star | Sp.T. | W(H) Å | W(LiI) Å | W(CaI) Å | run | membershipaam = member of IRAS06548-0815 cluster; nm = not member of the dark cloud and/or trapezium; dcm = member of the dark cloud | remarks | ||
|---|---|---|---|---|---|---|---|---|---|
| A | 06h 57m 0920 | -08 20 422 | F5 V | 8.9 | 0.05bbUncertain, the line is at about the continuum noise level | 2.1 m | nm | frgrd. | |
| B | 1435 | 19 56 | B2 (V)p | - 79.8 | – | – | 2.1 m | m | Herbig Ae/Be |
| C | 14 | 19 51 | K5/K6 (V) | -106.7 | 1.5 | 1.4 | 84 cm | m | CTTS |
| D | 14 | 20 04 | B2/B3 Vp | 7.2 | – | – | 2.1 m | m | nebulous, |
| E | 15 | 19 56 | F9 V | 38.7 | 3.1 | 0.05 | 84 cm | m? | WTTS |
| F | 1539 | 20 04 | G0dduncertain, the spectrogram lacks key lines for its spectral type V | - 14.9 | 0.4 | 0.9 | 2.1 m | m? | Li-rich:bbUncertain, the line is at about the continuum noise level |
| G | 1539 | 23 59 | A8/A9 V | - 8.5 | – | 2.1 m | dcm | Herbig Ae/Be | |
| H | 1939 | 20 11 | K1 (V) | -134.6 | 0.2 | 0.2 | 2.1 m | m | CTTS |
| H1 | 1871 | 20 13 | K2/K3 (V) | 4.8 | 0.3 | 0.2 | 2.1 m | m | WTTS |
| i | 1126 | 19 42 | F7 V | 5.0 | – | – | 84 cm | nm | field star(?) |
| l | 1218 | 21 23 | K4 (V) | 7.5 | 0.6 | 2.2 | 84 cm | m? | Li-rich:bbUncertain, the line is at about the continuum noise level |
| J | 1917 | 20 28 | K5 (V) | 2.1 | 0.3 | 0.3 | 2.1 m | m | WTTS |
| j | 1985 | 19 58 | –cclate K or later type star. | – | – | – | 84 cm | ? | noisy, NaI D abs present. |
| k | 1481 | 18 56 | G7/G8 (V) | 3.5 | 1.0 | 0.05bbUncertain, the line is at about the continuum noise level | 84 cm | m | WTTS |
| G1 | 2449 | 24 07 | A8 V | 10.3 | 0.1 | 0.2 | 2.1 m | nm | field star |
| IRAS06547-0810 | 0804 | 14 25 | B1 V | 3.0 | – | – | 2.1 m | cm | |
| NJ065703.0-081421 | 0360 | 14 15 | A7 Vp | 7.8 | – | – | 2.1 m | cm | abs. 5848Å? |
| NJ065714.1-081016 | 1450 | 10 15 | B3 Ve | 12.8 | – | – | 2.1 m | cm? | em. 6375Å? |


4 Distance to LDN 1655
LDN 1655 (catalog ) is in the proximity of the “Southern Filament” CO cloud (Maddalena et al. 1986, see also López et al. 1988), located at about north of the Southern Filament and west of NGC2316 (catalog ), i.e. pc and pc, respectively, assuming a distance d kpc to the cloud. The Southern Fillament is a continuous bridge of CO emission joining the molecular cloud Mon R2 with the CMa OB1 association, as the CO velocities varies smoothly between these two regions (Maddalena 1986). On the one hand, based on the star-count method, these authors obtained a “crude distance estimate” of pc to the “Cross-Bones” CO cloud, located in the Southern Filament and López et al. (1988) cite a kinematic distance of 1.1 kpc to the nearby galactic cluster NGC2316 (i.e. LDN 1654). But both methods above can have large inaccurancies. On the other hand, from photometric observations of the stars exciting several reflection nebulae and hence presumably associated with the Mon R2 (catalog ) cloud, the Southern Filament (catalog ) and westward of CMa OB1 (catalog ), the (more accurate) photometric distances of 830 pc, 912–1060 pc and 1200 pc,respectively, were found by different authors (van den Berg 1966; Racine 1968; Herb & Racine 1976; Eggen 1978; Clariá 1974 a &b). Since the CO radial velocities vary gently from one end to the other of the above regions, interpolating these photometric distances with the corresponding CO velocity of the “Cross Bones´´ CO cloud given by Maddalena et al. (1986), we estimate here a distance of kpc to the Southern Filament/Cross-Bones cloud. Moreover, the Southern Filament extends about 230 pc along the line of sight and about 300 pc along the plane of the sky (Maddalena et al. 1986). However, by inspecting the surface stellar density around the region on the Palomar sky survey prints and considering the non-detection of CO between LDN 1655 and the Southern Filament or NGC2316, LDN 1655 may not belong to the Southern Filament complex at all.
Considering that the R- or NJ-stars illuminate their immediate surrounding dust thus indicating us that they (most probably) are physically associated to the dust cloud LDN1655, one can estimate the dark cloud’s distance, if the appropiate data of the associated stars is known (i.e. photometry and MK spectral types). Here we give the spectral types of five R-stars associated with LDN 1655, namely NJ065703.0-081421, NJ065704.1-081016, IRAS06547-0810 and stars D & E of IRAS06548-0815 (cf. Figure 2, Table 1), which combined with their 2MASS near-infrared photometry allows us to obiain the (photometric) distance to the dark cloud, which is more accurate than any kinematic estimate.
According to their spectral types given in Table 1, we proceeded to determine the average total interstellar absorption in the K-band that results from the color excesses E(J-K), E(J-H) and E(H-K) of the individual stars (c.f. Table 3). The color excess in a given color is given by the relation
| (1) |
were the subscript distinguishes the intrinsic from the observed color. The ’s stand for the magnitudes of the passbands J, H,and K . The intrinsic colors of the stars and the interstellar extinction law we adopted are those given by Koornneff (1983) and Mathis (1990), respectively (see also Chavarría-K et al. 1987). They were used to deredden the (observed) K magnitudes of the R-stars correspondingly with the expression
| (2) |
where is given in Table 2 and is the observed color excess of the program star in question.
| 1.579 | 1.016 | 0.618 | 0.382 |
With help of the i.s. extinction law of Table 2 and the color excesses of the program stars given in Tables 3 & 4 , the average unreddened magnitudes of the program stars are readily calculated with the expression
| (3) |
for all stars of Tables 3 & 4, except for the classic T Tauri star IRAS06548-0815 C because of its large infrared excess in K: its J magnitude was corrected for interstellar absorption using Eq. 2 and the (observed) E(J-H) color excess and with help of its suitable intrinsic color, we derived the unreddened visual magnitude of this star.
One can derive the distance to a star from its dereddened infrared apparent magnitude and the absolute K magnitude corresponding to its MK spectral type directly or calculate its deredden visual magnitude from its with help of the intrinsic colors corresponding to its MK spectral type and, with its absolute visual magnitude , estimate its distance from the observer. Since the former method intrinsically depends from (the calibrations of) the latter, we have chosen here this last procedure. The unreddened visual magnitudes of the program stars were obtained from their (average) dereddened magnitudes by adding the intrinsic color corresponding to their MK spectral type (Koornneeff 1983). From these results, together with the Schmidt-Kaler (1982, SK82 hereafter) absolute magnitude MV vs. MK spectral type calibration for main sequence stars, we estimated the distance moduli of the individual stars. The distance to the dust cloud was obtained by averaging the distances of the individual objects given in Table 3. This method has the advantage that for a (relatively) small uncertainty in the near-infrared color excesses and hence in the dereddened K magnitude derived from Equation (2) remains small in the corresponding , regardless of the adopted interstellar extinction law444for the i.s. extinction law is the same for diffuse dust and for outer dark cloud environment .(Chavarría-K et al. 1987, Mathis 1990).
| star | Ks | E(J-H) | E(H-K) | E(J-K) | bb | D(pc) | |||
|---|---|---|---|---|---|---|---|---|---|
| NJ065703.0-081421 | 11.80 | 0.05 | 0.05 | 0.08 | 0.00 | 11.82 | 12.27 | 10.07 | 1033 |
| 02 | 03 | 05 | 08 | 02 | 03 | 04 | 05 | 103 | |
| NJ065714.1-081016 | 13.51 | 0.46 | 0.13 | 0.59 | 0.35 | 13.16 | 12.59 | 14.19 | 6887ccNot considered in the distance estimate of LDN1655, see text for details |
| 04 | 06 | 07 | 03 | 03 | 05 | 05 | 06 | 700 | |
| IRAS06547-0810 | 9.34 | 0.74 | 0.35 | 1.09 | 0.66 | 8.68 | 7.92 | 11.12 | 1675 |
| 02 | 03 | 05 | 02 | 03 | 04 | 05 | 05 | 168 | |
| IRAS06548-0815B | 10.96 | 0.86 | 0.57 | 1.43 | 0.88 | 10.08 | 9.41 | 11.81 | 2301 |
| 02 | 03 | 05 | 02 | 03 | 04 | 04 | 05 | 230 | |
| IRAS06548-0815D | 11.30 | 0.71 | 0.40 | 1.10 | 0.67 | 10.63 | 10.01 | 12.01 | 2523 |
| 02 | 03 | 04 | 03 | 03 | 04 | 05 | 06 | 252 | |
| mean of 4 stars | |||||||||
Note that star NJ065714.1.1-081016 either does not belong to the dark cloud (it deviates too much from the mean of the 5 stars) or it was misclassified spectroscopically (too early a spectral type for its apparent K magnitude), or it is a Herbig Ae/Be star but then it lacks key spectral features of pre-main sequence stars. Discarding this star from the rest, we obtain a mean distance of kpc to the cloud (more details in ), supporting the nonmembership of LDN1655 to the Southern Filament complex. Also noteworthy is that NJ065714.1.1-081016 is the brightest star among several stars in its immediacy (located southwest of NJ065714.1.1-081016), apparently associated with nebulosity that seen in the 2MASS Ks image conform an arch of weak reddened stars, an indication of another possible (localized) low mass star forming region associated with LDN1655.
5 IRAS06548-0815 and LDN 1655 selected stars in the HR-diagram
Following the procedure outlined in , we corrected the 2MASS magnitudes of the program stars for i.s. extinction. Using Koornneff’s intrinsic colors we derived from , their corresponding dereddened visual magnitude and, assuming a distance D = 1.9 kpc to LDN 1655, their absolute magnitudes Using the calibration of the bolometric correction BC with spectral type of SK82 we obtained the absolute bolometric magnitudes of the program stars. The luminosities were derived with the expression
| (4) |
where and are the stellar and Sun luminosities, and and are the stellar and solar absolute bolometric magnitudes, respectively.
| star | aaIs the arithmetic average of the AK’s that result from the individual stellar color excesses E(J-H), E(H-K) and E(J-K) and the relation summarized in Table 2. | M∗ | age [yr] | M | |||
|---|---|---|---|---|---|---|---|
| AbbForeground star | -0.0f4cc is assumed zero. | 9.56 | 10.57 | -0.89 | — | — | — |
| B | 1.16 | 9.80 | 9.13 | -4.54 | 3.67 | 8 | |
| C | 2.43 | 7.44ddIR excess in K; stellar luminosity, age and mass derived fitting the SED to the J magnitude, where the infrared excess is the smallest. | 10.44 | 3.63 | 0.41 | 1.1 | |
| D | 0.95 | 10.35 | 9.78 | -3.68 | 3.33 | 7 | |
| EddIR excess in K; stellar luminosity, age and mass derived fitting the SED to the J magnitude, where the infrared excess is the smallest. | 0.82 | 10.26 | 11.43 | 0.06 | 1.88 | 4.2 | |
| F | 0.06 | 12.54 | 13.76 | 2.26 | 0.95 | 2.1 | |
| G | 0.80 | 9.51 | 10.13 | -1.29 | 2.37 | 6 | |
| G1 | 0.53 | 13.76 | 14.32 | 2.90 | 0.70 | 1.7 | |
| H | -0.28cc is assumed zero. | 12.62 | 14.62 | 2.93 | 0.69 | 2.5 | |
| H1 | 1.00 | 11.40 | 13.77 | 1.99 | 1.06 | 3.0 | |
| i | 0.33 | 12.23 | 13.62 | 2.15 | 0.85 | – | – |
| l | -0.18cc is assumed zero. | 12.79 | 15.54 | 3.67 | 0.39 | 2.0 | |
| J | 0.18 | 12.95 | 15.95 | 3.91 | 0.29 | 1.3 | |
| j | |||||||
| k | -0.02cc is assumed zero. | 12.28 | 13.88 | 2.21 | 0.93 | 1.4 |
The resulting luminosities are given in Table 4 and the effective temperatures used to construct Figure 6 were taken from the calibration by SK82 for main sequence stars. The locations of the program stars in the HR diagram are shown in Figure 6. The following results for the program stars were inferred from their location in the HR-diagram in combination with the PMS evolutionary tracks of Siess et al. (2000) computed on line:
-
i)
Stars IRAS06548-0815 A & G1 (see Figure 2) are, most likely, foreground objects.
-
ii)
The CTTS nature of star C derived spectroscopically is congruent with its position in the HR-diagram. Star H occupies the lower bend or transition from convective to a radiative evolutionary path (see Fig 5) and could be a T Cha-like star that mimicks CTTS as well as WTTS alike.
-
iii)
Stars H1 and k are spectroscopically WTTS, but star H1 could be a T CHa-like star. The WTT star J occupies the lower bend or transition from a convective to a radiative evolutionary path too.
-
iv)
The lithium-rich stars F and l evolve radiatively towards the main sequence.
-
v)
Considering the uncertainties involved, star i could be a member of the IRAS06548-0815 dark cloud if its luminosity class III we suggest here is correct.
-
vi)
Stars B (mass ) and G (stellar mass ) are Herbig Ae/Be stars.
-
vii)
IRS1 is most probably an O8 ( spectral subclass) star, assuming that it is a main sequence star and hence is the principal exciting star of the IRAS source and of the emission nebulosity detected in the north-northwest side of the visual cluster.
-
viii)
Star E occupies the locus of Herbig emission stars in the HR-diagram but does not show spectral features of the class. It probably is a foreground star.
-
ix)
The spectrogram of the late type star j is too noisy to draw any conclusion about its nature.
6 Error estimates
6.1 Errors in the MK spectral type classification
The main error in the determination of the MK spectral type of a given star lies in the signal-to-noise (S/N) ratio of the spectra of both the program stars and comparison stars, and in the assigned spectral classification of the program and comparison stars. Best achievements result when the two sets of spectra have reasonable signal to noise ratios (S/N), and about the same spectral dispersion and resolution, which is usually not the case.
After a first coarse estimate of spectral type of the program star in question that depends on the more conspicous lines/features present (or absent) in its spectrum, the normilized spectrogram of the program stars were interpolated between two or more (normalized) & similar spectrograms from a library of spectrograms of stars with known MK spectral types taken with a similar resolution, until a reasonable overall match between the program and comparison stars is achieved in temperature and luminosity classes. We mainly used the Jacoby et al. (1984) and the SPMO spectrogram libraries of stars with known MK spectral types to cross correlate them with the program stars until an (eyeball) overall best fit of the two was reached. It is our experience that following this procedure, an uncertainty of one spectral subclass or even less is expected for the brighter stars and about two subclasses for the fainter stars (e.g. Alcalá et al. 1996, Chavarría-K et al. 1979, 2005, Moreno-Corral et al. 2002, 2006). Because the later spectral type program stars were almost at the limit of the 84 cm telescope, and the signal to noise ratio of the resulting spectrograms degraded accordingly, an accuracy of 2.5 subclasses in the determination of their spectral class is more realistic. Spectral types of young stars derived this way by us and in common with other authors (e.g. Cohen & Kuhi 1979; Herbig 1977; Herbig & Bell 1988) compare well within the above given uncertainties. On the other hand, regarding the determination of luminosity class, the overall S/N ratio of the spectrograms of the program and comparison stars made them unsuitable for a reliable luminosity classification in terms of line ratios or the presence of luminosity sensitive photospheric lines. An exception are the (profiles of the) Balmer and strong H-like resonance CaI and NaI-D lines for early or intermediate and later type stars, respectively. In general, we assumed luminosity class V for the program stars (given between parenthesis in Table 1). We justify this assumption in terms of the youth of the star members of LDN 1655 and on the results obtained here.
6.2 Errors in the estimated distance to the dust cloud LDN 1655
The main sources of error in the distance estimate for the dark cloud LDN 1655 are, in order of importance,
-
i)
the uncertainties in the assigned spectral types of the associated nebulous NJ- or R-stars.
-
ii)
the uncertainties in the absolute magnitude vs. MK spectral type calibration.
-
iii)
the adopted intrinsic stellar colors,
-
iv)
the asumed reddening law and
-
v)
the errors in the 2MASS photometry.
Typical errors in the 2MASS infrared magnitudes of the brighter stars are (about twice as large for the fainter stars) and we consider them negligible when compared to other uncertainty sources involved. Fortunately, the interstellar extinction law for wavelengths m is practically the same for any sky region involved (e.g. Chavarría-K et al. 1987, Mathis 1990, and references therein), so we can consider it universal, and its contribution to the distance uncertainty is small. We expect a final visual magnitude error of the R-stars for stars earlier than F0V and for stars later than K1V when correcting their magnitude for reddening and then fitting them with the appropriate spectral energy distribution to obtain their average unreddened visual magnitude . On the other hand, an uncertainty of (at the most) 1.5 subclasses, for an average of the R-stars studied here ( B2 V), reflects an uncertainty of , and the error of the bolometric corrections with the stellar temperature is . The above uncertainties add up to an expected error in the distance modulus of a single star; however, four stars were involved in our distance estimate for the dark cloud, so the final uncertainty would be in its distance modulus, or an uncertainty of kpc for the photometric distance estimate for LDN 1655 of 1.88 kpc derived here, in contrast with the earlier estimates of 1.1 kpc with a formal error bar of kpc.
7 Discussion and conclusions
Assuming a distance of 1.1 kpc, except for stars G, IRAS06548-0815 E and H1, all other stars studied here (see Table 1) would be below the zams by 0.28 dex (V) or more. With kpc, they fall on or above the zams, giving support to the distance derived here. The accuracy of the photometric distance estimate given here can be significantly improved if the spectral type of NJ065714.1-081016 is redetermined, and more R-stars associated with LDN 1655 are observed spectroscopically (i.e. IRAS 06550-0805 and the two nebulous stars located at and , respectively. The stars associated with IRAS06548-0815 follow the loci of young intermediate and low-mass stars in the HR-diagram, confirming their PMS nature. The infrared source NIRS 1 most probably excites IRAS06548-0815 and its reflection & emission nebulosities (we observed a nebular emission at the NW tip of the cluster). IRAS06548-0815 C is the second brightest object in the K band associated with IRAS06548-0815, and is apparently a barely resolved binary at this wavelength. Spectroscopy to confirm the MK spectral type of NJ065704-081402 is recommended. The stellar masses and ages of the program pre-main sequence stars given in Table 4 were obtained by eye-fitting their location in the HR-diagram using the grid of evolutionary traces computed by Siess et al. (2000) and are approximate. Spectroscopy with better S/N ratio and resolution to confirm the MK spectral types is recommendend. Spectroscopy of the region about south-west of NJ065714.1-081016 may be rewarding.

Considering typical values of and for a given contraction phase towards the main sequence of the young stars classified here, as derived from the observational data (Cohen & Kuhi 1979), Herbig Ae/Be stars contract with a Helmholtz-Kelvin time scale555 yr. yr, CTTS are expected to cover their full convective or Hayashi evolutionary phase towards the main-sequence in a time scale yr, whereas the less active weak-line T Tauri stars (W(HÅ) cover their (radiative or Henyey) evolutionary phase towards the main sequence with a time-scale yr. Low-mass lithium-rich stars are young main sequence stars that still have their primal lithium content ( yr yr). Contrary to the times given above, Herbig Ae/Be, CTT, WTT and LiI-rich stars associated with IRAS 06548-0815 are dynamially coeval within the contraction/dispersion time of the complex (see Section 1 ), a significantly smaller than the shortest Helmholz-Kelvin time scale of its conforming stars. Although the age estimates of a significant portion of the project stars are of about the dynamical time scale of the IRAS06548-0815 knot, the evolutionary models predict larger ages fot the rest of them.
Nevertheless, given the time-scales in each evolutionary phase for the pre-main sequence and lithium-rich stars, a such admixture of objects constrained in such a small space (), IRAS06548-0815 is a remarkable region to study meticulously with better instrumentation.
References
- Alcalá et al. (1996) Alcalá, J.M., Terranegra, L., Wichman, R. et al. 1996, A&A Suppl.Ser., 119, 7
- Chavarría-K et al. (1979) Chavarría-K, C., Appenzeller, I. & Bertout, C. 1979 A&A Suppl.Ser., 36, pp 465–470
- Chavarría-K et al. (1987) Chavarría-K, C., de Lara, E. & Hasse, I. 1987, A&A, 171, 216-224
- Chavarría-K et al. (1989) Chavarría-K, C., Leitherer, C., de Lara, E., Sánchez, O., Zickgraf, F.-J. 1989 A&A215, 51-56
- Chavarría-K et al. (2005) Chavarría-K, C., Moreno-Corral, M. A., Terranegra, L., de Lara, E. 2005, RevMex A&A 41, 77-85
- Clariá (1974a) Clariá, J. J. 1974a, AJ 79, 1022
- Clariá (1974b) Clariá, J. J. 1974b A&A37,229
- Codella et al. (1995) Codella C., Palumbo, G. G. C., Parechi, G., Scappini, F., Caselli, P, Attolini, M. R. 1995, MNRAS276, 57-73
- Cohen & Kuhi (1979) Cohen, M., Kuhi, L.V. 1979 ApJS, 41, 743
- Eggen (1978) Eggen, O.J. 1978, PASP 90, 436
- Gyulbudagian (1995) Gyulbudaghian, A. L. 1995 Astrophysics, Vol. 38, No.1, pp 7 - 10
- Herbig (1977) Herbig, G. H. 1977, ApJ, 214, 747
- Herbig & Bell (1988) Herbig, G.H., Bell, K.R. 1988, Lick Obs.Bull. 1111
- Herbst & Racine (1976) Herbst, W., Racine, R. 1976, AJ 81, 840
- Hilton and Lahulla (1995) Hilton, J. & Lahulla, J.F. 1995, A&AS, 113, 325
- Jacoby et al. (1984) Jacoby, G. H., Hunter, D. A. and Christian, C. A. 1984 ApJS 56, 257
- Koornneeff (1983) Koornneeff, J. 1983, A&A128,pp 84-93 …
- López et al. (1988) López, J.A., Roth, M., Friedman, S.D. & Rodríguez, L.F. 1988 RMexA&A 16, 99-103
- Lynds (1962) Lynds, B.T. 1962, ApJS 7, pp 1-52
- Maddalena et al. (1986) Maddalena, R. J., Morris, M., Moscowitz, J., Thaddeus, P. 1986 ApJ, 303, 375-391
- Magakian (2003) Magakian, T. Y. 2003, A&A 399, 141-145
- Magnier et al. (1999) Magnier, E. A., Volp, A. W., Laan, K, van den Ancker, M. E., Waters,L. B. F. M. 1999, A&A 352, 228-238
- Massey et al. (1992) Massey, P., Valdes, F. and Barnes, J.: 1992, in A user’s guide to reducing slit spectra with IRAF
- Mathis (1990) Mathis, J. 1990 ARA&A 28, 37 – 70..
- Moreno-Corral et al. (1993) Moreno-Corral, M.A., Chavarría-K, C., de Lara, E., Wagner, S. 1993, A&A273, 619-632
- Moreno-Corral et al. (2002) Moreno-Corral, M. A., Chavarría-K, C., de Lara, E. 2002 RevMex A&A, 38, 141-159
- Moreno-Corral et al. (2005) Moreno-Corral, M.A., Chavarría-K, C., de Lara, E. 2005, RevMex A&A, 41, 69 - 76
- Moreno-Corral et al. (2006) Moreno-Corral, M. A., Chavarría-K, C., de Lara, E. 2006, RevMex A&A 42, pp 195-201
- Moore (1945) Moore, Charlotte. E. 1945, A multiplet table of astronomical interest, (Princeton, NJ: The Observatory Rev.)
- Neugebauer et al. (1988) Nuegebauer, G., van Druinen, R.J., Habing, H.J. et al. 1988 NASA RP-1190, Vol. 4, The Joint IRAS Science Working Group, QB470.154 1988
- Racine (1968) Racine, R. 1968, AJ 73, 233
- Schmidt-Kaler (1982) Schmidt-Kaler, Th. 1982, in Landolt-Börnstein New Seriies, Group IV, Vol2b, eds. K. Schaifers & H. H. Voigt (Berlin-Heidelberg-New York: Springer Verlag) p1 (SK82)
- Siess et al. (2000) Siess, L., Dufour, E., Forestini, M. 2000 A&A 358, 593–599
- Van den Bergh (1966) Van den Bergh, S. 1966 AJ71, 990
- Wichmann et al. (1999) Wichmann, R., Covino, E., Alcalá et al. 1999 MNRAS307, 909