Nernst effect in the electron-doped cuprate superconductor Pr2-xCexCuO4 :
Superconducting fluctuations,
upper critical field , and the origin of the dome
Abstract
The Nernst effect was measured in the electron-doped cuprate superconductor Pr2-xCexCuO4 (PCCO) at four concentrations, from underdoped () to overdoped (), for a wide range of temperatures above the critical temperature . A magnetic field up to 15 T was used to reliably access the normal-state quasiparticle contribution to the Nernst signal, , which is subtracted from the total signal, , to obtain the superconducting contribution, . As a function of , peaks at a field whose temperature dependence obeys ), as it does in a conventional superconductor like NbxSi1-x. The doping dependence of the characteristic field scale – shown to be closely related to the upper critical field – tracks the dome-like dependence of , showing that superconductivity is weakened below the quantum critical point where the Fermi surface is reconstructed, presumably by the onset of antiferromagnetic order. Our data at all dopings are quantitatively consistent with the theory of Gaussian superconducting fluctuations, eliminating the need to invoke unusual vortex-like excitations above , and ruling out phase fluctuations as the mechanism for the fall of with underdoping. We compare the properties of PCCO with those of hole-doped cuprates and conclude that the domes of and vs doping in the latter materials are also controlled predominantly by phase competition rather than phase fluctuations.
pacs:
73.50.Lw, 74.25.fgI Introduction
Cuprate superconductors have attracted enormous attention because they hold the record for the highest critical temperature , which can be as high as 164 K – halfway to room temperature. Gao et al. (1994) As a function of doping, displays a dome-like dependence, reaching a maximal value at some optimal doping. A fundamental question is: Why does not continue to rise with underdoping? A long-held scenario is that the pairing strength (and superconducting gap magnitude) does continue to rise, but the critical temperature for long-range coherence falls because of increasingly strong fluctuations in the phase of the superconducting order parameter. Emery and Kivelson (1995) So the underlying strength of superconductivity would become greater than suggested by the maximal (optimal) value of , and finding ways to increase phase rigidity could further increase the maximal .
The main experimental support for this phase fluctuation scenario came from the observation of a sizable Nernst signal above in underdoped cuprates such as La2-xSrxCuO4 (LSCO). Xu et al. (2000); Wang et al. (2006) The Nernst effect – the transverse thermo-electric response to a magnetic field – is large in the vortex-liquid state of type II superconductors, due to the motion of vortices. Vidal (1973) Consequently, the observation of a large Nernst signal well above in hole-doped cuprates was attributed to short-lived vortex excitations above . Xu et al. (2000) In this picture, Cooper pairs with a finite gap in their excitation spectrum survive to temperatures as high as . Defining the upper critical field needed to suppress superconductivity as the field where the Nernst signal vanishes, was found to increase with underdoping, and this was taken as evidence of a rising gap.Wang et al. (2003) A paradigm was born: while the superconducting gap and the upper critical field increase with underdoping, decreases due to phase fluctuations.
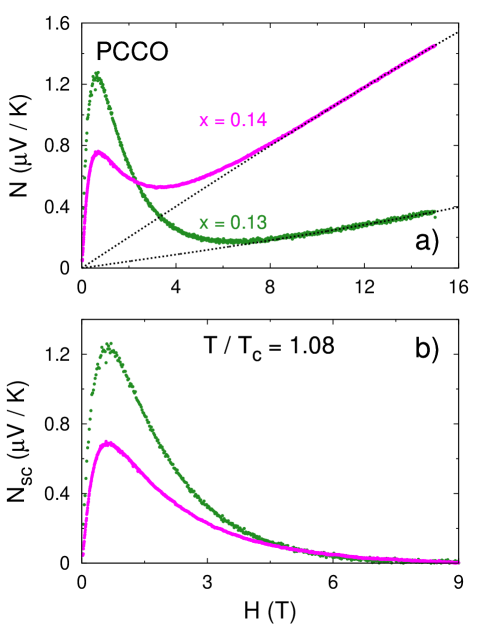
In recent years, it was shown that the three basic assumptions underlying this interpretation of the Nernst response in cuprates are invalid. The first assumption was that the quasiparticle contribution to the measured Nernst signal, , is negligible, so that all of the signal can be attributed to superconducting fluctuations. It has since become clear that can in fact be large in a variety of strongly correlated metals,Behnia (2009) including cuprates.Cyr-Choinière et al. (2009) For example, Nernst measurements in YBa2Cu3Oy (YBCO) and HgBa2CuO4+δ (Hg1201) reveal a large negative , easily disentangled from because its sign is opposite to that of the superconducting signal. Rullier-Albenque et al. (2006); Daou et al. (2010); Chang et al. (2010); Laliberté et al. (2011); Doiron-Leyraud et al. (2013) In these materials, starts to grow below the pseudogap temperature , and it becomes comparable in magnitude to at . In the electron-doped material PCCO, the two contributions are again readily resolved, even though both are positive in this case, because exhibits a peak at high temperature while peaks at , which is relatively low in this material. Balci et al. (2003); Li and Greene (2007) A similar two-peak structure is observed in the hole-doped material La2-x-yEuySrxCuO4 (Eu-LSCO). Cyr-Choinière et al. (2009) In LSCO, the material on which the early studies were based, is very similar to that of Eu-LSCO, but, because is higher in LSCO, its peak now merges with the peak in , and hence the two contributions are more difficult to disentangle. Cyr-Choinière et al. (2009)
The second assumption is that vanishes above . Nernst measurements on the conventional superconductor NbxSi1-x have revealed that a superconducting signal can persist to fields as high as (and to temperatures as high as ). Pourret et al. (2006, 2007) This countered the notion that superconducting fluctuations do not exist above . The third assumption was that fluctuations which persist up to 2-3 cannot be the usual Gaussian fluctuations of the superconducting order parameter, and hence these were attributed to unusual vortex-like excitations. In 2009, two groups arrived at a complete theory of Gaussian fluctuations in a dirty 2D superconductor, extending earlier work Ussishkin et al. (2002) to arbitrary temperatures and fields. Serbyn et al. (2009); Michaeli and Finkel’stein (2009) This theory was able to explain in detail and quantitatively the NbxSi1-x data, proving that standard fluctuations can indeed persist up to and .
The failure of these three assumptions and the advent of the new theoretical framework imposed a complete re-examination of the Nernst effect in cuprate superconductors. This started with a study of the hole-doped cuprate Eu-LSCO, in which was shown to behave in the same way as it does in NbxSi1-x and to agree with Gaussian theory. Chang et al. (2012a) The characteristic field extracted directly from the data – which we show here to be approximately equal to – was found to be very low in the underdoped regime. The authors also re-analyzed the published Nernst data on other hole-doped cuprates to show that in fact decreases with underdoping,Chang et al. (2012a) in contrast to the prior report of an increasing . Wang et al. (2003) However, because the Eu-LSCO study was limited to dopings on the underdoped side of the dome, it did not allow for the ultimate test: to compare the nature of superconducting fluctuations on the two sides of the dome, and see whether there is a fundamental difference, or not.
In this Article, we report a study of superconducting fluctuations in the electron-doped cuprate PCCO that extends across the phase diagram, allowing us to compare both sides of the dome. This cuprate offers a major advantage in that its critical magnetic field at all dopings is low enough that fluctuations can be fully suppressed by applying only 15 T, thereby allowing a careful extraction of the underlying quasiparticle contribution, . This is essential for a detailed analysis of . We find that obeys Gaussian fluctuation theory quantitatively – compelling evidence that fluctuations in this cuprate are not unusual, on either side of the dome.
We extract directly from the data and find that it tracks as a function of doping, with and both showing a dome that peaks at the same critical doping. This doping is where the Fermi surface of PCCO is known to undergo a reconstruction,Dagan et al. (2004) due to the onset of a competing phase that breaks translational symmetry, presumably antiferromagnetic order.Lin and Millis (2005) We conclude that superconductivity in electron-doped cuprates weakens below optimal doping not because of superconducting phase fluctuations but because of phase competition. Comparing with the properties of hole-doped cuprates, we argue that the same conclusion applies for hole-doped materials.
II Previous work
The Nernst effect in PCCO has been measured previously, on thin films with . Balci et al. (2003); Li and Greene (2007); Fournier et al. (1997) A sizable was detected above in underdoped samples, but not in overdoped samples. As a result, Gaussian theory was tentatively ruled out and the signal was attributed to phase fluctuations which go away with overdoping. In our study, an improved signal-to-noise ratio and a higher magnetic field allow us to clearly detect in the overdoped regime. We find that there is in fact no qualitative difference between overdoped and underdoped behavior. For , our data are consistent with previous data.
III Methods
We measured four Pr2-xCexCuO4-δ thin films to cover underdoped (), optimally doped (), and overdoped () compositions. The epitaxial thin films with [001] orientation were grown by pulsed laser deposition on LSAT substrates [(LaAlO3)0.3(Sr2AlTaO6)0.7] using Cu-rich targets to eliminate parasitic phases.Roberge et al. (2009)
Typical sample dimensions are mm, with a thickness of . The Nernst effect was measured using one heater, one differential thermocouple, and one absolute thermocouple.Bougrine and Ausloos (1995) We used non-magnetic type E thermocouples made of chromel and constantan wires. Resistivity measurements were performed in a Quantum Design PPMS. The electrical and thermal currents were applied along the basal plane of the tetragonal crystal structure, and the magnetic field was always applied perpendicular to the basal plane, i.e. along the axis. The critical temperature is defined as the temperature where the resistivity goes to zero; the values are listed in Table 1.
| (0) | |||
|---|---|---|---|
| (K) | (T) | (T) | |
| 0.13 | 8.8 0.3 | 3.4 0.3 | 2.1 0.2 |
| 0.14 | 17.4 0.1 | 10.1 0.5 | 4.3 0.3 |
| 0.15 | 19.5 0.1 | 8.9 0.4 | 5.4 0.3 |
| 0.17 | 13.4 0.1 | 3.0 0.2 | 3.0 0.3 |
IV Results
IV.1 Resistivity, and
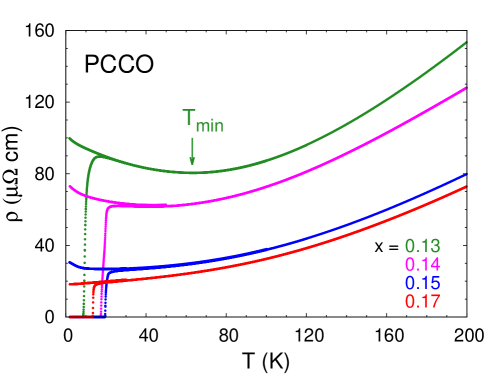
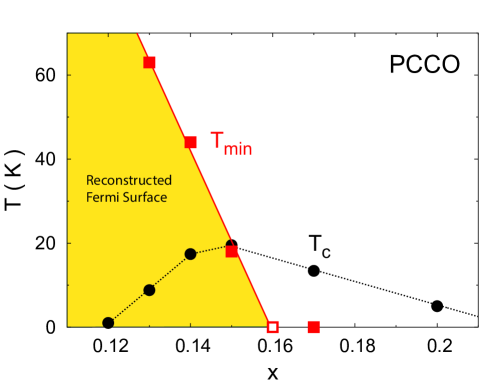
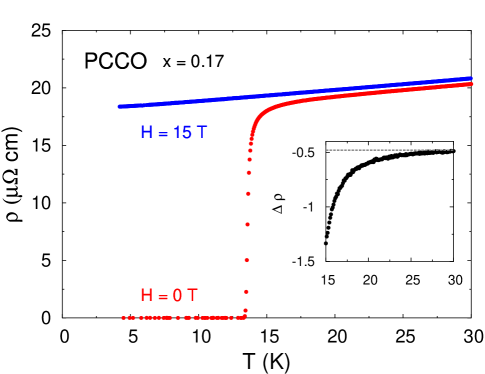
Figure 1 displays the resistivity data, vs , for our four samples, at to show the superconducting transition and at T to show the normal state behavior. The values are plotted in Fig. 2. As in all cuprate superconductors, has a characteristic dome-like dependence on doping. Except at , all normal-state resistivity curves show a minimum, at a temperature which increases with decreasing . Fig. 2 shows the doping evolution of , seen to extrapolate to zero at . This is also the critical doping where the normal-state Fermi surface of PCCO at is known to undergo a reconstruction, detected as a sudden change in the Hall coefficient , going from small and positive at to large and negative at . Dagan et al. (2004); Charpentier et al. (2010) This Fermi-surface reconstruction (FSR) is attributed to a quantum critical point (QCP) below which some ordered phase sets in, at = 0.16 (in the absence of superconductivity). Measurements of the Hall coefficient at T in our own thin films find that in the low temperature limit, in our sample with and in our sample with , confirming that the normal state QCP at which FSR occurs in our samples is , in excellent agreement with prior data. Dagan et al. (2004); Charpentier et al. (2010) The FSR is also responsible for the upturn in at low . The resistivity at is strictly linear in below 40 K, in agreement with previous reports.Fournier et al. (1998); Jin et al. (2011) The absence of any upturn shows that is above the critical doping ; the linearity shows that it is close to the QCP. Our resistivity data as presented in Fig. 1 and 2 provide a guide to the reconstruction of the Fermi surface in PCCO and forms the basis of our discussion in Sec. V.1, where we elaborate on the QCP and the FSR, phenomena that are fundamental for understanding the superconducting phase diagram.
IV.2 Vortex solid melting field
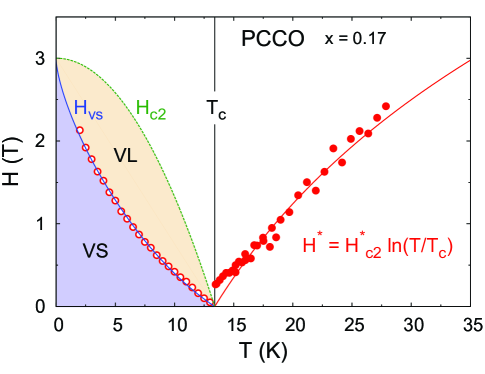
Having displayed the doping dependence of the critical temperature , we now turn our attention to a second fundamental quantity, the critical magnetic field needed to suppress superconductivity. We call the critical field above which the electrical resistance of the sample ceases to be zero. In a type-II superconductor like PCCO, this is the field at which the vortex solid melts, hence the labeling. We measured the resistivity of our PCCO films at different temperatures below to track the temperature dependence of at each doping. The resulting field-temperature phase diagram is shown in Fig. 3. At all dopings, has the typical behavior of cuprate superconductors, with positive curvature.
Above the line, the electronic state is a vortex liquid. The question of where this vortex liquid ends in cuprates has been the subject of much debate.Kivelson and Fradkin (2010) Recently, it was shown that measurements of the thermal conductivity can be used to answer that question.Grissonnanche et al. (2014) In three hole-doped cuprates, it was found that there is no vortex-liquid phase at . Grissonnanche et al. (2014) In other words, with decreasing field, at , vortices appear precisely at (0). This provides a convenient empirical procedure for determining the upper critical field , namely = (0). Of course, with increasing temperature, the vortex-liquid phase grows.
To extrapolate to , we use the standard expression for the temperature dependence of ():Blatter et al. (1994); Houghton et al. (1989); Ramshaw et al. (2012)
| (1) |
in terms of the reduced field /(0) and reduced temperature . We use the same definitions for the Ginzburg and Lindemann parameters ( and ) as in ref. Ramshaw et al., 2012. In Fig. 3, we see that Eq. 1 fits the data well and allows us to obtain (0), whose value at each doping is listed in Table I. The same expression was also found to fit the data of hole-doped cuprates very well, in both underdoped and overdoped regimes. Grissonnanche et al. (2014); Ramshaw et al. (2012)
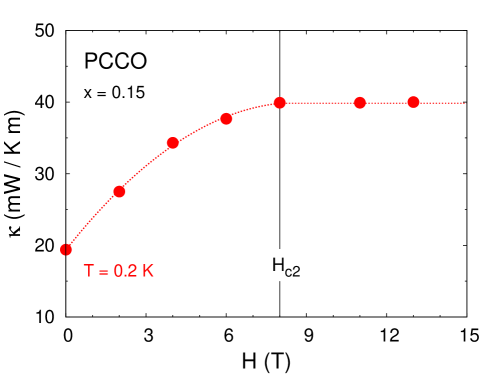
We can use existing thermal conductivity data to confirm that is indeed equal to () in PCCO. In Fig. 4, we reproduce published data taken at K on a single crystal of PCCO at optimal doping (, = 20 K). Hill et al. (2001) We see from those data that = 8 T, in excellent agreement with the value of (0) = 8.9 T we obtain by extrapolating () to (Fig. 3). A similar value for (0) is reported in prior studies. Fournier and Greene (2003)
IV.3 Nernst effect : overdoped sample ()
In presenting our Nernst data on PCCO, we begin with the overdoped sample at . There are two reasons for this initial focus. First, this sample provides a fundamental reference point for all Nernst studies of cuprate superconductors, missing until now. In an overdoped sample, the Fermi surface is neither reconstructed nor altered by a pseudogap: it is simply a single large hole-like cylinder, whose area is precisely given by the doping. In hole-doped cuprates, this -space area is proportional to ; Mackenzie et al. (1996) in PCCO, it is proportional to .Lin and Millis (2005) Moreover, in PCCO, we have a particularly simple crystal structure, which is tetragonal and free of bilayers, buckling, oxygen order or chains. Armitage et al. (2010) The Nernst data we report here can therefore be regarded as the archetype of an overdoped cuprate, the property of a single pristine CuO2 plane. Second, having data in the overdoped regime will enable us to make the first direct comparison of superconducting fluctuations on the left and right sides of the dome, and establish the differences, if any.
In Fig. 5, we show the in-plane resistivity of our sample, below 30 K. With increasing temperature, rises suddenly at K. Above , there is a regime of paraconductivity, where superconducting fluctuations reduce the resistivity from its normal-state value. The data at T provide the normal-state reference, modulo a small rigid shift in due to a positive orbital magneto-resistance. Note that paraconductivity can be seen up to 2 or so (see inset of Fig. 5).
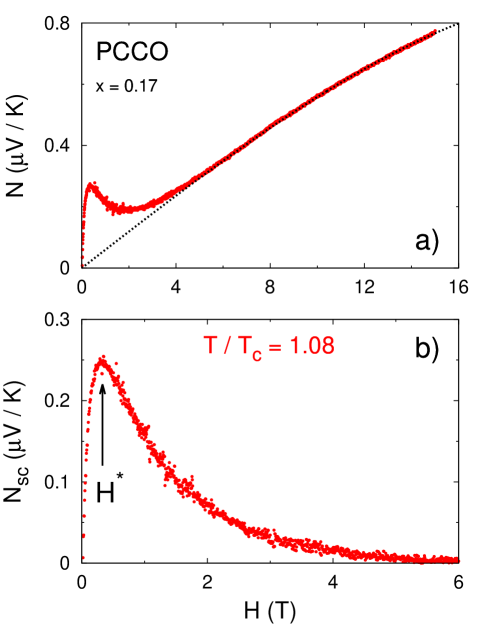
The raw Nernst signal as a function of field is shown in Fig. 6a, at . shows an initial rise with a subsequent fall on top of a smoothly increasing background. The peak at low field is due to superconducting fluctuations, , while the background is the normal-state quasiparticle signal, . The total Nernst signal is the sum of these two components:
| (2) |
To establish the background for each isotherm, we fit the data above 10 T to a power law:
| (3) |
The dotted line in Fig. 6a is a fit to Eq. 3. We see that it describes the raw data very well from T all the way to 15 T. Note that a cubic term is essential to capture the correct dependence of . In previous work, limited to lower fields,Li and Greene (2007) was assumed to have a purely linear dependence, but in principle all odd powers of are allowed by symmetry.
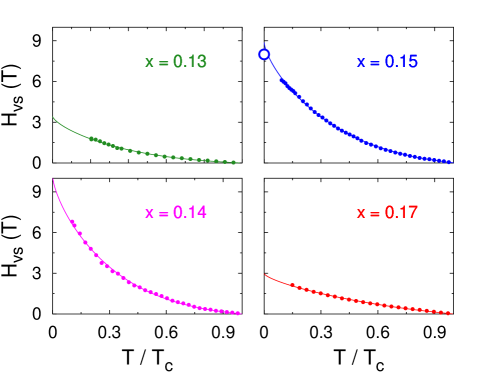
In Fig. 6b, we plot the superconducting signal = . It rises rapidly from zero, goes through a peak, and then decreases gradually, to eventually become vanishingly small at high field, for 2 or so. (It has been suggested that there may be an intrinsic limit to how high superconducting fluctuations can extend above (or ), associated with the uncertainty principle. Vidal et al. (2002); Soto et al. (2004)) This is a typical signal for a superconductor. In fact, displays these same features in all superconductors, at . In particular, there is always a peak field, which we label . We see that is a characteristic field scale for superconductivity in a given material that is directly and immediately obtainable from the data, with no assumptions and no model or theory.
As a function of temperature, decreases in magnitude, but the peak field increases. In Fig. 7, we show on a field-temperature phase diagram the temperature dependence of above , and also () measured on the same sample, below . In addition, we sketch the temperature dependence of the upper critical field (). () and () are images of each other on either side of , and for this reason has been called the “ghost critical field”. Kapitulnik et al. (1985) The data can be fit to a logarithmic dependence, such that
| (4) |
The prefactor is a single empirical parameter that characterizes the strength of superconductivity.
The dependence in Eq. 4 was explained intuitively by Pourret et al. in the context of NbxSi1-x thin films.Pourret et al. (2007) They proposed that the crossover from increasing to decreasing occurs because the length scale for superconducting fluctuations at low is set by the coherence length , while at high it is set by the magnetic length . would be the field where the two length scales become comparable, i.e. () (). Since and () , this yields .
The one-parameter fit to the data in Fig. 7 using Eq. 4 yields T (Table 1). (Note that the data deviate from the fit close to – an intrinsic effect explained in Sec. V.3.) This value can be compared with our estimate of for that same sample, obtained as the limit of the resistive critical field (), whose value is (0) T (see Table 1 and Figs. 3, 7). We arrive at a useful empirical result: the characteristic field scale encoded in superconducting fluctuations above , when defined as in Eq. 4, is equal to the field needed to kill superconductivity at . In other words, we now have a straightforward empirical procedure for measuring the fundamental field scale for superconductivity, , from superconducting fluctuations above . Note that this is for a single-band -wave superconductor.
In summary, superconducting fluctuations in overdoped PCCO, at , are detectable in up to and , and they can be used to measure . What is the nature of these fluctuations? As we show in Sec. V, not only does have precisely the field dependence predicted by Gaussian theory, its magnitude is in excellent agreement with theoretical expectation. We conclude that the superconducting fluctuations of an overdoped cuprate are now well understood.
| (nV/KT) | (nV/KT) | ( cm) | (nA/KT) | |
|---|---|---|---|---|
| 0.13 | 4560 | 4540 | 6515 | 4.31.0 |
| 0.14 | 1890 | 1790 | 4510 | 2.40.5 |
| 0.15 | 1060 | 960 | 253 | 2.30.3 |
| 0.17 | 1000 | 940 | 185 | 3.20.9 |
IV.4 Nernst effect : all dopings ()
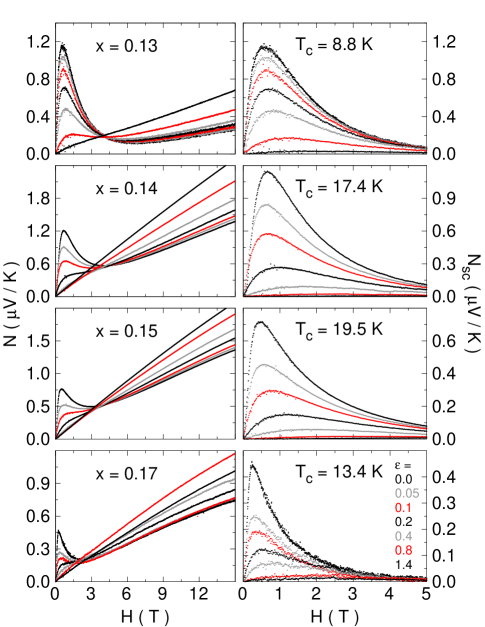
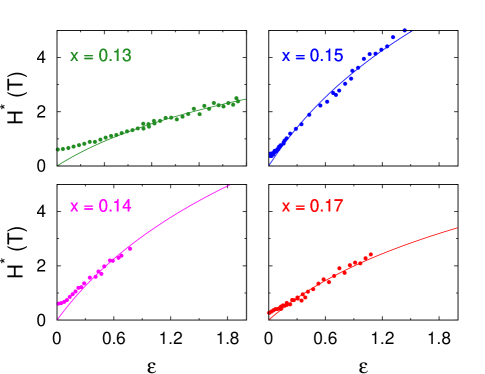
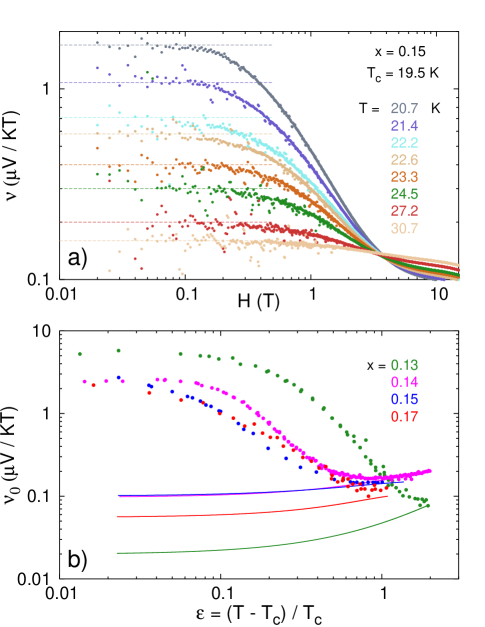
The left panels of Fig. 8 present a selection of raw Nernst isotherms, labelled by their reduced temperature , for each of the four samples. The superconducting Nernst signal is shown in the corresponding right panels. Examples of background subtraction are given in Fig. 9, for and . As in the sample, there is a large positive , mostly linear in , but with a small additional term. The peak field obtained from vs is plotted vs in Fig. 10 for the four dopings. A fit to Eq. 4 yields the values listed in Table 1, and plotted vs in Fig. 11. For all , the data deviate from the fit as , for reasons given in sec. V.3. In Fig. 12a, we plot the Nernst coefficient , defined as , vs . We see that it is flat at low , i.e. is linear as . In Fig. 12b, we plot the initial value of , which we call , vs . In Table 2, we list the values of for the four dopings, at , and compare these to theoretical expectation in Sec. V.3.
V Discussion
Having presented our data for the Nernst signal in PCCO as a function of , and , we now examine what they tell us about the nature of the superconducting fluctuations and the mechanisms that control the strength of superconductivity in cuprates.
V.1 Fermi-surface reconstruction
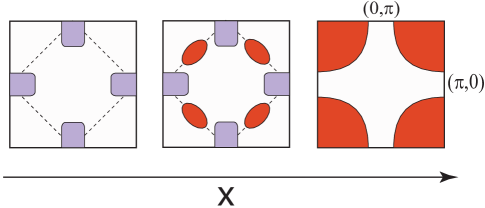
To make sense of the doping dependence of superconductivity in PCCO, it is essential to first describe the underlying normal state and how it evolves with doping. The key organizing principle is a quantum critical point at which the Fermi surface undergoes a major transformation. The evolution is sketched in Fig. 13. Above , the Fermi surface of PCCO is a single large closed hole-like cylinder, with a -space area given by . This is confirmed experimentally in several ways. First, in the limit of the Hall coefficient , where the carrier density carriers per Cu atom. Dagan et al. (2004) Second, the frequency of quantum oscillations detected in overdoped Nd2-xCexCuO4 (NCCO), a closely related material, is such that . Helm et al. (2009) Third, measurements of angle-resolved photoemission spectroscopy (ARPES) in NCCO see a large closed Fermi surface of the right area. Armitage et al. (2002); Matsui et al. (2007)
In the normal state at , achieved by applying a field , undergoes a sudden and dramatic change below = 0.16. It goes from small and positive to large and negative. Dagan et al. (2004) ARPES measurements on NCCO reveal a transformation as sketched in Fig. 13, whereby the large hole-like cylinder of the overdoped regime is reconstructed into two small pockets, respectively located at and , as the doping is reduced below . Matsui et al. (2007) This reconstruction is consistent with the observation of low-frequency quantum oscillations in NCCO, Helm et al. (2009) which reveal the existence of a small closed pocket in the Fermi surface, tentatively attributed to the pocket seen by ARPES near .
The evidence so far is consistent with a Fermi-surface reconstruction caused by the onset of a density-wave order with a wavevector ,Lin and Millis (2005) which could well be the commensurate Néel antiferromagnetic order observed by neutrons at low . Motoyama et al. (2007) In this case, the pocket at is electron-like and the pocket at is hole-like. One generically expects a Lifshitz transition to occur at a doping well below , where the hole-like pocket disappears, leaving only the electron-like pocket at (see Fig. 13).Lin and Millis (2005)
The FSR described here will affect all transport properties. In addition to the dramatic changes in , the resistivity also shows signatures of FSR, in particular the upturn in seen at low temperature (Fig. 1), which we attribute to the loss of carrier density. The temperature of the minimum in may then be viewed roughly as the onset of FSR as a function of temperature (Fig. 2). In the resistivity, the onset of FSR at also occurs at = 0.16, where , in agreement with the (0) data, but at K it only occurs at (see Fig. 2). In other words, the Fermi surface of PCCO at may be considered unreconstructed for .
For our study of superconductivity, what we immediately note is that falls with underdoping as soon as it crosses the line (Fig. 2). This strongly suggests that the cause of the dome is the FSR – or, more fundamentally, whatever causes the FSR. In the following sections, we bring support to this scenario of phase competition in two different ways: first, by showing that the characteristic field also falls below , forming a dome just like the dome; second, by showing that the superconducting fluctuations on both sides of the dome are not qualitatively different. These observations remove the need to invoke the emergence of phase fluctuations on the underdoped side.
V.2 Characteristic field and critical field
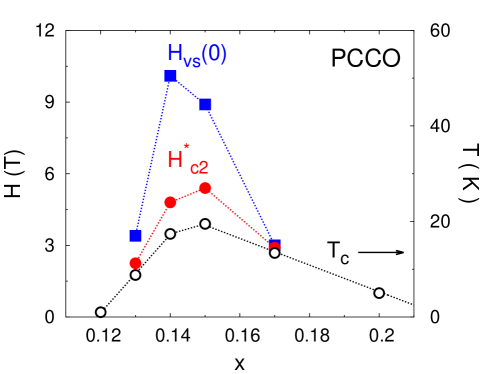
In Fig. 11, we plot as a function of . This is the field scale encoded in the superconducting fluctuations just above . We see that tracks , both showing a dome peaking at the same doping, namely . As already mentioned, this is the doping where FSR onsets for K (see Fig. 2). This shows that what causes to fall below also causes to fall, i.e. the coherence length to increase. Note that is an average of over the Fermi surface, where is the Fermi velocity and is the gap magnitude, so that changes in either or (or both) will affect , and hence .
Let us examine the evolution of more closely. At K, the Fermi surface is not reconstructed in going from to , so the Fermi-surface average of should be mostly unchanged. Therefore the increase in from 3.0 T to 5.4 T must be due to an increase in . We can check that by looking at the ratio /2, which should remain constant if only changes, since (in a simple model) and . At and , / mT / K2 and mT / K2, respectively. We see that within error bars, the rise in both and is driven entirely by an increase in . Moreover, the magnitude of is consistent with expectation for a dirty -wave superconductor. Indeed, using and expressions for given in Appendix A, we estimate that T and 5.1 T for and 0.15, compared to measured values of T and T, respectively. In summary, we understand the magnitude and doping dependence of in PCCO when its Fermi surface is not reconstructed.
Let us now see what happens when the Fermi surface is reconstructed. The Fermi surface changes from a single large pocket with a large to two small pockets with a much smaller . Helm et al. (2009) This will boost and (0), so the fact that nevertheless falls below implies that must necessarily decrease. In Fig. 14, a plot of the ratio (0) / 2 vs reveals that the enhancement of (0) due to the smaller gets gradually stronger with underdoping.
Note that when the Fermi surface changes we expect the ratio (0) / to change, because (0) is controlled by those -space regions with the smallest , while , and hence , is dominated by those regions with the largest (see Eq. 6 in Sec. V.3 and the discussion that follows), and the relative proportion of these regions will change. In Fig. 11, we see that while (0) = at , the FSR causes (0) to become larger than and drop at slightly lower doping compared to due to the details of FSR. Nevertheless, the main point is that the low value of at x = 0.13 is clear evidence that the gap is smaller at that doping (x = 0.13), than it is at x = 0.15.
The emerging picture is the following. With decreasing , starting at , the -wave gap grows, causing and to grow, until a critical doping where FSR sets in, whereupon superconductivity is weakened, and both and fall. The FSR is due to the onset of a density-wave state that breaks translational symmetry, and fundamentally it is this second phase that competes with superconductivity. Taillefer (2009, 2010) This type of phase competition scenario is observed in several families of unconventional superconductors, including the quasi-1D organic metals Vuletic et al. (2002); Doiron-Leyraud et al. (2009), the quasi-2D iron-based superconductors Chubukov (2012), and the quasi-3D heavy-fermion metals Mathur et al. (1998); Gegenwart et al. (2008), where in all cases the competing phase is a spin-density wave. The organizing principle in such a scenario is the QCP where the second phase sets in, invariably located inside the dome. We conclude that the fundamental mechanism for a dome of vs doping in PCCO is again phase competition, most likely also with a phase of antiferromagnetic order.Armitage et al. (2010)
V.3 Comparison to theory of Gaussian fluctuations
Until now, we have extracted information from without having recourse to any theory or model or assumption. We simply obtained directly from the data of vs , and then obtained directly from the dependence of . In this section, we compare our data in PCCO to the standard (Aslamazov-Larkin) theory of superconducting fluctuations. Larkin and Varlamov (2009)
The calculated quantity is the superconducting contribution to the transverse thermo-electric conductivity, , while the measured quantity is . The two are related as :
| (5) |
assuming (see Appendix B). In 2002, Ussishkin, Sondhi, and Huse calculated the thermo-electric response of a quasi-2D type-II superconductor in the Gaussian approximation, in the limits of and .Ussishkin et al. (2002) In 2009, calculations of in a dirty 2D type-II superconductor were extended to arbitrary and arbitrary by two groups independently,Michaeli and Finkel’stein (2009); Serbyn et al. (2009) who arrived at similar results. We now compare the magnitude and field dependence of measured in PCCO with the latest predictions of Gaussian theory.
V.3.1 Magnitude
In the limit of and , above is given, in two dimensions, by: Serbyn et al. (2009)
| (6) |
where nA/K is the quantum of thermoelectric conductance, Pourret et al. (2006, 2009) , and . The magnitude of is seen to depend on one quantity only, the Ginzburg-Landau coherence length , so that as mentioned in Sec. V.2. To make contact with experiment, we use the relation , Larkin and Varlamov (2009) and the empirical facts that (0) = (0) and (0) = (for a single large circular Fermi surface). This yields a theoretical expression where the only input parameter is :
| (7) |
The measured value of is determined using:
| (8) |
where is the superconducting Nernst coefficient in the limit (Fig. 12), and , in terms of the zero-field electrical resistivity (Fig. 1) and the interlayer separation Å.
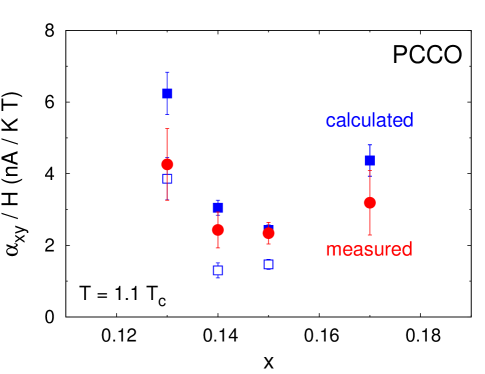
In Fig. 15, we plot the theoretical and experimental values of / at , using the values of given in Table 1 and the measured values of and given in Table 2, respectively. The agreement between theory and experiment is remarkable. Although a number of factors not considered here (e.g. -wave vs -wave) could alter this quantitative agreement somewhat, it is nevertheless evident that Gaussian theory can reliably explain not only the magnitude of in PCCO, but also its detailed doping dependence. In particular, it shows that there is no qualitative difference between the superconducting fluctuations of the underdoped regime relative to the overdoped regime. The fluctuations are Gaussian everywhere, meaning that the superconducting order parameter fluctuates in both amplitude and phase in the same way across the phase diagram. This therefore rules out the long-held notion that phase fluctuations play a special role in underdoped cuprates. Emery and Kivelson (1995)
V.3.2 Field dependence
One may ask whether the fluctuations at high field might be different from those close to that were considered in the previous section. In the conventional superconductor NbxSi1-x, direct comparisonMichaeli and Finkel’stein (2009) of the calculated and the measured (refs. Pourret et al., 2006, 2007) showed detailed quantitative agreement, validating the theory of Gaussian fluctuations at arbitrary .
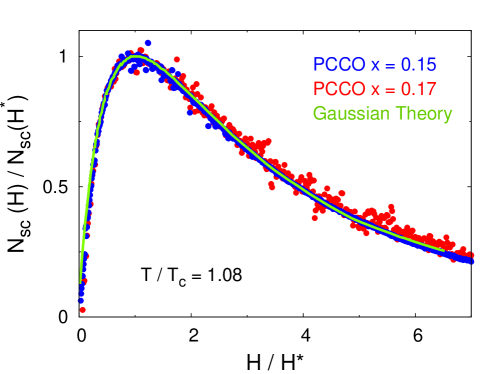
In Fig. 16, we reproduce the calculated curve of vs at .Michaeli and Finkel’stein (2009) It shows the characteristic rise and fall, with a peak at some field . The curve is normalized at for both axes, allowing us to compare with our data for vs , normalized in the same way. In Fig. 16, we perform this comparison for the two dopings at which the Fermi surface is not reconstructed, namely and . The data are seen to be in perfect agreement with the theoretical curve, for both dopings. This shows that the theory of Gaussian fluctuations continues to be valid in PCCO well beyond the limit of small fields.
We conclude that all aspects of our data in PCCO agree with the theory of Gaussian fluctuations.
Before moving on to the next section, let us comment on the behavior of close to . At all dopings, we see that deviates from its dependence as , in such a way that saturates to a non-zero value at , or (Fig. 10). This is a reflection of the fact that the initial rise in vs never becomes infinitely rapid, even at (Fig. 8, right panels). As can be seen in Fig. 12, the initial slope does not diverge as , for any doping. On the contrary, saturates to a constant value below . This saturation is entirely expected on theoretical grounds, since is the ratio of two coefficients that both diverge in the same way as . Indeed, just as (Eq. 6), so is . Larkin and Varlamov (2009)
V.4 Comparison with hole-doped cuprates
We have shown that in the electron-doped cuprate PCCO the superconducting fluctuations are Gaussian throughout the doping phase diagram, ruling out phase fluctuations as a mechanism for the dome, and superconductivity weakens as soon as Fermi-surface reconstruction sets in, below a critical doping . The origin of the dome is therefore an underlying growth in the gap with decreasing , curtailed by the onset of a competing phase. This is why the dome is centered around . In this section, we investigate to what extent a similar scenario applies to hole-doped cuprates.
V.4.1 FSR and the origin of the dome
The first thing to note is that hole-doped cuprates also undergo a FSR below some critical doping .Taillefer (2009, 2010) This was revealed unambiguously by the discovery of low-frequency quantum oscillations in YBCO,Doiron-Leyraud et al. (2007) shown to come from a small electron-like pocket in the Fermi surface of underdoped YBCO, because of the large negative Hall coefficient at low temperature.LeBoeuf et al. (2007) In the normal state, once superconductivity has been removed by application of a large magnetic field, the electron pocket is seen to persist as a function of doping up to at least .LeBoeuf et al. (2011) Given that hole-doped cuprates above are known to have a single large hole-like Fermi surface Mackenzie et al. (1996); Platé et al. (2005); Vignolle et al. (2008) (very similar to that of electron-doped cuprates at high ), the FSR in the normal state at must take place at a critical doping such that .
In YBCO, the onset of this FSR upon cooling is rather gradual, as it is in PCCO, and it may be said to occur at the temperature below which starts to fall towards negative values.LeBoeuf et al. (2011) The fact that the line and the line cross where the latter peaks is strong evidence that the the drop of on the underdoped side is linked to the FSR.LeBoeuf et al. (2011); Grissonnanche et al. (2014)
The temperature-doping phase diagram of YBCO is therefore similar to that of PCCO (Fig. 2), in the sense that the onset of FSR extrapolates to a critical point at which lies just above optimal doping (where peaks). So the origin of the dome in hole-doped cuprates appears to be fundamentally the same as in electron-doped cuprates, namely phase competition and FSR below a quantum critical point located inside the dome. Note, however, that the competing order itself may be different.
V.4.2 Critical field and critical doping
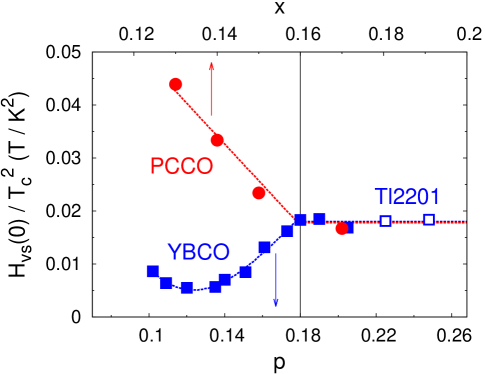
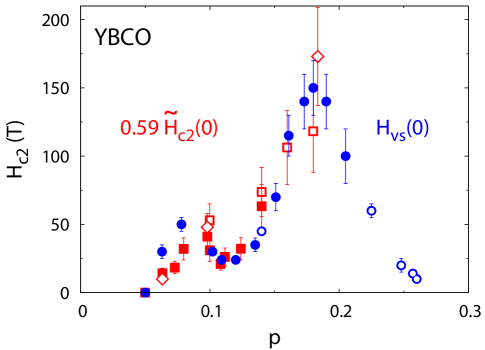
To investigate the comparison further, we examine the doping dependence of critical fields in hole-doped cuprates. The upper critical field was recently determined by thermal conductivity measurements in YBCO, YBa2Cu4O8 and Tl2Ba2CuO6 (Tl-2201). Grissonnanche et al. (2014) The data revealed that = (0), as confirmed here in PCCO at . Using high-field measurements of (), the complete doping dependence of was reported; the data are reproduced in Fig. 17. We see that vs exhibits two peaks, pointing to two underlying quantum critical points, possibly associated with the onset of two distinct competing phases.Grissonnanche et al. (2014) Here we focus on the higher peak, at = 0.18. Starting from high doping, we see that rises from zero at up to T at . In this overdoped regime, the ratio /2 is roughly constant (Fig. 14), showing that the growth in the gap magnitude controls the rise of and , as we found in overdoped PCCO.
Moreover, the value of the ratio is roughly the same in both hole-doped and electron-doped materials, namely / mT/K2 (Fig. 14). This may be somewhat coincidental, since depends on the Fermi velocity and the mean free path (see Appendix), and these parameters may not be identical in YBCO or Tl-2201 and in PCCO, but it nevertheless explains why in PCCO is so much smaller than in YBCO. Indeed, a factor 5 smaller , from K to K, will yield a factor 25 smaller , from T to T, as roughly observed.
Below = 0.18, in YBCO drops by a factor 6, down to T at .Grissonnanche et al. (2014) The condensation energy drops by a factor 20, and the ratio by a factor 8.Grissonnanche et al. (2014) This dramatic suppression of superconductivity is attributed to phase competition, involving the onset of charge order. Grissonnanche et al. (2014); Chang et al. (2012b); Ghiringhelli et al. (2012) The value of is consistent with the onset of FSR at , as estimated from . LeBoeuf et al. (2011)
As seen in Fig. 14, the FSR in YBCO causes a drop in the ratio /2, at least initially, whereas the FSR in PCCO causes an increase. The difference is likely to come at least in part from the different effect of FSR on the Fermi velocity . We mentioned that in PCCO undergoes a large change, by an order of magnitude. In YBCO, however, quantum oscillation measurements give only a factor 2 drop in upon FSR, if we compare overdoped Tl-2201 (; ref. Bangura et al., 2010) and underdoped YBCO (; ref. Jaudet et al., 2008). The difference could also come from a different topology of the reconstructed Fermi surface. While the electron pocket in the Fermi surface of PCCO is located at , where the -wave gap is maximal, the electron pocket in the Fermi surface of YBCO is quite possibly located at , where the gap goes to zero. Allais et al. (2014)
V.4.3 Superconducting fluctuations
Superconducting fluctuations in hole-doped cuprates have been studied extensively, mostly via measurements of the electrical resistivity, the magnetization and the Nernst effect. An exhaustive study of paraconductivity in YBCO by Ando and co-workers showed that Gaussian theory (Aslamazov-Larkin) accounts well for the effect of superconducting fluctuations above . Ando and Segawa (2002) From their analysis, justified in light of other works,Ramallo et al. (1996); Currás et al. (2003) they extract a coherence length as a function of doping, and use it to estimate the critical field . A later study by Rullier-Albenque and co-workers, based on a similar analysis, yielded values in good agreement with the earlier work, at least for . Rullier-Albenque et al. (2011) For , the use of higher magnetic fields in the more recent study may have improved the estimate of the underlying normal-state magneto-resistance. Rullier-Albenque et al. (2007) In Fig. 17, we plot obtained from the data of both groups on the - diagram of YBCO. We also plot obtained from recent magnetization measurements analyzed using Gaussian theory to extract the coherence length. Kokanović et al. (2013). The agreement between obtained from direct measurements of at low temperature and high fields and encoded in the superconducting fluctuations above is remarkable. In particular, it exhibits the same two-peak structure and the same six-fold drop between and .
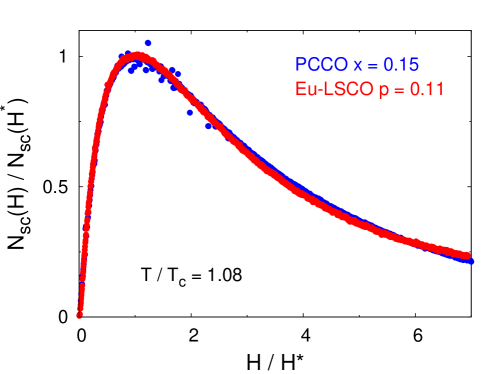
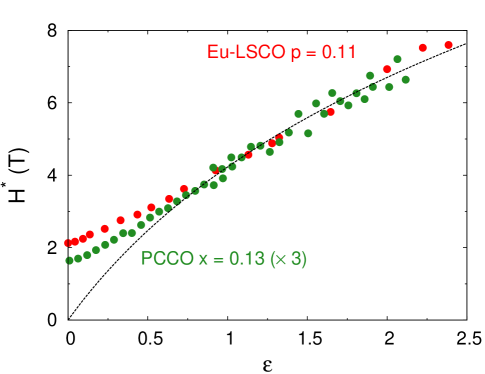
The Nernst response of hole-doped cuprates was recently revisited and shown to be in excellent agreement with the Gaussian theory. Chang et al. (2012a) Figs. 18 and 19 show how the behavior of in the hole-doped cuprate Eu-LSCO is qualitatively identical to that of electron-doped PCCO, as a function of field and temperature, respectively.
We conclude that superconducting fluctuations in cuprates are well described by Gaussian theory, whether in electron-doped or hole-doped materials, whether in the overdoped or underdoped regimes. This may no longer be true at very low doping, i.e. and , when close to the Mott insulator, but otherwise it appears that using the standard theory is a reliable way to extract fundamental information about superconductivity in the cuprates. Previous analyses of paraconductivity and diamagnetism in hole-doped cuprates like YBCO have also found Gaussian theory to be a good description of the superconducting fluctuations. Currás et al. (2003); Ramallo et al. (2012); Rey et al. (2013)
VI Summary
Our measurements of the Nernst effect in the electron-doped cuprate superconductor PCCO elucidate the nature of superconducting fluctuations above the critical temperature . We find that the superconducting Nernst signal is in qualitative and quantitative agreement with the theory of Gaussian fluctuations in dirty 2D superconductors,Ussishkin et al. (2002); Serbyn et al. (2009); Michaeli and Finkel’stein (2009) at all dopings. Indeed, in PCCO behaves as it does in the conventional superconductor NbxSi1-x. Pourret et al. (2006, 2007) This implies that there is nothing unusual about the fluctuations in PCCO, even in the underdoped regime. There is no evidence of any vortex-like excitations, or pre-formed pairs, above .
The characteristic magnetic field scale extracted directly from the data independent of any theoretical assumptions displays a dome-like dependence on doping, showing the same dependence as , both peaking at . This shows that the pairing strength drops below optimal doping. This weakening of superconductivity occurs at the critical doping where the Fermi surface undergoes a reconstruction.Dagan et al. (2004) The scenario is therefore one of competition with another ordered phase that causes both the Fermi-surface reconstruction and the suppression of and . Taillefer (2009, 2010); Doiron-Leyraud and Taillefer (2012); Grissonnanche et al. (2014); Alloul et al. (2010) Most likely, the competing phase in PCCO is antiferromagnetic order.Lin and Millis (2005)
The emerging picture for PCCO is therefore the same as in quasi-1D organic superconductors, where an antiferromagnetic quantum critical point is clearly the organizing principle. Doiron-Leyraud et al. (2009); Taillefer (2010) The magnetic fluctuations cause -wave pairing while the magnetic order competes with superconductivity. The first effect increases , the second decreases , and the two together produce the dome that straddles the critical point. By analogy, we infer that the same two mechanisms are at play in PCCO, supporting the case for magnetically-mediated pairing in cuprates. Jin et al. (2011); Taillefer (2010) This is also the likely scenario in iron-based superconductors.Chubukov (2012)
A comparison of our Nernst data on PCCO with corresponding data reported for the hole-doped cuprate Eu-LSCO (ref. Chang et al., 2012a) reveals a strong similarity. We conclude that superconducting fluctuations in hole-doped cuprates are not significantly different. This validates the use of Gaussian fluctuation theory in previous analyses of paraconductivity data in underdoped YBCO, which yielded an estimate of that decreases rapidly with underdoping,Ando and Segawa (2002); Rullier-Albenque et al. (2011) in good agreement with direct measurements of in YBCO.Grissonnanche et al. (2014) These studies establish that the dominant mechanism for the dome in hole-doped cuprates is also phase competition. Interestingly, in this case the competition does not seem to come from magnetic order, but appears to involve charge order. Ghiringhelli et al. (2012); Chang et al. (2012b)
We conclude that fluctuations in the phase of the superconducting order parameter, long invoked as the mechanism responsible for the dome of cuprates, do not in fact play a prominent role in the origin of the dome of either electron-doped or hole-doped cuprates.
Acknowledgements.
We thank H. Alloul, P. Armitage, Y. Ando, K. Behnia, A. Carrington, J. Chang, G. Deutscher, N. Doiron-Leyraud, V. Galitski, R. L. Greene, S. A. Kivelson, P. A. Lee, K. Michaeli, M. R. Norman, M. Ramallo, M. Serbyn, J. Sonier, A. Varlamov, and F. Vidal for stimulating discussions, and J. Corbin, S. Fortier, F. Francoeur and A. Mizrahi for assistance with the experiments. This work was supported by the Canadian Institute for Advanced Research and a Canada Research Chair, and it was funded by NSERC, FRQNT and CFI.Appendix A Estimate of in PCCO
Quantum oscillations in the -axis resistivity of overdoped NCCO at have a frequency T and a cyclotron mass .Helm et al. (2009) Using the Onsager relation:
| (9) |
with Wb, we extract the corresponding values for the Fermi wavevector of the large Fermi surface Å-1 and the Fermi velocity m/s. Using the following relation for the coherence length of a clean superconductor:
| (10) |
with and for a -wave state, we extract the clean limit coherence length nm. Disorder affects the clean limit coherence length if the mean free path is comparable to . We estimate the mean free path via the relation:
| (11) |
where is the residual resistivity. Using the inter-layer distance Å and cm (Fig. 1), we get nm. Using Pippard’s relation for the coherence length of dirty superconductors:
| (12) |
we arrive at a coherence length of nm in the dirty limit. We use this value to calculate the upper critical field from the expression:
| (13) |
The result is close to our measured value T, as discussed in Sec. V.2 and presented in Table 1.
| (K) | (nV/K) | (nV/K) | ||
|---|---|---|---|---|
| 0.13 | 8.8 | 36 | 263 | 0.14 |
| 0.14 | 17.4 | 11 | 1394 | 0.01 |
| 0.15 | 19.5 | 1 | 1359 | 0.001 |
| 0.17 | 13.4 | 17 | 425 | 0.04 |
Appendix B Magnitude of
Eq. 5 is valid when . To verify that this condition is indeed satisfied in our PCCO samples, we have measured the Seebeck effect in our thin films and used the values of from Ref. [Charpentier et al., 2010] to calculate using . Table 3 lists the value of , , and the ratio of the two quantities at K and T for our four samples. The condition is seen to hold at all dopings.
References
- Gao et al. (1994) L. Gao, Y. Y. Xue, F. Chen, Q. Xiong, R. L. Meng, D. Ramirez, C. W. Chu, J. H. Eggert, and H. K. Mao, Physical Review B 50, 4260 (1994).
- Emery and Kivelson (1995) V. J. Emery and S. A. Kivelson, Nature 374, 434 (1995).
- Xu et al. (2000) Z. A. Xu, N. P. Ong, Y. Wang, T. Kakeshita, and S. Uchida, Nature 406, 486 (2000).
- Wang et al. (2006) Y. Wang, L. Li, and N. P. Ong, Physical Review B 73, 024510 (2006).
- Vidal (1973) F. Vidal, Physical Review B 8, 1982 (1973).
- Wang et al. (2003) Y. Wang, S. Ono, Y. Onose, G. Gu, Y. Ando, Y. Tokura, S. Uchida, and N. P. Ong, Science 299, 86 (2003).
- Behnia (2009) K. Behnia, Journal of Physics: Condensed Matter 21, 113101 (2009).
- Cyr-Choinière et al. (2009) O. Cyr-Choinière, R. Daou, F. Laliberté, D. LeBoeuf, N. Doiron-Leyraud, J. Chang, J.-Q. Yan, J.-G. Cheng, J.-S. Zhou, J. B. Goodenough, S. Pyon, T. Takayama, H. Takagi, Y. Tanaka, and L. Taillefer, Nature 458, 743 (2009).
- Rullier-Albenque et al. (2006) F. Rullier-Albenque, R. Tourbot, H. Alloul, P. Lejay, D. Colson, and A. Forget, Physical Review Letters 96, 067002 (2006).
- Daou et al. (2010) R. Daou, J. Chang, D. LeBoeuf, O. Cyr-Choinière, F. Laliberté, N. Doiron-Leyraud, B. J. Ramshaw, R. Liang, D. A. Bonn, W. N. Hardy, and L. Taillefer, Nature 463, 519 (2010).
- Chang et al. (2010) J. Chang, R. Daou, C. Proust, D. LeBoeuf, N. Doiron-Leyraud, F. Laliberté, B. Pingault, B. J. Ramshaw, R. Liang, D. A. Bonn, W. N. Hardy, H. Takagi, A. B. Antunes, I. Sheikin, K. Behnia, and L. Taillefer, Physical Review Letters 104, 057005 (2010).
- Laliberté et al. (2011) F. Laliberté, J. Chang, N. Doiron-Leyraud, E. Hassinger, R. Daou, M. Rondeau, B. J. Ramshaw, R. Liang, D. A. Bonn, W. N. Hardy, S. Pyon, T. Takayama, H. Takagi, I. Sheikin, L. Malone, C. Proust, K. Behnia, and L. Taillefer, Nature Communications 2, 432 (2011).
- Doiron-Leyraud et al. (2013) N. Doiron-Leyraud, S. Lepault, O. Cyr-Choinière, B. Vignolle, G. Grissonnanche, F. Laliberté, J. Chang, N. Bari ic, M. K. Chan, L. Ji, X. Zhao, Y. Li, M. Greven, C. Proust, and L. Taillefer, Physical Review X 3, 021019 (2013).
- Balci et al. (2003) H. Balci, C. P. Hill, M. M. Qazilbash, and R. L. Greene, Physical Review B 68, 054520 (2003).
- Li and Greene (2007) P. Li and R. L. Greene, Physical Review B 76, 174512 (2007).
- Pourret et al. (2006) A. Pourret, H. Aubin, J. Lesueur, C. A. Marrache-Kikuchi, L. Bergé, L. Dumoulin, and K. Behnia, Nature Physics 2, 683 (2006).
- Pourret et al. (2007) A. Pourret, H. Aubin, J. Lesueur, C. A. Marrache-Kikuchi, L. Bergé, L. Dumoulin, and K. Behnia, Physical Review B 76, 214504 (2007).
- Ussishkin et al. (2002) I. Ussishkin, S. L. Sondhi, and D. A. Huse, Physical Review Letters 89, 287001 (2002).
- Serbyn et al. (2009) M. N. Serbyn, M. A. Skvortsov, A. A. Varlamov, and V. Galitski, Physical Review Letters 102, 067001 (2009).
- Michaeli and Finkel’stein (2009) K. Michaeli and A. M. Finkel’stein, Europhysics Letters 86, 27007 (2009).
- Chang et al. (2012a) J. Chang, N. Doiron-Leyraud, O. Cyr-Choinière, G. Grissonnanche, F. Laliberté, E. Hassinger, J.-P. Reid, R. Daou, S. Pyon, T. Takayama, H. Takagi, and L. Taillefer, Nature Physics 8, 751 (2012a).
- Dagan et al. (2004) Y. Dagan, M. M. Qazilbash, C. P. Hill, V. N. Kulkarni, and R. L. Greene, Physical Review Letters 92, 167001 (2004).
- Lin and Millis (2005) J. Lin and A. J. Millis, Physical Review B 72, 214506 (2005).
- Fournier et al. (1997) P. Fournier, X. Jiang, W. Jiang, S. N. Mao, T. Venkatesan, C. J. Lobb, and R. L. Greene, Physical Review B 56, 14149 (1997).
- Roberge et al. (2009) G. Roberge, S. Charpentier, S. Godin-Proulx, P. Rauwel, K. Truong, and P. Fournier, Journal of Crystal Growth 311, 1340 (2009).
- Bougrine and Ausloos (1995) H. Bougrine and M. Ausloos, Review of Scientific Instruments 66, 199 (1995).
- Charpentier et al. (2010) S. Charpentier, G. Roberge, S. Godin-Proulx, X. Béchamp-Laganière, K. D. Truong, P. Fournier, and P. Rauwel, Physical Review B 81, 104509 (2010).
- Fournier et al. (1998) P. Fournier, P. Mohanty, E. Maiser, S. Darzens, T. Venkatesan, C. J. Lobb, G. Czjzek, R. A. Webb, and R. L. Greene, Physical Review Letters 81, 4720 (1998).
- Jin et al. (2011) K. Jin, N. P. Butch, K. Kirshenbaum, J. Paglione, and R. L. Greene, Nature 476, 73 (2011).
- Kivelson and Fradkin (2010) S. A. Kivelson and E. H. Fradkin, Physics 3, 15 (2010).
- Grissonnanche et al. (2014) G. Grissonnanche, O. Cyr-Choinière, F. Laliberté, S. René de Cotret, A. Juneau-Fecteau, S. Dufour-Beausèjour, M.-E. Delage, D. LeBoeuf, J. Chang, B. J. Ramshaw, D. A. Bonn, W. N. Hardy, R. Liang, S. Adachi, N. E. Hussey, B. Vignolle, C. Proust, M. Sutherland, S. Krämer, J.-H. Park, D. Graf, N. Doiron-Leyraud, and L. Taillefer, Nature Communications 5, 3280 (2014).
- Hill et al. (2001) R. W. Hill, C. Proust, L. Taillefer, P. Fournier, and R. L. Greene, Nature 414, 711 (2001).
- Blatter et al. (1994) G. Blatter, M. V. Feigel’man, V. B. Geshkenbein, A. I. Larkin, and V. M. Vinokur, Reviews of Modern Physics 66, 1125 (1994).
- Houghton et al. (1989) A. Houghton, R. A. Pelcovits, and A. Sudbø, Physical Review B 40, 6763 (1989).
- Ramshaw et al. (2012) B. J. Ramshaw, J. Day, B. Vignolle, D. LeBoeuf, P. Dosanjh, C. Proust, L. Taillefer, R. Liang, W. N. Hardy, and D. A. Bonn, Physical Review B 86, 174501 (2012).
- Fournier and Greene (2003) P. Fournier and R. L. Greene, Physical Review B 68, 094507 (2003).
- Mackenzie et al. (1996) A. P. Mackenzie, S. R. Julian, D. C. Sinclair, and C. T. Lin, Physical Review B 53, 5848 (1996).
- Armitage et al. (2010) N. P. Armitage, P. Fournier, and R. L. Greene, Reviews of Modern Physics 82, 2421 (2010).
- Vidal et al. (2002) F. Vidal, C. Carballeira, S. R. Curr s, J. Mosqueira, M. V. Ramallo, J. A. Veira, and J. Vi a, Europhysics Letters 59, 754 (2002).
- Soto et al. (2004) F. Soto, C. Carballeira, J. Mosqueira, M. V. Ramallo, M. Ruibal, J. A. Veira, and F. Vidal, Physical Review B 70, 060501 (2004).
- Kapitulnik et al. (1985) A. Kapitulnik, A. Palevski, and G. Deutscher, Journal of Physics C: Solid State Physics 18, 1305 (1985).
- Armitage et al. (2002) N. P. Armitage, F. Ronning, D. H. Lu, C. Kim, A. Damascelli, K. M. Shen, D. L. Feng, H. Eisaki, Z.-X. Shen, P. K. Mang, N. Kaneko, M. Greven, Y. Onose, Y. Taguchi, and Y. Tokura, Physical Review Letters 88, 257001 (2002).
- Matsui et al. (2007) H. Matsui, T. Takahashi, T. Sato, K. Terashima, H. Ding, T. Uefuji, and K. Yamada, Physical Review B 75, 224514 (2007).
- Helm et al. (2009) T. Helm, M. V. Kartsovnik, M. Bartkowiak, N. Bittner, M. Lambacher, A. Erb, J. Wosnitza, and R. Gross, Physical Review Letters 103, 157002 (2009).
- Motoyama et al. (2007) E. M. Motoyama, G. Yu, I. M. Vishik, O. P. Vajk, P. K. Mang, and M. Greven, Nature 445, 186 (2007).
- Taillefer (2009) L. Taillefer, Journal of Physics: Condensed Matter 21, 164212 (2009).
- Taillefer (2010) L. Taillefer, Annual Review of Condensed Matter Physics 1, 51 (2010).
- Vuletic et al. (2002) T. Vuletic, P. Auban-Senzier, C. Pasquier, S. Tomic, D. Jérome, M. Héritier, and K. Bechgaard, The European Physical Journal B 25, 319 (2002).
- Doiron-Leyraud et al. (2009) N. Doiron-Leyraud, P. Auban-Senzier, S. René de Cotret, C. Bourbonnais, D. Jérome, K. Bechgaard, and L. Taillefer, Physical Review B 80, 214531 (2009).
- Chubukov (2012) A. Chubukov, Annual Review of Condensed Matter Physics 3, 57 (2012).
- Mathur et al. (1998) N. D. Mathur, F. M. Grosche, S. R. Julian, I. R. Walker, D. M. Freye, R. K. W. Haselwimmer, and G. G. Lonzarich, Nature 394, 39 (1998).
- Gegenwart et al. (2008) P. Gegenwart, Q. Si, and F. Steglich, Nature Physics 4, 186 (2008).
- Larkin and Varlamov (2009) A. Larkin and A. A. Varlamov, Theory of fluctuations in superconductors (Oxford University Press, Oxford; New York, 2009).
- Pourret et al. (2009) A. Pourret, P. Spathis, H. Aubin, and K. Behnia, New Journal of Physics 11, 055071 (2009).
- Doiron-Leyraud et al. (2007) N. Doiron-Leyraud, C. Proust, D. LeBoeuf, J. Levallois, J.-B. Bonnemaison, R. Liang, D. A. Bonn, W. N. Hardy, and L. Taillefer, Nature 447, 565 (2007).
- LeBoeuf et al. (2007) D. LeBoeuf, N. Doiron-Leyraud, J. Levallois, R. Daou, J.-B. Bonnemaison, N. E. Hussey, L. Balicas, B. J. Ramshaw, R. Liang, D. A. Bonn, W. N. Hardy, S. Adachi, C. Proust, and L. Taillefer, Nature 450, 533 (2007).
- LeBoeuf et al. (2011) D. LeBoeuf, N. Doiron-Leyraud, B. Vignolle, M. Sutherland, B. J. Ramshaw, J. Levallois, R. Daou, F. Laliberté, O. Cyr-Choinière, J. Chang, Y. J. Jo, L. Balicas, R. Liang, D. A. Bonn, W. N. Hardy, C. Proust, and L. Taillefer, Physical Review B 83, 054506 (2011).
- Platé et al. (2005) M. Platé, J. D. F. Mottershead, I. S. Elfimov, D. C. Peets, R. Liang, D. A. Bonn, W. N. Hardy, S. Chiuzbaian, M. Falub, M. Shi, L. Patthey, and A. Damascelli, Physical Review Letters 95, 077001 (2005).
- Vignolle et al. (2008) B. Vignolle, A. Carrington, R. A. Cooper, M. M. J. French, A. P. Mackenzie, C. Jaudet, D. Vignolles, C. Proust, and N. E. Hussey, Nature 455, 952 (2008).
- Ando and Segawa (2002) Y. Ando and K. Segawa, Physical Review Letters 88, 167005 (2002).
- Rullier-Albenque et al. (2011) F. Rullier-Albenque, H. Alloul, and G. Rikken, Physical Review B 84, 014522 (2011).
- Kokanović et al. (2013) I. Kokanović, D. J. Hills, M. L. Sutherland, R. Liang, and J. R. Cooper, Physical Review B 88, 060505 (2013).
- Chang et al. (2012b) J. Chang, E. Blackburn, A. T. Holmes, N. B. Christensen, J. Larsen, J. Mesot, R. Liang, D. A. Bonn, W. N. Hardy, A. Watenphul, M. v. Zimmermann, E. M. Forgan, and S. M. Hayden, Nature Physics 8, 871 (2012b).
- Ghiringhelli et al. (2012) G. Ghiringhelli, M. L. Tacon, M. Minola, S. Blanco-Canosa, C. Mazzoli, N. B. Brookes, G. M. D. Luca, A. Frano, D. G. Hawthorn, F. He, T. Loew, M. M. Sala, D. C. Peets, M. Salluzzo, E. Schierle, R. Sutarto, G. A. Sawatzky, E. Weschke, B. Keimer, and L. Braicovich, Science 337, 821 (2012).
- Bangura et al. (2010) A. F. Bangura, P. M. C. Rourke, T. M. Benseman, M. Matusiak, J. R. Cooper, N. E. Hussey, and A. Carrington, Physical Review B 82, 140501 (2010).
- Jaudet et al. (2008) C. Jaudet, D. Vignolles, A. Audouard, J. Levallois, D. LeBoeuf, N. Doiron-Leyraud, B. Vignolle, M. Nardone, A. Zitouni, R. Liang, D. A. Bonn, W. N. Hardy, L. Taillefer, and C. Proust, Physical Review Letters 100, 187005 (2008).
- Allais et al. (2014) A. Allais, D. Chowdhury, and S. Sachdev, arXiv:1406.0503 (2014).
- Ramallo et al. (1996) M. V. Ramallo, A. Pomar, and F. Vidal, Physical Review B 54, 4341 (1996).
- Currás et al. (2003) S. R. Currás, G. Ferro, M. T. González, M. V. Ramallo, M. Ruibal, J. A. Veira, P. Wagner, and F. Vidal, Physical Review B 68, 094501 (2003).
- Rullier-Albenque et al. (2007) F. Rullier-Albenque, H. Alloul, C. Proust, P. Lejay, A. Forget, and D. Colson, Physical Review Letters 99, 027003 (2007).
- Ramallo et al. (2012) M. V. Ramallo, C. Carballeira, R. I. Rey, J. Mosqueira, and F. Vidal, Physical Review B 85, 106501 (2012).
- Rey et al. (2013) R. I. Rey, A. Ramos-Álvarez, J. Mosqueira, M. V. Ramallo, and F. Vidal, Physical Review B 87, 056501 (2013).
- Doiron-Leyraud and Taillefer (2012) N. Doiron-Leyraud and L. Taillefer, Physica C: Superconductivity 481, 161 (2012).
- Alloul et al. (2010) H. Alloul, F. Rullier-Albenque, B. Vignolle, D. Colson, and A. Forget, Europhysics Letters 91, 37005 (2010).