Evolution of Anisotropic In-plane Resistivity with doping level in Ca1-xNaxFe2As2 Single Crystals
Abstract
We measured the in-plane resistivity anisotropy in the underdoped Ca1-xNaxFe2As2 single crystals. The anisotropy (indicated by ) appears below a temperature well above magnetic transition temperature , being positive () as 0.14. With increasing the doping level to = 0.19, an intersection between and is observed upon cooling, with at low-temperature deep inside a magnetically ordered state, while at high temperature. Subsequently, further increase of hole concentration leads to a negative anisotropy in the whole temperature range. These results manifest that the anisotropic behavior of resistivity in the magnetically ordered state depends strongly on the competition of the contributions from different mechanisms, and the competition between the two contributions results in a complicated evolution of the anisotropy of in-plane resistivity with doping level.
pacs:
74.25.F-, 74.62.Dh, 74.70.XaI INTRODUCTION
The undoped and underdoped iron-pnictides undergo structural transition upon cooling, accompanied with a magnetic transition from high-temperature paramagnetic to low-temperature antiferromagnetic (AFM) phase7 . Understanding the origin of superconductivity in iron-pnictide might start from the normal-state physics, especially the roles of the various degrees of freedom in the magnetic state. One central topic concerning these is the electronic anisotropy at low temperature, which involves the fluctuation or ordering of spin, orbital, and band structures8 ; 9 ; 10 . In such an anisotropic electronic state, the striking behavior is that the resistivity along the ferromagnetically ordered and shorter b axis is larger than that along the antiferromagnetically ordered and longer a axis (). The anisotropy actually appears well above the structural and magnetic transition temperatures and in electron-underdoped Ba-122 8 ; 11 ; 12 , which has been discussed according to the nematicity 25 ; 34 ; 35 by considering the anisotropic magnetic scattering induced by nematic (spin or/and orbital) fluctuation . The observation of an orbital ordered polarization of and of Fe in angle-resolved photoemission spectroscopy (ARPES) 13 , local anisotropies in scanning tunneling spectroscopy 14 ; 15 , anisotropies in the optical spectrum 16 , and magnetic susceptibility 31 seems to support the point of view of nematicity.
However, the origin for the anisotropic in-plane resistivity in the AFM state remains in hot debate. In undoped BaFe2As2, the anisotropy has been discussed 9 ; 17 in terms of the high-mobility Dirac pockets near the Fermi energy, detected by quantum oscillations and ARPES measurements 18 ; 19 ; 20 ; 21 . Orbital ordering was also considered as a possible mechanism for the anisotropy, but calculations based on five-orbital model gave rise to a sign opposite to that observed in experiments 26 ; 36 . Another scenario was proposed based on impurity scattering to interpret such anisotropic in-plane resistivity 12 ; 22 ; 23 . Especially, annealing can lead to almost annihilation of transport anisotropy at low temperature in undoped BaFe2As2 22 ; 23 , which strongly suggests the origin from magnetic scattering of the impurity states. The very tiny anisotropy in underdoped Ba1-xKxFe2As2 was thought to be ascribed to the relatively small impurity potential as the dopant atom is relatively far from the Fe-plane 12 .
Very recently, it was surprisingly found in Ba1-xKxFe2As2 that, in contrast to the small positive anisotropy of resistivity () existing at 0.202, the sign of the anisotropy was reversed to negative () as 0.235, which begins at a temperature well above 24 . However, as mentioned above, different mechanisms were considered to interpret the anisotropy above and below , respectively. As a consequence, there is a natural question about how the sign of anisotropy evolves from totally positive to totally negative with increasing the hole doping level. In this paper, we report on anisotropic in-plane resistivity on detwinned hole-underdoped Ca1-xNaxFe2As2 crystals. is observed in the samples with = 0.11 and 0.14. In the sample with = 0.19, however, an intersection happens at a certain temperature of 110 K in and curves; that is, below 110 K, while above 110 K and the sign of resistivity anisotropy is the same as that observed in the crystals with 0.11 and 0.14. Subsequently, as is increased further (0.24), the sign of this anisotropy can be totally reversed, , similar to the results observed in Ba1-xKxFe2As2 ( = 0.235). Such complicated evolution of anisotropy can be understood in terms of combined effect of spin fluctuation and the reconstructed Fermi surface (RFS) on anisotropy, with the effect of impurities included.
II EXPERIMENTAL DETAILS
High-quality single crystals of Ca1-xNaxFe2As2 were grown by the self-flux method. The starting materials were CaAs, NaAs, FeAs and Fe2As, with the molar ratio of Ca/Na: Fe: As=1: 4: 4. The nominal compositions were = 0.2, 0.23, 0.3, 0.35, and 0.4 respectively. After thoroughly grounding, the mixture was loaded into an alumina crucible and then sealed in an iron crucible under 1.5 atm argon atmosphere. The reactants were heated to 1160 in a tube furnace protected with highly pure argon and kept at this temperature for 10 h. Subsequently, the furnace was cooled down to 860 at a rate of 5 /h. Finally the furnace was cooled down to room temperature naturally by shutting off the power. The actual chemical compositions were determined by energy dispersive x-ray spectroscopy (EDS) to be 0.11, 0.14, 0.19, 0.24, and 0.30 for the above five nominal compositions Na: Ca = 0.2-0.40, respectively, with a standard instrument error of 10%. Single-crystal x-ray diffraction (XRD) was performed on a SmartLab-9 diffracmeter( Rikagu) from 10 to 65 with a scanning rate of 2 per minute. The crystals were cut in a rectangular shape along the tetragonal [110] directions. The in-plane resistivity measurements were carried out with the standard four-probe method by using a Quantum Design physical property measurement system. The in-plane resistivity along the orthorhombic a and b axes were measured by a mechanical cantilever device similar to Refs.8 ; 11 .
III RESULTS AND DISCUSSION
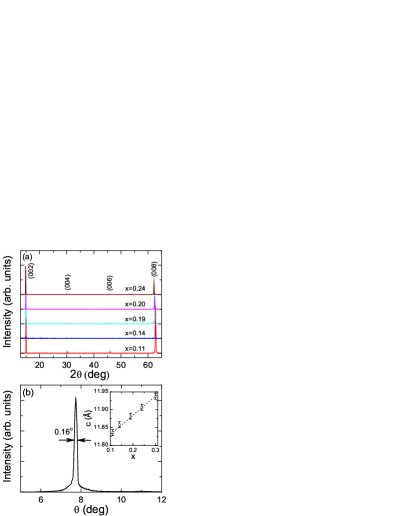
Figure 1(a) shows the single-crystal XRD patterns for the Ca1-xNaxFe2As2 single crystals with = 0.11 0.24. Only (0 0 2) reflections show up, suggesting good orientation along the c axis for all the crystals. The typical rocking curve of (0 0 2) reflection for the crystals is shown in Fig. 1(b). The full width at half maximum of the rocking curve is about 0.16, indicating the high quality of the crystals. The inset of Fig. 1(b) shows lattice constant estimated from the data shown in Fig. 1(a), which increases nearly linearly with increasing Na doping level, consistent with the previous report on the polycrystalline samples of Ca1-xNaxFe2As2 28 .
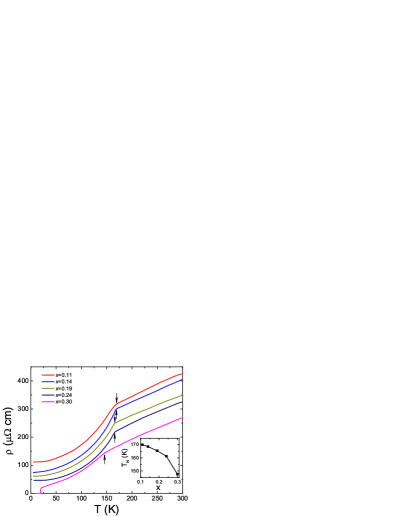
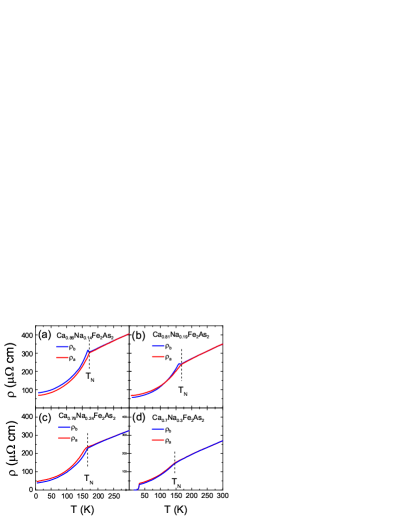
The temperature dependence of the in-plane resistivity measured on twinned Ca1-xNaxFe2As2 crystals (=0.11-0.30) is shown in Fig. 2. The residual resistivity decreases with increasing doping level and becomes less than 44 cm for = 0.24, which is close to that in Ba1-xKxFe2As2 crystal with 16% doping level 12 . A clear anomaly can be observed for all of these samples in the temperature region of 148 - 170 K. Such single kink of anomaly in resistivity indicates that the AFM and structural transitions take place at the same temperature, the same as that observed in the Ba1-xKxFe2As2 system 27 . Therefore, we denote the temperature where this anomaly locates simply as . The observed ’s are much higher than those observed in polycrystalline sample for the each same doping level28 . is plotted against doping level in the inset of Fig. 2. With increasing the doping level, decreases quite slowly as 0.24 and then steeply as 0.24. No superconductivity can be observed above 5 K as 0.24 and the sample with = 0.30 shows the superconducting transition at 20 K. The nonsuperconducting underdoped region in Ca1-xNaxFe2As2 is much wider than that of Ba1-xKxFe2As2 27 , in which superconductivity emerges as 0.14.
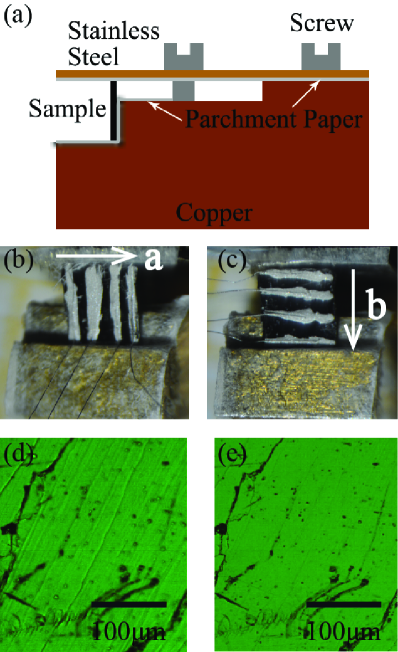
The twin boundaries in the orthorhombic phase of the underdoped iron-pnictides Tanatar hampers probing the in-plane anisotropy and two methods (application of uniaxial strain or tensile and imposing an in-plane magnetic field) have been adopted to detwin such crystals so that the orthorhombic a and b axes can be distinguished 8 ; 11 ; 10 ; 13 ; 21 ; MF1 ; MF2 In this work, uniaxial strain was used for detwinning the crystals. The setup adopted in the study of the in-plane resistivity anisotropy is schematically shown in Fig. 3(a), which has widely been used in the previous works 8 ; 11 for detwinning iron-pnictide crystals. The mechanical strain was produced by tightening the screw nearby the sample and applied along the tetragonal [110] direction (which would become the orthorhombic a or b axis in the orthorhombic phase), as mentioned above. The typical configurations of current and voltage contacts for measuring resistivity along the orthorhombic a and b axes are shown in Fig. 3(b) and 3(c), respectively. Figures 3(d) and 3(e) are the typical polarized-light microscopy of the surface of Ca0.89Na0.11Fe2As2 crystal at the temperature of 77 K before and after detwinning, respectively. After detwinning, twin domain walls can no longer be seen, as shown in Fig. 3(e).
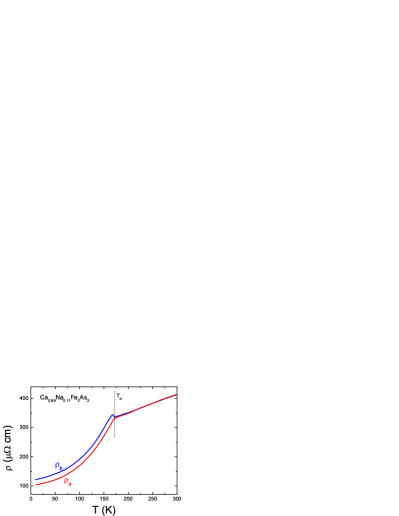
Figure 4 shows the temperature dependence of the in-plane resistivity along the a and b axes ( and ) of the detwinned Ca0.89Na0.11Fe2As2. Small anisotropy of in-plane resistivity can be observed well above and it becomes larger as temperature is cooled close to . A finite difference between and in the AFM state remains to low temperature. The resistivity along the b axis is larger than that along the a axis, e.g. , which is similar to those observed in parent CaFe2As2 and other electron-doped Ba- and Eu-122 crystals 8 ; 9 ; 10 ; 11 .
With the increase of the Na doping level, the anisotropy becomes small, as observed for Ca0.86Na0.14Fe2As2 crystal [see Fig. 5(a)]. As shown in Fig. 5(c), can be observed below a temperature well above for the crystal with =0.24, which resembles previous observation in Ba1-xKxFe2As2 with nearly the same hole doping level ( = 0.235) as ours 24 . In a previous report for the Ba1-xKxFe2As2 24 system, the anisotropy changes from for the sample with = 0.202 to for the sample with = 0.235. It should be noted that the sign reversal of anisotropy in Ba1-xKxFe2As2 happens in the superconducting samples. While in the Ca1-xNaxFe2As2 system, can already be observed in the nonsuperconducting underdoped sample. Superconductivity emerges and a small difference between and with can still be observed at low temperature for the sample with , as shown in Fig. 5(d). The onset superconducting transition temperature was enhanced by about 7 K from about 20 K at ambient pressure after applying strain pressure, indicating that superconductivity in Ca1-xNaxFe2As2 is sensitive to pressure. Although such uniaxial stress is usually low (typical values of 5-10 MPa FisherR ), it has been reported that superconductivity is induced by the uniaxial stress in underdoped Ba(Fe1-xCox)2As2 with = 0.016 and 0.0258 . Such a dramatic enhancement of under small uniaxial stress applied within ab-plane can be ascribed to the height of anion from the Fe atom () in Ca0.7Na0.3Fe2As2 being close to the optimal value 1.38 Åh (derived from the data of polycrystalline sample 28 , should be around 1.37 Å as =0.3 in Ca1-xNaxFe2As2). Uniaxial stress can reduce the lattice parameters within ab-plane, and consequently results in an enhancement of . As discussed in Ref.[28], can be enhanced sharply with increasing close to 1.38 Å, and small uniaxial stress can efficiently raise .
To clarify the nature of the sign-reversal of in-plane resistivity anisotropy with increasing hole doping level in hole-doped iron-pnictides, we studied the sample with the intermediate doping level ( = 0.19) to unveil how the sign of anisotropy develops with increasing the hole doping level from = 0.11 and 0.14 with to = 0.24 and 0.30 with , as shown in Fig. 5(b). It is found that sign reversal of the anisotropy happens in the special sample with = 0.19 upon cooling, that is: starts to be observed at a temperature well above , and occurs below about 110 K (much less than ). Therefore, sign reversal of in-plane resistivity anisotropy occurs firstly at low temperature with at high temperature, resulting in an intersection between () and (). These results suggest that there are competitive mechanisms on the anisotropy in the AFM state.
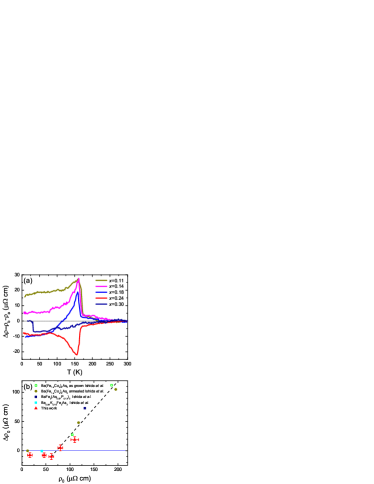
We plot the temperature dependence of the in-plane resistivity difference for all the samples in Fig. 6(a). The maximum of the magnitude of appears at temperatures a little below () for = 0.11 - 0.24. It is found that above there is already a finite resistivity anisotropy (0), suggesting the existence of nematic phase 25 ; 34 ; 35 . With increasing , above changes the sign from positive to negative at = 0.24. The sign reversal of anisotropy occurs in the sample with as high as 162 K, which is much higher than 70 K in the Ba1-xKxFe2As2 case although their hole concentrations are close to each other24 . The anisotropy of in-plane resistivity above has been theoretically ascribed to the contribution from the anisotropic magnetic scattering due to the spin (nematic) fluctuations associated with the anisotropy electronic state (nematic state)25 ; 37 , which has been proposed to interpret the sign reversal in Ba1-xKxFe2As2 above 24 ; 25 .
It was previously proposed that the mechanism responsible for the anisotropy below should be different from that for the anisotropy above due to the reconstruction of Fermi surface induced by the AFM ordering9 ; 26 ; 24 ; FisherR . It has been theoretically suggested that the in-plane resistivity can be larger along either the a or b direction, depending on the shape of the Fermi surface, because the anisotropy of the Fermi velocity (strongly connected to the morphology and topology of the RFS) can lead to a large variation in the ratio of the Drude weight along the two directions 36 . However, recent theoretical work by Sugimoto et al. pointed out that the Drude weight gives anisotropy opposite to experimental observation26 . It seems to suggest that only the anisotropic RFS itself is not sufficient to explain the observed in-plane resistivity anisotropy.
The impurity scattering within the FeAs layers has also been proposed as one possible mechanism for the anisotropy of resistivity below in Co- and P-doped BaFe2As2 12 ; 22 ; 23 . To illustrate the effect of impurity scattering on the anisotropy in Ca1-xNaxFe2As2, we plotted the difference in the residual component of the in-plane resistivity () as a function of the residual resistivity () at low temperature, as shown in Fig. 6(b). The data from previous report on Co- and P-doped BaFe2As2 are also included in Fig. 6(b) 12 . As 0 ( 0.11 and 0.14 in Ca1-xNaxFe2As2), a correlation between and is observed, that is, linearly decreases with reducing . Considering that the magnitude of reflects the level of impurity scattering, this correlation indicates that the impurity scattering plays a significant role on the anisotropy of the in-plane resistivity, as suggested by a previous report 12 .
As shown in Fig. 6(b), could reach zero as is reduced to about 75 cm. Our group and Ishida et al. reported a negligible in Ba0.84K0.16Fe2As2 which has ( 41 cm) much less than 75 cm 11 ; 12 . Ishida et al. attributed this to rather weak impurity potential 12 . However, becomes negative in Ca1-xNaxFe2As2 when is reduced to less than 75 cm with increasing Na content. A similar behavior ( the finite negative ) has been reported in Ba0.765K0.235Fe2As2 which has smaller than that in Ba0.84K0.16Fe2As2Yan , Therefore, only impurity scattering is not sufficient to understand the negative in the regime with weak impurity level.
Very recently, Sugimoto et al. tried to theoretically reproduce the sign-reversal of in-plane resistivity anisotropy in the AFM state based on the interplay of impurity scattering and the anisotropic electronic states of RFS26 . The anisotropy was thought to be dominated by the non-Dirac electron Fermi pockets near the point in the existence of impurity potential 26 . In their model, negative can be realized as the electron pockets disappear with increasing hole doping level 26 . However, there is no such experimental result for the evolution of the RFS in the hole-underdoped samples up to now. As a result, further experiments on these hole-underdoped crystals, such as ARPES and quantum oscillation, are required to examine the validity of the theoretical explanations.
No matter what is actually responsible for the sign-reversal of deep inside the AFM state with increasing hole doping level, the intersection between () and () in Ca0.81Na0.19Fe2As2, with 0 in a short interval of temperature below (110 K 165 K) while 0 deep inside the AFM state ( 110 K), cannot be simply attributed to a single mechanism but should be the result of a combined effect of different mechanisms. Apparently, in the temperatures of 110 K 165 K inherits the positive sign of above , suggesting that the sign of anisotropy in this temperature region is still dominated by the magnetic scattering of spin fluctuation although spin fluctuation becomes weaker after entering the AFM state. Upon cooling from to 110 K, the magnitude of continuously decreases in the sample with = 0.19, indicating that the contributions from different mechanisms lead to different signs of and compete with each other below in this doping level. However, in the other doping levels we investigate, the data shown in Fig. 6(a) suggest that the different mechanisms give the same signs of contributions to . In one word, the complicated evolutions of resistivity anisotropy with hole doping level and temperature shown in Fig. 6(a) suggest cooperative effect of the contributions to from the different mechanisms: spin fluctuation, impurity scattering, and anisotropic electronic state of the RFS. These observations provide the hints to theoretical explanation of the in-plane resistivity anisotropy in the AFM state.
IV CONCLUSION
In conclusion, we investigated the in-plane resistivity anisotropy in the detwinned hole-underdoped Ca1-xNaxFe2As2 single crystals, and observed the sign reversal of in-plane resistivity anisotropy with increasing hole doping level from = 0.11 and 0.14 to = 0.24 and 0.30 in the detwinned hole-underdoped Ca1-xNaxFe2As2 single crystals, and an intersection between () and () deep inside the AFM state for the crystal with =0.19. These results suggests that the anisotropic resistivity in the AFM state strongly depends on the competition of the contributions from different mechanisms. Such competition between the different mechanisms leads to the complicated evolution of the anisotropy of the in-plane resistivity with doping level.
ACKNOWLEDGEMENTS
The authors would like to thank L. J. Zou, S. Y. Li, Z. Sun, Y. M. Xiong and T. Wu for useful discussions. This work is supported by the National Natural Science Foundation of China (Grants No. 11190021, No. 11174266, and No. 91122034), and the ”Strategic Priority Research Program (B)” of the Chinese Academy of Sciences (Grant No. XDB04040100), the National Basic Research Program of China (973 Program, Grant No. 2011CBA00101), Anhui Provincial Natural Science Foundation (Grant No. 1308085MA05), the Fundamental Research Funds for the Central Universities (Programs No. WK2030020020 and No. WK2340000035).
References
- (1) Clarina de la Cruz, Q. Huang, J. W. Lynn, Jiying Li, W. Ratcliff II, J. L. Zarestky, H. A. Mook, G. F. Chen, J. L. Luo, N. L. Wang and Pengcheng Dai, Nature 453, 899-902 (2008).
- (2) J. H. Chu, J. G. Analytis, K. D. Greve, P. L. McMahon, Z. Islam, Y. Yamamoto, I. R. Fisher, Science 329, 824 (2010).
- (3) H. H. Kuo, J. H. Chu, S. C. Riggs, L. Yu, P. L. McMahon, K. DeGreve, Y. Yamamoto, J. G. Analytis, and I. R. Fisher, Phys. Rev. B 84, 054540 (2011).
- (4) M. A. Tanatar, E. C. Blomberg, A. Kreyssig, M. G. Kim, N. Ni, A. Thaler, S. L. Bud ko, P. C. Canfield, A. I. Goldman, I. I. Mazin, and R. Prozorov, Phys. Rev. B 81, 184508 (2010).
- (5) J. J. Ying, X. F. Wang, T. Wu, Z. J. Xiang, R. H. Liu, Y. J. Yan, A. F. Wang, M. Zhang, G. J. Ye, P. Cheng, J. P. Hu, and X. H. Chen, Phys. Rev. Lett. 107, 067001 (2011).
- (6) S. Ishida, M. Nakajima, T. Liang, K. Kihou, C.H. Lee, A. Iyo, H. Eisaki, T. Kakeshita, Y. Tomioka, T. Ito, and S. Uchida, J. Am. Chem. Soc. 135, 3158 (2013).
- (7) R. M. Fernandes, E. Abrahams, and J. Schmalian, Phys. Rev. Lett. 107, 217002 (2011).
- (8) W. C. Lv, and P. Phillips, Phys. Rev. B 84, 174512 (2011).
- (9) H. H. Kuo, and I. R. Fisher, arXiv:1311.0933.
- (10) M. Yi, D. H. Lu, J. H. Chu, J. G. Analytis, A. P. Sorini, A. F. Kemper, B. Moritz, S. K. Mo, R. G. Moore, M. Hashimoto, W. S. Lee, Z. Hussain, T. P. Devereaux, I. R. Fisher, and Z. X. Shen, Proc. Natl. Acad. Sci. USA 108, 6878 (2011).
- (11) T. M. Chuang, M. P. Allan, Jinho Lee, Yang Xie, Ni Ni, S. L. Bud ko, G. S. Boebinger, P. C. Canfield, J. C. Davis, Science 327, 181 (2010).
- (12) M. P. Allan, T. M. Chuang, F. Massee, Yang Xie, Ni Ni, S. L. Bud ko, G. S. Boebinger, Q. Wang, D. S. Dessau, P. C. Canfield, M. S. Golden and J. C. Davis, Nat. Phys. 9, 220 (2013).
- (13) A. Dusza, A. Lucarelli, F. Pfuner, J.-H. Chu, I. R. Fisher and L. Degiorgi, EPL 93, 37002 (2011).
- (14) S. Kasahara, H. J. Shi, K. Hashimoto, S. Tonegawa, Y. Mizukami, T. Shibauchi, K. Sugimoto, T. Fukuda, T. Terashima, Andriy H. Nevidomskyy and Y. Matsuda, Nature 486, 382 (2012).
- (15) K. K. Huynh, Y. Tanabe, and K. Tanigaki, Phys. Rev. Lett. 106, 217004, (2011).
- (16) P. Richard, K. Nakayama, T. Sato, M. Neupane, Y.-M. Xu, J. H. Bowen, G. F. Chen, J. L. Luo, N. L. Wang, X. Dai, Z. Fang, H. Ding, and T. Takahashi, Phys. Rev. Lett. 104, 137001 (2010).
- (17) T. Terashima, N. Kurita, M. Tomita, K. Kihou, C. H. Lee, Y. Tomioka, T. Ito, A. Iyo, H. Eisaki, T. Liang, M. Nakajima, S. Ishida, S. I. Uchida, H. Harima, and S. Uji, Phys. Rev. Lett. 107, 176402 (2011).
- (18) T. Shimojima, K. Ishizaka, Y. Ishida, N. Katayama, K. Ohgushi, T. Kiss, M. Okawa, T. Togashi, X.-Y. Wang, C.-T. Chen, S. Watanabe, R. Kadota, T. Oguchi, A. Chainani, and S. Shin, Phys. Rev. Lett. 104, 057002 (2010).
- (19) Y. K. Kim, H. Oh, C. Kim, D. Song, W. Jung, B. Kim, H. J. Choi, C. Y. Kim, B. Lee, S. Khim, H. Kim, K. H. Kim, J. B. Hong, and Y. S. Kwon, Phys. Rev. B 83, 064509 (2011).
- (20) K. Sugimoto, P. Prelovsek, E. Kaneshita, and T. Tohyama, arXiv: 1312.2322.
- (21) B. Valenzuela, E. Bascones, and M. J. Calderon, Phys. Rev. Lett. 105, 207202 (2010).
- (22) S. Ishida, T. Liang, M. Nakajima, K. Kihou, C. H. Lee, A. Iyo, H. Eisaki, T. Kakeshita, T. Kida, M. Hagiwara, Y. Tomioka, T. Ito, and S. Uchida, Phys. Rev. B 84, 184514 (2011).
- (23) S. Ishida, M. Nakajima, T. Liang, K. Kihou, C. H. Lee, A. Iyo, H. Eisaki, T. Kakeshita, Y. Tomioka, T. Ito, and S. Uchida, Phys. Rev. Lett. 110, 207001 (2013).
- (24) E. C. Blomberg, M. A. Tanatar, R. M. Fernandes, I. I. Mazin, Bing Shen, Hai-Hu Wen, M. D. Johannes, J. Schmalian and R. Prozorov, Nat. Commun. 4, 1914 (2013).
- (25) H. Chen, Y. Ren, Y. Qiu, Wei Bao, R. H. Liu, G. Wu, T. Wu, Y. L. Xie, X. F. Wang, Q. Huang and X. H. Chen, EPL 85, 17006 (2009).
- (26) M. A. Tanatar, A. Kreyssig, S. Nandi, N. Ni, S. L. Bud’ko, P. C. Canfield, A. I. Goldman, and R. Prozorov, Phys. Rev. B 79, 180508(R) (2009).
- (27) J. H. Chu, J. G. Analytis, D. Press, K. DeGreve, T. D. Ladd, Y. Yamamoto, and I. R. Fisher, Phys. Rev. B 81, 214502 (2010).
- (28) Y. Xiao, Y. Su, W. Schmidt, K. Schmalzl, C. M. N. Kumar, S. Price, T. Chatterji, R. Mittal, L. J. Chang, S. Nandi, N. Kumar, S. K. Dhar, A. Thamizhavel, and Th. Brueckel, Phys. Rev. B 81, 220406(R) (2010).
- (29) K. Zhao, Q. Q. Liu, X. C. Wang, Z. Deng, Y. X. Lv, J. L. Zhu, F. Y. Li, and C. Q. Jin, Phys. Rev. B 84, 184534 (2011).
- (30) I. R. Fisher, L. Degiorgi, and Z. X. Shen, Rep. Prog. Phys. 74, 124506 (2011).
- (31) Y Mizuguchi, Y Hara, K Deguchi, S Tsuda, T Yamaguchi, K Takeda, H Kotegawa, H Tou and Y Takano, Supercond. Sci. Technol. 23, 054013 (2010).
- (32) S. H. Liang, G. Alvarez,C. Sen, A. Moreo, and E. Dagotto, Phys. Rev. Lett. 109, 047001 (2012).
- (33) Y. J. Yan, A. F. Wang, X. G. Luo, Z. Sun, J. J. Ying, G. J. Ye, P. Chen, J. Q. Ma, X. H. Chen, arXiv: 1301.1734 (unpublished).