Filament eruption with apparent reshuffle of endpoints
Abstract
Filament eruption on 30 April - 1 May 2010, which shows the reconnection of one filament leg with a region far away from its initial position, is analyzed. Observations from three viewpoints are used for as precise as possible measurements of endpoint coordinates. The northern leg of the erupting prominence loop ’jumps’ laterally to the latitude lower than the latitude of the originally southern endpoint. Thus, the endpoints reshuffled their positions in the limb view. Although this behaviour could be interpreted as the asymmetric zipping-like eruption, it does not look very likely. It seems more likely to be reconnection of the flux-rope field lines in its northern leg with ambient coronal magnetic field lines rooted in a quiet region far from the filament. From calculations of coronal potential magnetic field, we found that the filament before the eruption was stable for vertical displacements, but was liable to violation of the horizontal equilibrium. This is unusual initiation of an eruption with combination of initial horizontal and vertical flux-rope displacements showing a new unexpected possibility for the start of an eruptive event.
keywords:
Sun: activity – Sun: filaments, prominences – Sun: magnetic fields infrared: stars.1 Introduction
Many solar filaments (or prominences when they are observed above the solar limb) end their life with a sudden rapid rise called an eruption. Sometimes a filament rises like an enlarging loop lying in a plane containing filament endpoints anchored in the chromosphere and the centre of the Sun (Gopalswamy & Hanaoka, 1998). A famous example suggestive of such behaviour is the eruption of the giant prominence on 28 June 1945 (’Granddaddy’) observed at the High Altitude Observatory. Some eruptive prominences deviate significantly from this plane and move in a non-radial direction (Gopalswamy et al., 2000; Filippov et al., 2001, 2002; Sun et al., 2012). Moreover, the loop may be not flat but the apex exhibits writhing motion as it rotates about the direction of ascent (Ji et al., 2003; Romano et al., 2003; Williams et al., 2005; Zhou et al., 2006; Green et al., 2007; Muglach et al., 2009; Kliem et al., 2012).
There are also partial filament eruptions when only a section of a long filament starts to ascend while other parts of the filament are observed unchanged (Tripathi et al., 2009). Usually a prominence stretched along the limb consists of a number of arches with feet (called also barbs) connected to the chromosphere like a long road bridge with several spans. After the start of ascending, the feet successively break one after another except the filament endpoints for a full eruption or feet of undisturbed filament sections for a partial eruption. Of course, in real solar environment, events are often asymmetric. One leg of an eruptive prominence may be fixed to the chromosphere at the prominence endpoint while the other point connecting the prominence with the chromosphere changes its position following after successive breaking of intermediate feet. Liu et al. (2009) identified two types of asymmetric filament eruptions: whipping-like, where the active leg whips upward, occasionally extending high into the corona; and zipping-like, where the visible end of the active leg moves along the polarity inversion line (PIL) like the unfastening of a zipper. It should be noted that the visibility of a filament depends on the loading of its magnetic skeleton with dense plasma. During the asymmetric filament eruption, the active leg can either whip upward, if it is anchored at the location where the eruption initiates; or ’zip’ away from the visible end of the active leg, where the eruption initiates, toward the ’invisible’ end of the active leg. The ’invisible’ end later becomes visible during the zipping process with mass draining down along axial filament field lines.
While, falling back to the chromosphere, eruptive prominence material can move along pre-existing magnetic flux tubes, possibly highly stretched and deformed, which belong to the prominence magnetic skeleton, there are also indications that sometimes prominence plasma returns to the chromosphere along trajectories that were formed by reconnection of the prominence magnetic field with the ambient coronal magnetic field. Grechnev et al. (2008) reported an explosive filament eruption on 13 July 2004 in which one part of the ejecta escaped as a CME, and another one fell back onto the Sun. The latter part consisted of fragments of the filament dispersed into a cloud covering almost the whole NW quadrant of the solar disk. Obviously, some areas where filament fragments landed had not been connected by field lines with the filament. On 7 June 2011, an active region filament near the west solar limb rose and erupted, hurling an enormous amount of material into the solar atmosphere (Innes et al., 2012; Gilbert ey al., 2013; Carlyle et al., 2014; van Driel-Gesztelyi et al., 2014) . The diagonal scale of the ejecta appears at least an order of magnitude larger than the initial foot-point separation, and suggests the filament carried a very large amount of mass. A significant fraction of the prominence mass was observed falling back to the solar surface along newly reconfigured magnetic field lines. van Driel-Gesztelyi et al. (2014) consider this event as clear evidence that large-scale re-configuration of the coronal magnetic field takes place during solar eruptions via the process of magnetic reconnection. Manoharan et al. (1996) reported a disk event on 25 October 1994, which provided evidence for a large-scale magnetic reconnection occurring between the expanding twisted loops and overlying transequatorial loops that interconnect quiet solar regions.
In this work, we analyze observations of the eruptive filament on 30 April - 1 May 2010, which shows reconnection of one filament leg with a region far away from its initial position. In contrast to above-mentioned examples of the coronal reconnection, the erupting filament loop does not disintegrate but keeps its shape of a rather thin loop even after a fast ’jump’ of the endpoint over a distance of 0.7 solar radius . We calculated parameters of coronal potential magnetic field and found that the eruption began with instability not in the vertical direction, as typical for eruptive filaments, but after violation of the horizontal equilibrium.
2 Observations of the Eruptive Filament on 30 April - 1 May 2010 from Three Viewpoints
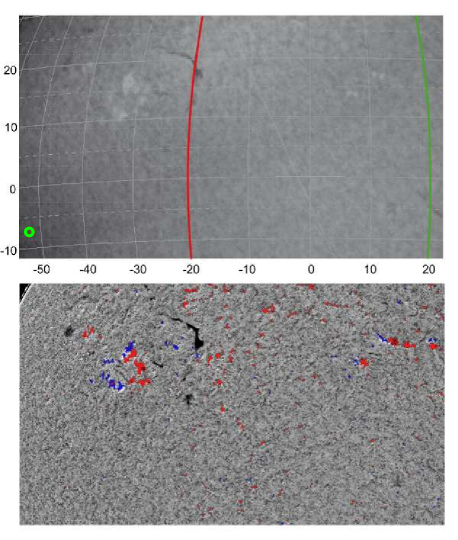
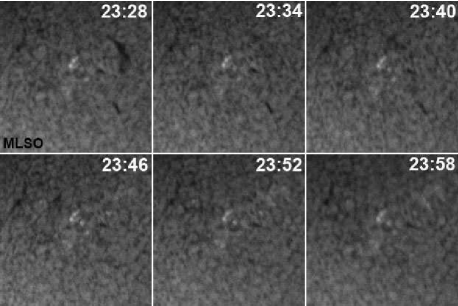
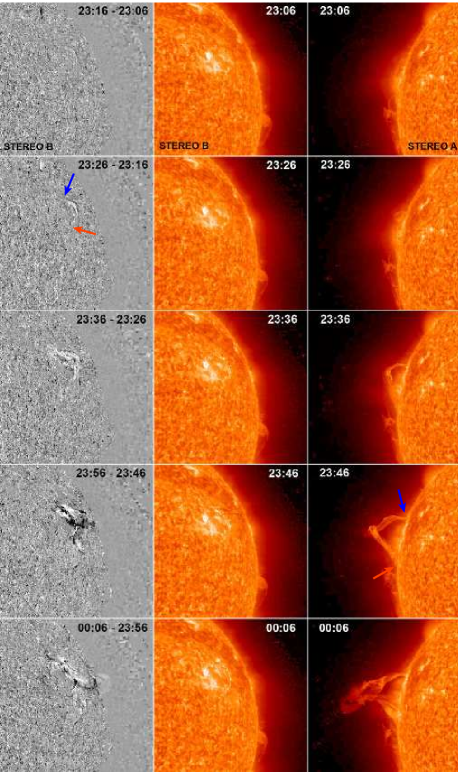
A quiescent filament, located close to NOAA active region 11064 to the north-west from it (Fig. 1), started to rise rapidly after 23 UT on 30 April 2010. The eruption was observed on the disk in H line at the Mauna Loa Solar Observatory with a cadence of 3 minutes (Fig. 2) and Culgoora Solar Observatory with a cadence of 1 minute as well as on the eastern limb by the Solar Terrestrial Relations Observatory - Ahead (STEREO A) and close to the western limb by STEREO B (Behind) with a cadence of 10 minutes (Fig. 3 and Fig. 4 ). The event was also observed on the disk with the PROBA2/SWAP EUV solar telescope in a spectral bandpass centered on 174 Å with a cadence of about 1 minutes (Seaton et al., 2013; Halain et al., 2013). At first, it looked like a typical eruption of a filament showing an expanding loop with anchored endpoints (movie 1). At 23:46 UT, the top of the loop folded over in images obtained by Sun Earth Connection Coronal and Heliospheric Investigation (SECCHI) EUVI (Wuelser et al., 2004; Howard et al., 2008) onboard STEREO A, showing writhing of the filament axis. The apex of the eruptive filament (prominence) deflected to the South during the ascending. At 00:06 UT, it was over the southern endpoint of the prominence. This endpoint became wider and consisting of several strands of threads after 00 UT. The southernmost strand faded out after 00:30 UT, while the northern strand became narrower with fine threads.
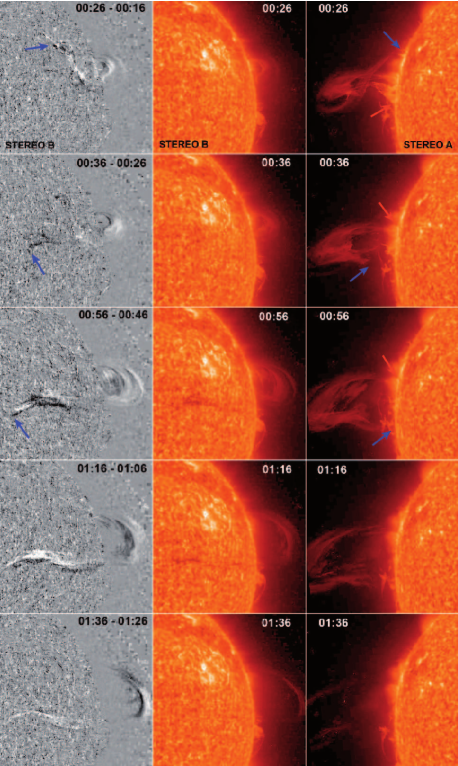
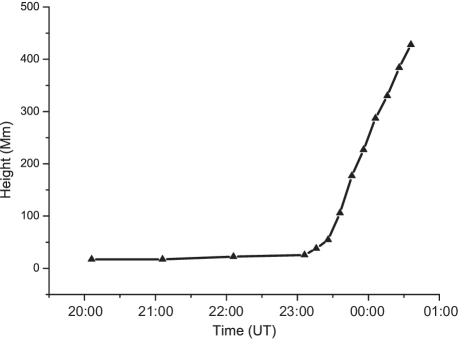
The behaviour of the northern endpoint of the filament was more dramatic. Before the eruption, the filament axis entered the chromosphere at this endpoint inclined slightly to the South from the vertical. From 23:30 UT to 00 UT, the axis was nearly vertical. Then, it inclined to the South. About 00:30 UT, the northern leg of the erupting prominence loop ’jumped’ laterally to the position further south than the southern endpoint of the prominence. The loop proceeded with expanding and ascending, however the endpoints reshuffled their positions in STEREO A images. The originally southern endpoint is now on the North, while the originally northern endpoint is on the South. Further evolution of the eruptive prominence in STEREO A images looks like typical prominence eruption with anchored in the chromosphere endpoints, if one forgets that the endpoints have exchanged the roles. The top of the prominence leaved the STEREO A field-of-view at 00:40 UT, and after 01:40 UT all the structure faded and flew away. After half an hour acceleration ( 23 UT - 23:30 UT), the top of the prominence rose with an approximately constant speed of 90 km s-1 (Fig. 5).
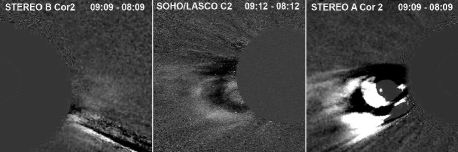
The eruption of the prominence was followed by a coronal mass ejection (CME), which was observed from all three viewpoints (Fig. 6). Due to the geometrical factor, it was brightest in the field-of-view of the STEREO A COR2 coronagraph (Howard et al., 2008). At the late stage, the legs of the CME connecting the core with the Sun show noticeable twisted structure (not visible in the difference image in Fig. 6). The Large Angle and Spectrometer Coronagraph (LASCO) C2 (Brueckner et al., 1995) onboard the Solar and Heliospheric Observatory (SOHO) and the STEREO B COR2 coronagraph registered only faint features, which became perceptible enough only in difference images. The CME propagated in the SEE direction for STEREO A and SOHO, while in the SWW direction for STEREO B. The bright core in the STEREO A COR2 field-of-view moved with a speed of about 100 km s-1. The frontal CME structure, of course, moved faster. According to the SOHO/LASCO CME Catalog (http://cdaw.gsfc.nasa.gov/CME_list/), the CME appeared first in the field-of-view of C2 at 07:12 UT on 1 May at a polar angle of 111∘, had an angular width of 108∘, and reached the final speed of 380 km s-1.
In H images obtained with groundbased telescopes, the filament rotates counterclockwise about its southern end point like a nearly straight structure (Fig. 2, see also movie 2). It passed over AR 11064 in projection and faded when it stretched in nearly longitudinal direction. Two short faint flaring ribbons appeared at 23:50 UT at the location of the most curved and widest section (an elbow in Fig. 1) of the pre-eruptive filament (Fig. 2).
Brightening below the ascending filament in STEREO B images arose at 23:36 UT soon after the start of the eruption (Fig. 3, Fig. 4, movie 3). Later on, two discontinuous ribbons became very prominent in images and a system of post-eruptive loops was observed in 171 Å channels of both STEREO A and STEREO B spacecraft. The beginning of the event in STEREO B observations also looks like a typical filament eruption. Between 00:26 UT and 00:36 UT, the attachment of the filament to the northern endpoint tore, the filament end jumped a large distance both in latitude and longitude, and found new more or less stable position in projection on the disk. In order to understand, what happened with the connectivity of the filament, what was a real displacement, and what was a projection effect, let us examine in details the position of the filament endpoints.
3 Filament Endpoint Coordinates
We used images in JPEG format from websites of the STEREO mission and ground observatories. All images are rotated in such a way that the projection of the solar rotation axis is vertical and the heliographic North is on the top of the images. In the vertical plane containing the line of sight, the rotation axis is inclined by an angle from the sky plane. Usually is indicated as the heliolatitude of the centre of the solar disk in an image of the Sun. We will use the Heliocentric Earth Equatorial coordinate system (HEEQ) with directed along the solar rotation axis, pointed to the intersection of solar equator and solar central meridian as seen from Earth, and completing the right-handed system. After measurements of the coordinates (horizontal) and (vertical) relative the to disk centre in units of the solar radius (since the scale is different in different observational data), we should rotate the coordinate system by the angle around the axis and transform the Cartesian coordinates into spherical heliocentric coordinates and assuming that all points of interest are located on the spherical surface .
| (1) |
| (2) |
| (3) |
| (4) |
| (5) |
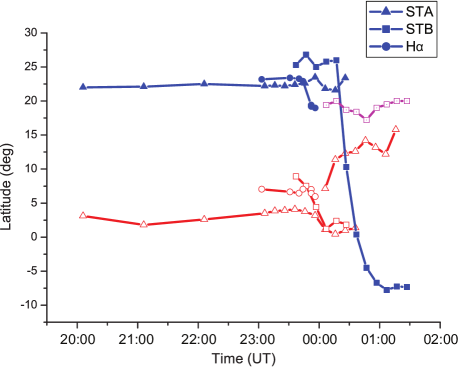
The results of measurements are shown in Fig. 7 and Fig. 8. The red curves and symbols correspond to the southern endpoint, the blue curves and symbols correspond to the northern endpoint. Triangles (squares) show data from STEREO A (STEREO B) images, circles represent data from H observations. In general, data from all points of view are in good agreement with each other. Uncertainties and discrepancies appear due to difficulties of identification of the same features in different projections because of the complicated internal structure of the filament. In particular, bifurcation of the southern filament leg leads to appearing of an additional (higher-latitude) branch in the southern endpoint position data of STEREO A (Fig. 7). On the late phase of the eruption, the originally southern endpoint cannot be recognized in STEREO-B images. Only material projected on the sky plane above the limb as a prominence indicates the position of the originally southern section of the filament. The lowest part of the prominence, indicated by the magenta arrow in Fig. 9, is the nearest to the southern endpoint visible section of the filament. The magenta curve in Fig. 7 shows the latitude of the crossing point of the prominence leg with the STEREO-B limb. Due to the curved shape of the erupting filament, the latitude of the crossing point is greater than the latitude of the southern endpoint derived from STEREO A observations (short red curve with triangle symbols in Fig. 7) but the difference is not very significant. There is a wide jump of more than 30∘ in the northern endpoint latitude during changing of its ’connectivity’.
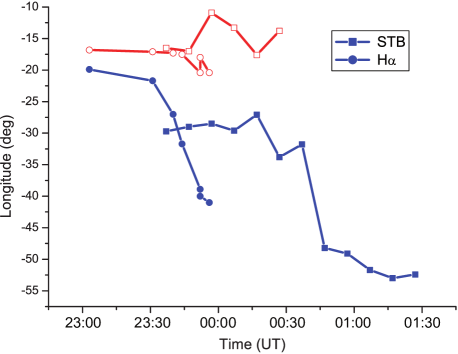
Longitude of the northern endpoint also changes about 30∘ (Fig. 8). The exact position of this endpoint in longitude is less definite than in latitude because the northern section of the filament has nearly longitudinal orientation (Fig. 1), while this section is rather faint in H images and its visibility varies in time (compare Fig. 1 and Fig. 2). This is the main reason for a more steep decrease of the northern endpoint longitude derived from the H data. We fix the visible northern end of the filament in H images, however this is not the endpoint of the flux rope anchored in the photosphere but the middle part of the moving flux rope with the northern endpoint still anchored at the same place (compare Fig. 2 or better movie 2 with the difference images at 23:56 UT - 00:06 UT, 00:26 UT - 00:16 UT in Fig. 3, Fig. 4 and movie 3).
Formulas (4) - (5) and results shown in Fig. 7 and Fig. 8 assume that selected points are located on the solar surface. This is correct for the southern endpoint which is observed connected with the chromosphere on the limb till the last phase of the event. Situation with the northern endpoint is more intricate. We have no information about the height of the filament loop end above the chromosphere observed by STEREO B . Since the final position of the moving loop end is not far from the disk centre in the STEREO B images, the real coordinates more or less correspond to the values shown in Fig. 7 and Fig. 8. We can only estimate an upper bound on the height of the filament end point seen by STEREO B. The difference STEREO A image in Fig. 9 shows that at 01:06 UT the former northern (now eastern) end point must have a height lower than the line of sight tangent to the limb for STEREO A because the prominence material extends down to the limb in the STEREO A view (see also movie 3). At this time, the eastern (former northern) endpoint in STEREO B images finds its final position.

The height of the line-of-sight above a point on the solar surface with coordinates and (or the length of the radial segment from a given point to the intersection with a tangent to the limb) is
| (6) |
where is the angle between the radius passing through the given point and the sky plane. This angle is given by
| (7) |
For STEREO A images, we should use a coordinate system related to them. For this purpose, the HEEQ system should be rotated by the separation angle between the Earth and STEREO A of 70∘ around the axis and by the angle of inclination of the solar rotational axis from the sky plane = 4∘.12 around the axis. According equations (1) - (5)
| (8) |
| (9) |
The approximate coordinates of the eastern endpoint = 8∘, = -52∘ in the HEEQ system transform to = 10∘, = -121∘. Then, = 31∘ and = 116 Mm. This height is much less than the height of the prominence top of about 500 Mm at this time (Fig. 5). Therefore, the shape of the prominence axis at the later stage of the eruption is a loop with low endpoints. The eastern (former northern) filament extremity is located definitely below 100 Mm and possibly finds connection with the chromosphere at a new point after coronal reconnection.
4 Magnetic Field and Filament Stability
It is widely accepted now that filaments represent cold dense plasma contained within magnetic flux ropes embedded into coronal magnetic field. A flux rope can exist in equilibrium in an ambient magnetic field for a rather long time before an eruption. Van Tend & Kuperus (1978) showed first that there is a critical height for stable flux rope equilibria above which the background coronal magnetic field decreases faster than the inverse height. The transition from stability to instability was named later catastrophic loss of equilibrium and was assumed to be the cause of sudden eruptive events (Priest & Forbes, 1990; Forbes & Isenberg, 1991; Lin et al., 1998; Schmieder et al., 2013). Van Tend & Kuperus (1978) modeled a flux rope with the magnetic field created by a straight line current. If a flux rope is curved, an additional force called the ’Lorentz self-force’ or ’hoop force’ is present (Bateman, 1978) . It is directed away from the curvature centre. In the presence of an ambient magnetic field, the curved flux rope can be both in stable or unstable equilibrium depending on properties of the external field. Kliem & Trk (2006) called the related instability ’torus instability’ and showed, following Bateman (1978) , that it occurs when the background magnetic field decreases along the major radius of the expanding flux rope faster than . Dmoulin & Aulanier (2010) carefully compared the two types of models and came to conclusion that the same physics is involved in the instabilities of circular and straight current channels. The stability of the flux-rope equilibrium in both models depends on the rate of the background field decrease, quantified by the so-called decay index,
| (10) |
where is the horizontal magnetic-field component perpendicular to the flux rope axis and is the height above the photosphere. Filippov & Den (2000, 2001) pioneered in applying this index to the analysis of filament stability. Dmoulin & Aulanier (2010) found that for the typical range of current-channel thickness expected in the corona and used in many MHD simulations (Trk & Kliem, 2007; Schrijver et al., 2008; Fan, 2010; Lugaz et al., 2011), and for a current channel expanding during an upward perturbation, a critical decay index has similar values for both the circular and straight current channels in the range 1.1 - 1.3.
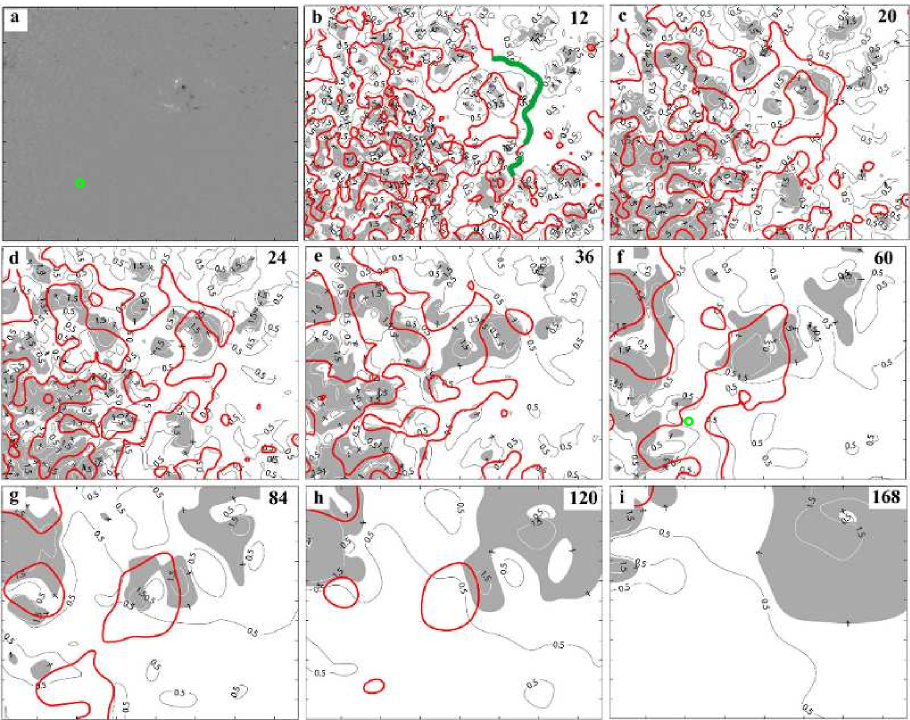
To analyze the equilibrium conditions of the flux rope associated with the filament we calculated the shape of PILs and the distribution of the decay index of the potential magnetic field at different heights in a region surrounding the filament (see Filippov 2013 for details). Figure 10(a) represents a fragment of the magnetogram taken by the Michelson Doppler Imager (MDI; Scherrer et al. 1995) onboard SOHO on 30 April 2010 at 22:27 UT, which was used as a boundary condition for the potential magnetic field calculations. In Fig. 10, thin lines show isocontours of = 0.5, 1, 1.5, while thick red lines indicate the positions of PILs at respective heights. Areas, where , are shadowed. A PIL is a place where a coronal electric current (a flux rope) can find the horizontal equilibrium. The thick green line in Fig. 10(b) shows the section of the PIL occupied by the filament as it is seen in H line. The filament lays over the PIL separating the area of predominantly negative network polarity in the upper right corner of the frame from active region 11064 near the centre of the frame. The left part of the magnetogram contains a mixture of faint small-scale opposite polarities producing numerous closed PIL contours (Fig. 10(b) - 10(e)).
The height of the prominence in a stable state before the eruption is 17 Mm (Fig. 5). At this height, the filament is within the area of stability (Figures 9(b) - 9(c)). The location of the filament is stable in the vertical direction even at much greater heights, but at a height of 20 Mm the PIL occupied by the filament touches the PIL surrounding the negative polarity of AR 11064 and reconnects with it. A newly formed PIL (Fig. 10(d)) protrudes far to the East from the initial filament position. Since the flux rope can find the horizontal equilibrium only on the PIL, it will be pushed to the East by the Lorentz force, if it reaches a height greater than 20 Mm. Moreover, some sections of higher-altitude PILs are located within unstable (grey) areas. So, the flux rope, if it arrives upon these sections, will be forced to rise.
PILs associated with small-scale magnetic sources disappear above a height of 60 Mm. Only a small annular PIL in the centre of the domain remains at a height of 140 Mm and it also disappears at a height of 160 Mm.
5 Discussion
It is widely believed that the most probable initial magnetic configuration, which accumulates dense prominence plasma and later hurls a CME into the interplanetary space, is a flux rope consisted of helical field lines (Chen, 1989; Lin et al., 1998; Titov & Dmoulin, 1999; Amari et al., 2000; Low, 2001; Kliem & Trk, 2006; Zuccarello et al., 2012). An alternative configuration of a CME source region is a sheared arcade (Moore & Roumeliotis, 1992; Choe & Lee, 1996; , Antiochos et al.1999), which is converted into a flux rope structure due to reconnection in the course of the eruption. Usually, initiation of filament eruptions is associated with the instability of the flux-rope equilibrium in the vertical direction. Our prominence was rather low before the eruption, and it starts to ascend rapidly from a height of about 20 Mm. The maps of the decay index distribution (Fig. 10) show that the vertical equilibrium of a flux rope at the location of the filament can be stable even at several times greater heights. However, the topology of the magnetic field varies rapidly with height. At a height of about 20 Mm the PIL, where the flux rope sits, touches the PIL surrounding the negative polarity of AR 11064 and reconnects with it. The horizontal equilibrium of the flux rope can easily be disturbed due to the proximity of another PIL. In principle, it could find new stable equilibrium over the changed PIL, but some sections of this PIL are unstable for vertical displacements, which leads to the filament eruption. This is unusual initiation of an eruption with combination of initial horizontal and vertical flux-rope displacements, to the author’s knowledge, never mentioned before.
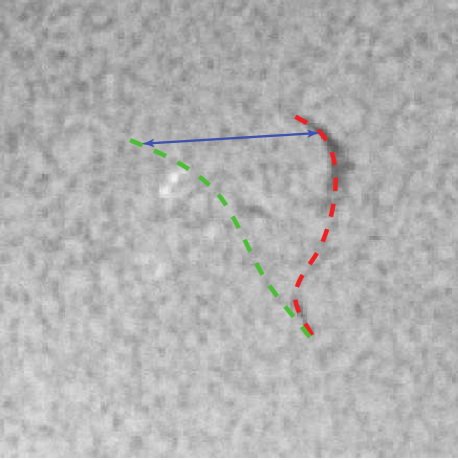
Initial motion is slow, so it is not so easy to catch the beginning of the displacements in horizontal and vertical directions. Taking into account changes in seeing conditions, some lateral displacement of the filament can be recognized between 22:40 UT and 22:58 UT in MLSO H images. However, internal motions within the filament can mask or emulate the real displacement of the filament as a whole. The same changes can be found in PROBA2/SWAP 174 Å images. Small changes in a height of the prominence are noticeable between 22:36 UT and 22:56 UT in STEREO A 304 Å images. It is also difficult to distinguish slow prominence rising from effects related to the solar rotation and prominence shape changes. Thus, it can be only stated that both motions start practically simultaneously. We can compare finite displacements of the filament in horizontal and vertical directions in the beginning of the event over a period of time from 23:06 UT to 23:46 UT. Since the contrast of the filament is low in the H images (Fig. 2), we draw in Fig. 11 filament spines with the help of the time sequence (movie 2). The horizontal distance is about 150 Mm, while the change in height as evident from Fig. 3 and Fig. 5 is about 150 Mm too. So, the deviation of the trajectory of the eruptive filament from the vertical line is near 45∘.
The behaviour of the filament endpoints is also unusual. The northern end of the filament during the eruption suddenly changes its anchoring to a position about 40∘ from the starting position. The process of the filament endpoint change does not look very similar to whipping-like or zipping-like asymmetric filament eruptions. The latter would imply the existence of a long flux rope partly loaded with the filament mass. During the eruption, internal plasma motions along the flux-rope axis would reveal the previously invisible far endpoint of the flux rope. In our case, it is difficult to admit the existence of such a long flux rope reaching the disk centre in the STEREO B images. The PIL, which the filament is associated with, runs to the North-East at all heights below 40 Mm. There is a high PIL stretched from the filament position to the South-East (Fig. 10(f)) but we have no manifestations of the presence of the flux rope there. In principle, we can imagine the existence of an invisible (no mass load) flux rope with one endpoint anchored at the bottom-left corner of the studied region, which extends at a height more than 40 Mm to the upper-right corner where it is lowed down to a height of 20 Mm and turns to the bottom of the region providing conditions for the filament formation. Only in this case, the observed prominence behaviour could be interpreted as the asymmetric eruption.
Another possibility is reconnection of the flux-rope field lines somewhere along the northern half of rising filament loop with ambient coronal magnetic field lines rooted in a quiet region to the South-East from the filament. In contrast to examples of the coronal reconnection, where the filament body disintegrates, the studied erupting filament loop keeps its shape of a rather thin loop. Reconnection of an erupting flux rope with ambient coronal flux has been seen in several numerical simulations of eruptions (Gibson & Fan, 2006, 2008; Lugaz et al., 2011).
We found from comparison of STEREO A and STEREO B images that the observed final height of the originally northern leg (marked with the blue arrows in Fig. 9) is at least lower than 100 Mm while the height of the prominence top at this time is about 500 Mm. Thus, the shape of the erupting filament axis is a loop with the high summit and low ends.
6 Summary and Conclusions
We studied the filament eruption on 30 April - 1 May 2010, which shows the reconnection of one filament leg with the region far away from its initial position. Observations from three viewpoints were used, namely on-disk H observations by the Mauna Loa Solar Observatory, Culgoora Solar Observatory together with EUV observations by PROBA2 and on-limb observations by STEREO A and STEREO B. At the beginning of the event, the eruptive prominence looked like a typical one, that is as an expanding loop with anchored endpoints. Then the top of the loop folded over showing writhing of the filament axis and deflected to the South during the ascending. A little later, the endpoints reshuffled their positions in the limb view. The northern leg of the erupting prominence loop ’jumps’ laterally to the latitude lower than the latitude of the former southern endpoint. This behaviour could be interpreted as the asymmetric zipping-like eruption, although it does not look very likely. Although there is a PIL stretched at a height above 40 Mm from the former filament position to the new eastern end point (Fig. 10(f)), no manifestations of the presence of the flux rope were observed there and any flare-ribbon-like brightening along the path of this PIL was absent. Hence, observations do not support the interpretation of the event as a whipping-like or a zipping-like asymmetric filament eruption. More probable seems reconnection of the flux-rope field lines in its northern leg with ambient coronal magnetic field lines rooted in a quiet region far from the filament.
The eruption of the prominence was followed by a CME. Due to the geometrical factor, it was brightest in the field-of-view of the STEREO A COR2 coronagraph. At the late stage, the legs of the CME connecting its core with the Sun show noticeable twisted structure.
We calculated parameters of coronal potential magnetic field and found that the eruption is likely to begin with an instability not in the vertical direction, as typical for eruptive filaments, but after the violation of the horizontal equilibrium. Observations show that the trajectory of the eruptive filament deviates from the vertical line by an angle of about 45∘. This is unusual initiation of an eruption with combination of horizontal and vertical initial flux-rope displacements showing new unexpected possibility for the start of eruptive events.
Acknowledgments
The author acknowledge the Mauna Loa Solar Observatory, Culgoora Solar Observatory, STEREO, SOHO, and PROBA2 teams for the high-quality data supplied. The author thank the referee for critical comments and useful suggestions. This work was supported in part by the Russian Foundation for Basic Research (grants 12-02-00008, 14-02-92690).
References
- Amari et al. (2000) Amari T., Luciani J., Mikic F.Z., Linker J., 2000, ApJ, 529, L49
- (2) Antiochos S.K., DeVore C.R., Klimchuk J.A., 1999, ApJ, 510, 485
- Bateman (1978) Bateman G., 1978, MHD Instabilities, Massachusetts Institute of Technology, Cambridge, MA.
- Brueckner et al. (1995) Brueckner G.E. et al. 1995, Sol. Phys., 162, 357
- Carlyle et al. (2014) Carlyle J., Williams D.R , van Driel-Gesztelyi L., Innes D., Hillier A., Matthews S., 2014, ApJ, 782, 87
- Chen (1989) Chen J., 1989, ApJ, 338, 453
- Choe & Lee (1996) Choe G.S., Lee L.C., 1996, ApJ, 472, 360
- Dmoulin & Aulanier (2010) Dmoulin P., Aulanier G., 2010, ApJ, 718, 1388
- Fan (2010) Fan Y., 2010, ApJ, 719, 728
- Filippov (2013) Filippov B., 2013, ApJ, 773, 10
- Filippov & Den (2000) Filippov B.P., Den O.G., 2000, Astron. Lett., 26, 322
- Filippov & Den (2001) Filippov B.P., Den O.G., 2001, J. Geophys. Res., 106, 25177
- Filippov et al. (2001) Filippov B.P, Gopalswamy N., Lozhechkin A.V., 2001, Sol. Phys., 203, 119
- Filippov et al. (2002) Filippov B.P., Gopalswamy N., Lozhechkin A.V., 2002, Astron. Rep., 46, 417
- Forbes & Isenberg (1991) Forbes T.G., Isenberg P.A., 1991, ApJ, 373, 294
- Howard et al. (2008) Howard R.A. et al., 2008, Space Sci. Rev., 136, 67
- Gibson & Fan (2006) Gibson S.E., Fan Y., 2006, ApJL, 637, L65
- Gibson & Fan (2008) Gibson S.E., Fan Y., 2008, JGR, 113, A09103
- Gilbert ey al. (2013) Gilbert H.R., Inglis A.R., Mays M.L., Ofman L., Thompson B.J., Young P.R., 2013, ApJ, 776, L12
- Gopalswamy & Hanaoka (1998) Gopalswamy N., Hanaoka Y., 1998, APJL, 498, L179
- Gopalswamy et al. (2000) Gopalswamy N., Hanaoka Y., Hudson H.S., 2000, Adv. Space Res., 25, 1851
- Grechnev et al. (2008) Grechnev V.V., Uralov A.M., Slemzin V.A., Chertok I.M., Kuzmenko I.V., Shibasaki K., 2008, Sol. Phys., 253, 263
- Green et al. (2007) Green L.M., Kliem B., Trk T., van Driel-Gesztelyi L., Attrill G.D.R., 2007, Sol. Phys., 246, 365
- Halain et al. (2013) Halain J.-P. et al., 2013, Sol. Phys., 286, 67
- Innes et al. (2012) Innes D.E., Cameron R.H., Fletcher L., Inhester B., Solanki S.K., 2012, A&A, 540, L10
- Ji et al. (2003) Ji H., Wang H., Schmahl E.J., Moon Y.-J., Jiang Y., 2003, ApJ, 595, L135
- Kliem & Trk (2006) Kliem B., Trk T., 2006, Phys. Rev. Lett., 96(25), 255002
- Kliem et al. (2012) Kliem B., Trk T., Thompson W.T., 2012, Sol. Phys., 281, 137
- Lin et al. (1998) Lin J., Forbes T.G., Isenberg P.A., Dmoulin P., 1998, ApJ, 504, 1006
- Liu et al. (2009) Liu R., Alexander D., Gilbert H.R., 2009, ApJ, 691, 1079
- Low (2001) Low B.C., 2001, J. Geophys. Res., 106, 25141
- Lugaz et al. (2011) Lugaz N., Downs C., Shibata K., Roussev I.I., Asai A., Gombosi T.I., 2011, ApJ, 738, 127
- Manoharan et al. (1996) Manoharan P. K., van Driel-Gesztelyi L., Pick M., P. Dmoulin P., 1996, APJL, 468, L73
- Moore & Roumeliotis (1992) Moore R.L., Roumeliotis G., 1992, in Svestka Z., Jackson B.V., Machado M.E., eds, Proc. IAU Colloquium 133, Eruptive Solar Flares, Lecture Notes Phys. Vol. 399, Springer, Berlin, p. 69
- Muglach et al. (2009) Muglach K., Wang Y., Kliem B.,2009, ApJ, 703, 976
- Priest & Forbes (1990) Priest E.R., Forbes T.G., 1990, Sol. Phys., 126, 319
- Romano et al. (2003) Romano P., Contarino L., Zuccarello F., 2003, Sol. Phys., 214, 313
- Seaton et al. (2013) Seaton D.B. et al., 2013, Sol. Phys., 286, 43
- Scherrer et al. (1995) Scherrer P.H. et al. 1995, Sol. Phys., 162, 129
- Schmieder et al. (2013) Schmieder B., Dmoulin P., Aulanier G., 2013, Adv. Space Res., 51(11), 1967
- Schrijver et al. (2008) Schrijver C.J., Elmore C., Kliem B., Trk T., Title A.M. 2008, ApJ, 674, 586
- Sun et al. (2012) Sun X., Hoeksema J.T., Liu Y., Chen Q., Hayashi K., 2012, ApJ, 757, 149
- Titov & Dmoulin (1999) Titov V.S., Dmoulin P., 1999, A&A, 351, 707
- Trk & Kliem (2007) Trk T., Kliem B., 2007, Astronomische Nachrichten, 328, 743
- Tripathi et al. (2009) Tripathi D., Gibson S.E., Gilbert H.R., Qiu J., Fletcher L., Liu R., Mason H.E., 2009, A&A, 498, 295
- van Driel-Gesztelyi et al. (2014) van Driel-Gesztelyi L. et al., 2014, in Schmieder B., Malherbe J.-M. , Wu S.T, eds, Proc. IAU Symposium 300, Nature of Prominences and their role in Space Weather, Cambridge University Press, Cambridge, UK, p. 502
- Van Tend & Kuperus (1978) Van Tend W., Kuperus M., 1978, Sol. Phys., 59, 115
- Williams et al. (2005) Williams D.R., Trk T., Dmoulin P., van Driel-Gesztelyi L., Kliem B., 2005, ApJ, 628, L163
- Wuelser et al. (2004) Wuelser J.-P. et al., 2004, Proc. SPIE, 5171, p. 111
- Zhou et al. (2006) Zhou J. et al., 2006, ApJ, 651, 1238
- Zuccarello et al. ( 2012) Zuccarello F., Meliani Z., Poedts S., 2012, ApJ, 758, 117