Layered water Cherenkov detector for the study of ultra high energy cosmic rays
Abstract
We present a new design for the water Cherenkov detectors that are in use in various cosmic ray observatories. This novel design can provide a significant improvement in the independent measurement of the muonic and electromagnetic component of extensive air showers. From such multi-component data an event by event classification of the primary cosmic ray mass becomes possible. According to popular hadronic interaction models, such as EPOS-LHC or QGSJetII-04, the discriminating power between iron and hydrogen primaries reaches Fisher values of 2 or above for energies in excess of eV with a detector array layout similar to that of the Pierre Auger Observatory.
keywords:
UHECR, Mass composition , Surface array , Cherenkov detectors1 Introduction
At the highest energies, above 1019 eV (10 EeV or 1.6 Joules), cosmic rays are scarce (less than one per km2 per year) and with limited data on their nature. This situation dramatically limits the contribution of Ultra High Energy Cosmic Ray (UHECR) physics to fundamental physics. However, if one could access the nature of the primary particle and the details of the cascade evolution and content, substantial information would be collected about hadronic interactions above 100 TeV center-of-mass and about the sources of such energetic particles. Aiming at an excellent primary cosmic ray identification, multi-parametric measurements of Extensive Air Showers (EAS) have the potential of measuring hadronic cross sections above 100 TeV and up to 450 TeV center-of-mass, constraining interaction models, detecting or setting limits on UHE neutrino or gamma ray fluxes, identifying UHECR sources, and constraining Galactic and intergalactic magnetic fields.
Such a collection of data regarding particle interactions and cascade development at the highest energies will certainly play an invaluable role in our understanding of fundamental physics (and regarding the nature and content of our Universe). However, the limitations of current measurements regarding, in particular, the nature (or composition) of the cosmic ray flux above 50 EeV strongly limit the coherent understanding of the available data and our capacity to address fundamental questions regarding particle interactions and transport at the highest energies, together with the nature of the sources of the particles. Even today, the existence of the Greisen-Zatsepin-Kuz’min (GZK) cut-off [1, 2] is still not totally resolved as the observed reduction in the cosmic-rays spectrum can still be interpreted as the sources “running out of steam”.
From the experimental point of view it is clear that large statistics and high-precision composition measurements at the highest energy (above a few tens of EeV) are needed. The current results [3, 4, 5, 6, 7] show that these measurements can hardly be made, with the required statistics, using current setups, in particular, because of the low duty cycle of current fluorescence detectors [8, 9, 10].
In this paper, we introduce a novel design of water Cherenkov detectors which allows one to measure independently the muonic and electromagnetic components of the EAS and will not suffer of the duty cycle limitations of the fluorescence detection technique. The design concept and its application to water Cherenkov stations as in the Pierre Auger Observatory (Auger) are described in section 2. Its properties and performance for mass composition studies are discussed in section 3. A first prototype has been successfully installed at the Auger site and first results are shown in section 5.
2 Design principles
2.1 Why count muons
After the few first interactions, EAS generated by UHECR contain a very large number of particles undergoing an even larger number of interactions. One can therefore expect that the cascade description can be modeled from a reduced set of universal functions that will depend on the shower age and whose relative amplitudes will carry the information on the primary type and energy. This “universality” concept [11, 12] has been extensively studied and validated with Monte Carlo simulations and, indeed, the arrival direction, the depth of shower maximum (Xmax ) and the muon size at ground (Sμ ) effectively contain the essential information about the primary UHECR. It follows that one can parametrize the ground signal of EAS with a set of universal functions (predicted or measured and only dependent on those macroscopic quantities), from which the relevant information about the primary UHECR can be retrieved [12].
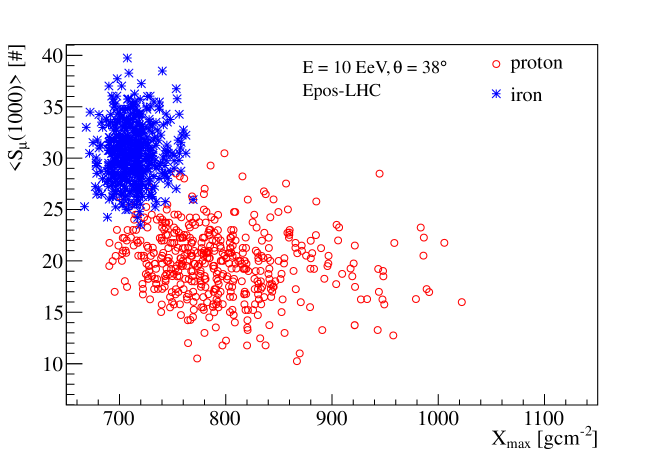
The principle of cosmic ray mass determination using the muon densities at ground and the shower maximum is illustrated in figure 1 where a set of 10 EeV proton and iron simulated showers at 38 degrees zenith angle has been used. It is clear that, once the energy is known, a selection criterion can be built in the Xmax vs Sμ plane that permits a very high efficiency/purity separation between the two species. Hence, a detector design that can perform an appropriate measurement of both these quantities (or related ones) should provide the necessary information to analyse cosmic ray data within definite mass samples. In figure 1 no detector resolution is taken into account. In the next sections the impact of a more realistic situation is presented. However, it is evident from this figure that, due to shower to shower fluctuations, a resolution of about 20 g/cm2 for Xmax is needed to infer the mass composition on the event by event basis. On the other hand, a resolution of about 10 to 20% for Sμ is also suitable given Poisson fluctuations in the muon numbers at ground and the limited surface area of muon counters that can be realistically deployed ( 10 m2).
2.2 Layered system
Energy absorption in water Cherenkov detectors (WCD) can be used to distinguish muons from the electromagnetic (EM) component of EAS. The electromagnetic particles (e+/e- and photons) reaching the ground have an average energy of about 10 MeV. Electrons and positrons are absorbed in water over a few centimeters while photons deposit their energy over a radiation length ( 36 cm). On the other hand muons, having a typical average energy of a few GeV, can go through several meters of water without being stopped. If the water volume of a WCD is split into two horizontal layers, one of which being at least partially shielded from the electromagnetic component, then the two volumes will provide distinct responses to the EAS components. A Layered Surface Detector (LSD) can therefore provide the means to reconstruct independently, for each EAS, the muonic and electromagnetic components. One remarkable property is that the shielding of the muon sensitive volume does not need to be very large: in practice a single radiation length is enough to achieve good performance. This is due to the fact that WCD have a distinct response to the EM and muonic component of EAS. Indeed, whereas EM particles of the EAS are absorbed in the water volume in a calorimetric way, muons are minimum ionizing particles and deposit an amount of energy proportional to their track length (i.e., several hundreds of MeV for a meter depth detector).
In its simplest form, a LSD is composed of two independent and light-tight volumes that are created by inserting a horizontal reflective layer in a water volume. Other implementations with more than two layers and/or shielding on the side can also be imagined. However the simple design described here is enough to show the main properties of such a detector. In the next section, a modification of the WCD design from the Auger surface array [13] is presented based on this design.
2.3 A LSD design from the Auger WCDs
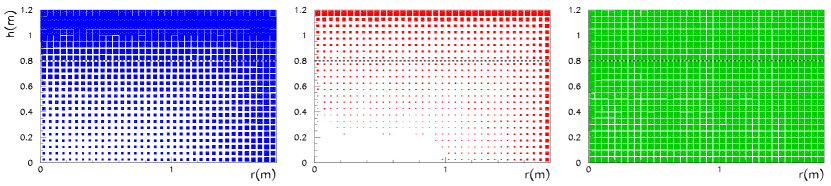
The Auger WCD [14] have a 1.8 m radius by 1.2 m height water volume, overlooked by three 9 inch photomultiplier tubes. In figure 2 we show the production point of Cherenkov photons in such detectors, for a 30 EeV shower with 45∘ zenith angle. As expected the EM component dominantly deposits its energy on the top and side of the station.
The two water volumes of the LSD can be created by inserting a horizontal reflective layer at a height of 80 cm from the WCD bottom111This choice is justified in the next paragraph. This is represented as a dashed line in figure 2. The three PMTs that equip the Auger WCD are left in place. In the upper layer, the EM component of an EAS will deposit most of its energy, while the 80 cm bottom layer will detect the much more penetrating muons (and to a lesser degree the surviving EM particles).
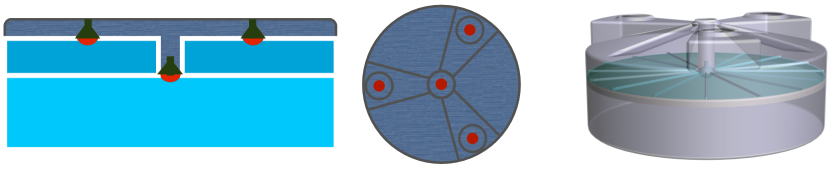
A central cylinder of about 10 inch diameter provides the mechanical structure as well as the enclosure for the additional 9 inch photo-tube that collects the light from the bottom layer. Some simplified schematics and an artistic view of this LSD is shown in figure 3.
2.4 Signal extraction
The reconstruction of the EM and muonic component of EAS relies on the fraction of the signal deposited by each component in each of the two layers. These fractions define a matrix that gives the measured top and bottom signal ( and respectively) as a linear superposition of the EM () and muon () contributions (the column sums of the matrix are one by construction),
| (1) |
Hence, if the matrix can be inverted, the muonic and EM signal deposition in the LSD can be retrieved as :
| (2) |
The determinant of the matrix is and maximises when is equal to the identity ( and ). In a realistic situation is always less than one while is always larger than zero, hence will be less than one. This is important as the statistical uncertainty in the reconstructed muonic and EM signals from measurements in the top and bottom layer are driven by , the determinant of .
The coefficients and depend on the geometry of the two water volumes and on the efficiency of the light collection. They can be obtained from well established simulations of the tank response. A rough estimate of and can be derived for a vertical incidence, when neglecting the signal produced by particles entering through the side of the detector. In fact, modelling the absorption of the electromagnetic component by an exponential decay according to the radiation length and for a tank of height with a layer interface located at a distance from the bottom we have :
| (3) |
is maximum for . If is large enough (keeping the radius also large so that the side contributions can still be neglected) goes to 1 while goes to 0 and tends towards the ideal unity matrix. In a more realistic case, particles entering from the side wall of the station cannot be neglected and the optimal values of and also depend on the proportion between the height and the radius of the tank.
In the particular case of the Auger WCD, is 120 cm, cm giving cm. An optimal position for the interface layer is therefore at about 80 cm from the bottom of the water tank.
3 Performances
3.1 Matrix universality
To precisely calculate and and to characterize the performances of the LSD, simulations of the detector response have been performed. Air showers have been simulated with the CORSIKA code [15], using EPOS-LHC [16] and QGSJetII.04 [17] as high energy interaction models and FLUKA [18] at low energy. Various libraries have been generated with a uniform distribution in for different primary type (proton, helium, nitrogen and iron) and in two energy intervals (from 8 to 13 EeV and from 40 to 60 EeV, uniformly distributed in the logarithm of energy).
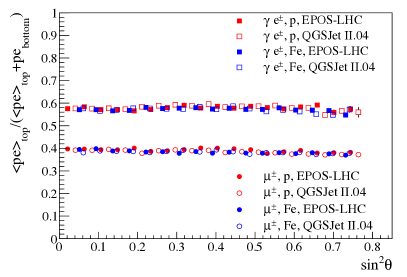
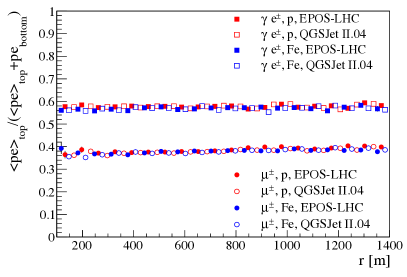
The matrix coefficients and are derived from simulations as the ratio between the photo-electrons collected in the top layer and the total number of photo-electrons in the two volumes for the EM and muonic components respectively. A remarkable property of the LSD is that the coefficients and are essentially independent of the UHECR primary type and energy and also of the particular simulation model used to describe the EAS. This is shown in figure 4 where the coefficient and have been evaluated for different primaries and hadronic models and are shown as a function of zenith angle and distance to core. It is notable that for the Auger WCD geometry, and are also essentially independent of the shower zenith angle in the range [0, 60∘]. This is due to a compensation between the top and side wall contributions coming from the particular geometry of the Auger WCD which have an height over radius ratio of 2/3.
For the particular case of the LSD from the modified Auger WCD the parameter is nearly 0.6 while is about 0.4 (see figure 4), leading to a determinant =1/5.
3.2 Signal reconstruction
For ground arrays the reconstruction of the primary UHECR properties relies on the adjustment of a lateral distribution function (LDF) that describes the detector signals as a function of their distance from the core. The value of the LDF at a reference distance to core222The reference distance is chosen as the one which minimizes the fluctuations of the expected signal, due to the lack of knowledge on the LDF. It is a function of the array grid spacing and the EAS energy range studied. It is 1000 m for Auger [19]. serves as an energy estimator but other characteristics such as its slope also reflect EAS properties, for instance its age. Using the LSD, it is possible to derive two independent LDFs, one for the muonic and one for EM component, by means of the corresponding signals reconstructed in each station. This offers the additional possibility to perform an energy reconstruction that takes into account the muon size and shower age and to produce a calibration based only on the electromagnetic component. Such a procedure would be less sensitive to the shower to shower fluctuation and to the interaction models than the one that uses the mixed EM and muonic signals.
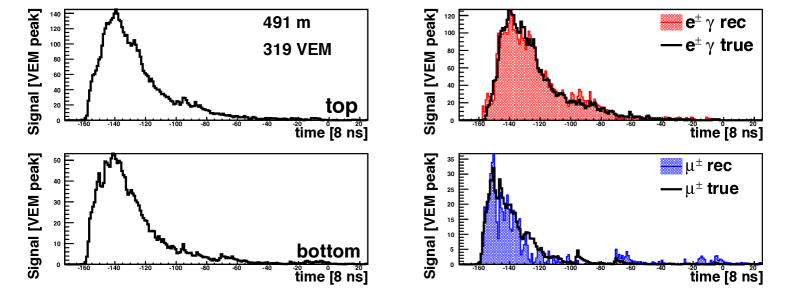
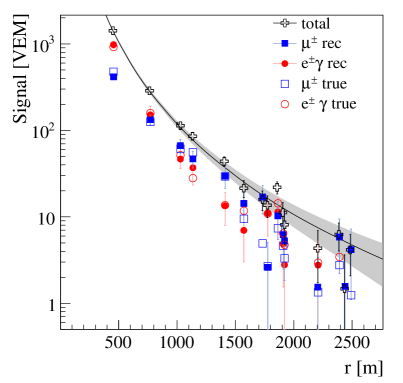
Inverting the matrix , it is possible to construct for each detector FADC traces for the two components separately. An example is shown in figure 5 for an 11 EeV shower at 46∘ zenith angle. This graph alone demonstrates the power of the LSD to accurately determine the muonic and electromagnetic components of the EAS, for both the integrated signals and their time distribution. The muonic and electromagnetic LDFs can easily be reconstructed from these individual measurements, as shown in figure 6 (left).

3.3 Mass separation
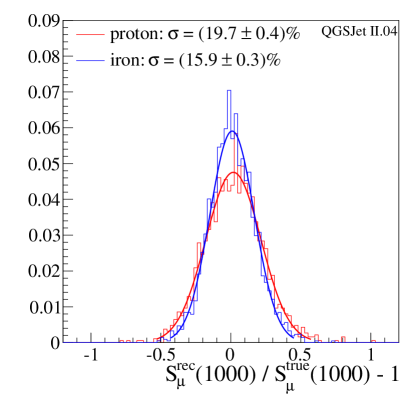
With the LSD one can reconstruct the muon signals from at distances to core of nearly 200 m to more than 2 km for the highest energetic showers. As shown in figure 6 (right), the signal resolution in each detector is better than 25% when more than 20 muons enter the detector while the Poisson fluctuations dominate for smaller signals. These resolutions are given for 10 EeV and they improve significantly above 40 EeV, e.g. 14% for the muon size.
By following the usual approach for the shower size reconstruction with surface array detectors, a measurement of the muon size of EAS can be obtained from the muonic LDF, at a reference distance333We adopt here the same reference distance as in Auger (1000 m), but optimal values can be derived in the future.. The global resolution on the EAS muon size parameter is 20% (16%) for proton (iron) at 10 EeV, improving to about 10% for both at 70 EeV (see figure 7, left).
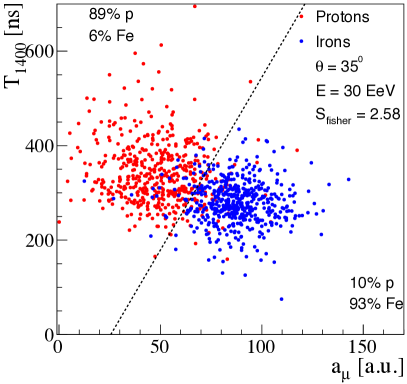
The muon size can be combined with Xmax or with other age sensitive parameters to produce a two or multi-dimensional plot as discussed in the introduction, improving the mass composition separation capabilities. An Xmax sensitive parameter can also be retrieved following the universality principle of EAS description, as for example using the approach proposed in [12, 20]. An example of the separation power for a 50% proton 50% iron mixed composition at 30 EeV is given in figure 7 (right). The muon signal reconstructed with the LSD is plotted against the signal start time at 1400 m (T1400) which measures the delay of the shower particles with respect to the arrival time of a imaginary planar front. This parameter is sensitive to the shower front curvature and correlates to Xmax . In this particular example we have used a timing resolution of 8 ns which can be easily achieved with modern GPS receivers. This correspond to an Xmax resolution of 40 to 60 g/cm2 depending on zenith angle. The Fisher separation coefficient for this particular case is larger than 2 indicating that excellent separation power. It is worthwhile noting that this merit factor is obtained for a fixed energy in the simulation. In a realistic scenario both, the energy and Sμ, need to be estimated from the LSD data. It is to be expected that this will diminish the proton-iron separation, but since we can experimentally estimate the energy by combining the Xmax (or T1400) with the shower size of the electromagnetic component at ground, a merit factor of better than 2 will be possible. The parameter T1400 is given as example and it is not meant to be considered as the optimal variable for the analysis. A detailed study of Xmax (or age) sensitive parameters and of the mass separation is in progress and is however out of the scope of this paper.
4 Calibration strategy
An important aspect of surface array detectors for UHECR studies is to have a calibration strategy that allows to monitor the conversion of the electronic signals into an equivalent energy deposit (or particle count).
4.1 Muon peak
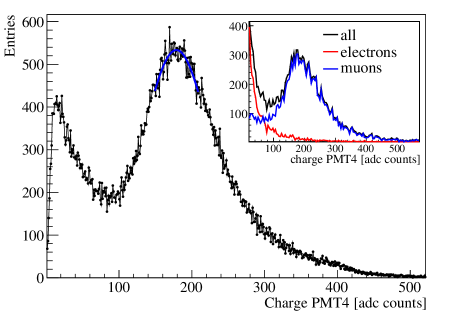
In the Auger surface array, the calibration of the WCD is based on the energy deposited by a vertical muon traversing the WCD volume at its centre [21, 22]. The energy deposited by such muons is about 240 MeV and is called a VEM (Vertical Equivalent Muon). The constant flux of atmospheric muons (about 3000 go through the Auger WCD each second) provides such a calibration. Indeed, the distribution of the charge collected at the dynode of any of the 3 PMT of the Auger WCD shows a hump (see figure 9) whose maximum corresponds nearly to one VEM of energy deposited in the tank. The exact correspondence between the VEM and the most probable charge collection has been measured in Auger using a scintillator telescope, and it is constant in time with only a few percent variation over several years. Such a procedure gives the absolute calibration of individual PMTs.
For the absolute PMT calibration in the LSD a technique based on the VEM value, similar to the one currently used in Auger, can be adopted. An example for the bottom segment charge histogram of our prototype (see next section for a detailed description) is shown in figure 9. From the ADC counts corresponding to the maximum of the VEM charge histogram, one can find the correspondence between ADC counts and the amount of energy deposited in the water volume.
4.2 Muon decay
An alternative calibration can be obtained using the muon decays that occur in the water volume. Nearly 4% of the muons entering the WCD stop and decay and the Michel electrons deposit on average an amount of energy that can also be used for calibration purposes.
For the LSD it is also convenient to determine the water volumes geometry, i.e. the precise height of the water separation interface () as the matrix coefficients and depend on it. The muon decay rate in the top and bottom segments is determined by the geometry of the station and hence allows for a precise determination of the segment position .
In figure 8 we show a simulation based on 50,000 muon decays (this can be obtained in about 15 minutes assuming a decay selection efficiency of 50%) for three different positions of the interface. A 5 cm difference corresponds to nearly 10 standard deviations.
A precision of a few millimeters can thus be achieved.
4.3 Hybrids and physics data
A cross calibration of the matrix coefficient within an array of LSD is also possible based on physics results. Average (top and bottom) LDFs from a set of events can be constructed (an example is given in figure 10) for each individual LSD. From these average LDFs and using the matrix one can reconstruct independently for each LSD average muonic and EM LDFs. Since these average LDFs should be identical for all LSDs this is a means to cross calibrate all matrices.
Finally in a hybrid observatory such as Auger [13] or the Telescope Array [23], the EM LDFs from the LSD can be calibrated using the fluorescence telescope data that give the cosmic ray energy by means of a calorimetric measurement of the EM energy deposit in the atmosphere [24, 25]. This calibration scheme in the Auger Observatory uses the total signal in the WCDs. In the LSD it will benefit from the EM signal reconstruction as the uncertainty on the muon number in individual showers will no longer deteriorate the energy resolutions of the surface array.
4.4 Propagation of uncertainties and systematics
When reconstructing the LDF from individual signals () measured in standard WCDs the uncertainty of each measurements is of the order of with expressed in VEM units. This is due to the Poisson fluctuation of the number of muons entering the tank and to the fluctuation of the EM component in its high energy tail which also introduce VEM size Poisson fluctuations. The additional uncertainty associated with the signal measurement in the tank itself is due to the photo-electron (p.e.) statistics. As long as we have number of p.e. per VEM much larger than one, this contribution to the error budget is negligible.
Above 10 EeV, the signal at 1000 m is at least several tens of VEMs and the particle fluctuations due to the detector sampling become negligible compared to the shower to shower fluctuations. ndeed above 10 EeV the energy resolution obtained from the LDF size at 1000 m from the Auger WCD is 12% [26] while one would naively expect around 5 to 6% if the particle count was alone responsible for this uncertainty.
In an LSD tank the situation is similar even though the reconstructed muon and EM signals are linear combinations of the top and bottom signals with rather large coefficients. For a matrix with coefficients and we have :
| (4) |
However the particle fluctuations in the top and bottom segment are correlated while the p.e. count fluctuations are not. In the particular case of the LSD geometry considered in this article, the contribution of the p.e. count fluctuations in the reconstructed and signals in each tank, although amplified by the large coefficients of equation 4, is still less than 25% of the particle fluctuations themselves. This has little impact on the total error budget, especially at the highest energies where shower to shower fluctuations dominate.
Due to the relatively large coefficients entering in the reconstruction of and one must also consider the effect of a possible systematic in the absolute calibration of the top and bottom segments of the LSD. As an illustration, assume that the calibration procedure induces a systematic bias of +1% on the top segment with respect to the bottom one over the whole array. In such case the EM signal from equation 4 will be on average 3% too large and the muon signal 2% too small. Still, the LSD system can separate heavy from light primaries according to the muonic content of the EAS as all primaries will suffer the same systematic shift in the energy vs muon size plane. The comparison with models becomes more difficult since the electromagnetic size, hence the energy, will be overestimated while the muon size will be underestimated. Given the calibration strategy depicted above a maximum of 1% systematic between the top and bottom calibration is within reach but requires attention.
5 Prototype test
A LSD prototype was constructed at the Auger site in Malargüe inserting a separation, made from a Tyvek laminate, in one of the Auger liners. This prototype uses the 4 PMT configuration displayed in figure 3 with 3 PMTs looking into the top volume and 1 PMT looking in the bottom one. This LSD, named “Guapa Guerrera”, was installed in the field during the last week of February 2014 and has been smoothly taking data since then. We report here on the first two weeks of data collected by this prototype.
5.1 Calibration
The histogram of charge of random signals for the PMT observing the bottom volume, as recorded by the local acquisition system [21], is illustrated in Figure 9, left. From this figure one clearly distinguishes the peak which corresponds to the charge deposited by single muons that is roughly one VEM (the exact correspondence will be measured with a muon telescope) and can be used for calibration.
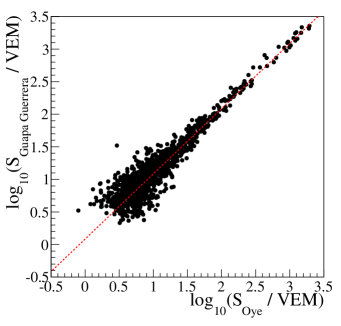
In the same figure, right, we have compared the total signal recorded in the LSD (by summing after a preliminary calibration of top and bottom signals) to the signal recorded in the same events by a standard Auger WCD located 10 m away. We found, as expected, a linear correlation between the two signals over nearly three orders of magnitude. This shows that the LSD can also be used and can perform like a standard WCD.
5.2 Muonic and electromagnetic LDF reconstructions
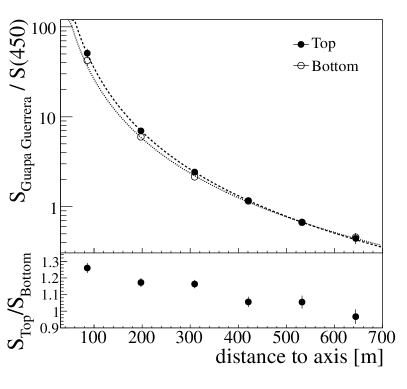
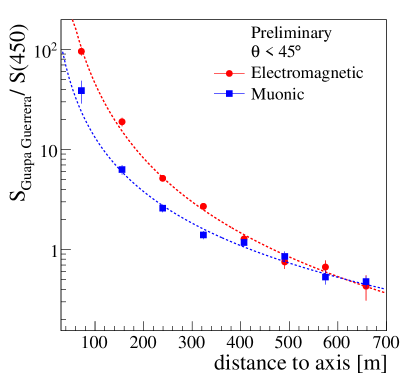
The LSD prototype is located in the infill part of the Auger surface array, a region with a WCD density 4 times higher than in the regular array [27]. It participates in about 100 physics events per day. In the first two weeks of operation we recorded about 1400 events out of which we selected 710 events with a reconstructed energy above 0.03 EeV and a zenith angle less than 45∘. We have also requested that the energy deposit in the top part of the detector is larger than 400 MeV. The zenith angle cut ensures that, even for those relatively low energy showers that develop higher in the atmosphere, the EM component is not completely absorbed before reaching ground. After normalizing the individual LDF of each events at 450 m it is possible to plot, as a function of distance to cores, the signal recorded by the Guapa Guerrera prototype in all of those events. This “average LDF” is shown on the left panel of figure 10 for the top and bottom segments separately. On can see from this plot (and the accompanying lower panel showing the evolution of the top to bottom signals ratio) that the top average LDF is steeper than the bottom one. This is expected since the top segment has a larger contribution from the EM component which has a steeper LDF than the muonic one. On the right panel of figure 10 we show the reconstructed average EM and muonic LDFs obtained from equation 4 applied to the top and bottom average LDFs. This result is preliminary as we used the nominal values of the matrix coefficients ( and , not determined for the exact geometry of Guapa Guerrera) and preliminary calibration constants. Nevertheless the quality of this result obtained after just two weeks of data taking is very promising. In addition, and as stated previously, the reconstruction of average muonic and EM LDFs using different LSD stations will allow us to cross calibrate the individual matrices based on the requirement that all LSDs are looking at the same physics.
6 Conclusions
We have presented the LSD (Layered Surface Detector) as a new concept of water Cherenkov tank that allows us to reconstruct mass sensitive parameters for UHECR with optimal resolution. The muon size of EAS can be reconstructed with a precision better than 20% above 10 EeV, reaching 10% for energies above 70 EeV. The separation of muonic and electromagnetic lateral distributions on an event by event basis further provides an estimation of the Xmax parameter with 50 g/cm2 resolution from timing alone. It could be reduced to 30 g/cm2 by including the time shape information.
A prototype of the LSD, constructed from a modification of one of Auger surface array WCD, has shown excellent performances in agreement with expectations from Monte-Carlo simulations.
We argue that such detectors should be seriously considered for any upgrade of existing UHECR observatories or for the construction of new observatories, either with larger aperture than the current one or dedicated to the study of the second knee to ankle region, that is in the energy range from 0.1 EeV to 10 EeV.
7 Acknowledgments
We gratefully acknowledge the very fruitful exchanges we had with all of our colleagues in the Auger collaboration and the use of all Auger facilities from hardware to software including access to a subset of shower data. We are also deeply indebted to the commitment of the observatory staff whose strong support in constructing and deploying the LSD prototype was extremely appreciated. The work of M.S. and I.C.M. made in the ILP LABEX (ANR-10-LABX-63), is supported by French state funds managed by the ANR within the Investissements d’Avenir programme (ANR-11-IDEX-0004-02). I.C.M. also acknowledges the financial support by the European Community 7th Framework Program, through the Marie Curie Grant FP7-PEOPLE-2012-IEF, no. 328826.
References
References
- [1] K. Greisen, End to the cosmic ray spectrum?, Phys. Rev. Lett. 16 (1966) 748.
- [2] G. Zatsepin, V. Kuzmin, Upper limit of the spectrum of cosmic rays, JETP Lett. 4 (1966) 78.
- [3] R. U. Abbasi, et al., Indications of Proton-Dominated Cosmic Ray Composition above 1.6 EeV, Phys. Rev. Lett. 104 (2010) 161101, arXiv:0910.4184.
- [4] J. Abraham, et al., Measurement of the Depth of Maximum of Extensive Air Showers above eV, Phys. Rev. Lett. 104 (2010) 091101, arXiv:1002.0699.
- [5] E. Barcikowski, et al., Mass Composition Working Group Report at UHECR-2012, EPJ Web Conf. 53 (2013) 01006, arXiv:1306.4430.
- [6] T. Abu-Zayyad, et al., Pierre Auger Observatory and Telescope Array: Joint Contributions to the 33rd International Cosmic Ray Conference (ICRC 2013), Proc. of 33rd Int. Cosmic Ray Conf., Rio de Janeiro, Brazil, arXiv:1310.0647.
- [7] L. Dedenko, G. Fedorova, T. Roganova, A. Glushkov, S. Knurenko, et al., The composition of the primary particles at energies eV observed at the Yakutsk array, J. Phys. G39 (2012) 095202.
- [8] J. Abraham, et al., The Fluorescence Detector of the Pierre Auger Observatory, Nucl. Instrum. Meth. A620 (2010) 227, arXiv:0907.4282.
- [9] P. Abreu, et al., The exposure of the hybrid detector of the Pierre Auger Observatory, Astropart. Phys. 34 (2011) 368, arXiv:1010.6162.
- [10] H. Tokuno, Y. Tameda, M. Takeda, K. Kadota, D. Ikeda, et al., New air fluorescence detectors employed in the Telescope Array experiment, Nucl. Instrum. Meth. A676 (2012) 54, arXiv:1201.0002.
- [11] P. Lipari, Universality of cosmic ray shower development, Nucl. Phys. Proc. Suppl. 196 (2009) 309.
- [12] M. Ave, R. Engel, J. Gonzalez, D. Heck, T. Pierog, M. Roth, Extensive air shower universality of ground particle distributions, Proc. 32nd ICRC, Beijing, 2011, vol 2, 178.
- [13] J. Abraham, et al., Properties and performance of the prototype instrument for the Pierre Auger Observatory, Nucl. Instrum. Meth. A523 (2004) 50.
- [14] I. Allekotte, et al., The surface detector system of the pierre auger observatory, Nucl. Instrum. Meth. A586 (2008) 409, arXiv:0712.2832.
- [15] D. Heck, J. Knapp, J. Capdevielle, G. Schatz, T. Thouw, Corsika: a monte carlo code to simulate extensive air showers, Wissenschaftliche Berichte, Forschungszentrum Karlsruhe FZKA 6019.
- [16] K. Werner, I. Karpenko, T. Pierog, Ridge in proton-proton scattering at 7 TeV, Phys. Rev. Lett. 106 (2011) 122004.
- [17] S. Ostapchenko, Monte Carlo treatment of hadronic interactions in enhanced Pomeron scheme: I. QGSJET-II model, Phys. Rev. D83 (2011) 014018, arXiv:1010.1869.
- [18] A. Ferrari, P. R. Sala, A. Fasso, J. Ranft, FLUKA: A multi-particle transport code (Program version 2005), CERN-2005-10 (2005), INFNTC11, SLAC-R-773CERN-2005-010.
- [19] D. Newton, J. Knapp, A. Watson, The optimum distance at which to determine the size of a giant air shower, Astropart. Phys. 26 (2007) 414 arXiv:astro-ph/0608118.
- [20] D. Maurel, M. Ave, M. Roth, J. Gonzalez, Universality of the time structure of ground particle distributions and its application to the reconstruction of extensive air showers, Proc. of 33rd Int. Cosmic Ray Conf., Rio de Janeiro, Brazil, icrc2013-0600.pdf.
- [21] X. Bertou, et al., Calibration of the surface array of the Pierre Auger Observatory, Nucl. Instrum. Meth. A568 (2006) 839.
- [22] P. L. Ghia, et al., Testing the surface detector simulation for the Pierre Auger Observatory, Proc of 30th Int. Cosmic Ray Conf., Merida, Yucatan, Mexico, Vol. 4, 315, arXiv:0706.1212.
- [23] H. Kawai, et al., Telescope array experiment, Nucl. Phys. Proc. Suppl. 175-176 (2008) 221.
- [24] V. Verzi, et al., The Pierre Auger Observatory: Contributions to the 33rd International Cosmic Ray Conference (ICRC 2013), Proc of 33rd Int. Cosmic Ray Conf., Rio de Janeiro, Brazil, in press, arXiv:1307.5059.
- [25] T. Abu-Zayyad, R. Aida, M. Allen, R. Anderson, R. Azuma, et al., The Cosmic Ray Energy Spectrum Observed with the Surface Detector of the Telescope Array Experiment, Astrophys. J. 768 (2013) L1, arXiv:1205.5067.
- [26] R. Pesce, et al., The Pierre Auger Observatory I: The Cosmic Ray Energy Spectrum and Related Measurements, Proc. of 32nd Int. Cosmic Ray Conf., Beijing, China, Vol. 2, 214, arXiv:1107.4809.
- [27] D. Ravignani, et al., The Pierre Auger Observatory: Contributions to the 33rd International Cosmic Ray Conference (ICRC 2013), Proc. of 33rd Int. Cosmic Ray Conf., Rio de Janeiro, Brazil, in press, arXiv:1307.5059.