Solar Wind Electron Strahls Associated with a High-Latitude CME: Ulysses Observations
Abstract
Counterstreaming beams of electrons are ubiquitous in coronal mass ejections (CMEs) - although their existence is not unanimously accepted as a necessary and/or sufficient signature of these events. We continue the investigations of a high-latitude CME registered by the Ulysses spacecraft on January 18 – 19, 2002 (Dumitrache, Popescu, and Oncica, Solar Phys. 272, 137, 2011), by surveying the solar wind electron distributions associated with this event. The temporal-evolution of the pitch-angle distributions reveal populations of electrons distinguishable through their anisotropy, with clear signatures of i) electron strahls, ii) counter-streaming in the magnetic clouds and their precursors, and iii) unidirectional in the fast wind preceding the CME. The analysis of the counter-streams inside the CME allows us to elucidate the complexity of the magnetic-cloud structures embeded in the CME and to refine the borders of the event. Identifying such strahls in CMEs, which preserve properties of the low coronal plasma, gives more support to the hypothesis that these populations are remnants of the hot coronal electrons that escape from the electrostatic potential of the Sun into the heliosphere.
keywords:
Solar wind Interplanetary coronal mass ejections Electron velocity distributions Strahl1 Introduction
in
Ulysses was launched in October 1990 to explore the heliosphere from the solar Equator to the Poles. The observations obtained enable a characterization of the particle populations constituting the interplanetary plasma both out of the Ecliptic plane as well as over a range of heliocentric distances exceeding 1 astronomical unit (AU). Opportunities have also been opened to characterize the magnetic field structure and topology, and extract more insights from their correlations with the velocity distributions of charge particles injected by the Sun in the heliosphere.
1.1 Electron Strahls in the Solar Wind
The electron-beaming strahl is well known up to 1 AU as a sharply magnetic-field-aligned energetic population of electrons usually moving anti-Sunward [Rosenbauer et al. (1977), Pilipp et al. (1987a)], carrying with it a significant amount of heat flux in the solar wind. Measurements by the Helios spacecraft revealed a high variability of the energetic electron distributions with solar-wind properties and different heliospheric distances from 0.3 AU up to 1 AU in the Ecliptic (Pilipp et al. 1987a; 1987b; 1987c; Anderson et al. 2012). More specifically, in the fast-wind the electron velocity distributions can be highly anisotropic and skewed with respect to the magnetic-field direction, showing a narrow strahl directed along the magnetic field away from the Sun and occasionally exhibiting a second, less intense strahl directed toward the Sun.
The variation of the electron strahl with heliocentric distance and heliographic latitude has also been studied using observations provided by Ulysses, Wind, and the Advanced Composition Explorer (ACE) Hammond et al. (1996); Maksimovic et al. (2005); Anderson et al. (2012). Recently, indications for the existence of a suprathermal solar-wind strahl at 10 AU have been presented Walsh et al. (2013). The strahl becomes less focused to the magnetic-field direction at larger heliocentric distances Pilipp et al. (1987b); Hammond et al. (1996), and the angular width is broader than it would be under adiabatic expansion from the corona Lemons and Feldman (1983). Moreover, the halo density is observed to increase at the expense of the strahl density that declines with increasing heliocentric distance, suggesting that the halo is formed as a result of pitch-angle scattering of the strahl Maksimovic et al. (2005). Since Coulomb collisions, which are not efficient at large heliocentric distances, can be excluded fluctuations in the electric and magnetic fields driven locally by the plasma anisotropies as well as the strahls themselves are considered responsible for scattering the particles Vocks et al. (2005); Pagel et al. (2007); Pierrard, Lazar, and Schlickeiser (2011).
1.2 Electron Counter-streaming Strahls During CME Events
Coronal mass ejections (CMEs) are huge clouds of magnetized plasma originating from the Sun and propagating with velocities ranging from several hundreds to several thousands of kilometers per second. Although each event is unique, CMEs are commonly identified in the solar-wind plasma by a set of characteristic features, such as an intense magnetic-field [] with a topology exhibiting a smooth rotation and lower levels of fluctuations, low proton and electron temperatures [] (implying low plasma parameters, i.e., , where denote the number density), as well as an enhanced abundance of helium or heavy ions Richardson and Cane (2010).
In addition, bi-directional electron beams are frequently observed during CMEs Skoug et al. (2000a); Nieves-Chinchilla and Viñas (2008); Anderson et al. (2012) and are interpreted as a signature of closed magnetic-field lines with both foot points connected to the solar corona Gosling et al. (1987). These are energetic electrons flowing in both directions, parallel (0o pitch-angle) and antiparallel (180o pitch-angle) to the magnetic field. Although in the CMEs the electron velocity distribution can show intense counter-streaming strahls that characterize their internal flux-rope-like magnetic topology, occasionally, counter-streams do not appear to be associated with CMEs or may extend beyond the conventional CME intervals Richardson and Cane (2010). Counter-streaming electrons are also attributed to interplanetary shocks, including the Earth’s bow shock and corotating interaction regions (CIRs) Feldman et al. (1982); Gosling et al. (1993), as well as depletions of halo particles around 90o pitch-angle Gosling et al. (2002); Skoug et al. (2006).
From the early spaceborne missions, the observations of unidirectional or counterstreaming strahls of electrons were only available for relatively limited intervals in time and space, but modern instruments provide better observations of these populations. Recently, a list of counterstreaming events has been established, but only for CMEs detected up to 1 AU in the Ecliptic Anderson et al. (2012). During a nine-month period in 1998, the ACE spacecraft ( 1 AU) detected 32 counter-streaming electron events (an average of 3.65 per month) with durations ranging from 5 to 146 hours (a median length of 45 hours), and with a 60 – 100 presence during CMEs Skoug et al. (2000a). This rate is comparable to that measured previously by the third International Sun-Earth Explorer (ISEE-3) at times when the spacecraft was not magnetically connected to the Earth’s bow shock Gosling et al. (1987). However, despite the vast number of studies analyzing CMEs identified in the Ecliptic, only few contain analyses of the electron counter-streaming variability (Skoug et al., 2000a; 2000b; Nieves-Chinchilla and Viñas, 2008; Anderson et al., 2012). On the other hand, the observations of high-latitude CMEs are in general limited to outlining their bulk properties (Ebert et al., 2009; Dumitrache, Popescu, and Oncica, 2011), but evidence of their extension at high latitudes in the heliosphere includes indications of counterstreaming electrons Reisenfeld et al. (2003).
Magnetic clouds (MCs) are observed in a subset () of CMEs and partially retain their characteristics as they propagate (see Steed et al., 2011 and references therein), but counter-streaming electrons are not necessarily present in the cloud portion of the CME Skoug et al. (2000b). Thus, according to a survey (from March 1998) of the same magnetic cloud at different radial distances in the solar wind, counter-streaming electrons were detected by ACE only in the noncloud portion of the surrounding CME, and counter-streams observed by Ulysses at 5 AU were present in the cloud but only between the forward and reverse shocks. This suggests that rather than being a signature of the CME, the counterstreaming populations are shock-related, being obvious in corotating shocks and forward-reverse shock pairs driven by the over-expansion of CMEs that have a high internal pressure Gosling et al. (1994b).
1.3 Goal of This Study
The present work is focused on a systematic analysis of the electron velocity distributions measured by the Solar Wind Observations Over the Poles of the Sun (SWOOPS) Electron instrument onboard Ulysses during a high-latitude CME observed on January 18 – 19, 2002, when the Ulysses spacecraft was situated at 2.7 AU distance from the Sun and at 62o North heliographic latitude relative to the Ecliptic. This CME is included in the Ulysses CME list (swoops.lanl.gov/cme˙list.html), and recently this event was tracked back to its solar origin by \inlinecitedu11, hereafter called Article I. Article I examined the correlation between the magnetic field, velocity, temperature, and density, to enable the identification of the CME and its components such as the forward shock, magnetic clouds, and the reverse shock. Here, we analyze the electron velocity distributions and their temporal evolution, giving particular attention to suprathermal populations that show enhanced field-aligned fluxes of electrons. Our main purpose is to identify the intervals of bi-directional (counter-streaming) or uni-directional electrons, and correlate them with the CME profiles found in Article I. Moreover, the analysis is extended to the ambient solar wind before and after the CME event, allowing us to outline the features of the counter-streaming strahls that are specific to the CMEs.
Because CMEs reproduce and preserve coronal-plasma states, the enhanced strahls present in CMEs support the hypothesis that these populations are remnants of the hot coronal electrons, which escape from the electrostatic potential of the Sun into space without suffering collisions and conserving their magnetic moments Maksimovic et al. (2005). Therefore, a study of their properties can give hints of the prevailing conditions in the solar corona.
2 Data Selection and Analysis
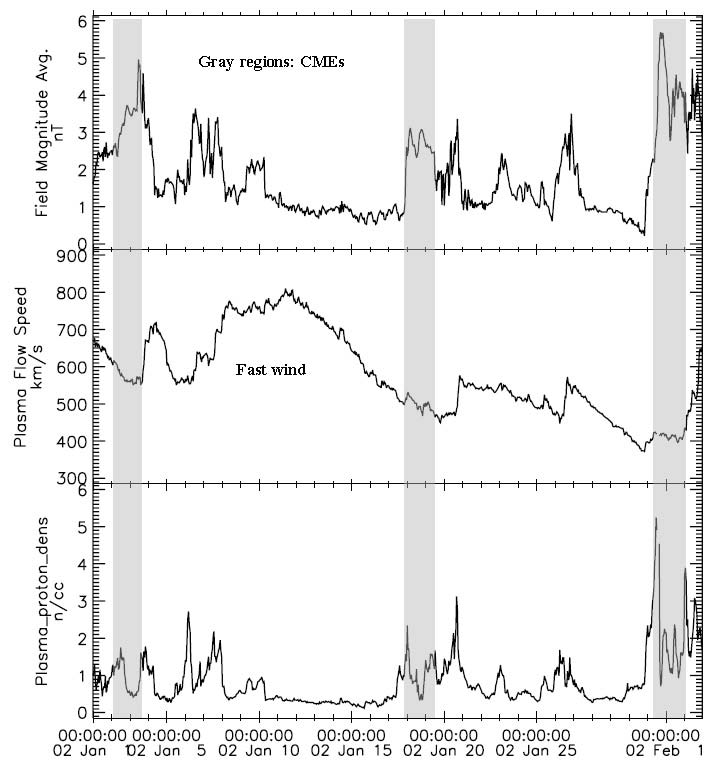
In order to set the context of the CME event examined in this article, Figure \ireff1 presents the temporal evolution of the magnetic-field magnitude, plasma flow speed, and proton number density measured by Ulysses during the first 33 days of 2012. The shaded regions indicate three CMEs in this interval Ebert et al. (2009), with our event identified (middlemost) at the day-of-year (DOY) 18-19, and preceded by a long-lasting fast-wind interval. Here the analysis is focused on a period of 12 days, between DOY 10 and DOY 23, which includes the CME and intervals of ambient solar wind before and after the ejecta.
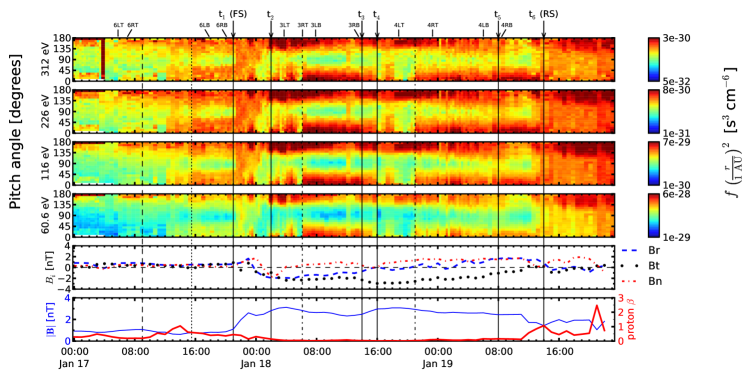
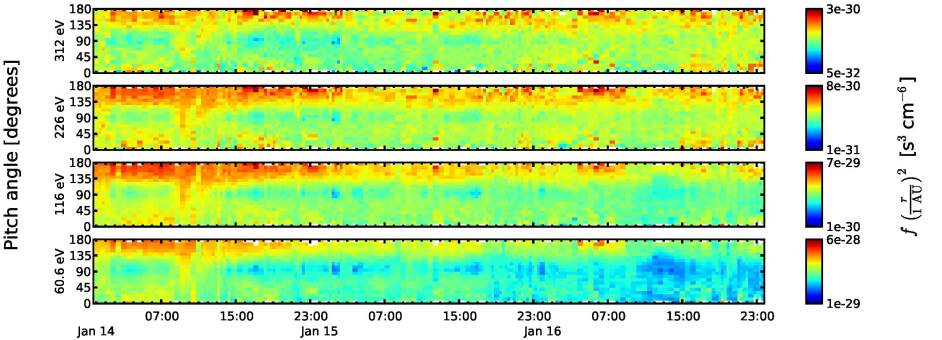
The present study is based on the Ulysses/SWOOPS electron pitch-angle data published by the ESA-RSSD Web service Skoug (2012). These data are in the solar-wind frame, and have been corrected for the spacecraft potential Skoug (2012); Scime, Phillips, and Bame (1994). Temporal evolutions of the electron pitch-angle distributions (PADs), as in Figure \ireff2, are used to depict the intervals with uni- or bi-directional strahls. The phase-space distributions are individually shown for each energy channel (Table \ireftab1), and are normalized to 1 AU distance by multiplying the data by the square of heliocentric distance measured in units of AU. This normalization enables a consistent color scale to be used for plots from all spacecraft positions. The strahls appear as peaks of intense fluxes (densities) at 0o or/and 180o pitch-angle, and are more prominent at energies above the break between the core (Maxwellian fit) and high-energy tails. Thermal populations are, therefore, those with kinetic energy below the break point, while suprathermal energies are always above the break point. In the solar wind in the absence of CMEs and other disturbances, the break point is around 70 eV at 1 AU, and drops with increasing radial distance from the Sun, with a typical value of 30 eV near 5 AU.
Additional analysis of the magnetic field components, magnitude, and the proton plasma (bottom panels in Figure \ireff2) enable us to correlate magnetic-field topology with the presence of strahls, and provide their orientation. It is worthwhile noting that beaming particles at 0o pitch-angles are traveling parallel to the magnetic field and in the same direction [], which in general can be either toward [] or away [] from the Sun. When Ulysses flew over the North Pole of the Sun in January 2002, the heliospheric magnetic field was registered mostly pointing towards the Sun Jones, Balogh, and Smith (2003). In such a case, a uni-directional strahl peaked at 180o pitch-angle indicates an anti-parallel flow directed away from the Sun. Here we call parallel the strahls centered at 0o pitch-angle, and anti-parallel the strahls occurring at 180o pitch-angle.
| [eV] | 1.69 | 2.35 | 3.25 | 4.51 | 6.26 | 8.65 | 12.1 | 16.8 | 23.2 | 31.9 |
| km s-1] | 0.77 | 0.90 | 1.06 | 1.25 | 1.48 | 1.74 | 2.05 | 2.42 | 2.84 | 3.33 |
| 43.9 | 60.6 | 84.0 | 116 | 163 | 226 | 312 | 429 | 591 | 815 | |
| 3.91 | 4.59 | 5.41 | 6.35 | 7.53 | 8.87 | 10.42 | 12.22 | 14.34 | 16.84 |
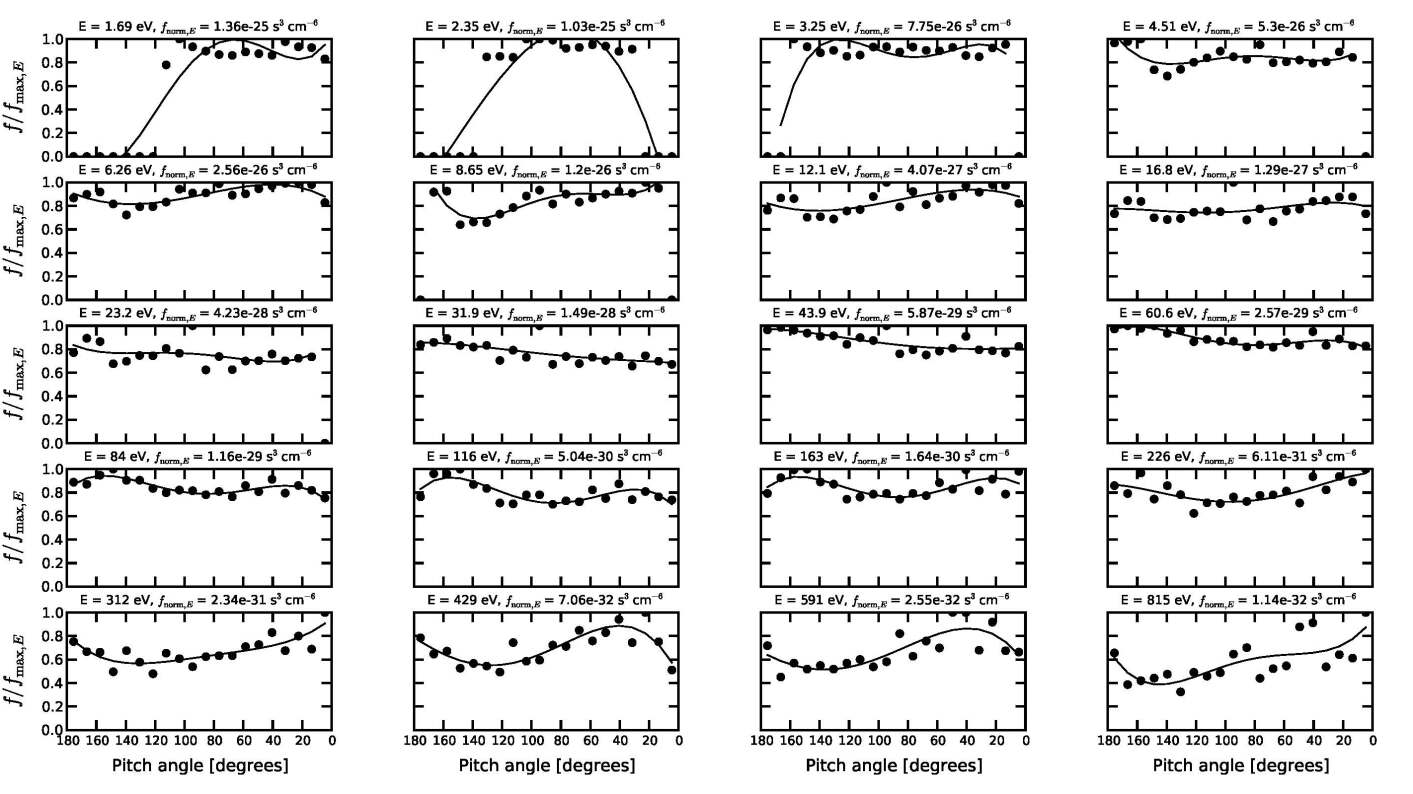
A single (uni-directional) peak of the PADs is a clear signature of a strahl, but two opposite peaks, in directions parallel and anti-parallel to the magnetic field, can either be an indication of counter-streams, or can result from a thermal anisotropy of the distribution, i.e. an excess of parallel temperature , where and denote directions parallel and perpendicular to the magnetic field, respectively. We make the distinction starting from the premise that two opposite peaks must show the same, constant symmetry at different energy channels to indicate an anisotropy of the parallel temperature. Otherwise, if these peaks are signatures of strahls, their symmetry is expected to break down at some energy levels, based on the fact that the strahls have different paths and origins, e.g. distinct foot points, or the fast wind. To objectively assess the presence and extent of the strahls, and whether these are uni- or bi-directional, we analyze snapshots of the PAD profiles at any instant of interest and for each energy channel, ranging from eV to eV (see Table \ireftab1).
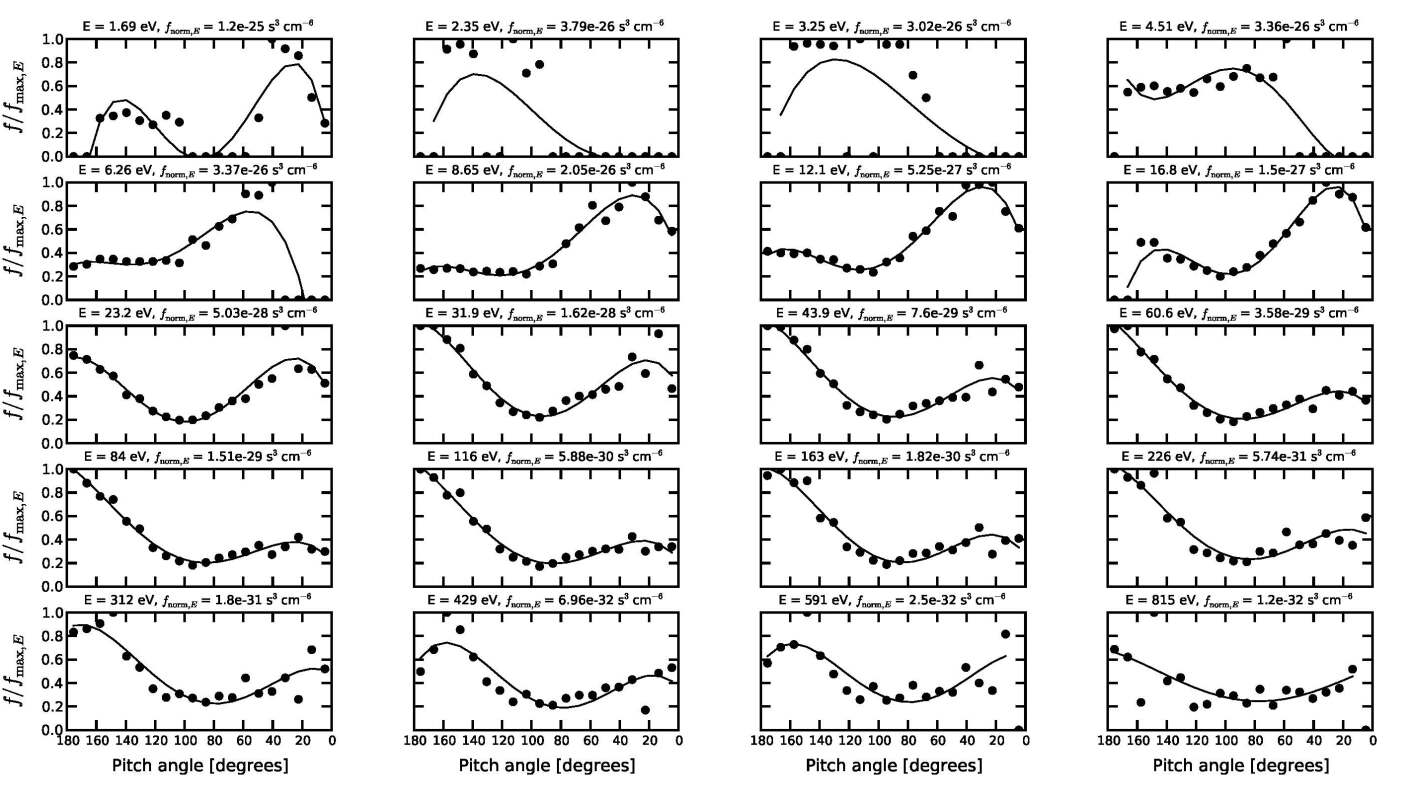
To take a snapshot, we plot the PADs for all energy channels, like the ones shown in Figures \ireffb1, and \ireffb2, or for a single (suprathermal) energy channel, as in Figures \ireff6, and \ireff7 (bottom panels). The strahls are manifested by the asymmetric peaks that occur at 0o or/and 180o pitch-angle. The parallel and antiparallel peaks are compared by visual inspection, and to highlight the peaks and depletions, the data is fitted with a fourth-order polynomial that only serves as a guide for the eye and omits the missing (0 level) data if present. Such a fitting model can be used to quantify the main properties of the field-aligned strahls, i.e. the angular width and intensity Pagel et al. (2007); Anderson et al. (2012). Traditionally, the method involves a Maxwellian, although such a model describes well only the low-energy (core) populations and introduces uncertainties and overestimates for suprathermal populations. The implementation of a new power-law model is presently under our consideration, since power-laws provide a good fit for the high-energy tails of suprathermal distributions, including the strahls Lazar et al. (2012). Such an approach will enable us to quantify their properties, but it is outside the scope of the present study.
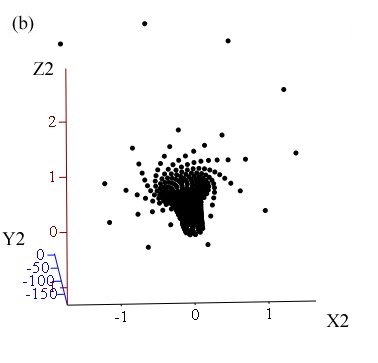
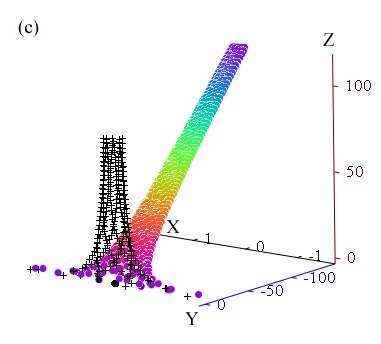
In order to build a complete picture for the full set of energy channels, the pitch-angle data [, ] is transformed into the velocity space (, ), where , with the corresponding values given in Table \ireftab1. This allows us to plot iso-contours of the phase-space density in velocity space (), e.g., Figures \ireff6 and \ireff7 (top panels), and visualize the strahls as a (strong) bulging of the contour lines in either the negative or positive -direction (unidirectional strahls), or in both directions (counter-streams). The positive -axis is directed along -direction of the mean magnetic field, and the coordinate system () is centered on the bulk velocity of the solar wind, which is nearly at the maximum of the distribution function. Note that these velocity distributions are all gyrotropic according to the method of construction from the measured data Skoug (2012).
Our study of the PADs is complemented by an analysis of the electron-plasma moments, such as density and temperature, provided by the SWOOPS team and obtained by a numerical integration of the velocity-weighted electron distributions. To distinguish between the intervals and distributions marked by the presence of strahls, we compare their moments calculated either for the whole distribution, i.e. total density [], and total temperature [], or only for the components of the electron distribution, below and above the core–halo energy break point, i.e. [, ] for the core, and [, ] for the halo.
3 The January 18 – 19, 2002 CME Event
Figure \ireff2 displays the electron pitch-angle distributions (PADs) and their variability with time and energy during the CME event, i.e. for Days 17, 18, and 19 of 2002. Out of the available energy channels, ranging from eV to eV (see Appendix A), we display four suprathermal energies, 60.6 (bottom), 116, 226, and eV (top), which are relevant for the strahl component. The color code runs from blue (low values) to red (high values) and is different for each energy channel. Six solid bars mark the principal structural elements of the CME identified in Article I. A shock front occurs at (DOY 17 21:00:00). The CME event contains two MCs, each corresponding to a well-shaped peak of the magnetic-field strength in Figure 1, top panel. The first MC, denoted MC1, lasts from (DOY 18 01:59:31) to (DOY 18 13:59:31), and the second, denoted MC2, from (DOY 18 16:00:28) until (DOY 19 07:59:31). A reverse shock is identified at (DOY 19 13:59:31). In the next subsections, these boundaries are contrasted with those indicated by the temporal variation of the electron PADs, and by the presence of uni- and bi-directional strahls.
3.1 Inside the CME
According to Figure \ireff2, before the forward shock the magnetic field was observed pointing outward from the Sun [], but this orientation changes sharply in the sheath after the shock. The radial and tangential components change sign [] at DOY 18 00:00:00, and the normal component does the same [] after only one hour. Immediately after the shock the PAD appears less anisotropic, without evidence of peaks. The first indications of an anti-parallel peak occur shortly after the magnetic-field reversal (DOY 18 00:00:00). Figure \ireffb1 presents the PADs for all available energy channels on DOY 18 00:49:25, when an anti-parallel intense peak is already visible at all energy channels between 23.2 and 591 eV. Likewise, a second parallel peak arises less regularly, as an indication that Ulysses is approaching the sector of counter-streaming electrons trapped in the CME magnetic field. The parallel peak is less intense and less regularly observed, probably because of beam-plasma instabilities (reminiscent after the forward shock), which may interrupt the large scale connection of the magnetic field lines with both footpoints to the Sun.
. \ilabelfc1
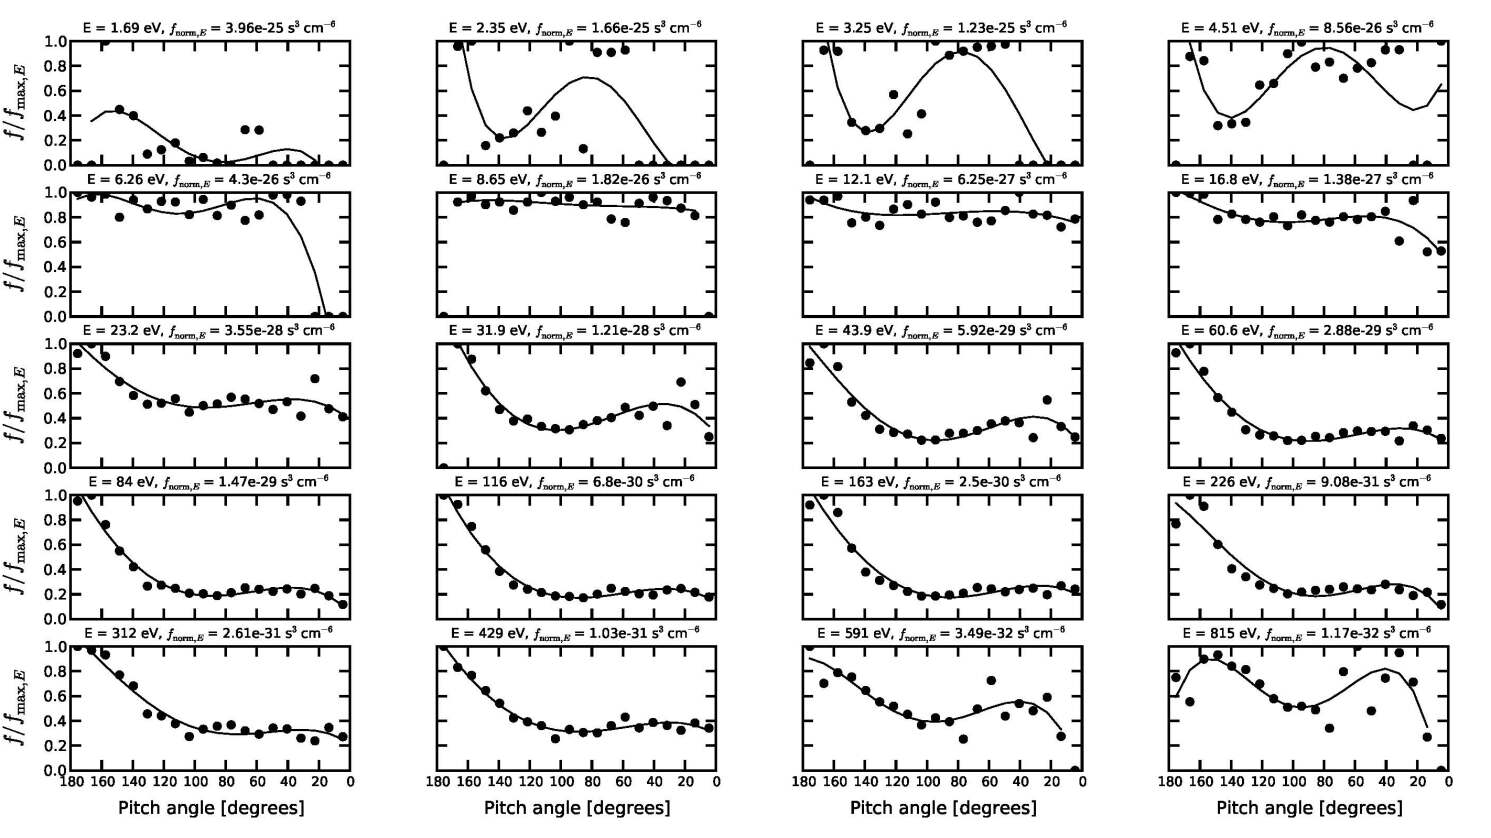
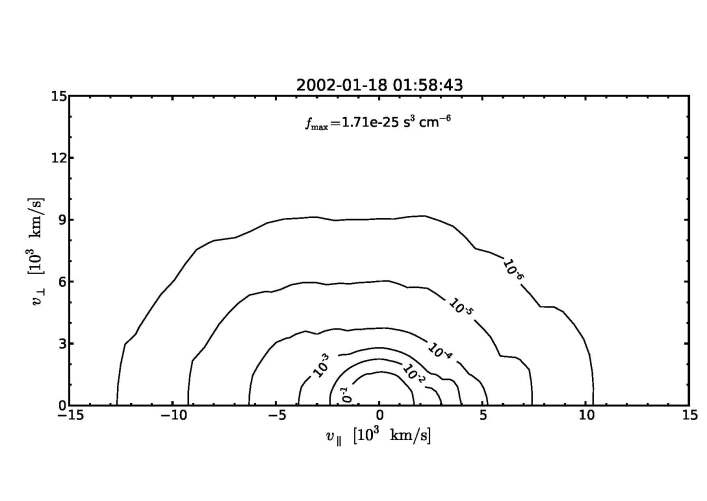
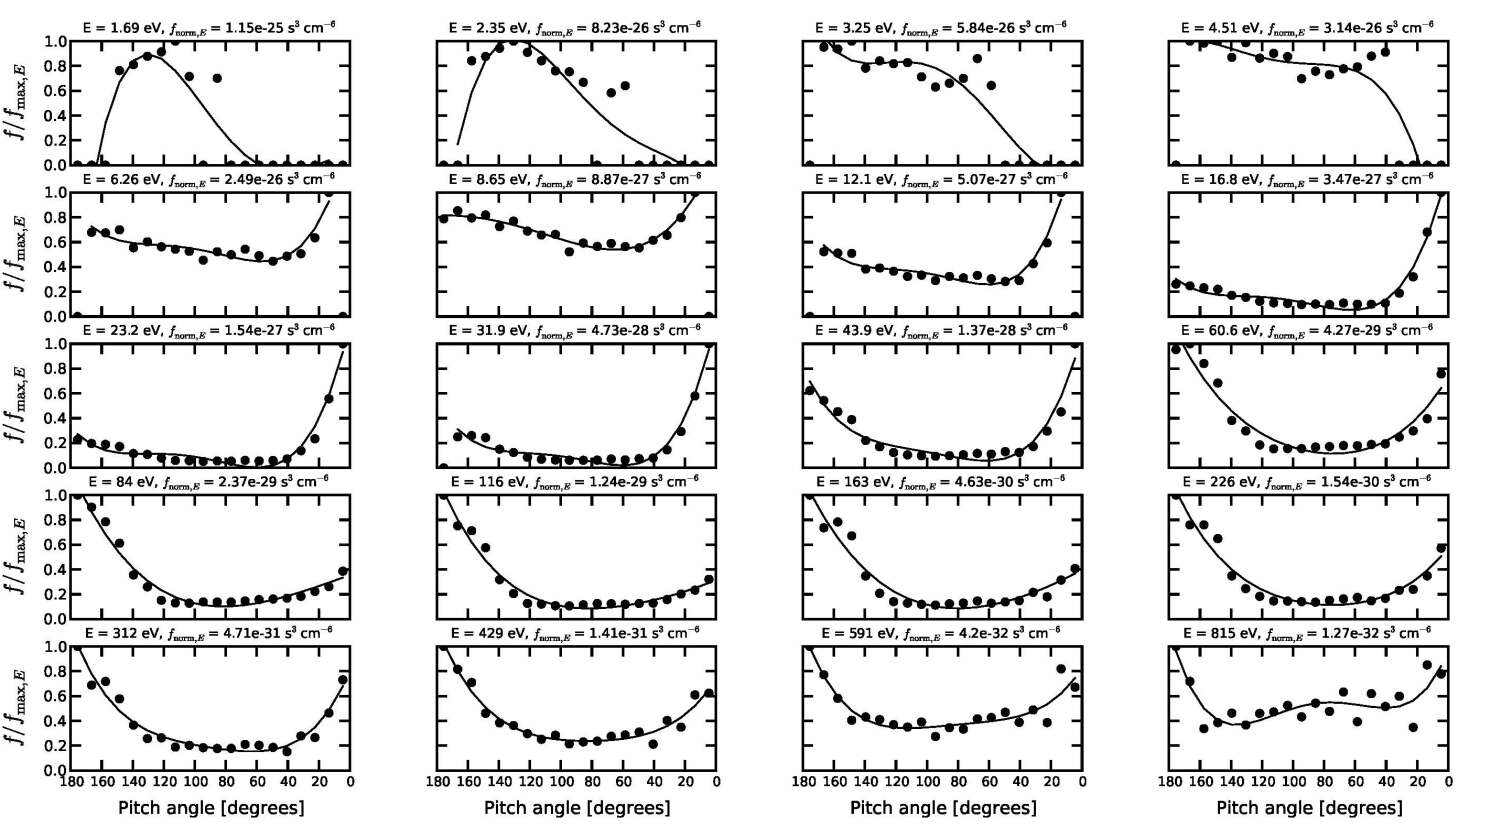
Figure \ireffb2 presents the PADs with the first distinct signatures of both the parallel and anti-parallel peaks on DOY 18 01:58:43. This is nearly the start time of the first magnetic cloud MC1 identified in Article I at DOY 18 01:59:31. It is important to emphasize the differences observed between the parallel and anti-parallel peaks, because these differences, if they exist, support the hypothesis that the two opposite peaks are signatures of two counter-streaming strahls, and not indications of an excess of parallel temperature []. Based on this hypothesis, the presence of strahls is confirmed by a systematic analysis of the PADs for all the energy channels, and all the events from an interval of interest. Such a contrast between the opposite strahls is evident in Figure \ireffb2, where the parallel peak is visible at lower energies, starting at 12.1 eV, while the anti-parallel peak arises at higher energies, 23.2 eV. These two peaks become comparable at 43.9 eV, whereas at higher energies, as the contribution from suprathermal populations increases, the anti-parallel peak becomes more pronounced.
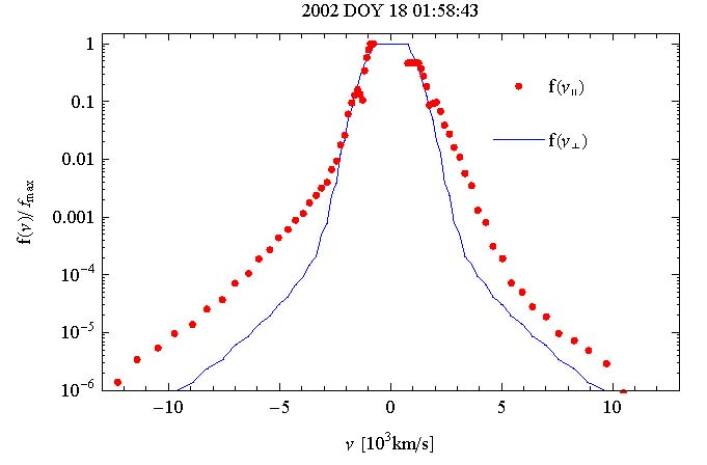
For the same event (DOY 18 01:58:43), two bulging lobes of the isocontour lines are also distinguishable in Figure \ireffc1 (top panel), indicating an anti-parallel strahl more intense (at least one order of magnitude) than the parallel strahl (compare, for instance, higher suprathermal energies). Moreover, the parallel cut in the velocity distribution shown in the bottom panel of Figure \ireffc1 (filled circles) confirms the existence of these two peaks, the parallel one being indeed close to km s-1 eV, but, contrary to the indications in Figure \ireffb2, the anti-parallel peak appears at even lower energies, i.e. km s-1 eV. At this energy, the map of PADs indicates only an incipient tendency of enhancing the electron flux in parallel direction (hidden, eventually, by a (weak) thermalization, i.e. ). This tendency is confirmed by the temporal evolution of the PAD, see, for instance, Figure \ireffb3, which presents a snapshot on DOY 18 02:16:02, when the parallel peak appears at lower energies down to eV. Based on these arguments, we can claim that the parallel and anti-parallel peaks in Figures \ireffb2 (DOY 18 01:58:43 ) mark the first counter-streaming signatures after the forward shock, in MC1. A further inspection of the energy maps reveals even more differences between these counter-streams, namely, different intensities and angular widths, which also induce the idea that parallel and anti-parallel strahls must have different origins.
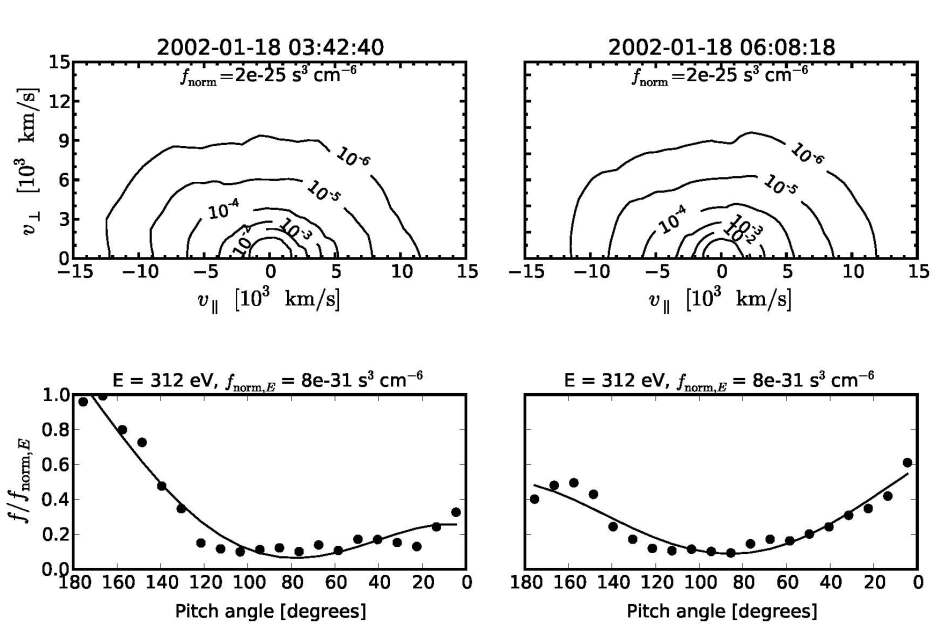
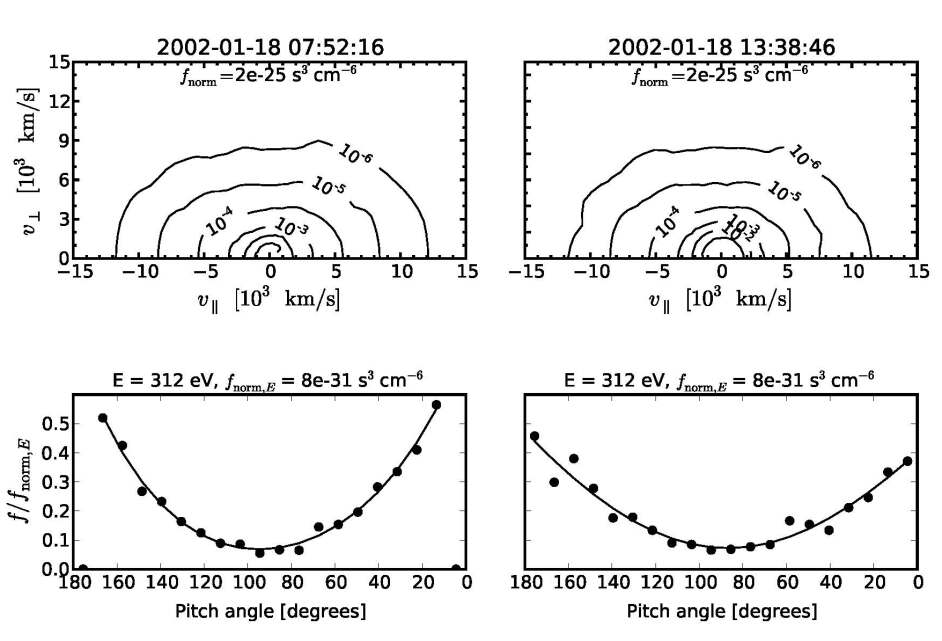
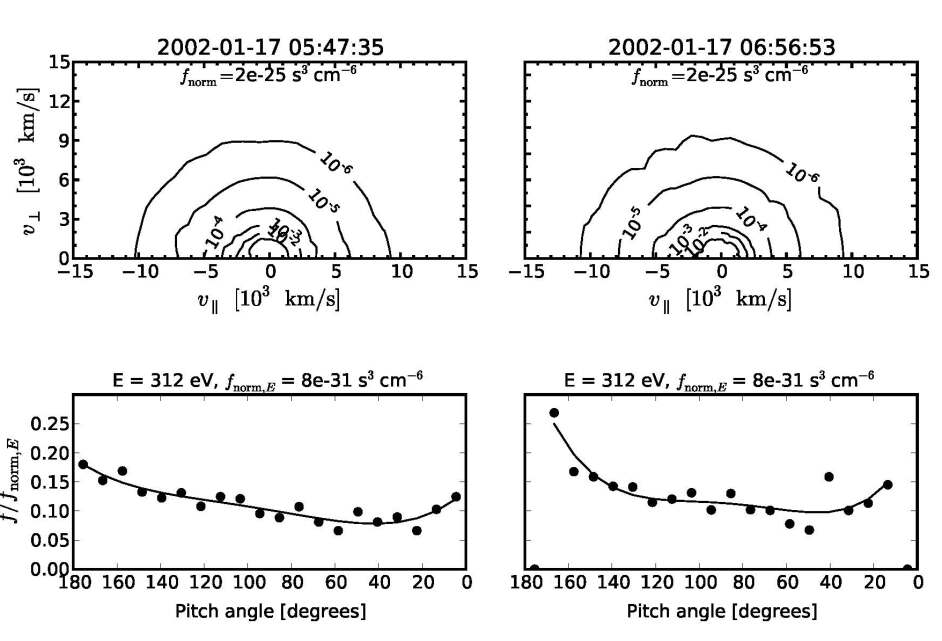
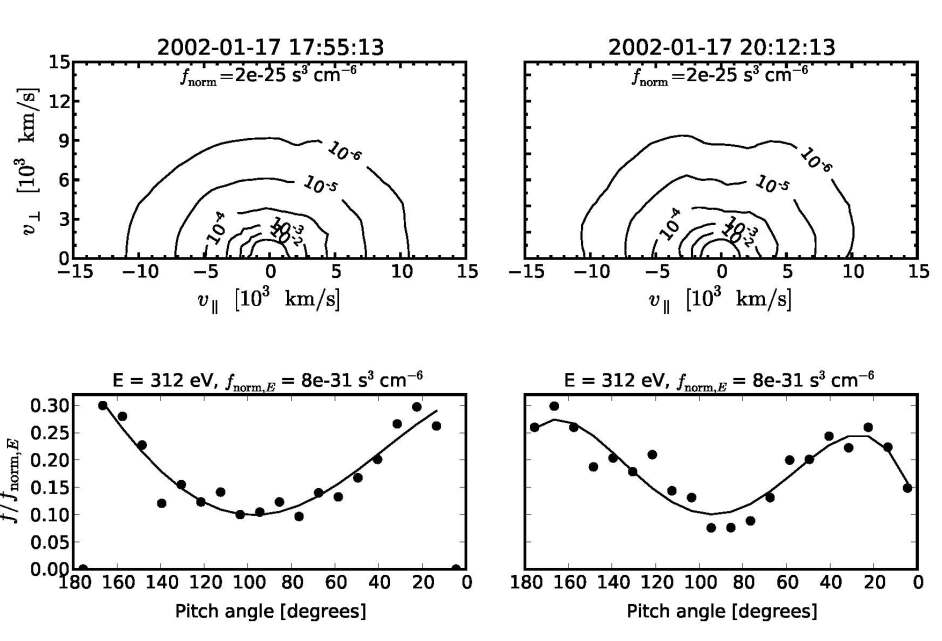
At later times, i.e. DOY 18 06:07:00 (first dash-dotted line in Figure \ireff2), the counter-streaming patterns are continuous, and more skewed and symmetric at all suprathermal energies. Our analysis will therefore be limited to follow their evolution at a single channel of higher energy, e.g. 312 eV, which corresponds to an electron speed of km s-1 (see Table \ireftab1). Four samples relevant for the MC1 interval are displayed in Figure \ireff6 with isocontours of the velocity distributions (top panels) and the corresponding PADs (bottom panels). The contours of the phase space density are logarithmically spaced and correspond to fractions 10-1, 10-2, …, 10-6 of the normalization value (provided in each panel). The strahls appear bending the round shape of the isolines and are confirmed by the peaks in the bottom panels. While the first case in the top–left panels is representative for highly asymmetric counter-streams with a more intense anti-parallel strahl, at the entrance of MC1, in the other three events the counterstreams appear more balanced and symmetric. For instance, the bottom–left panels display intense and symmetric countermoving streams. The intensities of the strahls can easily be compared as we have chosen the same normalization value for the distribution functions, but a quantitative analysis will be presented in a subsequent work. The parallel strahl is enhanced in intensity, apparently at the expense of the first anti-parallel strahl, but a complete reversal of the uni-directional strahl is not observed, probably because of an incomplete rotation of the magnetic field in MC1, see Figure 2, where decreases in magnitude but does not change sign in this interval. However, an additional complete rotation (from negative to positive values) of the normal component at the beginning of MC1, may be the origin of intense but irregular parallel peaks observed until 07:00:00 (DOY 18) along with some remissions in intensity of the anti-parallel peak.
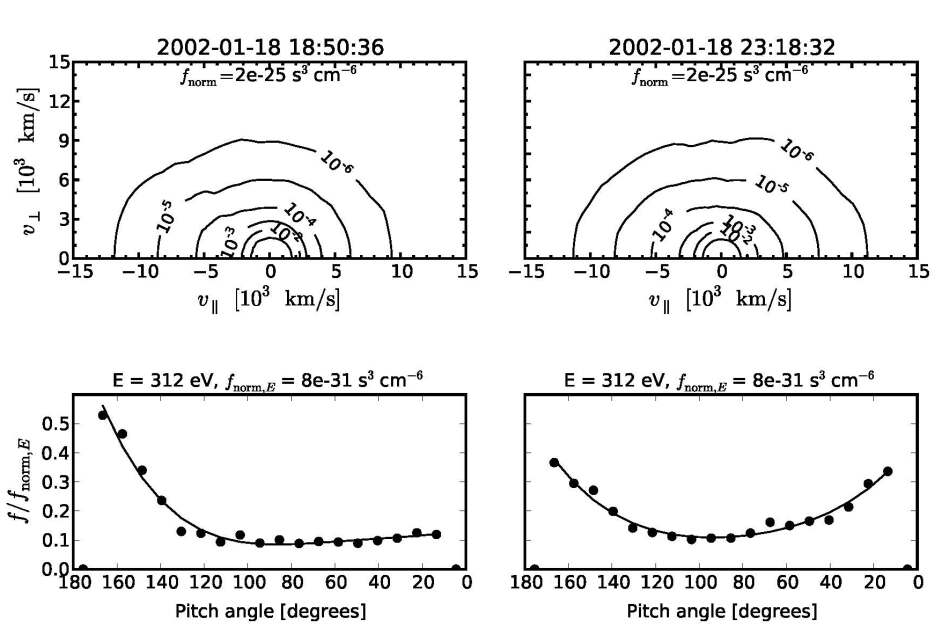
Although perturbations appear at DOY 18 12:00:00, the counter-streaming configurations in MC1 remain clear until DOY 18 16:00:00, simultaneous with both the radial and normal components of the magnetic field vanishing. However, the analysis in Article I found that Ulysses enters the second MC (MC2) at this time, i.e. DOY 18 16:00:28. Due to irregularities of the parallel strahl, counter-streams become asymmetric again for an interval of five hours following until about 21:00:00 (second dash–dotted line in Figure \ireff2). This interval therefore appears similar to the interval of four hours at the beginning of MC1. In addition, the radial component of the magnetic field changes sign again, pointing toward the Sun () after . These similarities between the intervals and give further support to the hypothesis that the CME event contains two distinct MCs. However, the end of MC1 indicated in Article I to be at (DOY 18 13:59:31) is only vaguely reflected in the profile of the PADs, which does not show a significant change, but only a slight remission of intensity of the parallel strahl. As discussed above, after , this beam is markedly diminished or seems to be completely suppressed for an interval of approximately 1.5 hours (between 18:00:00 and 20:00:00). Such a profile of PADs with a single strahl in the antiparallel direction is shown in Figure \ireff7, top–left panels. Short periods of uni-directional strahls inside the CME intervals could indicate disconnected or open magnetic-field lines, interweaved with the closed field lines Gosling, Birn, and Hesse (1995); Larson et al. (1997); Skoug et al. (2000a). Suppression of the parallel flow can be observed at all the energetic channels reliable for suprathermal data.
According to Article I, the second magnetic cloud MC2 lasts until (DOY 19 07:59:31), and is followed by a reverse shock at (DOY 19 13:59:31). Four samples of anisotropic velocity distributions and PADs from this interval are shown in Figure \ireff7. The temporal evolution from the top–left panels to the bottom–right panels indicates a reversal of the uni-directional strahl from the anti-parallel to parallel direction, respectively. This is well correlated with the rotation of the radial component of magnetic field, from negative to positive values (Figure \ireff2). Counter-streaming strahls are in general associated with these reversals in their intermediary phase, but not always. Similar reversals of uni-directional strahls have been reported from the in-situ observations by the Solar TErrestrial RElations Observatory (STEREO) spacecraft A Rouillard et al. (2009), with the difference that suprathermal electrons were not counter-streaming, suggesting that the magnetic-field lines forming the flux rope were open. Here the existence of counter-streams of suprathermal electrons is evident in intermediary phases. For instance, Figure \ireff7 indicates a gradual reversing of the magnetic field (closed field lines). Although the radial magnetic-field component (Figure \ireff2) does not exhibit a smooth variation during MC2, undergoing several short-time changes of sign (gradient reversals), the bipolar signature is evident from the larger scale trend in the entire interval of this cloud.
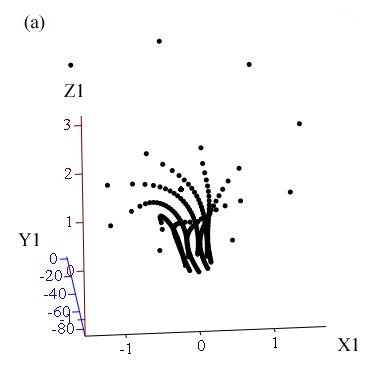
By correlating the new time limits resulted from the present study with the analysis from Article I we infer new interesting aspects. Thus, between and , we remark peaks for the rates of O7+/O6+, C6+/C5+ and Fe/O, while for the a depletion is registered (Figure 3 from Article I). Each of these values is higher than the corresponding threshold, indicating the presence of a MC. Figure 12 from Article I reveals the first sector of the MC2 displaying a perturbed helicity – this fact could be explained in the light of the new analysis from this paper. The different angles at which the two clouds hit the satellite could be an explanation for the strahl asymmetry, but to have a comprehensive insight into the phenomenon we have pursued with computations similar to Article I. We have divided MC2 in MC2a (from to ) and MC2b (from to ), and computed the magnetic field lines using the cylinder-shaped flux rope model described by \inlinecitema07 and adapted for Ulysses in Article I. This result supports the existence of two distinct regions in MC2 (Figure \irefmva2ab): MC2a and MC2b. The helicity of MC2a is right-handed (Figure \irefmva2aba), while MC2b has a left-handed helicity (Figure \irefmva2abb), similar to MC1 and to the solar source. Figure \irefmva2abc displays the two clouds hitting the spacecraft at different angles, with a large tilt angle between their axes. The situation that MC2a belongs to the same solar source is difficult to envision. The different helicity of the two clouds composing MC2 suggests that we have here the case of merged clouds coming from different solar sources. Most probably MC2a was produced by a coronal mass ejection (CME) that occurred behind the limb at a moment close to the CME that produced MC2b. It seems that MC2b overtook another CME as it travelled. In this way, two different CMEs arrived and merged at Ulysses at different angles. Their superposition at the beginning of MC2 can explain the parasite helicity and the intermittency shown by the PADs.
After DOY 19 13:31:41 the PADs are isotropized and do not show any peaks. Figure \ireffb4 presents the first snapshot of isotropic PADs after the CME event. This moment nearly coincides with the time DOY 19 13:59:31 identified in Article I when Ulysses encounters the reverse shock of the CME. In this interval the plasma seems to be more turbulent and dominated by fluctuations of both the particle density and the magnetic field (see Figure 2 in Article I). Similarly to the forward shock, the PADs change sharply after the reverse shock front (), showing rapid and consistent broadening of the suprathermal population. However, shortly after the shock front the signatures of an intense antiparallel strahl component, typical for the fast solar wind, become again visible. In the PADs this strahl appears less narrow but sufficiently intense to deviate towards lower energy core populations.
3.2 CME Precursors
The arrival time of the forward shock was found in Article I to be (DOY 17 21:00:00), and coincides in Figure \ireff2 (first solid line) with a drastic change of the PADs, namely, an isotropization of the less intense strahls observed before the shock. Before this impact the anisotropy of the velocity distributions presents signatures that indicate the approach of the CME. These precursors consist of fluxes of streaming and counter-streaming electrons that are progressively enhanced and exhibit characteristics similar to those observed later in the magnetic clouds. The onset of these bi-directional beams prior to the forward shock suggests the presence of closed magnetic-field lines propagating ahead of the MC Steed et al. (2011).
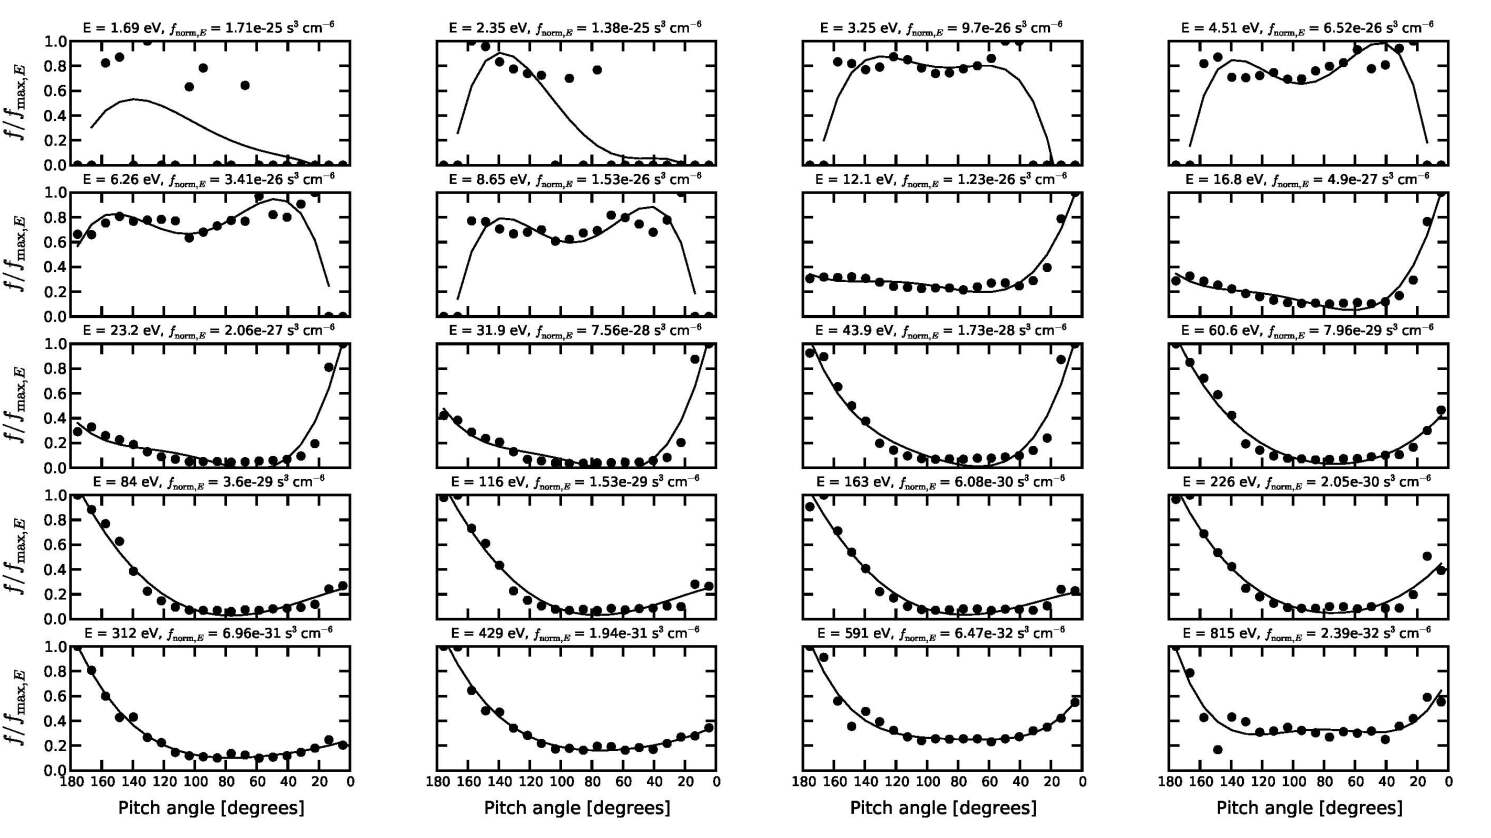
Precursors appear in the PADs of DOY 17 after 05:30:00, see Figure \ireff2, and rise progressively in two distinct phases. Four selections of PADs exhibiting signatures of strahls are displayed in Figure \ireff3. As in the CME, these strahls are indicated by peaks in directions parallel and anti-parallel to the magnetic field. First, only enhanced anti-parallel (uni-directional) strahls are observed (top panels) but after DOY 17 09:00:00 (dashed line in Figure \ireff2), the PADs become more anisotropic showing specific counter-streaming strahls that are detected first at higher energies. While the parallel peak is distinguishable only at sufficiently high energies (eV), the anti-parallel peak continues to be more intense, and is visible at very low energies down to 8.65 eV. This asymmetry can result, as explained above, from the superposition of a uni-directional strahl flowing outward from the Sun (in the fast wind) and the counter-streams along the closed magnetic-field lines Skoug et al. (2000c).
The magnetic-field magnitude is still low, and its direction, reversed after DOY 16 22:00:00 (not shown here), points predominantly outward from the Sun [] until Ulysses encounters the CME. In this case the more intense anti-parallel strahl is an inward flow, while the parallel strahl signifies an outward flow of electrons. All of the magnetic-field components exhibit a sinusoidal-like variation (see Figure \ireff2) indicating a helical flux rope, but they all keep to small values and change evenly sign for a few short times, suggesting a magnetic field topology similar to that at the apex of a loop. Such a topology of the magnetic field can be responsible for the occurrence of the counterstreams in the measured distribution.
Shortly after DOY 17 12:00:00, signatures of the parallel strahl move to lower energies, and counter-streaming strahls appear to be enhanced. Depletions of the PAD extends to a wide band of energy from suprathermal energies to less than eV (Figure \ireff2). Apparently, the parallel strahl is enhanced at the expense of the anti-parallel beam. This moment is also followed by perturbations and broadening of the strahls until DOY 17 17:30:00. The observed broadening of the anti-parallel strahl can be a result of the pitch-angle scattering in the field fluctuations driven by the beam-plasma instabilities.
A second enhancement of the counter-streaming strahls is apparent after DOY 17 15:30:00 (dotted line in Figure \ireff2), and it is confirmed by the more symmetric and pronounced peaks of PADs, as in Figure \ireff3 (bottom panels). This is a second indication of the approaching CME, by signatures of a closed magnetic field extending well ahead of the shock front. These signatures last until DOY 17 21:00:00, which is exactly the time estimated in Article I for the impact with the forward shock (first solid line in Figure \ireff2). The last two events displayed in Figure \ireff3 show clear structures (peaks) of counter-streaming strahls as typical precursors of the CME. We should note that peaks are not always centered at 0 or 180o pitch-angles. In the right panels, both peaks deviate from these positions, suggesting the existence of two pairs of counter-streams (because the distribution is assumed gyrotropic). These counter-streams represent not only precursors that could help us to anticipate the upcoming CME, but their existence also suggests a gradient (or a gradual dissipation) of the magnetic flux ropes beyond the ICME boundaries.
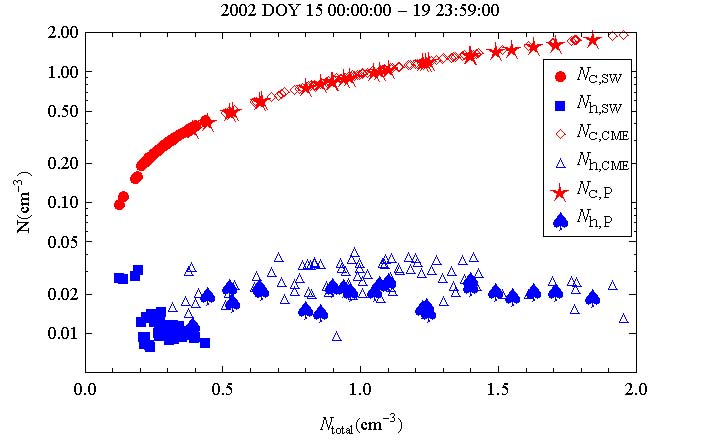
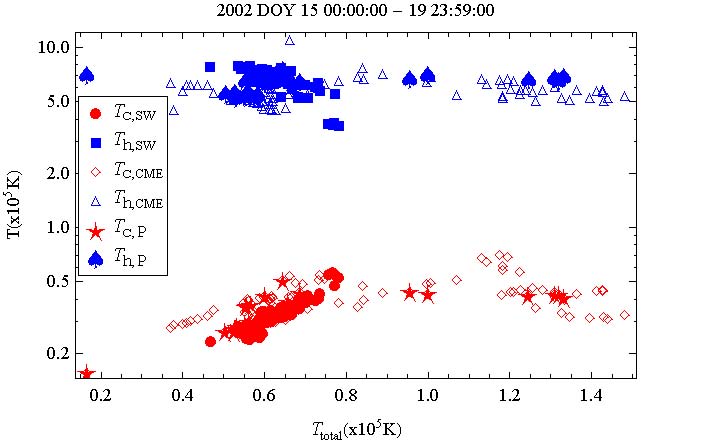
Likewise, indications of the upcoming CME can also be detected in the solar-wind electron plasma parameters. Figure \ireff10 displays the electron number density (top panel) and the electron temperature (bottom panel) for the core and halo components during three distinct intervals of time, namely, the CME event from DOY 18 01:42:00 to DOY 19 23:59:00, precursors in the interval DOY 17 08:00:00–23:59:00, and the solar wind before the CME between DOY 15 02:00:00 – DOY 18 23:59:00. Additional explanations of these plasma moments are given in Section 2 above. Distinction can be easily made since the core is much denser but much cooler than the halo. In the normal solar wind, unperturbed by the CME, both the core (filled circles) and halo (filled squares) data concentrate at low values of density and temperature. The density or temperature contrasts between these two components are about one order of magnitude on average. By comparison to the normal solar wind, the CME and precursors data show the same increase of density and temperature for both the core and halo populations. Noticeable is the increase of the core density (top panel) up to one order of magnitude during the precursors (stars) and the CME (diamonds). The apport of material is also prominent in the halo component which becomes two to three times denser in the precursors (filled spades) and CME (triangles). However, the surplus of kinetic energy is distributed mainly to the core populations (bottom panel), where the temperature starts increasing in the precursors (stars) and indicates a peak during the CME event (diamonds).
During the period of precursor streams the abundance and the charge-state values of exhibit a sudden increase (DOY 17 05:30:30), reaching values of that are comparable with the CME (see Article I, Figure 3). Also notice that a peak of the charge-state ratio appears at DOY 17 15:30:00 (Figure 3 from Article I) concomitant with a second enhancement of the precursor counter-streams. During the interval DOY 17 05:30:30–21:00:00 the C6+/C5+ ratio can reach values greater than those observed during the passage of MC2 (see Article I, Figure 3), and the solar wind elemental and ionic composition show an enhancing tendency similar to the upcoming CME. In addition, the proton density plotted in Figure 1, exhibits a jump at DOY 17 09:00:00, 12 hours ahead of the shock arrival. According to \inlinecitede13, such dense region can be the result of a pressure wave of solar wind material accumulated from the ambient solar wind ahead of the CME that travels outward from the Sun in the interplanetary space.
3.3 Strahls in the Fast Solar Wind – Before the CME
SWstrahls
According to observational studies at smaller heliographic distances and lower latitudes Maksimovic et al. (2005); Anderson et al. (2012) signatures of asymmetric or uni-directional strahls are, in general, present or more pronounced in the fast wind. Over the time interval examined here, Ulysses was situated at high heliographic latitudes over coronal holes of the northern pole, and episodes of fast solar wind are therefore expected to be frequent, except during the CME intervals.
The long-lasting fast wind episode between days 7 and 16 (see Figure \ireff1) is particularly important for a complete overview of our event. Although the solar wind is fast and very fast (reaching peaks km/s), this is a quiet time, without noticeable fluctuations of the magnetic field and density. The radial component of the magnetic field indicates a constant inward orientation () for the whole interval of ten days, with a short exception between DOY 16 04:00:00 – 09:00:00, in the day before the CME precursors. PADs are plotted in Figure \ireff8 for the last three days of this interval, showing a prominent anti-parallel peak of intensity lower than that observed in the precursors and CME. (The comparison is possible since we have used the same color bars as in Figure \ireff2). In this case the antiparallel peak indicates an outward moving flow of electrons, the presence of which is a characteristic of the whole interval of fast wind.
Less intense parallel peaks are also visible at suprathermal energies during DOY 14. An examination of the full energy map in Figure \ireffb5 (Appendix B) reveals an enhancement of this parallel peak at lower energies, where it becomes more prominent than the anti-parallel strahl. The asymmetry of these peaks seems to be similar to what we found at the entrance into the CME and supports the existence of strahls and not just a simple effect of the (parallel) temperature anisotropy (that should produce more symmetric peaks). This asymmetry is reduced and PADs appear less anisotropic in the last day (DOY 16) of this interval, probably as a side effect of the continuous drop of energetic particles. Such intervals of a low-energetic particle intensity can be attributed to merged interaction regions (MIRs) Richardson et al. (2002), but the relatively low magnetic-field strengths (Figure \ireff1) and low -particle densities (not shown here) do not sustain the existence of a MIR in this interval.
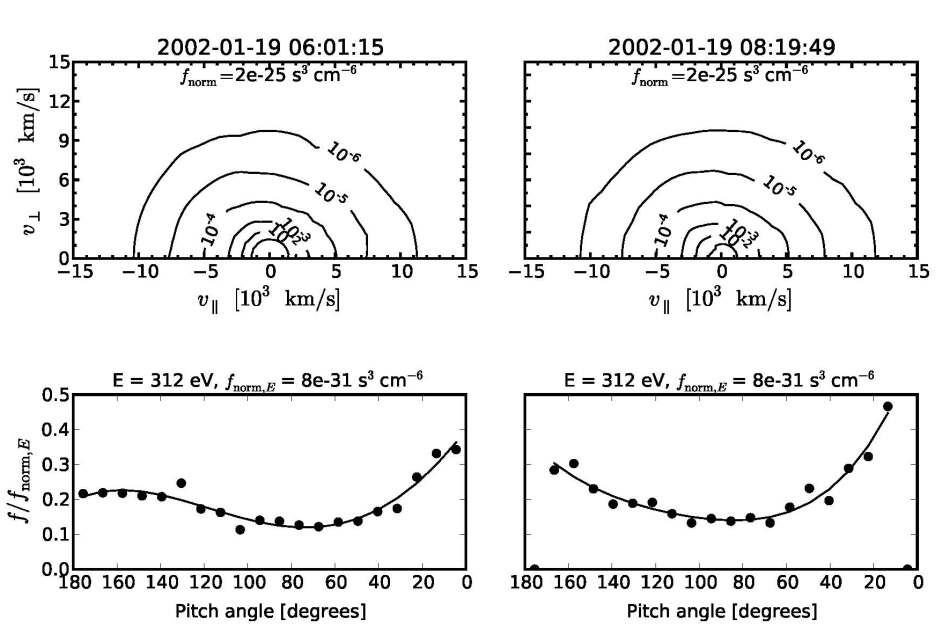
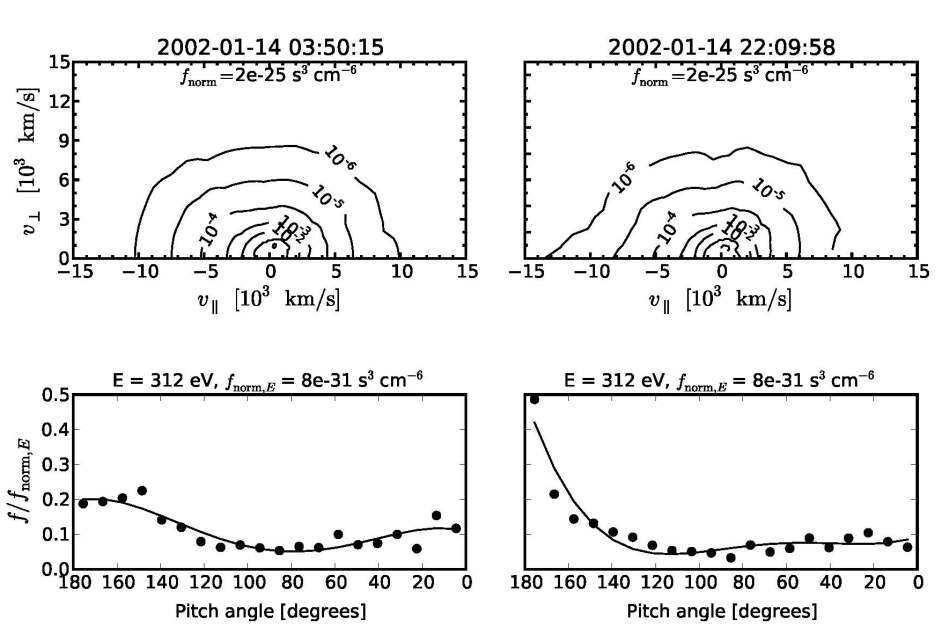
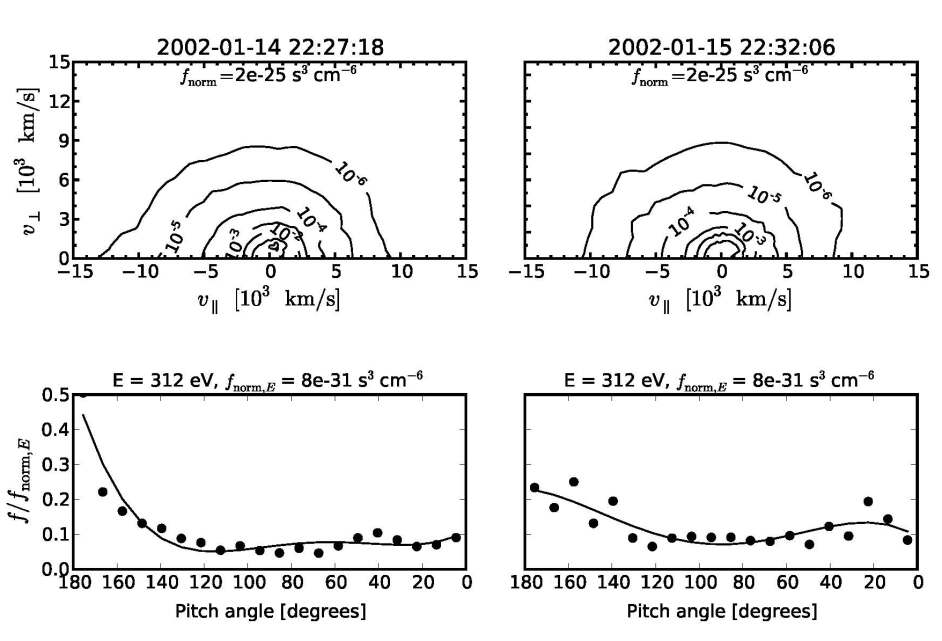
It is difficult to select an event (or several events) with PAD profiles to be representative of the whole interval, even for these conditions of a less perturbed solar wind. However, we have identified a restrained variety of strahls typical for this interval, and such cases are illustrated in Figure \ireff9 using the same plots of the velocity distributions (isocontours) and PADs (only for 312 eV). The top-left panels (DOY 14 03:50:15) present signatures of two opposite, parallel and antiparallel strahls, with similar intensities but different angular widths. The next event on DOY 14 22:09:58 exhibits a single, but more intense antiparallel strahl. Immediately after (DOY 14 22:27:18, bottom-right panels) counterstreams rise with different intensities but similar angular widths. The last case in the bottom-left panels show a distribution less anisotropic in the parallel direction but with a number of secondary beams at oblique directions.
4 Summary and Conclusion
This article presents a qualitative analysis of the electron beaming strahls in the solar wind during a high-latitude CME registered by Ulysses in Jannuary 18 – 19, 2002. As a distinct component of energetic particles, the strahls are expected to be more pronounced in the observations from high-latitude and from the passage of a CME. We have described the evolution of the velocity distributions in the magnetic clouds, ahead of the forward shock and after the reverse shock. Uni-directional and bi-directional strahls were identified as peaks of intense fluxes of electrons, which are in general directed parallel or anti-parallel to the magnetic field direction. To objectively assess the presence and extent of the strahls, their signatures were inspected at all energy channels available from observations.
Difficulties arise in the analysis of distributions with a symmetric depletion or two symmetric peaks, which can be the result of either two counter-streaming strahls or just an excess of parallel temperature. For these cases we have shown that a distinction is possible by an extended comparison of the PAD profiles at different (lower) energy channels. The symmetry of two opposite strahls breaks down at some energy levels, showing different profiles with clear signatures of asymmetric or uni-directional peaks. These differences are expected to appear since the parallel and anti-parallel strahls have different paths and origins. A plausible explanation for the asymmetry of the counter-streaming strahls (e.g. intensities and angular widths in Figures \ireff6 and \ireff7) can be given by the so-called strahl-on-strahl model, originally proposed by \inlinecitesk00c. The strahl-on-strahl distributions can result from the combination of electrons on their first transit outward from the Sun (narrow beam from the fast wind) with populations trapped on field lines still connected to the Sun at both ends (broad, bi-directional beams). Thus, these distributions and their evolution provide information about the magnetic topology of the solar wind and its variations across an CME.
A complete scan of the PADs has also revealed that, whether these strahls are uni- or bidirectional, their signatures can extend to very low energies, suggesting that their electron densities become in this case comparable with that of the thermal-core populations. This feature is not only a characteristic of the CME distributions, when the strahls are indeed enhanced, but it can be easily observed in the fast wind before the CME. It can also be correlated with a drop of the break point with increasing radial distance from the Sun.
The temporal evolution of the PADs shows two large intervals of continuous counter-streaming patterns during the CME event. At sufficiently high energies, e.g. 226 or 312 eV, the presence of counter-streams exceeds 85 % of the CME duration, estimated in Article I between the forward and reverse shocks, i.e. . With small adjustments of one to two hours these two boundaries are confirmed by drastic changes of the PADs, namely, the first indications of strahls at , and then their isotropization at . If we look to the other two internal boundaries [ and ], attributed in Article I to the end of MC1 and the beginning of MC2, respectively, the first one does not indicate any major change of PAD, but the second one () marks the end of a long interval (ten hours) of continuous presence of the counter-streaming strahls. This interval starts at , which is a new internal boundary indicated by the limits of intense counter-streams.
After the anti-parallel strahl is constantly present, while the parallel strahls appear only sporadically until , when the counter-streams become continuous again. Similarities of these two intervals and support the existence of two magnetic clouds suggested by the results of Article I. The counter-streams can be observed until , but shortly after the anti-parallel strahl becomes markedly less intense than the parallel strahl. We have in this case a very clear bipolar signature, which starts with an intense anti-parallel strahl between , and ends with a more enhanced parallel strahl in the interval . This is confirmed by the large-scale trend of the magnetic-field components [], which rotate from negative to positive values in the CME interval . Correlating with the analysis in Article I, the new internal boundaries can be associated with additional local jumps and depletions in the temporal evolution of the elemental composition and charge states, e.g. peaks of the rates of O7+/O6+, C6+/C5+ and Fe/O are observed in the interval , but these are not reproduced in the interval .
In the second part of our analysis, we have identified counter-streaming electrons which appear well in advance of the forward shock, as precursor elements – less intense but very similar to the counter-streams in the CME. Some enhanced traces of uni-directional strahls appear first, before the counter-streams, but these are ubiquitous in the fast wind over the poles, and probably cannot be attributed exclusively to an approaching CME. The first counter-streaming signatures are transmitted by the suprathermal channels (e.g. 226 and eV), with more than five hours in advance of the shock front. This interval is much longer than that of only one hour reported by ACE for the onset of the bi-directional beams prior to a MC in the ecliptic Steed et al. (2011). The CME expansion with heliocentric distance and heliographic latitude could explain this difference, if we admit the existence of bipolar magnetic-field lines ahead the MC, and that these fields undergo the same effect of expansion. Additional confirmations for the existence of these precursors, including their temporal extent, were obtained by testing the solar-wind electron-plasma parameters and the elemental abundance. By comparison to the normal solar wind, the CME and precursor data show the same enhanced values of electron density and temperature, for both the core and halo populations. Accumulations are also detected in the charge-state composition such as O, C, and Fe, as reliable signatures of an CME.
In the unperturbed solar wind the most visible is a uni-directional, anti-parallel strahl with densities one or two orders of magnitudes less than the thermal core populations. Streaming (and sometimes counter-streaming) patterns in the solar wind are markedly different from those observed during the CME and precursors. Visual comparison of the peak widths and intensities confirms the expectation that strahls are markedly enhanced by the apport of coronal matter from CME.
To conclude, the electron distributions are found to be highly anisotropic and dominated by the presence of strahls, not only during the CME but also well before the forward shock. Evidence presented here strongly supports a major implication of these populations into the interplanetary manifestation of the CME. The boundaries estimated in Article I for the distinct structures of the CME, i.e. shocks and magnetic clouds, are reconfirmed here. With only one exception, these limits correspond to significant changes of PADs (see Figure \ireff2). The exception is given by the ending time of MC1 (as estimated in Article I), which here indicates only a slight remission of intensity of the parallel strahl. Likewise, the analysis of uni-directional or bi-directional strahls enabled us to identify CME precursors before the forward shock, as well as substructures of the magnetic clouds.
Acknowledgements
The authors acknowledge use of the Ulysses/SWOOPS electron pitch-angle data from the ESA-RSSD Web service: www.rssd.esa.int/pub/ulysses/, PIs: R. Skoug and D.J. McComas; and CDAWeb service: cdaweb.gsfc.nasa.gov, data provider, A. Balogh (magnetic field), J.L. Phillips (plasma). ML acknowledges financial support from the EU Commission and Research Foundation Flanders (FWO) as FWO Pegasus Marie Curie Fellow (grant 1.2.070.13) and partial support from the Ruhr-Universität Bochum, and the Deutsche Forschungsgemeinschaft (DFG), grant Sh 21/3-2. These results were obtained in the framework of the projects GOA/2009-009 (KU Leuven), G.0729.11 (FWO-Vlaanderen) and C 90347 (ESA Prodex 9). The research leading to these results has also received funding from the European Commission’s Seventh Framework Programme (FP7/2007-2013) under the grant agreements SOLSPANET (project n° 269299, www.solspanet.eu), SPACECAST (project n° 262468, fp7-spacecast.eu), eHeroes (project n° 284461, www.eheroes.eu) and SWIFF (project n° 263340, www.swiff.eu). The authors are grateful to Horst Fichtner for reading the manuscript and providing insightful remarks, and the anonymous reviewer for his/her extremely thoughtful and constructive comments on the manuscript.
References
- Anderson et al. (2012) Anderson, B.R., Skoug, R.M., Steinberg, J.T., McComas, D.J.: 2012, Variability of the solar wind suprathermal electron strahl. J. Geophys. Res. 117, A04107. doi:10.1029/2011JA017269.
- DeForest, Howard, and McComas (2013) DeForest C. E., Howard T. A., McComas D. J.: 2013, Tracking Coronal Features from the Low Corona to Earth: A Quantitative Analysis of the 2008 December 12 Coronal Mass Ejection. ApJ 769, 43. doi:10.1088/0004-637X/769/1/43.
- Dumitrache, Popescu, and Oncica (2011) Dumitrache, C., Popescu, N.A., Oncica, A.: 2011, Tracking a Ulysses high-latitude ICME event back to its solar origins. Sol. Phys. 272, 137. doi:10.1007/s11207-011-9811-9.
- Ebert et al. (2009) Ebert, R.W., McComas, D.J., Elliott, H.A., Forsyth, R.J., Gosling, J.T.: 2009, Bulk properties of the slow and fast solar wind and interplanetary coronal mass ejections measured by Ulysses: Three polar orbits of observations. J. Geophys. Res. 114, A01109. doi: 10.1029/2008JA013631.
- Feldman et al. (1982) Feldman, W. C., Asbridge, J.R., Bame, S.J., Gosling, J.T.: 1982, Quantitative tests of a steady state theory of solar wind electrons. J. Geophys. Res. 87, 7355. doi:10.1029/JA087iA09p07355.
- Gosling et al. (1987) Gosling, J. T., D.N., Baker, S.J., Bame, W.C., Feldman, R.D., Zwickl, Smith, E.J.: 1987, Bidirectional solar wind electron heat flux events. J. Geophys. Res. 92, 8519. doi:10.1029/JA092iA08p08519.
- Gosling et al. (1993) Gosling, J. T., Bame, S.J., Feldman, W.C., McComas, D.J., Phillips, J.L., Goldstein, B.E.: 1993, Counterstreaming suprathermal electron events upstream of corotating shocks in the solar wind beyond approximately 2 AU: Ulysses, Geophys. Res. Lett. 20, 2335. doi:10.1029/ 93GL02489.
- Gosling et al. (1994a) Gosling, J. T., McComas, D. J., Phillips, J. L., Weiss, L. A., Pizzo, V. J., Goldstein, B. E., Forsyth, R.: 1994. A new class of forward-reverse shock pairs in the solar wind. Geophys. Res. Lett. 21, 2271. doi:10.1029/94GL02245.
- Gosling et al. (1994b) Gosling, J. T., Bame, S.J., McComas, D.J., Phillips, J.L., Scime, E.E., Pizzo, V.J., Goldstein, B.E:, Balogh, A.: 1994. A forward-reverse shock pair in the solar wind driven by over-expansion of a coronal mass ejection: Ulysses obsevations. Geophys. Res. Lett. 21, 237. doi:10.1029/94GL00001.
- Gosling, Birn, and Hesse (1995) Gosling, J.T., Birn, J., Hesse, M.: 1995. Three-dimensional magnetic reconnection and the magnetic topology of coronal mass ejection events. Geophys. Res. Lett. 22, 869. doi:10.1029/95GL00270.
- Gosling et al. (2002) Gosling, J.T., Skoug, R.M., Feldman, W.C., McComas, D.J.: 2002. Symmetric suprathermal electron depletions on closed field lines in the solar wind. Geophys. Res. Lett. 29, 1573. doi:10.1029/2001GL013949.
- Hammond et al. (1996) Hammond, C.M., Feldman, W.C., McComas, D.J., Phillips, J.L., Forsyth, R.J.: 1996. Variation of electron-strahl width in the high-speed solar wind: Ulysses observations. A&A 316, 350.
- Jones, Balogh, and Smith (2003) Jones, G.H., Balogh, A., Smith, E.J.: 2003. Solar magnetic field reversal as seen at Ulysses. Geophys. Res. Lett. 30, 8028. doi:10.1029/2003GL017204
- Larson et al. (1997) Larson, D.E., Lin, R.P., McTieman, J.M., McFadden, J.P., Ergun, R.E., McCarthy, M., Rème, H., Sanderson, T.R., Kaiser, M., Lepping, R.P., Mazur, J.: 1997. Tracing the topology of the October 18-20, 1995, magnetic loud with 0.1 - 102 keV electrons. Geophys. Res. Lett. 24, 1911. doi:10.1029/97GL01878.
- Lazar et al. (2012) Lazar, M., Pierrard, V., Poedts, S., Schlickeiseret R.,: 2012. Modeling Space Plasma Dynamics with Anisotropic Kappa Distributions. Astrophys Space Sci Proc. 33, 97. doi:10.1007/978-3-642-30442-2_12
- Lemons and Feldman (1983) Lemons, D.S., Feldman, W.C.: 1983. Collisional modification to the exospheric theory of solar wind halo electron pitch angle distributions. J. Geophys. Res. 88, 6881. doi:10.1029/JA088iA09p06881.
- Maksimovic et al. (2005) Maksimovic, M., Zouganelis, I., Chaufray, J.-Y., Issautier, K., et al.: 2005, Radial evolution of the electron distribution functions in the fast solar wind between 0.3 and 1.5 AU. J. Geophys. Res. 110, A09104. doi:10.1029/2005JA011119.
- Marubashi and Lepping (2007) Marubashi, K., Lepping, R.P.: 2007. Long-duration magnetic clouds: a comparison of analyses using torus- and cylinder-shaped flux rope models. Annales Geophysicae 25, 2453. doi:10.5194/angeo-25-2453-2007.
- Nieves-Chinchilla and Viñas (2008) Nieves-Chinchilla, T., Viñas, A.F.: 2008. Solar wind electron distribution functions inside magnetic clouds. J. Geophys. Res. 113, A02105. doi:10.1029/2007JA012703.
- Pagel et al. (2005) Pagel, C., Crooker, N.U., Larson, D.E., Kahler, S.W., Owens, M.J.: 2005. Understanding electron heat flux signatures in the solar wind. J. Geophys. Res. 110, A01103. doi:10.1029/2004JA010767
- Pagel et al. (2007) Pagel, C., Gary, S.P., de Koning, C.A., Skoug, R.M., Stainberg, J.T.: 2007. Scattering of suprathermal electrons in the solar wind: ACE observations. J. Geophys. Res. 112, A04103. doi:10.1029/2006JA011967.
- Pierrard, Lazar, and Schlickeiser (2011) Pierrard, V., Lazar, M., Schlickeiser, R.: 2011. Evolution of the electron distribution function in the whistler wave turbulence of the solar wind. Sol. Phys. 269, 421. doi:10.1007/s11207-010-9700-7.
- Pilipp et al. (1987a) Pilipp, W.G., Miggenrieder, H., Montogomery, M.D., Mühlhäuser, K.-H., Rosenbauer, H., Schwenn, R.: 1987a. Characteristics of electron velocity distribution functions in the solar wind derived from the Helios plasma experiment. J. Geophys. Res. 92, 1075. doi:10.1029/JA092iA02p01075.
- Pilipp et al. (1987b) Pilipp, W.G., Miggenrieder, H., Montogomery, M.D., Mühlhäuser, K.-H., Rosenbauer, H., Schwenn, R.: 1987b. Unusual electron distribution functions in the solar wind derived from the Helios plasma experiment: Double-strahl distributions and distributions with an extremely anisotropic core. J. Geophys. Res. 92, 1093. doi:10.1029/JA092iA02p01093.
- Pilipp et al. (1987c) Pilipp, W.G., Miggenrieder, H., Mühlhäuser, K.-H., Rosenbauer, H., Schwenn, R., Neubauer, F.M.: 1987c. Variations of electron distribution functions in the solar wind. J. Geophys. Res. 92, 1103. doi:10.1029/JA092iA02p01103.
- Reisenfeld et al. (2003) Reisenfeld, D.B., Gosling, J.T., Forsyth, R.J., Riley, P., St. Cyr, O.C.: 2003. Properties of high-latitude CME driven disturbances during Ulysses second northern polar passage. Geophys. Res. Lett. 19, 8031. doi:10.1029/2003GL017155.
- Richardson and Cane (2010) Richardson, I.G., Cane, H.V.: 2010. Near-Earth Interplanetary Coronal Mass Ejections During Solar Cycle 23 (1996-2009): Catalog and Summary of Properties. Sol. Phys. 264, 189. doi:10.1007/s11207-010-9568-6.
- Richardson et al. (2002) Richardson, J.D., Paularena, K.I., Wang, C., Burlaga, L.F.: 2002. The life of a CME and the development of a MIR: From the Sun to 58 AU. J. Geophys. Res. 107, SSH-1. doi:10.1029/2001JA000175.
- Rosenbauer et al. (1977) Rosenbauer, H., Schwenn, R.; Marsch, E., Meyer, B., Miggenrieder, H., Montgomery, M.D., Muehlhaeuser, K.H., Pilipp, W., Voges, W., Zink, S.M.: 1977. A survey on initial results of the HELIOS plasma experiment. J. Geophys. - Z. Geophys., 42, 561.
- Rouillard et al. (2009) Rouillard, A. P., Savani, N. P., Davies, J.A., Lavraud, B., et al.: 2009. A multispacecraft analysis of a small-scale transient entrained by solar wind streams. Sol. Phys. 256, 307. 10.1007/s11207-009-9329-6
- Scime, Phillips, and Bame (1994) Scime, E.E., Phillips, J.L., Bame, S.J.: 1994. Effects of spacecraft potential on 3-dimensional electron measurements in the solar-wind. J. Geophys. Res. 99, 14769. doi:10.1029/94JA00489.
- Skoug (2012) Skoug, R.: 2012. Ulysses/SWOOPS Electron Pitch Angle Distributions, ESA-RSSD Web service: www.rssd.esa.int/pub/ulysses/SWOOPS/.
- Skoug et al. (2000a) Skoug, R., Feldman, W.C., Gosling, J.T., McComas, D.J.: 2000a. Solar wind electron characteristics inside and outside coronal mass ejections. J. Geophys. Res. 105, 23069. doi:10.1029/2000JA000017
- Skoug et al. (2000b) Skoug, R., Feldman, W.C., Gosling, J.T., McComas, D.J., Reisenfeld, D.B., Smith, C.W., Lepping, R.P., Balogh, A.: 2000b, Radial variation of solar wind electrons inside a magnetic cloud observed at 1 and 5 AU. J. Geophys. Res. 105, 27269. doi:10.1029/2000JA000095.
- Skoug et al. (2000c) Skoug, R., Gary, S.P., Gosling, J.T., McComas, D.J., Steinberg, J.T., Tokar, R.L.: 2000. Strahl-on-strahl halo electron distributions observed in the solar wind by ACE/SWEPAM, AGU Spring Meeting. http://abstractsearch.agu.org
- Skoug et al. (2006) Skoug, R. M., Gosling, J.T., McComas, D.J., Smith, C.W., Hu, Q.: 2006. Suprathermal electron 90o pitch angle depletions at reverse shocks in the solar wind. J. Geophys. Res. 111, A01101. doi:10.1029/ 2005JA011316.
- Steed et al. (2011) Steed, K., Owen, C.J., Démoulin, P., Dasso, S.: 2011. Investigating the observational signatures of magnetic cloud substructure. J. Geophys. Res. 116, A01106. doi:10.1029/ 2010JA015940.
- Vocks et al. (2005) Vocks, C., Salem, C., Lin, R.P., Mann, G.: 2005. Electron halo and strahl formation in the solar wind by resonant interaction with whistler waves. ApJ 627, 540. doi:10.1086/430119.
- Walsh et al. (2013) Walsh, A.P., Arridge, C.S., Masters, A., Lewis, G.R., Fazakerley, A.N., Jones, G.H., Owen, C. J., Coates, A.J.: 2013. An indication of the existence of a solar wind strahl at 10 AU. Geophys. Res. Lett. 40, 2495. doi:10.1002/grl.50529.