Chandra detection of a new diffuse X-ray component from the globular cluster 47 Tucanae
Abstract
In re-analyzing the archival Chandra data of the globular cluster 47 Tucanae, we have detected a new diffuse X-ray emission feature within the half-mass radius of the cluster. The spectrum of the diffuse emission can be described by a power-law model plus a plasma component with photon index and plasma temperature keV. While the thermal component is apparently uniform, the non-thermal contribution falls off exponentially from the core. The observed properties could possibly be explained in the context of multiple shocks resulted from the collisions among the stellar wind in the cluster and the inverse Compton scattering between the pulsar wind and the relic photons.
1 Introduction
Globular clusters (GCs) are gravitationally bound dense systems hosting a very old stellar population of our Galaxy. Due to the high stellar densities in their cores, GCs are efficient in producing compact binaries through dynamical interactions (Pooley & Hut 2006; Pooley et al. 2003; Hui et al. 2010). As millisecond pulsars (MSPs) are descendants of low-mass X-ray binaries (LMXBs) (Alpar et al. 1982), GCs are expected to be efficient factories of MSPs.
In high energy regime, the Large Area Telescope (LAT) on board the Fermi Gamma-ray Space Telescope has detected GeV -rays from a number of Galactic GCs (Abdo et al. 2009a, 2010; Kong et al. 2010; Tam et al. 2011), confirming GCs as a class of -ray emitters. There are two possible explanations for the origin of -ray emission from GCs. In one scenario, the emission can be interpreted as the collective magnetospheric emission from the whole MSP population in the GC (e.g. Venter & de Jager 2008). Indeed, the -ray spectra of these detected GCs are reminiscent of those measured from the Galactic MSP population (e.g. Abdo et al. 2009b) as well as the individual MSPs detected in GCs NGC 6624 (Freire et al. 2001) and M28 (Wu et al. 2013; Johnson et al. 2013). On the other hand, pulsar wind from the MSPs could also contribute to the observed -rays via the inverse Compton scattering (ICS) between relativistic pulsar wind leptons and background soft photons (Bednarek & Sitarek 2007; Cheng et al. 2010; Hui et al. 2011). The IC scattering between these wind particles and the relic photons can also result in a diffuse X-ray structure (Cheng et al. 2010). Searching for this predicted extended feature in X-ray can help to constrain the pulsar wind model of -ray GCs.
Hui et al. (2009) has searched for diffuse X-ray emission from the core regions of ten GCs using Chandra archival data, enabling unresolved X-ray emission to be found for four clusters, which was attributed to unresolved faint point source populations in the cores of the clusters. On the other hand, Eger et al. (2010) have detected diffuse X-ray emission associated with Terzan 5 outside its half-mass radius. They found that the emission can be characterized by a power law with hard photon index and is unlikely to be contributed from a population of unresolved point sources below the detection limit. The hard photon index was suggested to be a result of a non-thermal scenario by synchrotron radiation from energetics considerations. However, the limited statistics did not enable this study to draw a firm conclusion.
Motivated by the aforementioned discovery, Eger & Domainko (2012) has systematically searched archival Chandra data for diffuse X-ray emission from several Galactic GCs that has been detected in -rays by Fermi. The authors excluded 47 Tuc in their analysis because less than half of the potential diffuse emission region (i.e. between one and three half-mass radius ) is covered by the field of view (FoV) in the adopted datasets.
A previous search for diffuse X-ray emission in the direction of 47 Tuc has idenitified an extended feature beyond its half-mass radius and in the direction of proper motion of the cluster (Okada et al. 2007). However, such feature has later been confirmed to be not physically associated with 47 Tuc (Yuasa et al. 2009). While these studies were focused on an individual extended feature at a location offset from the center of 47 Tuc, we are interested in searching for an isotropic diffuse X-ray component associated with this GC.
Being a nearby GC at 4.5 kpc (Harris 1996) and a host of a large MSP population, 47 Tuc is one of the promising targets to search for the diffuse X-ray feature as theoretically predicted (cf. Cheng et al. 2010). Together with the large volume of archival X-ray data, this motivates a deep search for diffuse emission in an unexplored region outside the core radius of the cluster.
In this Letter, we report the results from searching for diffuse X-ray emission associated with 47 Tuc in the region from up to from the center. This selected field can alleviate the problem of potential contamination by the unresolved faint source population (cf. §3) and allow a region sufficiently large for our search.
2 Data Analysis and Results
To search for faint diffuse X-ray emission from 47 Tuc, we made use of archival Chandra data and restricted our analysis on the Advanced CCD Imaging Spectrometer (ACIS) data with an exposure ks. This limited us to four observations in 2002 (ObsID 2735, 2736, 2737 and 2738). The aim-points of all the four observations are on the S3 chip. We first reprocessed the data by using CIAO (Ver. 4.5) script chandra_repro with the calibration files CALDB (Ver. 4.5.5). Inspections on the 0.5-7.0 keV lightcurves indicate that two observations (ObsID 2736 and 2738) suffered from prominent background flares. We subsequently performed the good time interval (GTI) filtering by using the CIAO routine lc_clean(). Combining all the clean data resulted in an effective exposure of ks.
By inspecting the reprocessed event files, signs of pileup effects were seen caused by the bright sources in the core of the cluster. We used the CIAO tool pileup_map and the associated conversion formulae to deduce the pileup fractions.111See http://cxc.harvard.edu/csc/memos/files/Davis_pileup.pdf It was found that the three brightest sources detected by Heinke et al. (2005), X7, X9 and X5, have pileup fractions , with that of X7 exceeding . We excluded a rectangular region with a width of 0.5’ centered on X7 and a length along the readout direction of the entire chip in subsequent spectrum extraction so as to avoid the contamination of the out-of-time events from the bright source.
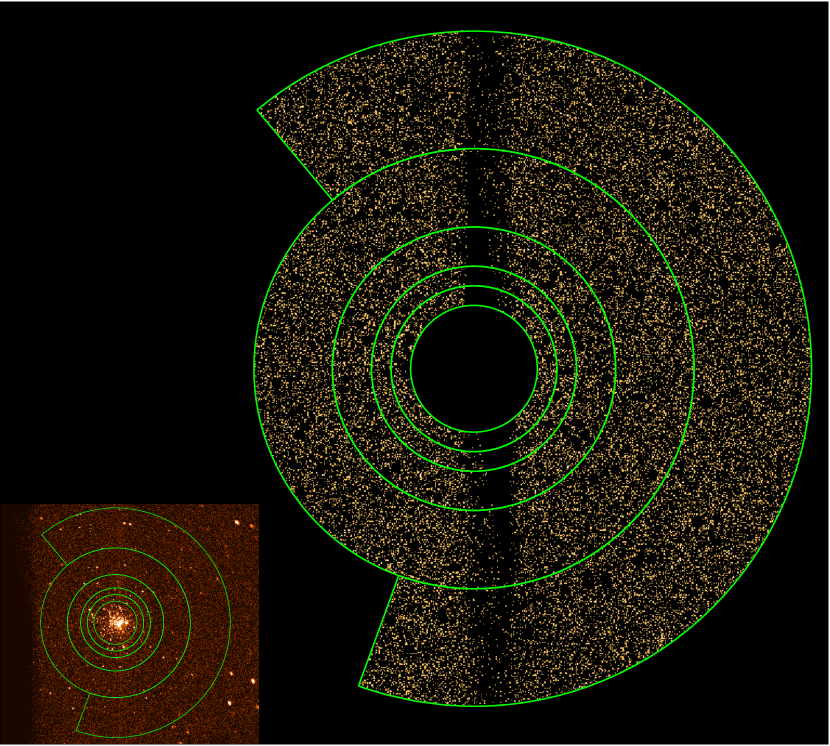
To define the region-of-interest (RoI), we first chose the largest annular region in which is fully contained in the S3 chip. In order to fully utilize the FoV, we appended the aforementioned region with an truncated annular region extending to (see Figure 1). The angular span of this region was chosen such that it lies entirely within the CCD chip in all four observations. The entire RoI in our study was defined by assembling all these adopted regions.
To effectively remove the resolved point sources in the RoI, we took the sky positions in the point source catalog by Heinke et al. (2005) and calculated the size of the Chandra point spread function (PSF) at 1.5 keV with an enclosed-counts fraction (ECF) of at the positions of these point sources by using the psf Python module. Since Heinke et al. (2005) covers only sources within of 47 Tuc, we ran wavdetect in the energy band 0.5-7.0 keV to detect sources beyond this region. These sources were subsequently removed as aforementioned.
After removing all the resolved point sources and excluding the pileup-affected region, we extracted the spectra from individual observations within the entire RoI in an energy band of keV.
We began our investigation with a spectral analysis of the X-ray emission from the entire RoI. For tightly constraining the emission properties, we fitted the spectra extracted from all observations simultaneously. Since the RoI covers a large fraction of the S3 chip, there are limited source-free regions on the chip for extracting the background spectra. In addition, the peripheral region of the chip could possibly contain the contribution of diffuse X-ray emission that we are searching for. Therefore, we adopted the ACIS blank-sky event files as the background throughout our study. We followed the online analysis thread to tailor and reproject the blank-sky background files so as to match the observed datasets222http://cxc.harvard.edu/ciao/threads/acisbackground/.
For judging the background normalization, we have inspected the source and background spectra individually for each observation in keV. In this band, observed data are dominated by particle background. Except for the data from ObsID 2738, the estimated background contributions for all other observations are which indicates the particle background normalizations are legitimate. For ObsID 2738, we noticed a residual background () in this band. For minimizing the systematic uncertainties, we excluded this data in all subsequent analysis. The response files used in this extended source analysis were commputed by weighting the flux contribution from each pixel with the aid of a detector map.
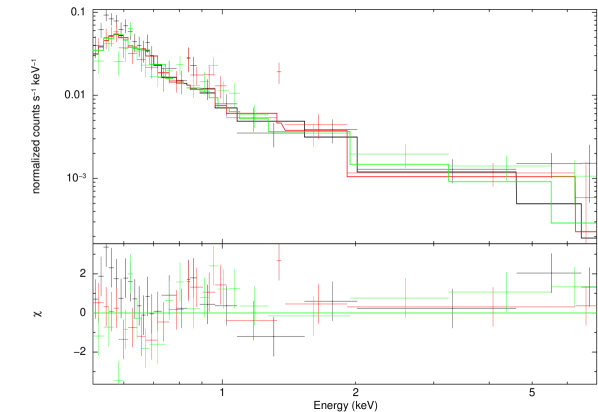
For all the spectral analysis, we fixed the column absorption at which was deduced from the foreground reddening (Harris 1996; Predehl & Schmitt 1995; Cardelli et al. 1989). We first fitted the spectra using an absorbed power law (PL) model in a form of , where the free parameters and are the normalization in unit of photons keV-1 cm-2 s-1 at 1 keV and the index of the photon flux respectively. The best-fit yields a photon index of . However, we noticed that the goodness-of-fit is not desirable. We have also attempted to fit the data with a thermal plasma model which includes the contribution from the metal lines (XSPEC model: MEKAL). But we found this model also results in a poor goodness-of-fit. On the other hand, by adding a MEKAL component to the PL model, a reasonable description of the observed data can be obtained ( for 415 d.o.f.). This composite model yields a photon index of and a plasma temperature of . -test indicates that the PL+MEKAL model is favored over a single PL or a single MEKAL model at a confidence level . The energy spectrum of the entire RoI with the PL+MEKAL model fit is shown in Figure 2.
In order to estimate the contribution from unresolved point sources in the RoI, we constructed the cumulative luminosity function by using the luminosities of the sources within in 0.5-6 keV reported by Heinke et al. (2005). Fitting the distribution with a functional form of , we obtained and . With a putative detection limit of erg s-1 (Heinke et al. 2005), we integrated the source density in the 0.5 – 6.0 keV energy range to obtain a luminosity of erg s-1 within . For estimating their contribution in our RoI, we adopted a radial source density with a form of:
| (1) |
where is a normalization factor and is the best-fit value obtained by Heinke et al. (2005). The expected luminosity of the unresolved point sources can then be estimated by erg s erg s-1. To compare with this value, we calculated the measured luminosity in the same energy range to be erg s-1 for the PL+MEKAL model. Therefore, we conclude that the contribution from unresolved point sources to the observed emission is negligible.
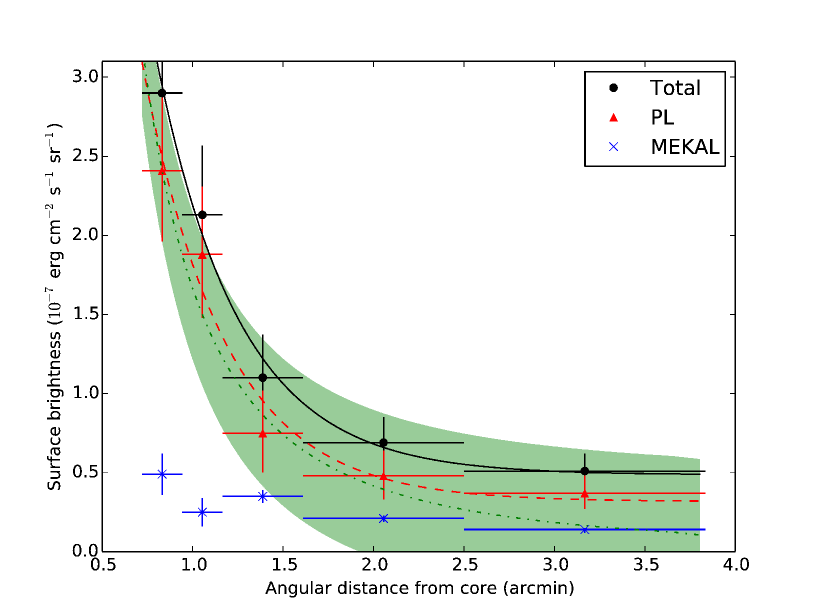
To quantify the distribution of the diffuse X-ray emission as an angular distance from the center of the cluster, we divided the RoI into five concentric annular regions (rings). The sizes of each ring were chosen to obtain the spectral parameters with comparable relative errors in each ring. The fitting results of all rings are summarized in Table 2. To obtain a surface brightness profile, we integrated the best-fit models for each ring over the energy band 0.5 – 7.0 keV and divided the unabsorbed flux by the corresponding solid angle of the extraction region. The solid angles were computed with the exclusion of the PSF subtraction regions of point sources and the bad pixels. The brightness profile is plotted in Figure 3 in which the total surface brightness has shown an exponential fall-off. For a more detailed investigation, we disentangled the thermal and non-thermal contributions as shown in Fig. 3. While the non-thermal X-rays follows an exponential fall-off that conforms with the stellar density profile of 47 Tuc (green dot-dashed line in Fig. 3), the plasma component is apparently uniform.
To quantify the structure of the diffuse emission, we have fitted the function to the brightness profile, where is a normalization parameter, is the characteristic fall-off distance, and is the brightness at the tail. The best-fit for the total brightness yields and that for the PL component gives , which are compatible within uncertainties. On the other hand, the best-fit constant levels for the total brightness and the PL component are found to be erg cm-2 s-1 sr-1 and erg cm-2 s-1 sr-1 respectively.
| Model | (d.o.f.) | Norm | ||||
|---|---|---|---|---|---|---|
| (keV) | ( erg s-1) | ( erg s-1) | ||||
| PL | 1.25 (417) | |||||
| MEKAL | 1.37 (417) | |||||
| PL+MEKAL | 1.15 (415) | / |
| Ring | aaNormalization parameter of the PL/MEKAL model/component. It is photons cm-2 s-1 keV-1 at 1 keV for a PL model. It is equal to for a MEKAL model, where is taken to be 4.5 kpc. | bbPlasma temperature. | (keV) | ccIntegrated luminosity of the PL component in the energy 0.5 – 7.0 keV. | ddSame as (c) but for the MEKAL component. | eeTotal surface brightness as a sum of (c) and (d). | |
| 1 | 0.72 | 0.9425 | |||||
| 2 | 0.9425 | 1.165 | |||||
| 3 | 1.165 | 1.61 | |||||
| 4 | 1.61 | 2.5 | |||||
| 5 | 2.5 | 3.835 |
3 Summary & Discussion
In examining the archival Chandra data, we have uncovered a faint extended X-ray feature in a region from to from the center of 47 Tuc. Figure 3 shows that the unabsorbed diffuse X-rays in the 0.5-7.0 keV band consist of two components, i.e. an exponential fall-off non-thermal component plus a uniform thermal component. The spectrum of the non-thermal component is very hard with a photon index . The surface brightness of this component apparently correlates wtih the point source distribution (i.e. Equation 1) very well. The profiles of both extended feature and the radio point source density fall by from 1’ to 2’ and from 1’ to 3’.
It is known that stellar winds of massive stars are clumpy and non-thermal emission has been observed (cf. Feldmeier 2001 for a general review). In the core of a GC, collisions among stellar winds from high stellar density region could create multiple shocks that resemble the situation of stellar wind from massive stars. The electron distribution in multi-shock regions is known to have a very hard distribution () (Bykov & Fleishman 1992; Bykov & Toptygin 1993). For a power-law distribution of electrons: , the radiation via either synchrotron radiation or inverse Compton scattering will have a photon index of . And hence, a very hard X-ray spectrum is expected from the multi-shock regions.
To estimate the shock radius , we used Equation (5) of Weaver et al. (1977): , where and are the total wind power from the cluster and the expansion time scale respectively. The wind power depends on the number of stars in the GC , the mass-loss rate and the wind velocity : . Taking the characteristic values of stellar wind, i.e. yr-1 and km/s, which gives erg/s. 47 Tuc has a finite proper motion at the order of km/s (cf. Okada et al. 2007). Assuming the shock maintains a spherical symmetry, the time scale can be estimated by Equation (64) of Weaver et al. (1977) which gives s, where and is the proton mass. Substituting all these into , the shock radius is found at an order of pc. At 4.5 kpc, this corresponds to an angular size of . Therefore the total stellar wind coming out the core of the GC can form shock with ISM at a distance much larger than .
Consequently the radiation away from the core should consist of two components, i.e. the non-thermal component emitted from non-thermal electrons accelerated in the diffuse shock region, whose energy index is 2-3 (Bell 1978), and the thermal component emitted from the shock-heated plasma. The temperature behind shock is estimated by for adiabatic shock (Weaver et al. 1977), where the shock velocity is estimated by cm/s. And hence K which is consistent with the observed value. We can also estimate the thermal X-ray luminosity from thermal bremsstralung which is a function of local plasma density, plasma temperature and the total volume-of-interest (Rybicki & Lightman 1979): . For estimating the plasma density, we can utilize the normalization parameter deduced from the best-fit plasma model . Assuming , we obtain cm-3, where we adopted the radius of the RoI as pc. We noticed that this estimate is less than the electron density ( cm-3) obtained by Freire et al. (2001). The under-estimation can stem from ignoring the metal content in the cluster. Adopting K, cm-3 and cm3, the thermal bremsstralung luminosity is at the order of erg/s which agrees with the observed value.
Apart from the shock produced by the stellar wind and ISM, we have also considered other possible contribution to the non-thermal component. Cheng et al. (2010) has shown that inverse Compton (IC) scattering between the background soft photon fields and the relativistic electrons in pulsar wind can contribute to the -ray from GCs. They predict that a uniform X-ray component should exist due to IC scattering between the relic photons and the pulsar wind relativistic electrons. And the X-ray flux is proportional to the -ray flux as , where is the Lorentz factor of pulsar wind in unit of , is the observed -ray energy flux in GeV regime, is the typical spin-down power of MSP in units of erg/s and is the energy ratio between electrons and protons. Lorentz factor of pulsar wind is estimated as . Taking the ratio between the relic photon energy density and soft photon energy density to be (Cheng et al. 2010) and erg cm-2 s-1 (Abdo et al. 2010), we obtain erg cm-2 s-1. Since -ray emission from 47 Tuc is consistent with a point source as observed by Fermi, hence its emission radius must be less than the PSF of the telescope (i.e. ). The corresponding IC X-ray luminosity emitted from is given by erg/s, where kpc is the distance to 47 Tuc, which is consistent with the observed non-thermal luminosity given in Table 1.
Follow-up investigations of the nature of the extended X-ray feature of 47 Tuc are encouraged. Weaver et al. (1977) suggested that a large number of emission lines should be emitted from the shock-heated plasma. Deep X-ray observation with high spectral resolution is required to resolve them. Based on the IC model, radio flux from the pulsar wind should be also correlated with -ray flux (Cheng et al. 2010), future radio observations with higher resolution and sensitivity can also help to constrain the model.
References
- Abdo et al. (2009a) Abdo, A. A., Ackermann, M., Ajello, M., et al. 2009a, Science, 325, 845
- Abdo et al. (2009b) Abdo, A. A., Ackermann, M., Ajello, M., et al. 2009b, Science, 325, 848
- Abdo et al. (2010) Abdo, A. A., Ackermann, M., Ajello, M., et al. 2010, A&A, 524, A75
- Alpar et al. (1982) Alpar, M. A., Cheng, A. F., Ruderman, M. A., & Shaham, J. 1982, Nature, 300, 728
- Bednarek & Sitarek (2007) Bednarek, W., & Sitarek, J. 2007, MNRAS, 377, 920
- (6) Bell, A. R. 1978, MNRAS, 182, 147
- (7) Bykov, A. M., & Fleishman, G. D. 1992, MNRAS, 255, 269
- (8) Bykov, A. M., & Toptygin, I. N. 1993, Phys.-Usp., 36, 1020
- Cardelli et al. (1989) Cardelli, J. A., Clayton, G. C., & Mathis, J. S. 1989, ApJ, 345, 245
- Cheng et al. (2010) Cheng, K. S., Chernyshov, D. O., Dogiel, V. A., et al. 2010, ApJ, 723, 1219
- Eger & Domainko (2012) Eger, P., & Domainko, W. 2012, A&A, 540, 17
- Eger et al. (2010) Eger, P., Domainko, W., & Clapson, A.-C. 2010, A&A, 513, 66
- (13) Feldmeier, A., 2001, Ph.D. thesis, Potsdam Univ.
- (14) Freire, P. C. C., et al. 2011, Science, 334, 1107
- (15) Freire, P. C., Kramer, M., Lyne, A. G., Camilo, F., Manchester, R. N., & D’Amico, N. 2001, ApJ, 557, L105
- Harris (1996) Harris, W. E. 1996, AJ, 112, 1487
- Heinke (2005) Heinke, C. O., Grindlay, J. E., Edmonds, P. D., et al. 2005, ApJ, 625, 796
- Hui et al. (2009) Hui, C. Y., Cheng, K. S., & Taam, R. E. 2009, ApJ, 700, 1233
- Hui et al. (2010) Hui, C. Y., Cheng, K. S., & Taam, R. E. 2010, ApJ, 714, 1149
- Hui et al. (2011) Hui, C. Y., Cheng, K. S., Wang, Y., et al. 2011, ApJ, 726, 100
- (21) Johnson, T. J., et al. 2013, ApJ, 778, 106
- King (1966) King, I. R. 1966, AJ, 71, 64
- Kong et al. (2010) Kong, A. K. H., Hui, C. Y., & Cheng, K. S. 2010, ApJ, 712, L36
- Kuranov & Postnov (2006) Kuranov, A. G., & Postnov, K. A. 2006, Astron. Lett., 32, 393
- Marks and Kroupa (2010) Marks, M., & Kroupa, P. 2010, MNRAS, 406, 2000
- Michie (1963) Michie, R. W. 1963, MNRAS, 125, 127
- Okada et al. (2007) Okada, Y., Kokubun, M., Yuasa, T., & Makishima, K. 2007, PASJ, 59, 727
- Pooley & Hut (2006) Pooley, D., & Hut, Piet. 2006, ApJ, 646, L143
- Pooley et al. (2003) Pooley, D., Lewin, W. H. G., Anderson, S. F., et al. 2003, ApJ, 591, L131
- Predehl & Schmitt (1995) Predehl, P., & Schmitt, J. H. M. M. 1995, A&A, 293, 889
- Pryor & Meylan (1993) Pryor, C., & Meylan, G. 1993, in ASP Conf. Ser. 50, Structure and Dynamics of Globular Clusters, ed. S. G. Djorgovski & G. Meylan (San Francisco: ASP), 357
- (32) Rybicki, G.B. & Lightman, A.L. 1979, ”Radiative Processes in Astrophysics”, New York: Wiley
- Tam et al. (2011) Tam, P. H. T., Kong, A. K. H., Hui, C. Y., et al. 2011, ApJ, 729, 90
- Venter & de Jager (2008) Venter, C., & de Jager, O. C. 2008, ApJ, 680, L125
- (35) Weaver, R., McCray, R. & Castor, J., 1977, ApJ, 218, 377
- (36) Wu, J. H. K., Hui, C. Y., Wu, E. M. H., Kong, A. K. H., Huang, R. H. H., Tam, P. H. T., Takata, J., & Cheng, K. S. 2013, ApJ, 765, L47
- Yuasa et al. (2009) Yuasa, T., Nakazawa, K., & Makishima, K. 2009, PASJ, 61, 1107