Unravelling Nanoconfined Films of Ionic Liquids
Abstract
The confinement of an ionic liquid between charged solid surfaces is treated using an exactly solvable 1D Coulomb gas model. The theory highlights the importance of two dimensionless parameters: the fugacity of the ionic liquid, and the electrostatic interaction energy of ions at closest approach, in determining how the disjoining pressure exerted on the walls depends on the geometrical confinement. Our theory reveals that thermodynamic fluctuations play a vital role in the “squeezing out” of charged layers as the confinement is increased. The model shows good qualitative agreement with previous experimental data, with all parameters independently estimated without fitting.
I Introduction
Room temperature ionic liquids are used in diverse fields ranging from solvents in chemical synthesis Welton (1999); Hallett and Welton (2011), to electrochemical supercapacitors Brandt et al. (2013) and lubricants Smith et al. (2013). The non-volatility and wide electrochemical window of stability of ionic liquids render them good candidate electrolytes for electrochemical and energy storage applications, especially in nanodevices where a large voltage is applied over small length-scales (for a recent review of ionic liquids at electrified interfaces, see Fedorov and Kornyshev (2014)). In nanotechnological applications, such as nanoporous supercapacitors and lubricants for microelectromechanical devices, ionic liquids are under severe geometric confinement between charged surfaces.
Previous studies focused on the effect of strong electrostatic correlations on the semi-infinite electrode-electrolyte interface. Experiments (e.g Alam et al. (2007a, b, 2008); Islam et al. (2008); Lockett et al. (2008)), theories (e.g Eigen and Wicke (1954); Borukhov et al. (1997, 2000)) and simulations (e.g Esnouf et al. (1988); Lamperski and Kłos (2008); Trulsson et al. (2010); Vatamanu et al. (2010); Fedorov et al. (2010); Hu et al. (2013), or a recent review Merlet et al. (2013) ) have shed light on the structure of bulk ionic liquids near charged surfaces. Those pioneering works revealed the effect of ion size in determining the interfacial capacitance, and established that there is a region of closely packed ions near a highly charged surface, followed by a gradual (potentially oscillatory) decay of ion density into the bulk.
Analysis of the long-distance asymptotics of the direct correlation function obtained by the Ornstein-Zernicke equation reveals Attard (1993); Leote de Carvalho and Evans (1994); Attard (1996) that the density-density and charge-charge correlation functions decay exponentially with or without an oscillatory component. Increasing the ion density (or chemical potential) at fixed temperature causes a crossover from exponential decay of both charge-charge and density-density correlation functions to oscillatory decay of the charge-charge correlation function. A further increase in density triggers the density-density correlations to decay in an oscillatory manner.
The oscillatory decay of charge-charge correlations can be rationalised as the result of a competition between the long-ranged ion-ion Coulomb interactions and the steric constraint of packing counterions around the central ion. This causes the ionic atmosphere near the ion to overcompensate the bare ion charge. Crossover from monotonic to oscillatory decay of the density-density correlation function is induced by increased steric correlation as the ion density increases, and is also reported in simple square-well fluids Fisher and Widom (1969); Evans et al. (1993). This is known in the context of single-component fluids as the Fisher-Widom transition. Experimentally X-ray reflectivity Mezger et al. (2008) and AFM Hayes et al. (2009) measurements showed an oscillatory decay of charge density away from a highly charged interface, which is corroborated by a recent analytical solution of a 1D lattice Coulomb gas model of ionic fluids Démery et al. (2012a, b).
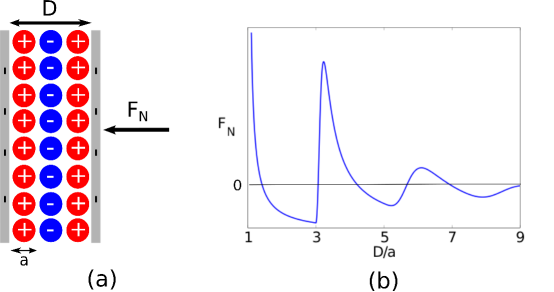
The behaviour and structure of severely confined ionic systems are more intricate. Recent surface force balance experiments by Perkin Perkin et al. (2010, 2011) demonstrated that the disjoining pressure across a nanometre-thick ionic liquid film confined between two (negatively charged) atomically flat mica surfaces increases in an oscillatory manner as the separation between surfaces decreases (see Figure 1 for schematic representation of these experiments and the typical results). The peaks in the disjoining pressure were ascribed qualitatively to squeezing out of layers of ions close to the interface with the position of the peak being an indicator of the ion radii. The position of first peak in those experiments corresponds roughy to the width of the ions, as would be expected on steric grounds. However, the subsequent peaks are much broader and are located further away from integer multiples of the ion radii. This suggests that one must move beyond a simple qualitative geometric description to understand the behaviour of a confined ionic liquid. In particular, how thermodynamic fluctuations and strong electrostatic correlations affect the disjoining pressure in systems under severe geometric confinement has not been elucidated theoretically. Here, we aim to fill this gap.
Although the pioneering work on semi-infinite electrode-electrolyte interface forms a basis for the general understanding of strongly correlated Coulomb systems, we stress that the oscillatory disjoining force observed in a geometrically confined ionic liquid has a very different physical origin, and should not be conflated with the oscillatory density-density and charge-charge correlation functions observed in the semi-infinite case. Rather, molecular layering of ions close to the charged surface, and the squeezing out of these molecular layers from the slit as the surface separation decreases are the crucial aspects of this intrinsically nanoscale phenomenon.
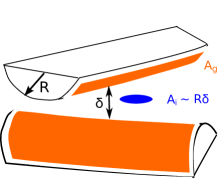
We develop a novel and exactly solvable theory of the disjoining pressure in a nanoconfined ionic liquid by considering the system as a 1D Coulomb gas with hard core repulsion. In experimentally relevant systems, the separation between the charged surfaces () is much smaller then the typical lateral lengthscale (). The highly charged surface promotes ordering of anions and cations into slabs, and motivates treating the system as an 1D collection of charged slabs rather than a 3D system.
Our model reproduces the full range of experimentally observed physical phenomenology, and unravels the key roles that the bulk chemical potential and strength of electrostatic interaction play in determining the disjoining pressure.
II The Model
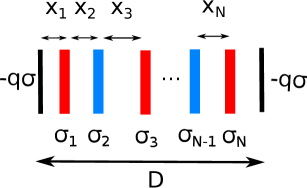
We consider a 1D system of hard slabs with width (physically corresponding to the ion diameter) and fixed charges . This system is confined between rigid charged surfaces with surface charge density each and coupled to a bath of bulk ionic liquid. To ensure overall electroneutrality, the sum of the total charge of the slabs must equal (see Figure 2). As such must be a half integer or integer — this technical restriction is due to neglecting fluctuations in the surface charge density.
We note that the thermodynamic properties of a 1D Coulomb gas without hard-core exclusion have been studied extensively in Lenard (1961); Edwards and Lenard (1962). Excluded volume effects have been accounted for by restricting ions to lie on a lattice Démery et al. (2012a, b). This lattice Coulomb gas model, whilst revealing important qualitative insights for the arrangement of ions, presents artefacts due to the discrete nature of the lattice. This is particularly prevalent in the strongly confined limit, where there are only a few lattice sites and treating the positions of each ion as a discrete variable has the rather unphysical consequence that the disjoining pressure is only defined for discrete surface separations. Here, we remove this restriction, considering instead a Coulomb gas in which the position of each slab is a continuous variable subject to a hard-core exclusion. 111Effectively 1D electrostatics also emerges in systems with large dielectric contrast, see Kamenev et al. (2006); Zhang et al. (2006)
In 1D, the dimensionless electrostatic interaction energy, , between 2 slabs separated by a distance takes the form
| (1) |
(see Ref Démery et al. (2012b)) where , and can take values , the lengthscales are non-dimensionalised with respect to the ion diameter , and the electrostatic parameter
| (2) |
is the ratio of electrostatic interaction energy at closest approach relative to the thermal energy , with the area of the slab, the dielectric constant of the medium, the permittivity of free space, and the fundamental charge.
We note that the 1D model assumes a regular and segregated arrangement of cations and anions in the direction perpendicular to the boundary. This is expected to hold when the surface is strongly charged and thus the ions closest to the surface form a densely packed cation layer, followed by a densely packed anion layer which is attracted to the cation layer, and so on. In addition, the assumption that the slabs have fixed charge relies on small surface separation, and thus the layers are still purely cations or anions.
The canonical partition function of cations and anions read
| (3) |
where the Kronecker delta function imposes global electroneutrality, denotes summing over all possible charge configurations and denotes the position of the charges with and being the positions of the charged surfaces which are fixed, and being the separation between the charged surfaces. The integral can be rewritten taking advantage of the fact that the slabs cannot overlap. By denoting the separation between the and slab by (see Figure 2), we have
| (4) |
In experimental configurations, the confined ionic liquid is in thermal equilibrium with the surrounding bulk fluid. As such, we transform the partition function in the Canonical Ensemble into the Grand Canonical ensemble to take into account fluctuations in the number of slabs — the fluctuations correspond physically to squeezing out of ion layers. Introducing the fugacity , which is assumed to the the same for cations and anions, the Grand Canonical partition function reads
| (5) |
The fugacity is a measure of the bulk cohesive energy — the larger the fugacity is, the more dense is the bulk ionic fluid.
The key physical quantity of practical interest is the disjoining pressure. This can be computed from the Grand Canonical partition function by noting that the free energy takes the form , and that the disjoining pressure is
| (6) |
Before illustrating the typical results of the model, we briefly discuss typical parameter values for ionic liquids in a surface force balance experiment. The electrostatic parameter depends on the pairwise interaction between ions located in adjacent slabs, and thus the lateral packing geometry in the slabs. The fact that viscous liquid-like behaviour is still observed for nanoconfined ionic liquid Bou-Malham and Bureau (2010) suggests that the electrostatic interaction is comparable to thermal energy, thus is expected to be order unity or less, and can be estimated using tribological measurements, as discussed later. The fugacity, on the other hand, is a bulk property of the ionic liquid, and is related to bulk density and affinity of the ionic liquid to the slit. As such, we will treat it as an effective parameter and provide estimates for it via interfacial tension in the section below.
III Like-Charged Interfaces
In surface force balance experiments, the film of ionic liquid is usually confined between atomically flat and negatively charged mica surfaces (e.g. Perkin et al. (2011); Smith et al. (2013)). The normal force measured in these experiments is oscillatory, and the period of the oscillation suggests that an odd number of layers is confined between surfaces. As such, we set , the ions overcompensate the surface charge of the interface.
Qualitative behaviour of the dependence of the pressure on the surface separation can be seen in the narrow separation limit. The partition function for narrow separations (), for which only one layer is allowed is
| (7) |
Thus for this one slab system, the pressure is simply
| (8) |
with the pressure scale. The first term in Equation (8) originates from the entropy of confinement, while the second term is due to electrostatic interactions between the slabs. Equation (8) shows that for small separations as the loss of translational entropy penalises confinement. However, for , the disjoining pressure is negative for intermediate separations when the effect of electrostatic correlations dominate the effect of confinement. An expression for the disjoining pressure similar to Equation (8) has been obtained via a systematic perturbative expansion of the full 3D, counterion only Coulomb gas in the limit of highly charged surfaces (strong-coupling electrostatics) Netz (2001); Naji et al. (2013). There, the partition function is dominated by single-particle contributions from the interaction between counterions and charged surfaces.
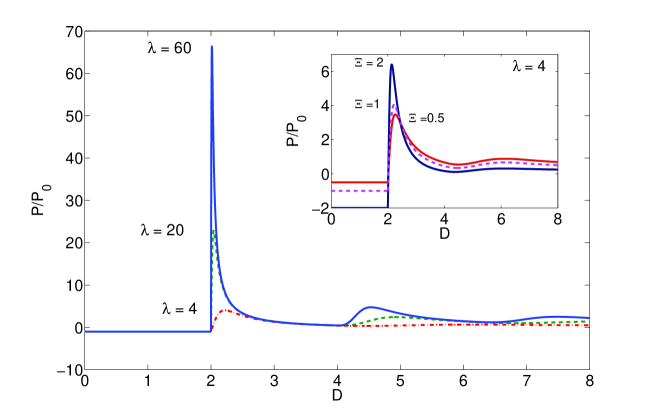
For larger slit widths, multiple layers of ions could be found in the slit. The partition function for the multiple layers of ions can be computed analytically by evaluating the integrals in Equation (4) via Mathematica. The resulting expressions are rather cumbersome and as such we do not include them here. Figure 3(a) shows a peak in disjoining pressure as two new layers enter the slit (we note that global electroneutrality requires layers to enter in positive-negative pairs). Note that the magnitude of the peaks decrease as the separation increases, reflecting the decreased thermodynamic driving force for adsorption when there are multiple layers of ions already present in the slit. The peaks are more pronounced for large fugacity as the ionic fluid favours a densely packed configuration, and thus would fill the slit as soon as the separation exceeds the minimum width at which it is geometrically possible to do so. However, for lower fugacities, the peaks are broader and shift away from the minimum separation dictated by geometry. As the separation increases they become less “periodic”. This suggests that directly relating the peaks in disjoining pressure measured from surface force balance experiments to ionic radii is too simplistic — thermodynamic fluctuations play an important role in the position of those peaks.
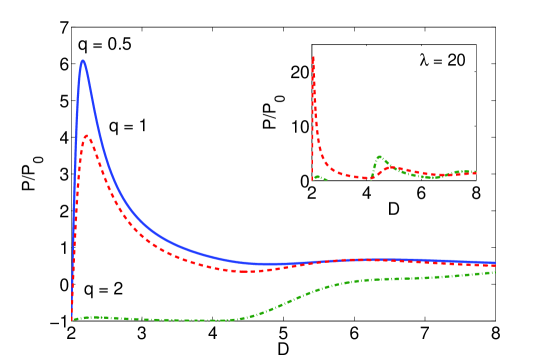
The effect of varying the electrostatic parameter is shown in Figure 3(b). The peak in disjoining pressure becomes more pronounced as decreases, and for large the pressure becomes negative, reflecting an attractive force. Physically, this attraction occurs because in the ground state configuration of alternating positive and negative charges, which is thermodynamically favourable for large , the Hamiltonian is identically regardless of the number of slabs. Thus thermal fluctuations are the sole driving force for the insertion of addition layers.
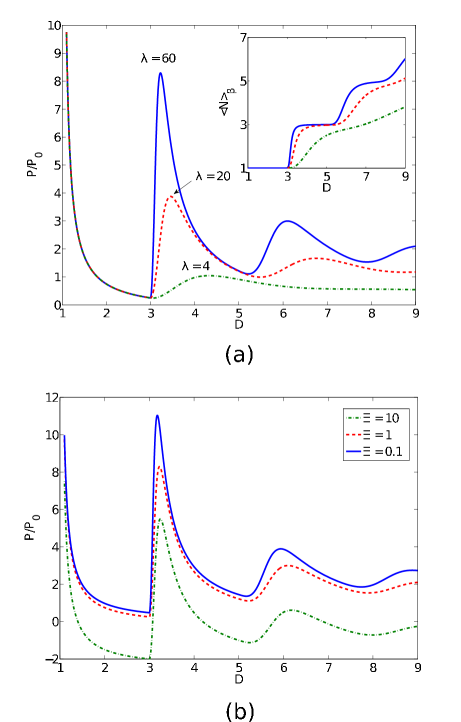
Figure 4 summarises the regime diagram for the system. Decreasing the fugacity shifts the first, most pronounced peak away from , the minimum separation for which it is geometrically possible to fit 3 layers, and the peak pressure increases concomitantly.
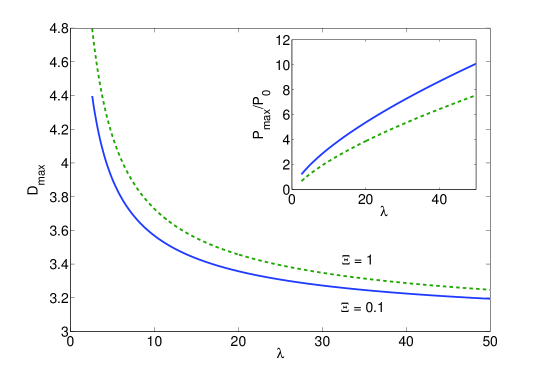
In the limit of large fugacity , the peak disjoining pressure may be approximated by the asymptotic expressions
| (9) |
The position of the first peak in disjoining pressure can also be found asymptotically to be
| (10) |
IV Comparison with Experiment
Figure 5 compares experimental data from Ref Perkin et al. (2011) on the ionic liquid with the predictions of the 1D model described here. The experiment is force controlled via a spring — as such, the experiment registers branches with the gradient of the force larger than the spring constant as attractive “jump in” or repulsive “jump-out”. This explained the qualitative difference between the theory and experiment.
We also want to estimate the typical size of the parameters and . Although the cation and anion have different dimensions, an estimate based on the energy-optimised structure (the dimensions of the ions are obtained from Ref Gebbie et al. (2013)) suggests that for the cation and for the anion. Thus, as a rough guide, we take the mean and assume . The fugacity can be estimated from ionic liquid-air interfacial tension measurements. The chemical potential is the change in energy when removing a molecule from the bulk, thus it is twice the energy of transferring one molecule from the bulk to the interface where half of the interactions are deprived, viz. , where is the area of a “head group”. Experimentally, Oliveira et al. (2012), Gebbie et al. (2013), thus and . We note that this estimate is likely to be a lower bound. Chemically the ionic liquid ion is anisotropic, and preferred interactions can be maintained even when the ion is transferred from the bulk to the liquid-air interface, by putting alkyl part outermost and charged group into the liquid.
Direct evaluation of the electrostatic parameter via Equation (2) is difficult as and are effective parameters that depend on the local arrangement of ions within a slab. However, the electrostatic parameter can be estimated with shear stress measurements. The yield force is the total force needed to “unlock” the slabs and slide them pass each other, whereas the static friction force gives an estimate of the contribution due to geometric incommensurability between the slabs and viscous dissipation. Therefore difference between the yield force and the static friction force, , gives the typical force scale required to overcome the Coulomb attraction and slide the layers past each other for a typical slip distance . Thus the typical macroscopic Coulomb interactions between the slabs is approximately . The corresponding microscopic interaction energy scale differs by a factor of , where is the geometric area of the plates and is the interaction area, which is less than the geometric area due to the finite radius of curvature of the system (see Figure 6 for a schematic drawing). We use the estimate where is the radius of curvature and is the typical surface separation, here taken as 1 nm. The typical slip length for confined between mica surface is and the typical force Smith et al. (2013), thus we have .
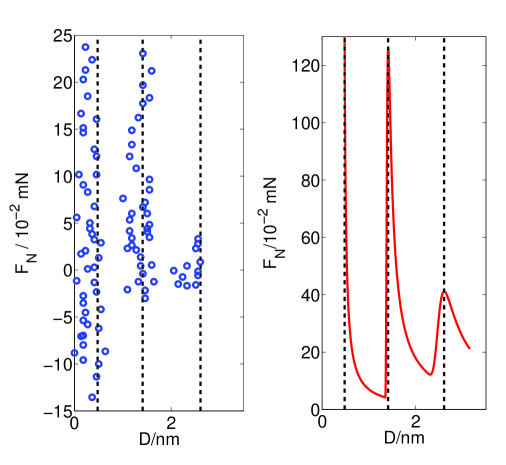
We note that the theory shows only the electrostatic contribution to the normal force — experimentally van der Waals interaction and the bulk pressure are important contributions. However, the only oscillatory component of the normal force is the electrostatic interaction, thus the qualitative alignment of the peaks predicted by the theory and observed in experiment is an important justification of the theory. In addition both van der Waals and bulk pressure are attractive forces, explaining the fact that the electrostatic component of the force is more positive (repulsive) than the experimentally measured force.
V Oppositely-Charged Surfaces
Similar considerations apply to ionic fluid confined between oppositely charged surfaces, with surface charge . The Coulomb gas model developed above can readily be applied. Figure 7 shows that the pressure is negative for small separations, corresponding to attractive interaction between the surfaces when the ions cannot effectively screen the surface charge. As in the case for like-charged surfaces, the adsorption transitions (and hence the maxima in disjoining pressure), become more pronounced as the fugacity of the ionic fluid increases.
However, contrary to like-charged surfaces, the maxima in the disjoining pressure increases as the electrostatic parameter increases (see inset of Figure 7). Consider for simplicity the case of , in which the Hamiltonian for the ground state configuration of alternating positive and negative charges reads , where is the separation between the ion layers. As the Hamiltonian is linear in , the extrema of the Hamiltonian are reached at the boundaries of allowed , viz. (corresponding to layers separated by the hard sphere diameter), and (corresponding to layers located at the distance of closest approach to the charged surface). For the minimum is attained at , and ions are forced close to the surface, creating a “cavity” at the centre which promotes abrupt adsorption of another layer of ions when the slit separation geometrically allows it. This is in direct contrast to the case of like-charged interfaces, where the combined electrostatic attraction of a layer to both surfaces pushes ions to the centre of the slit.
The qualitative behaviour of the disjoining pressure is also dependent on , the ratio between the surface charge on the charged surface and the charge on the slabs. Figure 8 show that the peak disjoining pressure is low for overcharged surface (), as the strong electrostatic attraction between the surfaces is not effectively screened by the intervening ions, and the thermodynamic driving force for ion entry is overwhelmed by attraction between the surfaces. For overcharged surfaces the first peak in the disjoining pressure can be lower than subsequent peaks, whereby more ions have entered the system to screen the interaction between the surfaces.
In the limit of small electrostatic parameter , the position of the first peak is given by
| (11) |
Thus increasing surface charge shifts the peak to larger separations, as the surface-surface attraction favours small surface separation (note that when , the first peak is located outside of the range ).
We note that in this 1D model is an effective parameter — physically it depends on the electrostatic interactions within a slab which is averaged out in this model. Experimentally for large monovalent ions and highly charged surfaces, surface charge cannot be completely neutralised even when the layers are laterally closed packed, thus . On the other hand, for small ions or sparingly charged surfaces, ions can arrange themselves to form layers that completely neutralise or even overcompensate the surface charge, thus . Therefore the qualitative form of the disjoining pressure is an effective way to interrogate not only the layered organisation of ions in the direction perpendicular to the surface, but also the lateral structure within the layer in the direction parallel to the surface.
VI Conclusion
We have considered the equilibrium properties of an ionic liquid confined between charged surfaces using a 1D Coulomb gas model. The theory reveals the roles of all physical parameters, but most importantly they group themselves into two dimensionless parameters: the fugacity of the bulk fluid and the electrostatic parameter . These two parameters have clear constituents, and can be independently measured or estimated.
The model shows that the disjoining pressure decays in an oscillatory manner with the separation between surfaces, with the maxima corresponding to entering of discrete “layers” of ions, and the peaks in disjoining pressure becoming more pronounced as the fugacity increases. For like-charged surfaces, the peak disjoining pressure decreases with increasing electrostatic parameter as the ground state Hamiltonian is independent of the number of layers in-between the surfaces. The theory is in good qualitative agreement with experimental data on confined between mica surfaces, with all parameters independently estimated without fitting.
For oppositely charged surfaces, the theory predicts that increasing the electrostatic parameter increases the peak disjoining pressure. Ions are pulled close to the charged surfaces, creating a “cavity” at the centre of the slit that allows adsorption of ions from the bulk. The electrostatic parameter can be varied by altering the effective ion radius and the charge on the ionic liquid ions. Experimental studies with atomically flat, oppositely charged surfaces are currently scarce. We hope that our model will motivate further experimental and computational studies.
Acknowledgements.
We thank J S Wettlaufer for insightful discussions. This work is supported by an EPSRC Research Studentship to AAL.References
- Welton (1999) T. Welton, Chemical Reviews 99, 2071 (1999).
- Hallett and Welton (2011) J. P. Hallett and T. Welton, Chemical Reviews 111, 3508 (2011).
- Brandt et al. (2013) A. Brandt, S. Pohlmann, A. Varzi, A. Balducci, and S. Passerini, MRS bulletin 38, 554 (2013).
- Smith et al. (2013) A. M. Smith, K. R. Lovelock, N. N. Gosvami, T. Welton, and S. Perkin, Physical Chemistry Chemical Physics 15, 15317 (2013).
- Fedorov and Kornyshev (2014) M. V. Fedorov and A. A. Kornyshev, Chemical Reviews 114, 2978 (2014).
- Alam et al. (2007a) M. T. Alam, M. Islam, T. Okajima, T. Ohsaka, et al., Electrochemistry Communications 9, 2370 (2007a).
- Alam et al. (2007b) M. T. Alam, M. M. Islam, T. Okajima, and T. Ohsaka, The Journal of Physical Chemistry C 111, 18326 (2007b).
- Alam et al. (2008) M. T. Alam, M. M. Islam, T. Okajima, and T. Ohsaka, The Journal of Physical Chemistry C 112, 16600 (2008).
- Islam et al. (2008) M. M. Islam, M. T. Alam, and T. Ohsaka, The Journal of Physical Chemistry C 112, 16568 (2008).
- Lockett et al. (2008) V. Lockett, R. Sedev, J. Ralston, M. Horne, and T. Rodopoulos, The Journal of Physical Chemistry C 112, 7486 (2008).
- Eigen and Wicke (1954) M. Eigen and E. Wicke, The Journal of Physical Chemistry 58, 702 (1954).
- Borukhov et al. (1997) I. Borukhov, D. Andelman, and H. Orland, Physical Review Letters 79, 435 (1997).
- Borukhov et al. (2000) I. Borukhov, D. Andelman, and H. Orland, Electrochimica Acta 46, 221 (2000).
- Esnouf et al. (1988) R. Esnouf, A. Smith, and P. Grout, Philosophical Magazine A 58, 27 (1988).
- Lamperski and Kłos (2008) S. Lamperski and J. Kłos, The Journal of chemical physics 129, 164503 (2008).
- Trulsson et al. (2010) M. Trulsson, J. Algotsson, J. Forsman, and C. E. Woodward, The Journal of Physical Chemistry Letters 1, 1191 (2010).
- Vatamanu et al. (2010) J. Vatamanu, O. Borodin, and G. D. Smith, Journal of the American Chemical Society 132, 14825 (2010).
- Fedorov et al. (2010) M. V. Fedorov, N. Georgi, and A. A. Kornyshev, Electrochemistry Communications 12, 296 (2010).
- Hu et al. (2013) Z. Hu, J. Vatamanu, O. Borodin, and D. Bedrov, Physical Chemistry Chemical Physics 15, 14234 (2013).
- Merlet et al. (2013) C. Merlet, B. Rotenberg, P. A. Madden, and M. Salanne, Physical Chemistry Chemical Physics 15, 15781 (2013).
- Attard (1993) P. Attard, Physical Review E 48, 3604 (1993).
- Leote de Carvalho and Evans (1994) R. Leote de Carvalho and R. Evans, Molecular Physics 83, 619 (1994).
- Attard (1996) P. Attard, Advances in Chemical Physics 92, 1 (1996).
- Fisher and Widom (1969) M. E. Fisher and B. Widom, The Journal of Chemical Physics 50, 3756 (1969).
- Evans et al. (1993) R. Evans, J. Henderson, D. Hoyle, A. Parry, and Z. Sabeur, Molecular Physics 80, 755 (1993).
- Mezger et al. (2008) M. Mezger, H. Schröder, H. Reichert, S. Schramm, J. S. Okasinski, S. Schöder, V. Honkimäki, M. Deutsch, B. M. Ocko, J. Ralston, et al., Science 322, 424 (2008).
- Hayes et al. (2009) R. Hayes, S. Z. El Abedin, and R. Atkin, The Journal of Physical Chemistry B 113, 7049 (2009).
- Démery et al. (2012a) V. Démery, D. S. Dean, T. C. Hammant, R. R. Horgan, and R. Podgornik, Europhysics Letters 97, 28004 (2012a).
- Démery et al. (2012b) V. Démery, D. S. Dean, T. C. Hammant, R. R. Horgan, and R. Podgornik, The Journal of Chemical Physics 137, 064901 (2012b).
- Perkin et al. (2010) S. Perkin, T. Albrecht, and J. Klein, Physical Chemistry Chemical Physics 12, 1243 (2010).
- Perkin et al. (2011) S. Perkin, L. Crowhurst, H. Niedermeyer, T. Welton, A. M. Smith, and N. N. Gosvami, Chemical Communications 47, 6572 (2011).
- Lenard (1961) A. Lenard, Journal of Mathematical Physics 2, 682 (1961).
- Edwards and Lenard (1962) S. Edwards and A. Lenard, Journal of Mathematical Physics 3, 778 (1962).
- Bou-Malham and Bureau (2010) I. Bou-Malham and L. Bureau, Soft Matter 6, 4062 (2010).
- Netz (2001) R. Netz, The European Physical Journal E 5, 557 (2001).
- Naji et al. (2013) A. Naji, M. Kanduč, J. Forsman, and R. Podgornik, The Journal of chemical physics 139, 150901 (2013).
- Gebbie et al. (2013) M. A. Gebbie, M. Valtiner, X. Banquy, E. T. Fox, W. A. Henderson, and J. N. Israelachvili, Proceedings of the National Academy of Sciences 110, 9674 (2013).
- Oliveira et al. (2012) M. Oliveira, M. Domínguez-Pérez, M. Freire, F. Llovell, O. Cabeza, J. Lopes-da Silva, L. Vega, and J. Coutinho, The Journal of Physical Chemistry B 116, 12133 (2012).
- Kamenev et al. (2006) A. Kamenev, J. Zhang, A. Larkin, and B. Shklovskii, Physica A: Statistical Mechanics and its Applications 359, 129 (2006).
- Zhang et al. (2006) J. Zhang, A. Kamenev, and B. Shklovskii, Physical Review E 73, 051205 (2006).