IceCube Collaboration
Observation of High-Energy Astrophysical Neutrinos in Three Years of IceCube Data
Abstract
A search for high-energy neutrinos interacting within the IceCube detector between 2010 and 2012 provided the first evidence for a high-energy neutrino flux of extraterrestrial origin. Results from an analysis using the same methods with a third year (2012-2013) of data from the complete IceCube detector are consistent with the previously reported astrophysical flux in the 100 TeV - PeV range at the level of per flavor and reject a purely atmospheric explanation for the combined 3-year data at . The data are consistent with expectations for equal fluxes of all three neutrino flavors and with isotropic arrival directions, suggesting either numerous or spatially extended sources. The three-year data set, with a livetime of 988 days, contains a total of 37 neutrino candidate events with deposited energies ranging from 30 to 2000 TeV. The 2000 TeV event is the highest-energy neutrino interaction ever observed.
High energy neutrinos are expected to be produced in astrophysical objects by the decays of charged pions made in cosmic ray interactions with radiation or gas Margolis et al. (1978); Stecker (1979); Biermann (1989); Michalak et al. (1990). As these pions decay, they produce neutrinos with typical energies of 5% those of the cosmic ray nucleons Mücke et al. (2000); Kelner et al. (2006). These neutrinos can travel long distances undisturbed by either the absorption experienced by high-energy photons or the magnetic deflection experienced by charged particles, making them a unique tracer of cosmic ray acceleration.
Observations since 2008 using the Antarctic gigaton IceCube detector Abbasi et al. (2009) while it was under construction provided several indications of such neutrinos in a variety of channels Aartsen et al. (2014a, b, 2013a). Two years of data from the full detector, from May 2010 - May 2012, then provided the first strong evidence for the detection of these astrophysical neutrinos Aartsen et al. (2013b) using an all-flavor all-direction sample of neutrinos interacting within the detector volume. This analysis focused on neutrinos above 100 TeV, at which the expected atmospheric neutrino background falls to the level of one event per year, allowing any harder astrophysical flux to be seen clearly. Here, following the same techniques, we add a third year of data supporting this result and begin to probe the properties of the observed astrophysical neutrino flux.
Neutrinos are detected in IceCube by observing the Cherenkov light produced in ice by charged particles created when neutrinos interact. These particles generally travel distances too small to be resolved individually and the particle shower is observed only in aggregate. In charged-current (CC) interactions, however, as well as a minority of CC, a high-energy muon is produced that leaves a visible track (unless produced on the detector boundary heading outward). Although deposited energy resolution is similar for all events, angular resolution for events containing visible muon tracks is much better (, 50% CL) than for those that do not (, 50% CL) Aartsen et al. (2014c). For equal neutrino fluxes of all flavors (1:1:1), CC events make up only 20% of interactions Beacom and Candia (2004).
Backgrounds to astrophysical neutrino detection arise entirely from cosmic ray air showers. Muons produced by and decays above IceCube enter the detector at 2.8 kHz. Neutrinos produced in the same interactions Gaisser et al. (1983); Gonzalez-Garcia et al. (2006); Lipari et al. (2007); Fedynitch et al. (2012) enter IceCube from above and below, and are seen at a much lower rate due to the low neutrino interaction cross-section. Because and mesons decay overwhelmingly to muons rather than electrons, these neutrinos are predominantly and usually have track-type topologies in the detector Beacom and Candia (2004). As the parent meson’s energy rises, its lifetime increases, making it increasingly likely to interact before decaying. Both the atmospheric muon and neutrino fluxes thus become suppressed at high energy, with a spectrum one power steeper than the primary cosmic rays that produced them Honda et al. (2007). At energies above TeV, an analogous flux of muons and neutrinos from the decay of charmed mesons is expected to dominate, as the shorter lifetime of these particles allows this flux to avoid suppression from interaction before decay Berezinsky et al. (1978); Volkova (1983, 1999); Gelmini et al. (2000); Martin et al. (2003); Enberg et al. (2008); Reno (2013). This flux has not yet been observed, however, and both its overall rate and cross-over energy with the flux are at present poorly constrained Gaisser (2013). As before Aartsen et al. (2013b), we estimate all atmospheric neutrino background rates using measurements of the northern-hemisphere spectrum Aartsen et al. (2014b).
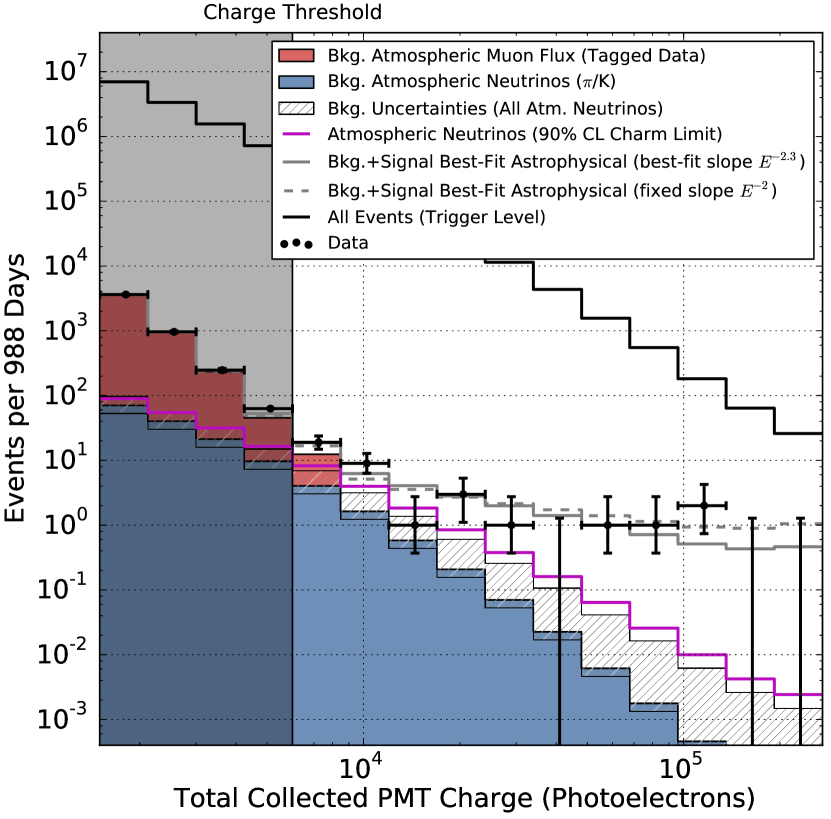
Event selection identifies neutrino interactions in IceCube by rejecting those events with Cherenkov-radiating particles, principally cosmic ray muons, entering from outside the detector. As before, we used a simple anticoincidence muon veto in the outer layers of the detector Aartsen et al. (2013b), requiring that fewer than 3 of the first 250 detected photoelectrons (PE) be on the detector boundary. To ensure sufficient numbers of photons to reliably trigger this veto, we additionally required at least 6000 PE overall, corresponding to deposited energies of approximately 30 TeV. This rejects all but one part in of the cosmic ray muon background above 6000 PE while providing a direction and topology-neutral neutrino sample Aartsen et al. (2013b). We use a data-driven method to estimate this background by using one region of IceCube to tag muons and then measuring their detection rate in a separate layer of PMTs equivalent to our veto; this predicts a total muon background in three years of events. Rejection of events containing entering muons also significantly reduces downgoing atmospheric neutrinos (the southern hemisphere) by detecting and vetoing muons produced in the neutrinos’ parent air showers Schönert et al. (2009); Gaisser et al. (2014). This southern-hemisphere suppression is a distinctive and generic feature of any neutrinos originating in cosmic ray interactions in the atmosphere.

In the full 988-day sample, we detected 37 events (Fig. 1) with these characteristics relative to an expected background of cosmic ray muon events and atmospheric neutrinos. Nine were observed in the third year. One of these (event 32) was produced by a coincident pair of background muons from unrelated air showers. This event cannot be reconstructed with a single direction and energy and is excluded from the remainder of this article where these quantities are required. This event, like event 28, had sub-threshold early hits in the IceTop surface array and our veto region, and is likely part of the expected muon background. Three additional downgoing track events are ambiguous; the remainder are uniformly distributed through the detector and appear to be neutrino interactions.
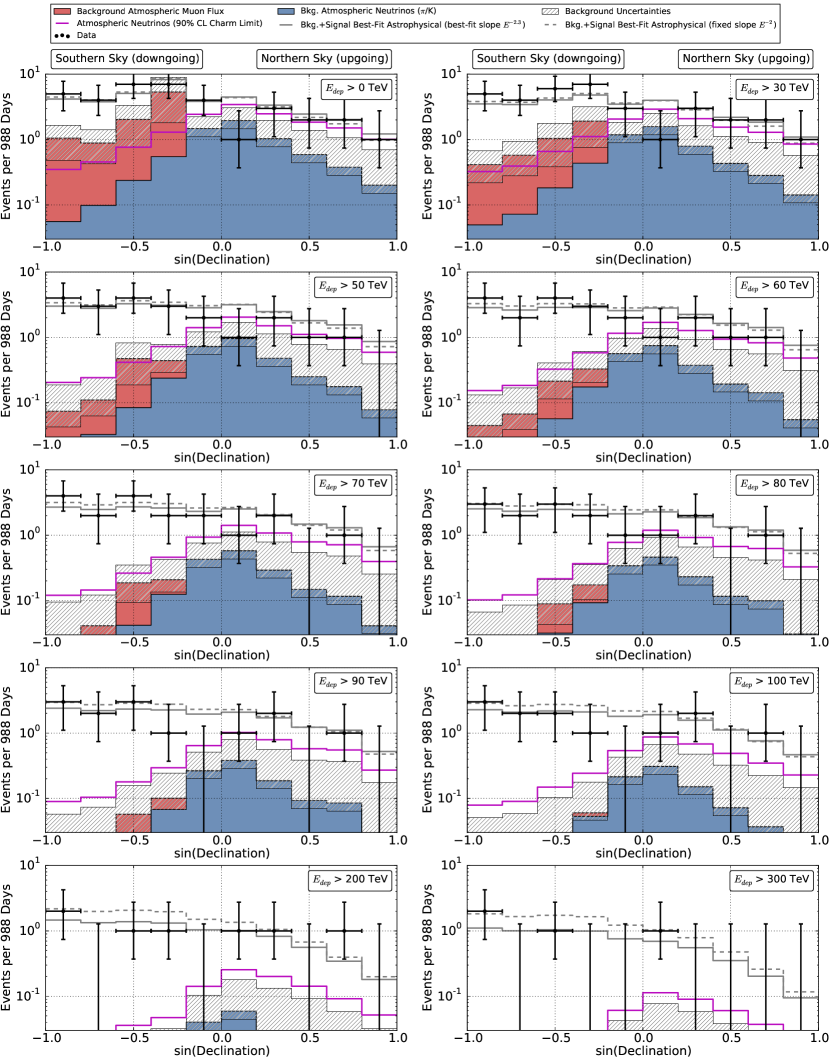
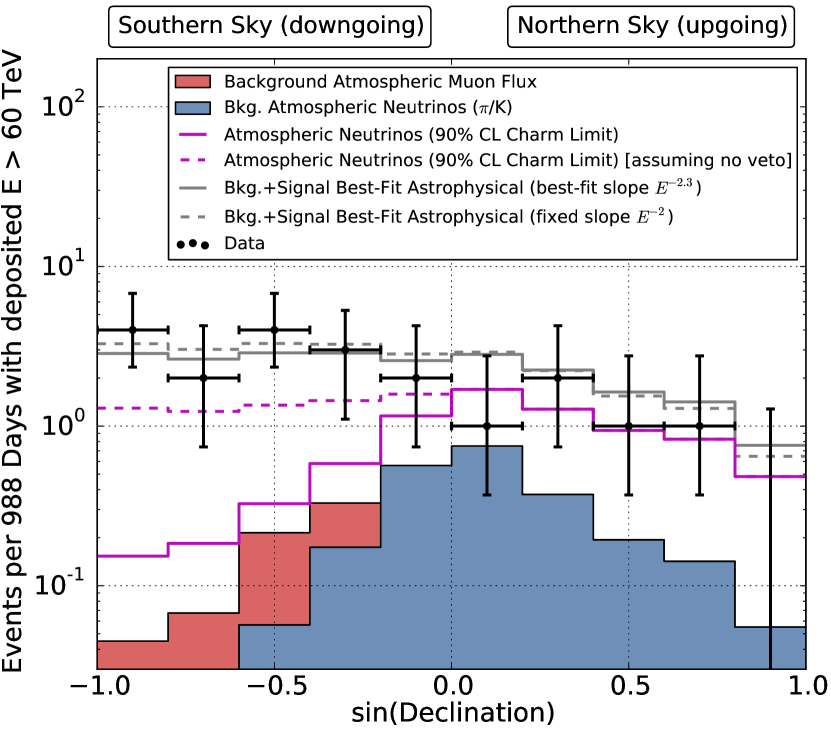
A purely atmospheric explanation for these events is strongly disfavored by their properties. The observed deposited energy distribution extends to much higher energies (above 2 PeV, Fig. 2) than expected from the atmospheric neutrino background, which has been measured up to 100 TeV Aartsen et al. (2014b). While a harder spectrum is expected from atmospheric neutrinos produced in charmed meson decay, this possibility is constrained by the observed angular distribution. Although such neutrinos are produced isotropically, approximately half Schönert et al. (2009); Gaisser et al. (2014) of those in the southern hemisphere are produced with muons of high enough energy to reach IceCube and trigger our muon veto. This results in a southern hemisphere charm rate 50% smaller than the northern hemisphere rate, with larger ratios near the poles. Our data show no evidence of such a suppression, which is expected at some level from any atmospheric source of neutrinos (Fig. 3).
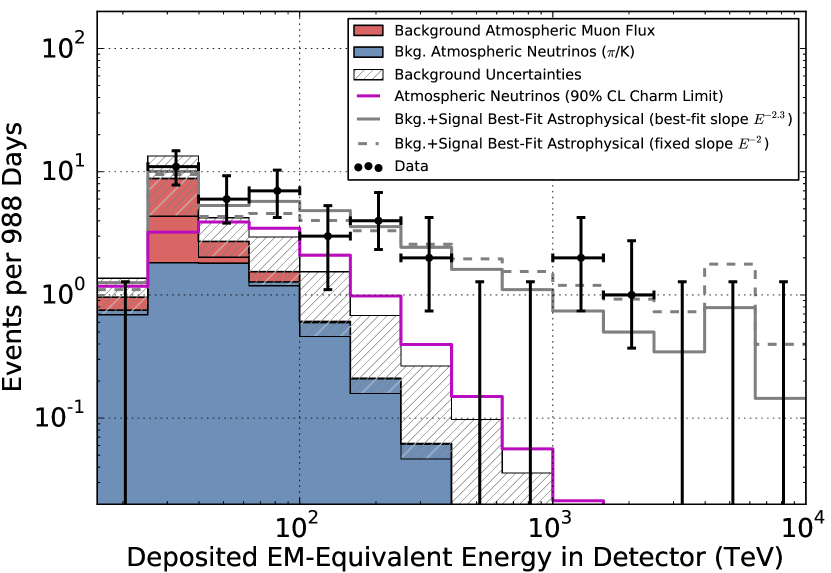
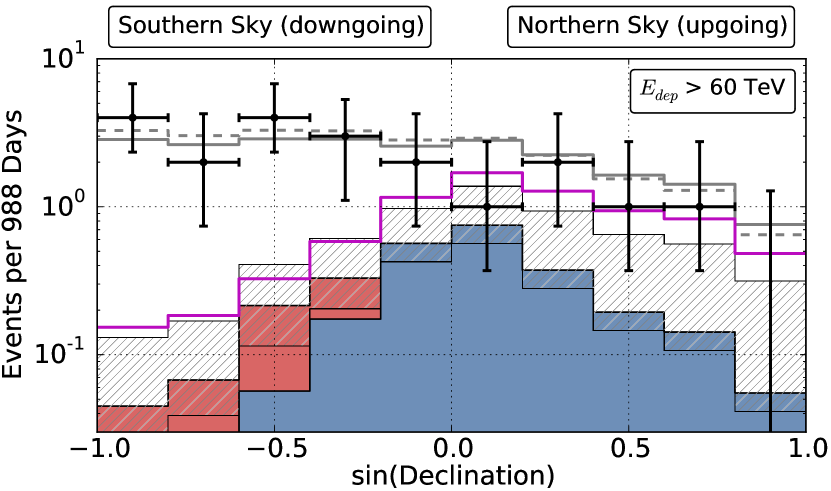
As in Aartsen et al. (2013b), we quantify these arguments using a likelihood fit in arrival angle and deposited energy to a combination of background muons, atmospheric neutrinos from decay, atmospheric neutrinos from charmed meson decay, and an isotropic 1:1:1 astrophysical test flux, as expected from charged pion decays in cosmic ray accelerators Gaisser et al. (1995); Learned and Mannheim (2000); Halzen and Hooper (2002); Becker (2008). The fit included all events with . The expected muon background in this range is below 1 event in the 3-year sample, minimizing imprecisions in modeling the muon background and threshold region. The normalizations of all background and signal neutrino fluxes were left free in the fit, without reference to uncertainties from Aartsen et al. (2014b), for maximal robustness. The penetrating muon background was constrained with a Gaussian prior reflecting our veto efficiency measurement. We obtain a best-fit per-flavor astrophysical flux () in this energy range of and background normalizations within the expected ranges. Quoted errors are uncertainties from a profile likelihood scan. This model describes the data well, with both the energy spectrum (Fig. 2) and arrival directions (Fig. 3) of the events consistent with expectations for an origin in a hard isotropic 1:1:1 neutrino flux. The best-fit atmospheric-only alternative model, however, would require a charm normalization 3.6 times higher than our current 90% CL upper limit from the northern hemisphere spectrum Aartsen et al. (2014b). Even this extreme scenario is disfavored by the energy and angular distributions of the events at using a likelihood ratio test.
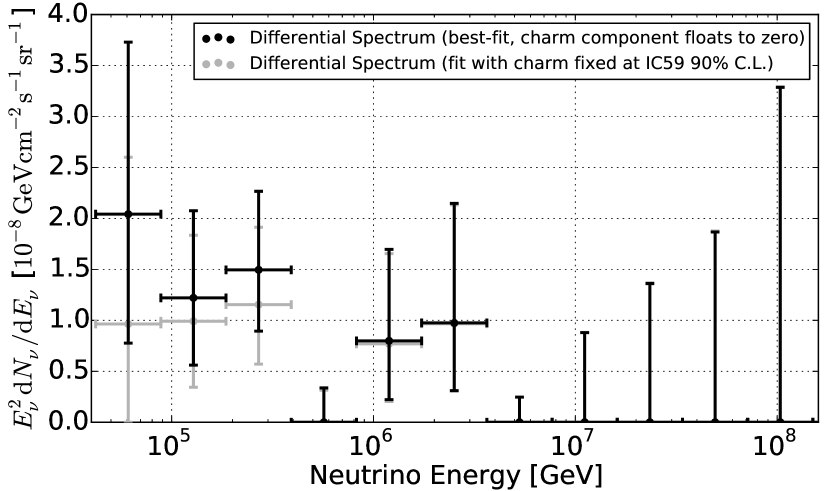
Fig. 4 shows a fit using a more general model in which the astrophysical flux is parametrized as a piecewise function of energy rather than a continuous unbroken power law. As before, we assume a 1:1:1 flavor ratio and isotropy. While the reconstructed spectrum is compatible with our earlier ansatz, an unbroken flux at our best-fit level predicts 3.1 additional events above 2 PeV (a higher energy search Aartsen et al. (2013a) also saw none). This may indicate, along with the slight excess in lower energy bins, either a softer spectrum or a cutoff at high energies. Correlated systematic uncertainties in the first few points in the reconstructed spectrum (Fig. 4) arise from the poorly constrained level of the charm atmospheric neutrino background. The presence of this softer () component would decrease the non-atmospheric excess at low energies, hardening the spectrum of the remaining data. The corresponding range of best fit astrophysical slopes within our current 90% confidence band on the charm flux Aartsen et al. (2014b) is to . As the best-fit charm flux is zero, the best-fit astrophysical spectrum is on the lower boundary of this interval at (solid line, Figs. 2, 3) with a total statistical and systematic uncertainty of .
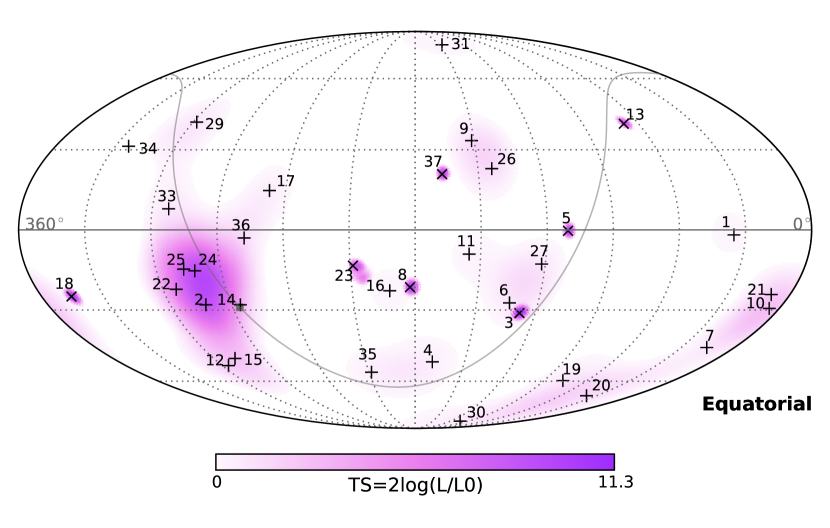
To identify any bright neutrino sources in the data, we employed the same maximum-likelihood clustering search as before Aartsen et al. (2013b), as well as searched for directional correlations with TeV gamma-ray sources. For all tests, the test statistic (TS) is defined as the logarithm of the ratio between the best-fit likelihood including a point source component and the likelihood for the null hypothesis, an isotropic distribution Braun et al. (2008). We determined the significance of any excess by comparing to maps scrambled in right ascension, in which our polar detector has uniform exposure.
As in Aartsen et al. (2013b), the clustering analysis was run twice, first with the entire event sample, after removing the two events (28 and 32) with strong evidence of a cosmic-ray origin, and second with only the 28 shower events. This controls for bias in the likelihood fit toward the positions of single well-resolved muon tracks. We also conducted an additional test in which we marginalize the likelihood over a uniform prior on the position of the hypothetical point source. This reduces the bias introduced by muons, allowing track and shower events to be used together, and improves sensitivity to multiple sources by considering the entire sky rather than the single best point.
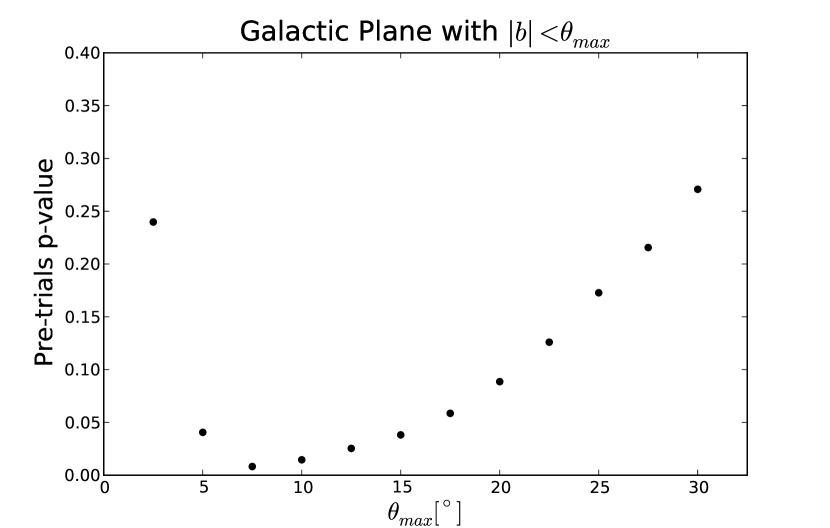
Three tests were performed to search for neutrinos correlated with known gamma-ray sources, also using track and shower events together. The first two searched for clustering along the galactic plane, with a fixed width of , based on TeV gamma-ray measurements Abdo et al. (2008), and with a free width of between and . The last searched for correlation between neutrino events and a pre-defined catalog of potential point sources (a combination of the usual IceCube Aartsen et al. (2013c) and ANTARES Adrián-Martínez et al. (2012) lists; see online supplement sup ). For the catalog search, the TS value was evaluated at each source location, and the post-trials significance calculated by comparing the highest observed value in each hemisphere to results from performing the analysis on scrambled datasets.
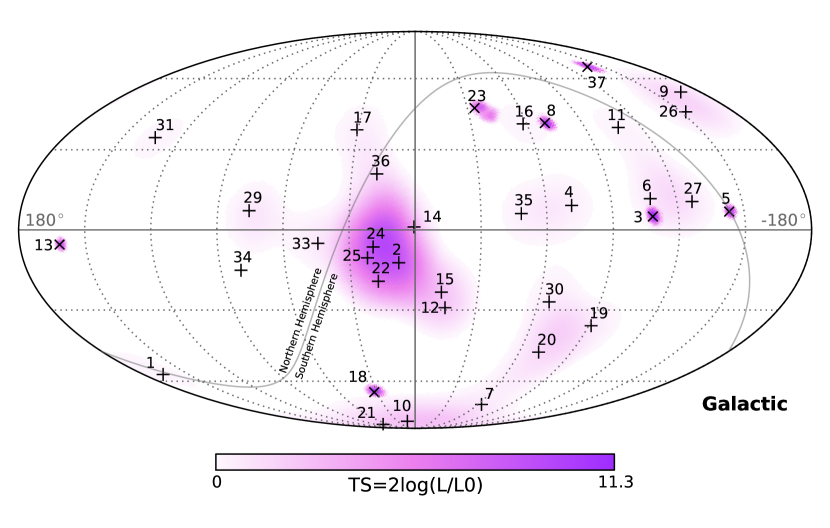
No hypothesis test yielded statistically significant evidence of clustering or correlations. For the all-sky clustering test (Fig. 5), scrambled datasets produced locations with equal or greater TS 84% and 7.2% of the time for all events and for shower-like events only. As in the two-year data set, the strongest clustering was near the galactic center. Other neutrino observations of this location give no evidence for a source Adrián-Martínez et al. (2014), however, and no new events were strongly correlated with this region. When using the marginalized likelihood, a test statistic greater than or equal to the observed value was found in 28% of scrambled datasets. The source list yielded p-values for the northern and southern hemispheres of 28% and 8%, respectively. Correlation with the galactic plane was also not significant: when letting the width float freely, the best fit was with a post-trials chance probability of 2.8%, while a fixed width of returned a p-value of 24%. A repeat of the time clustering search from Aartsen et al. (2013b) also found no evidence for structure.
With or without a possible galactic contribution Supanitsky (2014); Ahlers and Murase (2013), the high galactic latitudes of many of the highest-energy events (Fig. 5) suggest at least some extragalactic component. Exception may be made for local large diffuse sources (e.g. the Fermi bubbles Lunardini et al. (2013) or the galactic halo Bai et al. (2013); Taylor et al. (2014)), but these models typically can explain at most a fraction of the data. If our data arise from an extragalactic flux produced by many isotropically distributed point sources, we can compare our all-sky flux with existing point-source limits. By exploiting the additional effective volume provided by use of uncontained events, previous point-source studies would have been sensitive to a northern sky point source producing more than 1-10% of our best-fit flux, depending on declination and energy spectrum Aartsen et al. (2013). The lack of any evidence for such sources from these studies, as well as the wide distribution of our events, thus lends support to an interpretation in terms of many individually dim sources. Some contribution from a few comparatively bright sources cannot be ruled out, however, especially in the southern hemisphere, where the sensitivity of IceCube to point sources in uncontained is reduced by the large muon background and small target mass above the detector.
The neutrino spectrum (Fig. 4) can also be used to constrain source properties. In almost all candidate sources Stecker et al. (1991); Kalashev et al. (2013); Atoyan and Dermer (2004); Alvarez-Muñiz and Mészáros (2004); Nellen et al. (1993); Mannheim (1995); Stecker and Salamon (1996); Rachen and Mészáros (1998); Mészáros and Waxman (2001); Mücke et al. (2003); Becker et al. (2005); Stecker (2005); Eichmann et al. (2012); Waxman and Bahcall (1997); Guetta et al. (2004); Baerwald et al. (2014); Winter et al. (2014); Waxman and Bahcall (2000); Razzaque et al. (2003); Becker et al. (2006); Murase and Nagataki (2006); Loeb and Waxman (2006); Murase et al. (2013); Yoast-Hull et al. (2014); Thompson et al. (2007), neutrinos would be produced by the interaction of cosmic rays with either radiation or gas. Interactions with radiation () typically produce a peaked spectrum, reflecting the energy spectrum of the photons; those with gas () produce a smooth power law Mücke et al. (2000); Kelner et al. (2006). While models satisfactorily explain some aspects of the data such as the possible drop-off at high energies, many involve a central plateau smaller than our observed energy range, placing them in weak tension with the data. As an example, the AGN spectrum in Stecker et al. (1991) peaks at several PeV with much lower predictions at 100 TeV; thus, while able to explain the highest energy events, it fits poorly at lower energies and is disfavored as the sole source at the level with respect to our simple test flux. Gamma-ray burst models such as Waxman and Bahcall (1997); Guetta et al. (2004) have energy ranges better aligned with our data, with central plateaus from around 100 TeV to a few PeV, although existing limits from searches for correlations with observed GRBs are more than an order of magnitude below the observed flux Abbasi et al. (2012). Cosmic ray interactions with gas, such as predicted around supernova remnants in our and other galaxies, particularly those with high star-forming rates, produce smooth spectra with slopes reflecting post-diffusion cosmic rays (e.g. in Loeb and Waxman (2006)) and seem to describe the data well. Large uncertainties on both the measured neutrino spectrum and all models prevent any conclusions, however.
The best-fit flux level in our central energy range ( per flavor) is similar to the Waxman-Bahcall bound Waxman and Bahcall (1999), the aggregate neutrino flux from charged pion decay in all extragalactic cosmic ray accelerators if they are optically thin. This bound is derived from the cosmic ray spectrum above eV (1000 PeV). Our neutrinos, however, are likely associated with protons at much lower energies, on the order of 1 to 10 PeV Mücke et al. (2000); Kelner et al. (2006), at which the bound may be quite different Mannheim et al. (2001). Along with large uncertainties in the neutrino spectrum (Fig. 4), this makes correspondence with the Waxman-Bahcall bound, or eV cosmic ray sources, unclear.
Further observations with the present or upgraded IceCube detector and the planned KM3NeT Bagley et al. (2011) telescope are required to answer many questions about the sources of this astrophysical flux Laha et al. (2013). Gamma-ray, optical, and X-ray observations of the directions of individual high-energy neutrinos, which point directly to their origins, may also be able to identify these sources even for those with neutrino luminosities too low for identification from neutrino measurements alone.
Acknowledgements.
We acknowledge support from the following agencies: U.S. National Science Foundation-Office of Polar Programs, U.S. National Science Foundation-Physics Division, University of Wisconsin Alumni Research Foundation, the Grid Laboratory Of Wisconsin (GLOW) grid infrastructure at the University of Wisconsin - Madison, the Open Science Grid (OSG) grid infrastructure; U.S. Department of Energy, and National Energy Research Scientific Computing Center, the Louisiana Optical Network Initiative (LONI) grid computing resources; Natural Sciences and Engineering Research Council of Canada, WestGrid and Compute/Calcul Canada; Swedish Research Council, Swedish Polar Research Secretariat, Swedish National Infrastructure for Computing (SNIC), and Knut and Alice Wallenberg Foundation, Sweden; German Ministry for Education and Research (BMBF), Deutsche Forschungsgemeinschaft (DFG), Helmholtz Alliance for Astroparticle Physics (HAP), Research Department of Plasmas with Complex Interactions (Bochum), Germany; Fund for Scientific Research (FNRS-FWO), FWO Odysseus programme, Flanders Institute to encourage scientific and technological research in industry (IWT), Belgian Federal Science Policy Office (Belspo); University of Oxford, United Kingdom; Marsden Fund, New Zealand; Australian Research Council; Japan Society for Promotion of Science (JSPS); the Swiss National Science Foundation (SNSF), Switzerland; National Research Foundation of Korea (NRF); Danish National Research Foundation, Denmark (DNRF). Some of the results in this paper have been derived using the HEALPix Górski et al. (2005) package. Thanks to R. Laha, J. Beacom, K. Murase, S. Razzaque, and N. Harrington for helpful discussions.References
- Margolis et al. (1978) S. H. Margolis, D. N. Schramm, and R. Silberberg, Astrophys. J. 221, 990 (1978).
- Stecker (1979) F. W. Stecker, Astrophys. J. 228, 919 (1979).
- Biermann (1989) P. L. Biermann, in Cosmic Gamma Rays and Cosmic Neutrinos, edited by M. M. Shapiro and J. P. Wefel (1989) pp. 21–37.
- Michalak et al. (1990) W. Michalak, J. Wdowczyk, and A. W. Wolfendale, Journal of Physics G Nuclear Physics 16, 1917 (1990).
- Mücke et al. (2000) A. Mücke, R. Engel, J. P. Rachen, R. J. Protheroe, and T. Stanev, Computer Physics Communications 124, 290 (2000), astro-ph/9903478 .
- Kelner et al. (2006) S. Kelner, F. Aharonian, and V. Bugayov, Phys. Rev. D 74, 034018 (2006), arXiv:astro-ph/0606058 .
- Abbasi et al. (2009) R. Abbasi et al. (IceCube Collaboration), Nuclear Instruments and Methods in Physics Research A 601, 294 (2009), arXiv:0810.4930 .
- Aartsen et al. (2014a) M. G. Aartsen et al. (IceCube Collaboration), Phys. Rev. D 89, 102001 (2014a), arXiv:1312.0104 [astro-ph.HE] .
- Aartsen et al. (2014b) M. G. Aartsen et al. (IceCube Collaboration), Phys. Rev. D 89, 062007 (2014b), arXiv:1311.7048 [astro-ph.HE] .
- Aartsen et al. (2013a) M. G. Aartsen et al. (IceCube Collaboration), Phys. Rev. Lett. 111, 021103 (2013a), arXiv:1304.5356 [astro-ph.HE] .
- Aartsen et al. (2013b) M. G. Aartsen et al. (IceCube Collaboration), Science 342, 1242856 (2013b), arXiv:1311.5238 .
- Aartsen et al. (2014c) M. G. Aartsen et al. (IceCube Collaboration), JINST 9, P03009 (2014c), 1311.4767 .
- Beacom and Candia (2004) J. F. Beacom and J. Candia, JCAP 11, 009 (2004), hep-ph/0409046 .
- Gaisser et al. (1983) T. K. Gaisser, S. A. Bludman, H. Lee, and T. Stanev, Phys. Rev. Lett. 51, 223 (1983).
- Gonzalez-Garcia et al. (2006) C. Gonzalez-Garcia, M. Maltoni, and J. Rojo, Journal of High Energy Physics 10, 075 (2006), hep-ph/0607324 .
- Lipari et al. (2007) P. Lipari, M. Lusignoli, and D. Meloni, Phys. Rev. D 75, 123005 (2007), arXiv:0704.0718 .
- Fedynitch et al. (2012) A. Fedynitch, J. Becker Tjus, and P. Desiati, Phys. Rev. D 86, 114024 (2012), arXiv:1206.6710 [astro-ph.HE] .
- Honda et al. (2007) M. Honda, T. Kajita, K. Kasahara, S. Midorikawa, and T. Sanuki, Phys. Rev. D 75, 043006 (2007), arXiv:astro-ph/0611418 .
- Berezinsky et al. (1978) V. S. Berezinsky, D. Cline, and D. N. Schramm, Physics Letters B 78, 635 (1978).
- Volkova (1983) L. V. Volkova, International Cosmic Ray Conference 7, 22 (1983).
- Volkova (1999) L. V. Volkova, Physics Letters B 462, 211 (1999).
- Gelmini et al. (2000) G. Gelmini, P. Gondolo, and G. Varieschi, Phys. Rev. D 61, 056011 (2000), hep-ph/9905377 .
- Martin et al. (2003) A. D. Martin, M. G. Ryskin, and A. M. Stasto, Acta Physica Polonica B 34, 3273 (2003), hep-ph/0302140 .
- Enberg et al. (2008) R. Enberg, M. H. Reno, and I. Sarcevic, Phys. Rev. D 78, 043005 (2008), arXiv:0806.0418 [hep-ph] .
- Reno (2013) M. H. Reno, in American Institute of Physics Conference Series, American Institute of Physics Conference Series, Vol. 1560, edited by B. Fleming (2013) pp. 350–354.
- Gaisser (2013) T. K. Gaisser, in European Physical Journal Web of Conferences, European Physical Journal Web of Conferences, Vol. 52 (2013) p. 9004, arXiv:1303.1431 [hep-ph] .
- Schönert et al. (2009) S. Schönert, T. K. Gaisser, E. Resconi, and O. Schulz, Phys. Rev. D 79, 043009 (2009), arXiv:0812.4308 .
- Gaisser et al. (2014) T. K. Gaisser, K. Jero, A. Karle, and J. van Santen, ArXiv e-prints (2014), arXiv:1405.0525 [astro-ph.HE] .
- (29) See Supplemental Material at [URL will be inserted by publisher] for data tables and event views.
- Gaisser et al. (1995) T. K. Gaisser, F. Halzen, and T. Stanev, Physics Reports 258, 173 (1995), hep-ph/9410384 .
- Learned and Mannheim (2000) J. G. Learned and K. Mannheim, Annual Review of Nuclear and Particle Science 50, 679 (2000).
- Halzen and Hooper (2002) F. Halzen and D. Hooper, Reports on Progress in Physics 65, 1025 (2002), astro-ph/0204527 .
- Becker (2008) J. K. Becker, Physics Reports 458, 173 (2008), arXiv:0710.1557 .
- Braun et al. (2008) J. Braun, J. Dumm, F. de Palma, C. Finley, A. Karle, and T. Montaruli, Astroparticle Physics 29, 299 (2008), arXiv:0801.1604 .
- Abdo et al. (2008) A. A. Abdo et al. (Milagro Collaboration), Astrophys. J. 688, 1078 (2008), arXiv:0805.0417 .
- Aartsen et al. (2013c) M. G. Aartsen et al., Astrophys. J. 779, 132 (2013c).
- Adrián-Martínez et al. (2012) S. Adrián-Martínez et al., Astrophys. J. 760, 53 (2012), arXiv:1207.3105 [hep-ex] .
- Adrián-Martínez et al. (2014) S. Adrián-Martínez et al., The Astrophysical Journal Letters 786, L5 (2014).
- Supanitsky (2014) A. D. Supanitsky, Phys. Rev. D 89, 023501 (2014), arXiv:1312.7304 [astro-ph.HE] .
- Ahlers and Murase (2013) M. Ahlers and K. Murase, (2013), arXiv:1309.4077 [astro-ph.HE] .
- Lunardini et al. (2013) C. Lunardini, S. Razzaque, K. T. Theodoseau, and L. Yang, (2013), arXiv:1311.7188 [astro-ph.HE] .
- Bai et al. (2013) Y. Bai, R. Lu, and J. Salvado, (2013), arXiv:1311.5864 [hep-ph] .
- Taylor et al. (2014) A. M. Taylor, S. Gabici, and F. Aharonian, Phys. Rev. D 89, 103003 (2014), arXiv:1403.3206 [astro-ph.HE] .
- Aartsen et al. (2013) M. Aartsen et al. (IceCube Collaboration), in Proc. of the 33rd ICRC, Rio de Janeiro, Brazil (2013) arXiv:1309.6979 [astro-ph.HE] .
- Stecker et al. (1991) F. W. Stecker, C. Done, M. H. Salamon, and P. Sommers, Phys. Rev. Lett. 66, 2697 (1991).
- Kalashev et al. (2013) O. E. Kalashev, A. Kusenko, and W. Essey, Phys. Rev. Lett. 111, 041103 (2013), arXiv:1303.0300 [astro-ph.HE] .
- Atoyan and Dermer (2004) A. M. Atoyan and C. D. Dermer, New Astronomy Reviews 48, 381 (2004), astro-ph/0402646 .
- Alvarez-Muñiz and Mészáros (2004) J. Alvarez-Muñiz and P. Mészáros, Phys. Rev. D 70, 123001 (2004), astro-ph/0409034 .
- Nellen et al. (1993) L. Nellen, K. Mannheim, and P. L. Biermann, Phys. Rev. D 47, 5270 (1993), hep-ph/9211257 .
- Mannheim (1995) K. Mannheim, Astroparticle Physics 3, 295 (1995).
- Stecker and Salamon (1996) F. W. Stecker and M. H. Salamon, Space Science Reviews 75, 341 (1996), astro-ph/9501064 .
- Rachen and Mészáros (1998) J. P. Rachen and P. Mészáros, Phys. Rev. D 58, 123005 (1998), astro-ph/9802280 .
- Mészáros and Waxman (2001) P. Mészáros and E. Waxman, Phys. Rev. Lett. 87, 171102 (2001), astro-ph/0103275 .
- Mücke et al. (2003) A. Mücke, R. J. Protheroe, R. Engel, J. P. Rachen, and T. Stanev, Astroparticle Physics 18, 593 (2003), astro-ph/0206164 .
- Becker et al. (2005) J. K. Becker, P. L. Biermann, and W. Rhode, Astroparticle Physics 23, 355 (2005), astro-ph/0502089 .
- Stecker (2005) F. W. Stecker, Phys. Rev. D 72, 107301 (2005), astro-ph/0510537 .
- Eichmann et al. (2012) B. Eichmann, R. Schlickeiser, and W. Rhode, Astrophys. J. 749, 155 (2012).
- Waxman and Bahcall (1997) E. Waxman and J. Bahcall, Phys. Rev. Lett. 78, 2292 (1997).
- Guetta et al. (2004) D. Guetta, D. Hooper, J. Alvarez-Muñiz, F. Halzen, and E. Reuveni, Astroparticle Physics 20, 429 (2004).
- Baerwald et al. (2014) P. Baerwald, M. Bustamante, and W. Winter, ArXiv e-prints (2014), arXiv:1401.1820 [astro-ph.HE] .
- Winter et al. (2014) W. Winter, J. Becker Tjus, and S. R. Klein, ArXiv e-prints (2014), arXiv:1403.0574 [astro-ph.HE] .
- Waxman and Bahcall (2000) E. Waxman and J. N. Bahcall, Astrophys. J. 541, 707 (2000), hep-ph/9909286 .
- Razzaque et al. (2003) S. Razzaque, P. Mészáros, and E. Waxman, Phys. Rev. D 68, 083001 (2003), astro-ph/0303505 .
- Becker et al. (2006) J. K. Becker, M. Stamatikos, F. Halzen, and W. Rhode, Astroparticle Physics 25, 118 (2006), astro-ph/0511785 .
- Murase and Nagataki (2006) K. Murase and S. Nagataki, Phys. Rev. Lett. 97, 051101 (2006), astro-ph/0604437 .
- Loeb and Waxman (2006) A. Loeb and E. Waxman, JCAP 5, 003 (2006), astro-ph/0601695 .
- Murase et al. (2013) K. Murase, M. Ahlers, and B. C. Lacki, Phys. Rev. D 88, 121301 (2013), arXiv:1306.3417 [astro-ph.HE] .
- Yoast-Hull et al. (2014) T. M. Yoast-Hull, J. S. Gallagher, III, E. G. Zweibel, and J. E. Everett, Astrophys. J. 780, 137 (2014), arXiv:1311.5586 [astro-ph.HE] .
- Thompson et al. (2007) T. A. Thompson, E. Quataert, E. Waxman, and A. Loeb, Astrophys. J. 654, 219 (2007), astro-ph/0608699 .
- Abbasi et al. (2012) R. Abbasi et al. (IceCube Collaboration), Nature 484, 351 (2012), arXiv:1204.4219 [astro-ph.HE] .
- Waxman and Bahcall (1999) E. Waxman and J. Bahcall, Phys. Rev. D 59, 023002 (1999), hep-ph/9807282 .
- Mannheim et al. (2001) K. Mannheim, R. J. Protheroe, and J. P. Rachen, Phys. Rev. D 63, 023003 (2001), astro-ph/9812398 .
- Bagley et al. (2011) P. Bagley et al., KM3NeT Technical Design Report for a Deep-Sea Research Infrastructure Incorporating a Very Large Volume Neutrino Telescope (KM3NeT Consortium, 2011) http://km3net.org/TDR/TDRKM3NeT.pdf.
- Laha et al. (2013) R. Laha, J. F. Beacom, B. Dasgupta, S. Horiuchi, and K. Murase, Phys. Rev. D 88, 043009 (2013), arXiv:1306.2309 [astro-ph.HE] .
- Górski et al. (2005) K. M. Górski, E. Hivon, A. J. Banday, B. D. Wandelt, F. K. Hansen, M. Reinecke, and M. Bartelmann, Astrophys. J. 622, 759 (2005), astro-ph/0409513 .
*
This section gives additional technical information about the result in the main article, including tabular forms of the results, alternative presentations of several figures, reviews of referenced methods, and event displays of the neutrino candidates. Some content is repeated from the main text or from our earlier publication covering the first two years of data Aartsen et al. (2013b) for context. Methods and performance information not provided here (e.g. effective areas) are identical to those in Aartsen et al. (2013b). Event displays here include only the events first shown in this paper; displays for events 1-28 can be found in the online supplement to Aartsen et al. (2013b). Further IceCube data releases can be found at http://www.icecube.wisc.edu/science/data.
Appendix A Event Information
Properties of the 37 neutrino candidate events are shown in Suppl. Tab. 1. Five of these (3, 8, 18, 28, 32) contain downgoing muons and have an apparent first interaction near the detector boundary and are therefore consistent with the expected background muon events. Two of these (28 and 32) have subthreshold early hits in the veto region, as well as coincident detections in the IceTop surface air shower array, and are almost certainly penetrating cosmic ray muon background. The remaining events are uniformly distributed throughout the detector volume and are consistent with neutrino interactions. Their distribution in total PMT charge, used for event selection, is shown in Suppl. Fig. 1.
Reconstruction uncertainties given in Suppl. Tab. 1 include both statistical and systematic uncertainties and were determined from average reconstruction errors on a population of simulated events of the same topology in the same part of the detector with similar energies to those observed. The reconstructions used were maximum likelihood fits of the observed photon timing distributions to template events using the cascade and muon loss unfolding techniques described in Aartsen et al. (2014c). Cascade angular resolution operates by observing forward/backward asymmetries in photon timing: in front of the neutrino interaction, most light is unscattered and arrives over a short period of time, whereas behind the interaction, the light has scattered at least once, producing a broader profile. Resolution as a function of energy for this analysis is shown in Fig. 14 of Aartsen et al. (2014c). Event 32 is made of two coincident cosmic ray muons (see supplemental event views) and so no single energy and direction can be given for the event.
| ID | Dep. Energy (TeV) | Observation Time (MJD) | Decl. (deg.) | R.A. (deg.) | Med. Angular Error (deg.) | Event Topology |
|---|---|---|---|---|---|---|
| 1 | 55351.3222143 | Shower | ||||
| 2 | 55351.4659661 | Shower | ||||
| 3 | 55451.0707482 | Track | ||||
| 4 | 55477.3930984 | Shower | ||||
| 5 | 55512.5516311 | Track | ||||
| 6 | 55567.6388127 | Shower | ||||
| 7 | 55571.2585362 | Shower | ||||
| 8 | 55608.8201315 | Track | ||||
| 9 | 55685.6629713 | Shower | ||||
| 10 | 55695.2730461 | Shower | ||||
| 11 | 55714.5909345 | Shower | ||||
| 12 | 55739.4411232 | Shower | ||||
| 13 | 55756.1129844 | Track | ||||
| 14 | 55782.5161911 | Shower | ||||
| 15 | 55783.1854223 | Shower | ||||
| 16 | 55798.6271285 | Shower | ||||
| 17 | 55800.3755483 | Shower | ||||
| 18 | 55923.5318204 | Track | ||||
| 19 | 55925.7958619 | Shower | ||||
| 20 | 55929.3986279 | Shower | ||||
| 21 | 55936.5416484 | Shower | ||||
| 22 | 55941.9757813 | Shower | ||||
| 23 | 55949.5693228 | Track | ||||
| 24 | 55950.8474912 | Shower | ||||
| 25 | 55966.7422488 | Shower | ||||
| 26 | 55979.2551750 | Shower | ||||
| 27 | 56008.6845644 | Shower | ||||
| 28 | 56048.5704209 | Track | ||||
| 29 | 56108.2572046 | Shower | ||||
| 30 | 56115.7283574 | Shower | ||||
| 31 | 56176.3914143 | Shower | ||||
| 32 | — | 56211.7401231 | — | — | — | Coincident |
| 33 | 56221.3424023 | Shower | ||||
| 34 | 56228.6055226 | Shower | ||||
| 35 | 56265.1338677 | Shower | ||||
| 36 | 56308.1642740 | Shower | ||||
| 37 | 56390.1887627 | Track |
Appendix B Point Source Methods
The point source searches used the unbinned maximum likelihood method from Braun et al. (2008):
| (1) |
Here, represents the isotropic background probability distribution function (PDF), and the signal PDF is the reconstructed directional uncertainty map for each event. is the total number of events in the data sample and is the number of signal events, which is a free parameter. For the all-sky clustering and source catalog searches, the likelihood is maximized at each location, resulting in a best-fit # of signal events. Suppl. Fig. 2 shows the arrival directions of the events and the result of the point source clustering test in equatorial coordinates (J2000), while Suppl. Tab. 2 and 3 list the results for the 78 sources in the pre-defined catalog. This catalog was chosen based on gamma-ray observations or predicted astrophysical neutrino fluxes, and is comprised of sources previously tested by IceCube Aartsen et al. (2013c) and ANTARES Adrián-Martínez et al. (2012).
To reduce the bias in the likelihood fit towards positions of single well-resolved muon tracks, a marginalized form of the likelihood was also used for the all-sky test:
| (2) |
where is equation 1 and is a uniform prior for the position of a single point source. In this procedure, there is only one free parameter () that is fit across the entire sky, instead of being varied independently at every position.
| Category | Source | RA (∘) | Dec (∘) | p-value | |
|---|---|---|---|---|---|
| SNR | TYCHO | 6.36 | 64.18 | 0.0 | – |
| Cas A | 350.85 | 58.82 | 0.0 | – | |
| IC443 | 94.18 | 22.53 | 0.0 | – | |
| W51C | 290.75 | 14.19 | 0.7 | 0.05 | |
| W44 | 284.04 | 1.38 | 2.5 | 0.01 | |
| W28 | 270.43 | -23.34 | 4.3 | 0.01 | |
| RX J1713.7-3946 | 258.25 | -39.75 | 0.0 | – | |
| RX J0852.0-4622 | 133.0 | -46.37 | 0.0 | – | |
| RCW 86 | 220.68 | -62.48 | 0.3 | 0.41 | |
| XB/mqso | LSI 303 | 40.13 | 61.23 | 0.0 | – |
| Cyg X-3 | 308.10 | 41.23 | 0.8 | 0.05 | |
| Cyg X-1 | 299.59 | 35.20 | 1.0 | 0.03 | |
| HESS J0632+057 | 98.24 | 5.81 | 0.0 | – | |
| SS433 | 287.96 | 4.98 | 1.5 | 0.02 | |
| LS 5039 | 276.56 | -14.83 | 4.9 | 0.002 | |
| GX 339-4 | 255.7 | -48.79 | 0.0 | – | |
| Cir X-1 | 230.17 | -57.17 | 0.0 | – | |
| Star Form- | Cyg OB2 | 308.10 | 41.23 | 0.8 | 0.05 |
| ation Region | |||||
| Pulsar/PWN | MGRO J2019+37 | 305.22 | 36.83 | 0.9 | 0.04 |
| Crab Nebula | 83.63 | 22.01 | 0.0 | – | |
| Geminga | 98.48 | 17.77 | 0.0 | – | |
| HESS J1912+101 | 288.21 | 10.15 | 0.8 | 0.04 | |
| Vela X | 128.75 | -45.6 | 0.0 | – | |
| HESS J1632-478 | 248.04 | -47.82 | 0.0 | – | |
| HESS J1616-508 | 243.78 | -51.40 | 0.0 | – | |
| HESS J1023-575 | 155.83 | -57.76 | 0.2 | 0.44 | |
| MSH 15-52 | 228.53 | -59.16 | 0.06 | 0.48 | |
| HESS J1303-631 | 195.74 | -63.52 | 0.8 | 0.28 | |
| PSR B1259-63 | 195.74 | -63.52 | 0.8 | 0.28 | |
| HESS J1356-645 | 209.0 | -64.5 | 0.5 | 0.35 | |
| Galactic | Sgr A* | 266.42 | -29.01 | 3.1 | 0.04 |
| Center | |||||
| Not | MGRO J1908+06 | 286.99 | 6.27 | 1.3 | 0.03 |
| Identified | HESS J1834-087 | 278.69 | -8.76 | 4.7 | 0.01 |
| HESS J1741-302 | 265.25 | -30.2 | 2.5 | 0.07 | |
| HESS J1503-582 | 226.46 | -58.74 | 0.2 | 0.45 | |
| HESS J1507-622 | 226.72 | -62.34 | 0.1 | 0.47 |
| Category | Source | RA (∘) | Dec (∘) | p-value | |
|---|---|---|---|---|---|
| BL Lac | S5 0716+71 | 110.47 | 71.34 | 0.0 | – |
| 1ES 1959+650 | 300.00 | 65.15 | 0.0 | – | |
| 1ES 2344+514 | 356.77 | 51.70 | 0.0 | – | |
| 3C66A | 35.67 | 43.04 | 0.0 | – | |
| H 1426+428 | 217.14 | 42.67 | 0.0 | – | |
| BL Lac | 330.68 | 42.28 | 0.0 | – | |
| Mrk 501 | 253.47 | 39.76 | 0.0 | – | |
| Mrk 421 | 166.11 | 38.21 | 0.0 | – | |
| W Comae | 185.38 | 28.23 | 0.0 | – | |
| 1ES 0229+200 | 38.20 | 20.29 | 0.0 | – | |
| PKS 0235+164 | 39.66 | 16.62 | 0.0 | – | |
| VER J0648+152 | 102.2 | 15.27 | 0.0 | – | |
| RGB J0152+017 | 28.17 | 1.79 | 0.1 | 0.15 | |
| 1ES 0347-121 | 57.35 | -11.99 | 0.0 | – | |
| 1ES 1101-232 | 165.91 | -23.49 | 0.0 | – | |
| PKS 2155-304 | 329.72 | -30.22 | 0.0 | – | |
| H 2356-309 | 359.78 | -30.63 | 1.8 | 0.08 | |
| PKS 0548-322 | 87.67 | -32.27 | 0.0 | – | |
| PKS 0426-380 | 67.17 | -37.93 | 0.0 | – | |
| PKS 0537-441 | 84.71 | -44.08 | 0.0 | – | |
| PKS 2005-489 | 302.37 | -48.82 | 1.5 | 0.11 | |
| FSRQ | 4C 38.41 | 248.82 | 38.14 | 0.0 | – |
| 3C 454.3 | 343.50 | 16.15 | 0.0 | – | |
| PKS 0528+134 | 82.74 | 13.53 | 0.0 | – | |
| PKS 1502+106 | 226.10 | 10.52 | 0.0 | – | |
| 3C 273 | 187.28 | 2.05 | 0.0 | – | |
| 3C279 | 194.05 | -5.79 | 0.0 | – | |
| HESS J1837-069 | 279.41 | -6.95 | 4.5 | 0.01 | |
| QSO 2022-077 | 306.42 | -7.64 | 0.4 | 0.44 | |
| PKS 1406-076 | 212.24 | -7.87 | 0.0 | – | |
| PKS 0727-11 | 112.58 | -11.7 | 0.4 | 0.39 | |
| QSO 1730-130 | 263.26 | -13.08 | 3.3 | 0.03 | |
| PKS 0454-234 | 74.27 | -23.43 | 0.0 | – | |
| PKS 1622-297 | 246.53 | -29.86 | 0.0 | – | |
| PKS 1454-354 | 224.36 | -35.65 | 0.0 | – | |
| Starburst | M82 | 148.97 | 69.68 | 0.07 | 0.15 |
| Radio | NGC 1275 | 49.95 | 41.51 | 0.0 | – |
| Galaxies | Cyg A | 299.87 | 40.73 | 0.9 | 0.03 |
| 3C 123.0 | 69.27 | 29.67 | 0.0 | – | |
| M87 | 187.71 | 12.39 | 0.0 | – | |
| Cen A | 201.37 | -43.02 | 0.03 | 0.49 | |
| Seyfert | ESO 139-G12 | 264.41 | -59.94 | 0.0 | – |
For the galactic plane search, equation 1 is modified so the signal PDF only includes regions which overlap with the galactic plane:
| (3) |
The weight is set to 1 for any region overlapping a galactic plane with a specific angular extent, and is set to 0 otherwise. Suppl. Fig. 3 shows the degree of clustering along the galactic plane for each tested width of the plane.
Appendix C Alternative Hypothesis Tests
The primary statistical test used in this article is based on optimization of a Poisson likelihood in zenith angle and deposited energy containing four components: penetrating muon background, atmospheric neutrinos from decay, atmospheric neutrinos from charm decay, and an isotropic astrophysical test flux. The muon background was constrained by a Gaussian prior matching our veto efficiency measurement. To ensure maximum robustness, all neutrino rates were completely unconstrained beyond a non-negativity requirement.
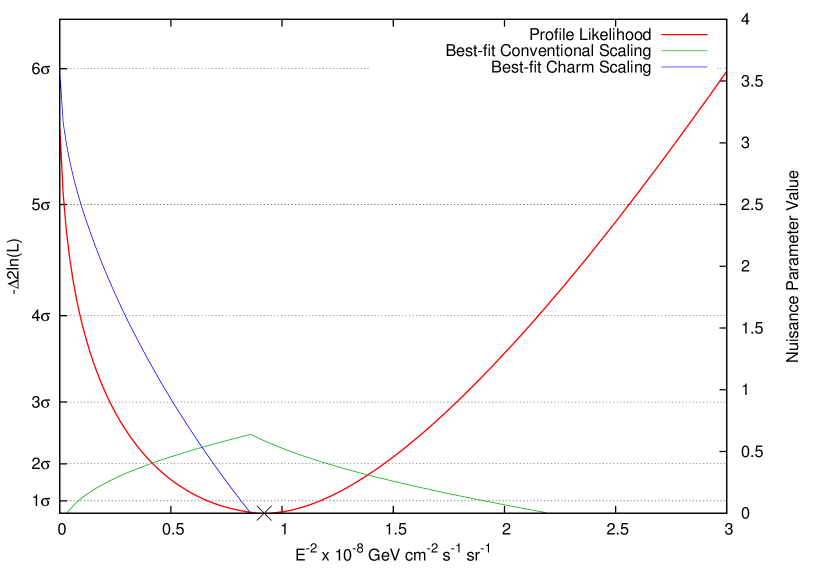
To test the null hypothesis of no astrophysical flux, we compared the best global fit, with all components free, to the best fit when the astrophysical test flux was constrained to zero using the difference in likelihood as a test statistic. This rejected with a significance of the no-astrophysical case when compared to the best-fit alternative, which had a prompt flux (the hardest non-astrophysical component available to the fitter) 3.6 times above existing 90% CL limits Aartsen et al. (2014b) (Suppl. Fig. 4), which themselves are well above most common prompt flux predictions (e.g. Enberg et al. (2008)). Using the previous limits directly in the fit, through a Gaussian penalty function, would have increased the significance of the result to , tested against a best-fit prompt flux 1.6 times larger than the existing 90% CL limit.
In the first part of this study Aartsen et al. (2013b), we performed an additional test that does not include information on the spectrum or angular distribution of the penetrating muon background and has correspondingly much lower sensitivity. The construction of the test also does not allow incorporation of any non-statistical uncertainties in the atmospheric neutrino fluxes, in order to match the treatment and charm background model in Aartsen et al. (2013a); it is presented here only for consistency with the previous result. Removing the two PeV events from the sample and incorporating them with the significance from Aartsen et al. (2013a) gives . Including all events directly in the test yields .
Comparisons of the properties of the events to model expectations are given in Suppl. Tab. 4 and Suppl. Figs. 5 and 6.
| all energies | ||||||||
| Muons | atm. | Prompt atm. | (best-fit) | (best-fit) | Sum () | Sum () | Data | |
| Tot. Events | (90% CL) | 23.8 | 23.7 | 38.8 | 38.7 | 37 (36) | ||
| Up | 0 | 4.2 | 8.3 | 9.4 | 12.4 | 13.5 | 9 | |
| Down | 8.4 | 2.4 | 15.5 | 14.4 | 26.3 | 25.2 | 27 | |
| Track | 4.5 | 4.6 | 4.3 | 16.7 | 16.4 | 8 | ||
| Shower | 2.1 | 19.2 | 19.5 | 22.1 | 22.4 | 28 | ||
| Fraction Up | 0% | 63% | 68% | 35% | 40% | 32% | 35% | 25% |
| Fraction Down | 100% | 37% | 32% | 65% | 60% | 68% | 65% | 75% |
| Fraction Tracks | 69% | 19% | 19% | 18% | 43% | 42% | 24% | |
| Fraction Showers | 31% | 81% | 81% | 82% | 57% | 58% | 76% | |
| TeV | ||||||||
| Muons | atm. | Prompt atm. | (best-fit) | (best-fit) | Sum () | Sum () | Data | |
| Tot. Events | 8.0 | 4.2 | 2.2 | 3.8 | 14.5 | 16.1 | 16 | |
| Up | 0 | 2.6 | 1.2 | 2.0 | 3.7 | 4.7 | 4 | |
| Down | 8.0 | 1.6 | 1.1 | 1.8 | 10.7 | 11.4 | 12 | |
| Track | 2.9 | 0.4 | 0.6 | 10.5 | 10.7 | 4 | ||
| Shower | 1.4 | 1.8 | 3.2 | 4.0 | 5.3 | 12 | ||
| Fraction Up | 0% | 63% | 65% | 52% | 53% | 26% | 29% | 25% |
| Fraction Down | 100% | 37% | 35% | 48% | 47% | 74% | 71% | 75% |
| Fraction Tracks | 68% | 19% | 19% | 17% | 72% | 67% | 25% | |
| Fraction Showers | 32% | 81% | 81% | 83% | 28% | 33% | 75% | |
| 60 TeV 3 PeV | ||||||||
| Muons | atm. | Prompt atm. | (best-fit) | (best-fit) | Sum () | Sum () | Data | |
| Tot. Events | 0.4 | 2.4 | 18.2 | 18.6 | 21.0 | 21.4 | 20 | |
| Up | 0 | 1.5 | 6.7 | 7.2 | 8.2 | 8.7 | 5 | |
| Down | 0.4 | 0.8 | 11.6 | 11.4 | 12.8 | 12.7 | 15 | |
| Track | 1.7 | 3.8 | 3.5 | 5.8 | 5.5 | 4 | ||
| Shower | 0.7 | 14.4 | 15.1 | 15.2 | 15.8 | 16 | ||
| Fraction Up | 0% | 64% | 70% | 37% | 39% | 39% | 41% | 25% |
| Fraction Down | 100% | 36% | 30% | 63% | 61% | 61% | 59% | 75% |
| Fraction Tracks | 71% | 20% | 21% | 19% | 28% | 26% | 20% | |
| Fraction Showers | 29% | 80% | 79% | 81% | 72% | 74% | 80% | |
Appendix D Time Clustering Analysis
We performed two tests for clustering of events in time, following an identical procedure to that in Aartsen et al. (2013b). The method is reviewed below. The first test looked for significant time clusters in all events (neglecting, like the point source search, events 28 and 32). A second searched for time clustering in eleven subsets of the events that formed possible spatial clusters of two or more events.
We applied an unbinned maximum likelihood method as in Braun et al. (2008) to identify timing clusters relative to an assumed constant arrival rate in both the full sample and each spatial group. This selects the most significant time cluster over a discrete set of time windows (), one for each possible pair of the 35 event times. Each event pair defines a start and end time ( and ), with a duration . These quantities form the signal likelihood:
| (4) |
where is the Heaviside step function. For each , the likelihood ratio to a flat alternative was used as a test statistic () as in Braun et al. (2008). Significance was determined by comparing the highest TS with the distribution obtained for data sets scrambled in time.
Using all events, the most significant time cluster contained seven events (18, 19, 20, 21, 22, 23, 24). The fitted number of signal events () is 6.09, with a duration of 27.3 days. The probability to observe a cluster this significant or better by chance is 11%.
The second test searched for time clustering among events found in several spatial groups. Within each group, the same scrambling approach and analysis was applied as to the full sample, but with fewer events. Results are shown in Suppl. Table 5. The highest fluctuation observed corresponds to Cluster K with a pre-trial p-value 4.0%. Including trial factors due to the 11 spatial groups gives an overall post-trial p-value for this excess of 33%.
| no. of | |||||
|---|---|---|---|---|---|
| events | event IDs | p-value | |||
| Cluster A | 6 | 2, 14, 22, 24, 25, 33 | 2.9 | 25 | 17% |
| Cluster B | 2 | 15, 12 | 2.0 | 44 | 9% |
| Cluster C | 2 | 10, 21 | 2.0 | 241 | 38% |
| Cluster D | 3 | 3, 6, 27 | 3.0 | 558 | 62% |
| Cluster E | 2 | 9, 26 | 2.0 | 294 | 50% |
| Cluster F | 2 | 16, 23 | 2.0 | 151 | 24% |
| Cluster G | 2 | 8, 16 | 2.0 | 190 | 32% |
| Cluster H | 3 | 19, 20, 30 | 2.0 | 4 | 8% |
| Cluster I | 2 | 4, 35 | 2.0 | 788 | 94% |
| Cluster J | 2 | 17, 36 | 2.0 | 508 | 72% |
| Cluster K | 3 | 29, 33, 34 | 3.0 | 120 | 4% |
Event 29
![[Uncaptioned image]](/html/1405.5303/assets/x12.png)
| Deposited Energy (TeV) | Time (MJD) | Declination (deg.) | RA (deg.) | Med. Ang. Resolution (deg.) | Topology |
|---|---|---|---|---|---|
| 56108.2572046 | Shower |
Event 30
![[Uncaptioned image]](/html/1405.5303/assets/x14.png)
| Deposited Energy (TeV) | Time (MJD) | Declination (deg.) | RA (deg.) | Med. Ang. Resolution (deg.) | Topology |
|---|---|---|---|---|---|
| 56115.7283574 | Shower |
Event 31
![[Uncaptioned image]](/html/1405.5303/assets/x16.png)
| Deposited Energy (TeV) | Time (MJD) | Declination (deg.) | RA (deg.) | Med. Ang. Resolution (deg.) | Topology |
|---|---|---|---|---|---|
| 56176.3914143 | Shower |
Event 32
![[Uncaptioned image]](/html/1405.5303/assets/x18.png)
| Deposited Energy (TeV) | Time (MJD) | Declination (deg.) | RA (deg.) | Med. Ang. Resolution (deg.) | Topology |
| — | 56211.7401231 | — | — | — | Coincident |
Event 33
![[Uncaptioned image]](/html/1405.5303/assets/x20.png)
| Deposited Energy (TeV) | Time (MJD) | Declination (deg.) | RA (deg.) | Med. Ang. Resolution (deg.) | Topology |
|---|---|---|---|---|---|
| 56221.3424023 | Shower |
Event 34
![[Uncaptioned image]](/html/1405.5303/assets/x22.png)
| Deposited Energy (TeV) | Time (MJD) | Declination (deg.) | RA (deg.) | Med. Ang. Resolution (deg.) | Topology |
|---|---|---|---|---|---|
| 56228.6055226 | Shower |
Event 35
![[Uncaptioned image]](/html/1405.5303/assets/x24.png)
| Deposited Energy (TeV) | Time (MJD) | Declination (deg.) | RA (deg.) | Med. Ang. Resolution (deg.) | Topology |
|---|---|---|---|---|---|
| 56265.1338677 | Shower |
Event 36
![[Uncaptioned image]](/html/1405.5303/assets/x26.png)
| Deposited Energy (TeV) | Time (MJD) | Declination (deg.) | RA (deg.) | Med. Ang. Resolution (deg.) | Topology |
|---|---|---|---|---|---|
| 56308.1642740 | Shower |
Event 37
![[Uncaptioned image]](/html/1405.5303/assets/x28.png)
| Deposited Energy (TeV) | Time (MJD) | Declination (deg.) | RA (deg.) | Med. Ang. Resolution (deg.) | Topology |
|---|---|---|---|---|---|
| 56390.1887627 | Track |