Thermal Starless Ammonia Core Surrounded by CCS
in the Orion A Cloud
Abstract
We imaged two starless molecular cloud cores, TUKH083 and TUKH122, in the Orion A giant molecular cloud in the CCS and ammonia (NH3) emission with the Very Large Array. TUKH122 contains one NH3 core “TUKH122-n,” which is elongated and has a smooth oval boundary. Where observed, the CCS emission surrounds the NH3 core. This configuration resembles that of the N2H+ and CCS distribution in the Taurus starless core L1544, a well-studied example of a dense prestellar core exhibiting infall motions. The linewidth of TUKH122-n is narrow (0.20 km s-1) in the NH3 emission line and therefore dominated by thermal motions. The smooth oval shape of the core boundary and narrow linewidth in NH3 seem to imply that TUKH122-n is dynamically relaxed and quiescent. TUKH122-n is similar to L1544 in the kinetic temperature (10 K), linear size (0.03 pc), and virial mass ( 2 ). Our results strongly suggest that TUKH122-n is on the verge of star formation. TUKH122-n is embedded in the 0.2 pc massive (virial mass 30 ) turbulent parent core, while the L1544 NH3 core is embedded in the 0.2 pc less-massive (virial mass 10 ) thermal parent core. TUKH083 shows complicated distribution in NH3, but was not detected in CCS. The CCS emission toward TUKH083 appears to be extended, and is resolved out in our interferometric observations.
1 Introduction
“Giant molecular clouds (GMCs)” are known to form star clusters with both massive and low-mass stars while “cold dark clouds” (also called “nearby dark clouds”, “small molecular clouds”, or “SMCs”; excluding “infrared dark clouds” here) can form only low-mass stars in isolation (e.g. Shu et al., 1987; Turner, 1988; Bergin & Tafalla, 2007). These two categories of molecular clouds have different physical properties. Molecular clouds have hierarchical structure, and structures having sizes of the order 0.1 pc are often called “molecular cloud cores” or simply “cores.” The nonthermal motion or turbulence is dominant in cores in GMCs, while the thermal motion is more dominant in cores in cold dark clouds (e.g. Turner, 1988; Tatematsu et al., 1993; Caselli & Myers, 1995). Because most stars in the Galaxy form in GMCs, star formation from their cores is of great interest. How do stars form from turbulent cores in GMCs? Do turbulent cores dissipate turbulence partially or completely before star formation? Therefore, it is essential to observationally characterize cores in GMCs in the turbulent environments where most stars are born. It was theoretically suggested that cores are dynamical rather than quasistatic objects with relatively short lifetimes (e.g. Ballesteros-Paredes et al., 2003, 2007). If this is true, cores in GMCs cannot be quasistatic, and will be far different from quiescent cores in cold dark clouds (e.g. Myers, 1983; Pineda et al., 2011). Some researchers have pointed out that the dissipation of turbulence can initiate the star formation process (Myers, 1983; Nakano, 1998; Aso et al., 2000). However, it is not well established observationally how turbulent molecular clouds form stars. We wonder whether stars form in dynamical cores or quiescent cores, whether turbulence dissipates before star formation, and how it does. To know how star formation occurs in GMCs, it is essential to investigate starless molecular cloud cores that might lead to star formation in near future in detail.
We take the Orion A cloud, which is the nearest and best studied GMC (e.g. Genzel & Stutzki, 1989). The overall structure is filamentary, and contains the “-shaped filament” (0.5 pc wide, 13 pc long) in the northern region (Bally et al., 1987). Johnstone & Bally (1999) mapped the -shaped filament at 450 and 850m, and found a chain of compact sources along a narrow ( 0.14 pc) high-density filament. The Orion A GMC has a hierarchical structure consisting of 1.4 pc-width filaments (Nagahama et al., 1998) as well as 1 pc-sized clumps and 0.1 pc-sized cores (Batrla et al., 1983; Bally et al., 1987; Castets et al., 1990; Tatematsu et al., 1993; Cesaroni & Wilson, 1994; Chini et al., 1997; Tatematsu et al., 1998; Lis et al., 1998; Aso et al., 2000; Johnstone & Bally, 2006; Ikeda et al., 2007; Tatematsu et al., 2008; Takahashi et al., 2013).
To identify candidate starless cores close to star formation, we use chemical evolution tracers. Tatematsu et al. (1993) mapped the Orion A GMC in CS = 10 with the Nobeyama 45 m radio telescope, and cataloged 125 cores (we use the prefix of TUKH). Tatematsu et al. (2010) made single-pointing observations toward more than 60 TUKH cores in CCS and other molecules with the Nobeyama 45 m radio telescope. They detected CCS in molecular cloud cores in the Orion A GMC for the first time; this molecule is known as a tracer of young molecular gas in cold dark clouds through observations and chemical model calculations (Suzuki et al., 1992). TUKH122 and TUKH083 are the most and second-most intense cores in CCS = 4, respectively, in their observations. From their data, TUKH083 is thought to be a young starless core, because it meets the category of the Carbon-Chain-Producing Regions (CCPRs) on the (CCS)-(NH3)/(CCS) diagram defined by Hirota, Ohishi, & Yamamoto (2009). On the other hand, TUKH122 is thought to be an older starless core, because it is not categorized in the CCPRs category. Tatematsu et al. (2014) mapped six TUKH cores in the Orion A GMC in N2H+ = 10 and CCS = 7 also with the Nobeyama 45 m telescope, and identified sub-peaks in these lines. They confirmed that the column density ratio of N2H+ to CCS can be used as a chemical evolution tracer even in the GMCs if the gas temperature in the core does not exceed 25 K. The N2H+ sub-peaks (TUKH122C and TUKH122D) inside the TUKH122 region have the largest (N2H+)/(CCS) column density ratios (23) among the starless sub-peaks observed by Tatematsu et al. (2014). The ratios are close to the criterion between starless and star-forming core peaks, which means these sub-peaks are close to star formation. TUKH122 has the narrowest N2H+ line profiles in their N2H+ core samples. In this study, we mapped two starless cores TUKH083 and TUKH122 in the Orion A GMC, by observing the ammonia (NH3) and CCS emission to investigate the physical and chemical properties. According to Wilson et al. (1999), TUKH083 and TUKH122 have NH3 rotational temperatures of 35 and 15 K, respectively. These correspond to the kinetic temperature = 60 K and 15 K, respectively by using the conversion given by Danby et al. (1988). Wilson et al. (1999) obtained also from CO = 32 peak intensities to be 15 and 12 K for TUKH083 and TUKH122, respectively. When we investigate the Herschel Observatory images, the dust continuum emission corresponding to TUKH122 is seen in Figure 2 of Roy et al. (2013), but that corresponding to TUKH083 is not clear in Figure 10 of Lombardi et al. (2014) probably due to confusion in a crowded region. According to Figure 2 of Roy et al. (2013), the dust temperature toward TUKH122 is approximately 1213 K.
In this work we adopt a distance of 4186 pc based on the work of Kim et al. (2008) as the best estimate; at this distance 1’ corresponds to 0.12 pc
2 Observations
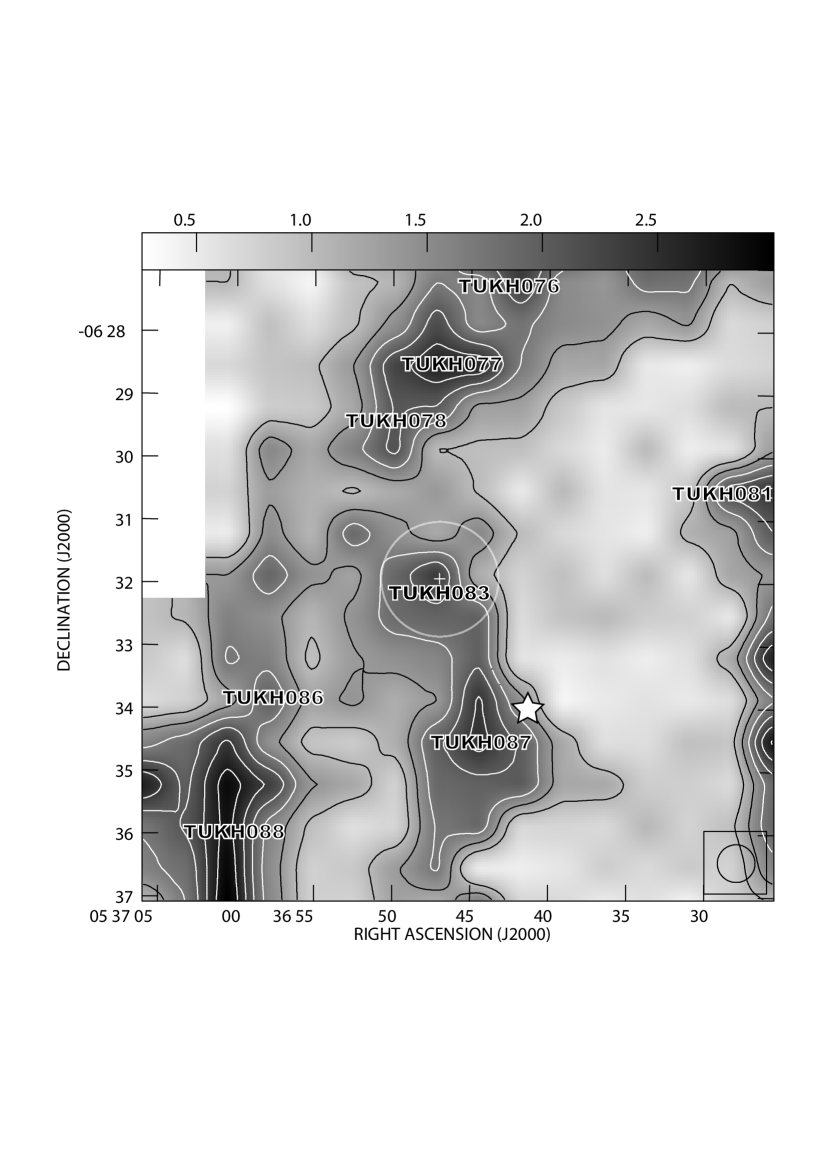
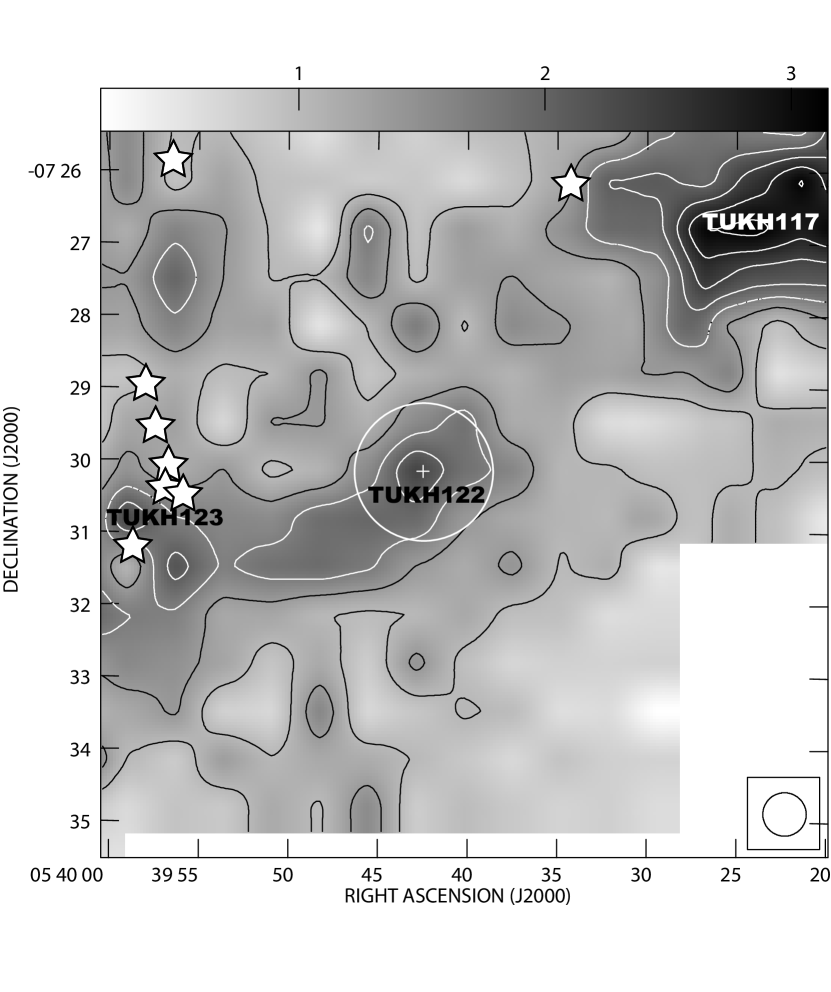
Observations were carried out by using the Karl G. Jansky Very Large Array (hereafter VLA) of the National Radio Astronomy Observatory111The National Radio Astronomy Observatory is a facility of the National Science Foundation operated under cooperative agreement by Associated Universities, Inc. of the United States of America in the D configuration. The observation dates are five days between 2010 August 29 and 2010 September 9. We observed NH3 = (1, 1) at 23.694495 GHz (Ho & Townes, 1983) and CCS = 4 at 45.379033 GHz (Yamamoto et al., 1990) in both of the right-hand and left-hand circular polarizations, simultaneously. We employed the receiver front-ends for 1.3 cm K band and 0.7 cm Q band. The tracking velocity was = 4.0 km s-1. The receiver back-end was the WIDAR correlator in the OSRO2 mode. The channel width was 15.625 kHz (corresponding to 0.197 km s-1) for NH3 and 31.25 kHz (corresponding to 0.207 km s-1) for CCS. The number of the frequency channels was 256. We observed 3C147 as the flux and bandpass calibrator. The observed intensity is reported in terms of Jy beam-1. We used J0541-0541 as the phase calibrator. Immediately before the flux, bandpass, and phase calibration, we made pointing observations in X band toward the same calibrators. Tables 1 and 2 list observation sessions and observational parameters. The observed data were flagged, calibrated, and imaged (CLEANed) using the CASA 4.1 software package. The flux of the flux calibrator 3C147 is assumed to be 1.783 Jy at K band and 1.0136 Jy at Q band, from the model of “Perley-Butler 2010” in CASA. The CLEAN deconvolution was made using the simple Clark Algorithm with the natural weighting and with UV taper. For Q-band observations, we applied the Gaussian filter of “outertaper” = 30 in addition in the CLEAN deconvolution. The primary beam size was about 2 for K band and 1 for Q band. We used the software package AIPS to plot images and spectra to be presented in this paper. Figures 1 and 2 show the primary beams of our interferometric observations at K band toward TUKH083 and TUKH122 superimposed on the CS = 10 maps of Tatematsu et al. (1993). All the interferometric maps are corrected for the primary beam response.
3 Results
Core TUKH122 was clearly detected in both the NH3 and CCS emission. Core TUKH083 was detected only in the NH3 emission. We have not detected the continuum emission either in K or Q bands. The 3 upper limit to the continuum emission is 1.56 mJy beam-1 or 0.276 K for K band and 5.4 mJy beam-1 or 0.189 K for Q band.
3.1 TUKH122 map
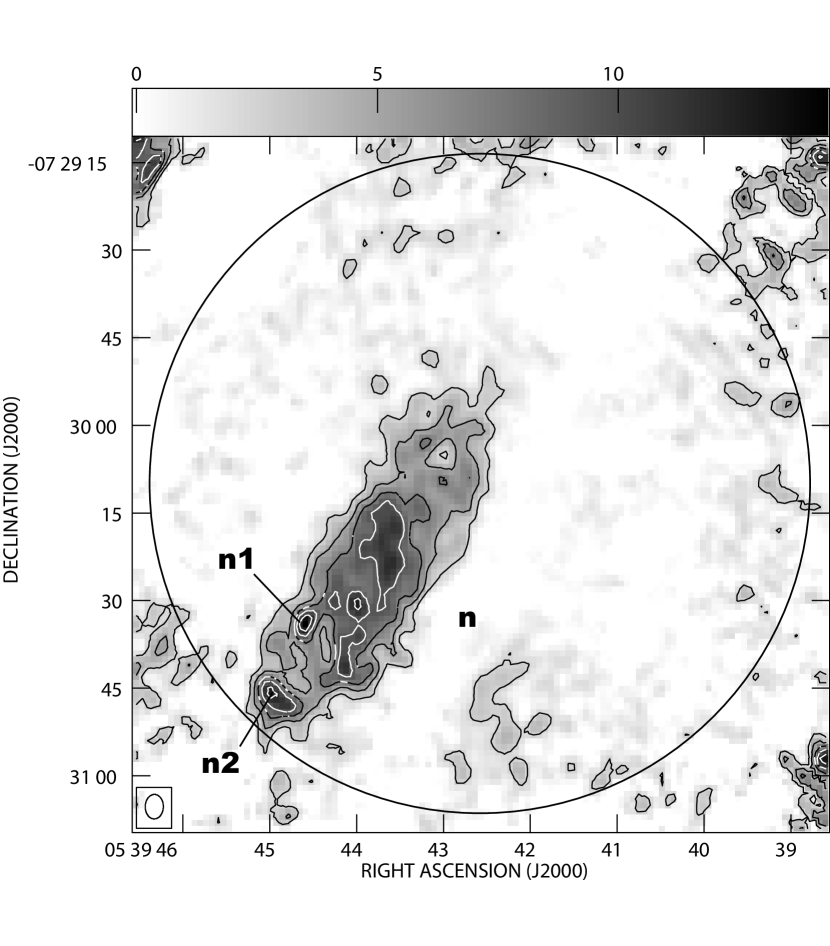
Figures 3 to 5 show NH3 and CCS velocity-integrated intensity maps toward TUKH122. Figure 4 shows the NH3 map. The NH3 map shows the emission distribution elongated in the northwest-southeast direction. The boundary shape is very smooth and oval. The NH3 emission roughly corresponds to the N2H+ emission observed by Tatematsu et al. (2014) as TUKH122C and D. The noise level increases outward, because the primary beam response is corrected. All the features outside the primary beam size are noise rather than the emission. The NH3 core has some internal structure, and the southeastern side of the NH3 core looks clumpy. It might be affected by higher noise level near the edge of the primary beam to some extent, but it is likely that some internal structures are real. We call the overall core TUKH122-n, and internal sub-cores TUKH122-n1 and n2. The direction of the elongation of TUKH122-n is more or less in parallel with the CS filament (P.A. 135) having a width of 0.1 pc in Figure 2. Table 3 lists the physical parameters of TUKH122-n, n1, and n2. We fit two-dimensional Gaussians to the emission distribution, and derive the beam-deconvolved parameters. , , and PA are the major and minor diameters, and the position angle, respectively. The axial ratio (minor diameter/major diameter) is 0.26, which is smaller than the typical value in cores in cold dark clouds, on the order 0.5 (Myers et al., 1991). This core elongation is also in parallel with the global filamentary shape (e.g. Bally et al., 1987; Tatematsu et al., 1993) of the Orion A GMC. The flux of the core TUKH122-n obtained through the spatial two-dimensional Gaussian fitting is 392 mJy km s-1. Using the MPIfR 100m radio telescope, Wilson et al. (1999) observed TUKH122 in NH3, and obtained a main-beam radiation temperature of = 2.28 K and an FWHM linewidth of 0.8 km s-1, resulting in an integrated intensity of 1.94 K km s-1. This corresponds to 1.64 Jy km s-1 in their 43 beam. Then, 24% of the single dish flux was resolved with the VLA.
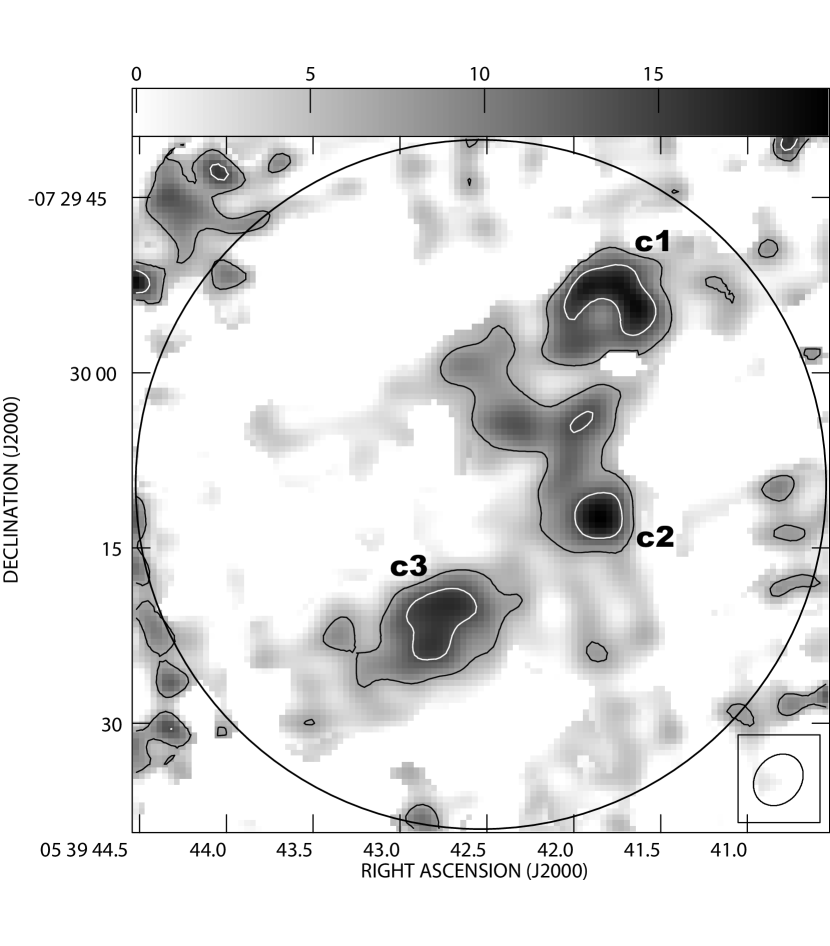
Our interferometric CCS = 4 observations show three sub-cores, TUKH122-c1, c2, and c3 (Figure 5). Table 3 lists them. These emission peaks coincide well with the single-dish CCS = 7 peaks in Tatematsu et al. (2014): TUKH122-c1 roughly corresponds to their TUKH122B, and TUKH-c2 and -c3 correspond to their TUKH122. The sum of the TUKH122-c1, c2, and c3 flux is 209 mJy km s-1. The single-dish observations toward TUKH122 (Tatematsu et al., 2010) show that the CCS = 4 intensity and linewidth are = 0.47 K or = 0.78 K and an FWHM linewidth of 0.55 km s-1, respectively, resulting in an integrated intensity of 0.4 K km s-1. This corresponds to 1.0 Jy km s-1 in their 385 beam. Our interferometric observations resolved 21% of the emission. The CCS emission was detected in two velocity bins (2 0.2 km s-1) in the VLA observations. It is hard to measure the linewidth, but it will be 0.4 km s-1 or less. The single-dish CCS observations (Tatematsu et al., 2014) also show the emission at R.A. (J2000.0) = 5h39m465, Dec. (J2000.0) = 73049 (TUKH122E), although contours are not closed due to the limited observation area. This peak is located outside the CCS observation field of the present study, but just 30 southeast from the NH3 core boundary. Then the NH3 core has the VLA CCS sub-cores on one side and the single-dish CCS on the other side, along its elongation. It is most likely that the CCS emission surrounds the NH3 core. This is very similar to the cases of cores in cold dark clouds, the N2H+-CCS configuration in L1544 and NH3-CCS configuration in L1498 (Aikawa et al., 2001; Lai & Crutcher, 2000). L1544 is a dense prestellar core exhibiting infall motions (Tafalla et al., 1998). Aikawa et al. (2001) calculated numerical chemical models for a collapsing core, and found that models are consistent with the observations of L1544: the collapsing core has a chemically evolved N2H+ inner core surrounded by the chemically young CCS region. This likely also explains the NH3 and CCS configuration in TUKH122. TUKH122-n, L1544, and L1498 have similar linear sizes in pc. We wonder about the current status of TUKH122-n regarding the core stability. From the similarity between TUKH122-n and L1544, it is possible that TUKH122-n may be unstable now, or may become unstable in near future by dissipating the remaining nonthermal motion or by accreting surrounding gas after turbulence dissipation. Taking also into account high (N2H+)/(CCS) ratio implying an evolved starless core (Tatematsu et al., 2014), it is most likely that TUKH122-n is a thermal starless core on the verge of star formation.
Our velocity resolution of 0.197 km s-1 is insufficient to allow us to see whether TUKH122 is collapsing (Zhou et al., 1993; Zhou, 1995; Choi et al., 1995; Tafalla et al., 1998) or has other systematic motion such as oscillation (Lada et al., 2003; Keto & Burkert, 2014; Chitsazzadeh et al., 2014). In the single-dish N2H+ spectra of Tatematsu et al. (2014) at a resolution of 0.1 km s-1 toward TUKH122, there is no hint of the blue-skewed spectrum of protostellar collapse. However, it is highly desirable to obtain better velocity resolution data to investigate whether TUKH122 is collapsing or has other systematic motions.
3.2 TUKH083 map
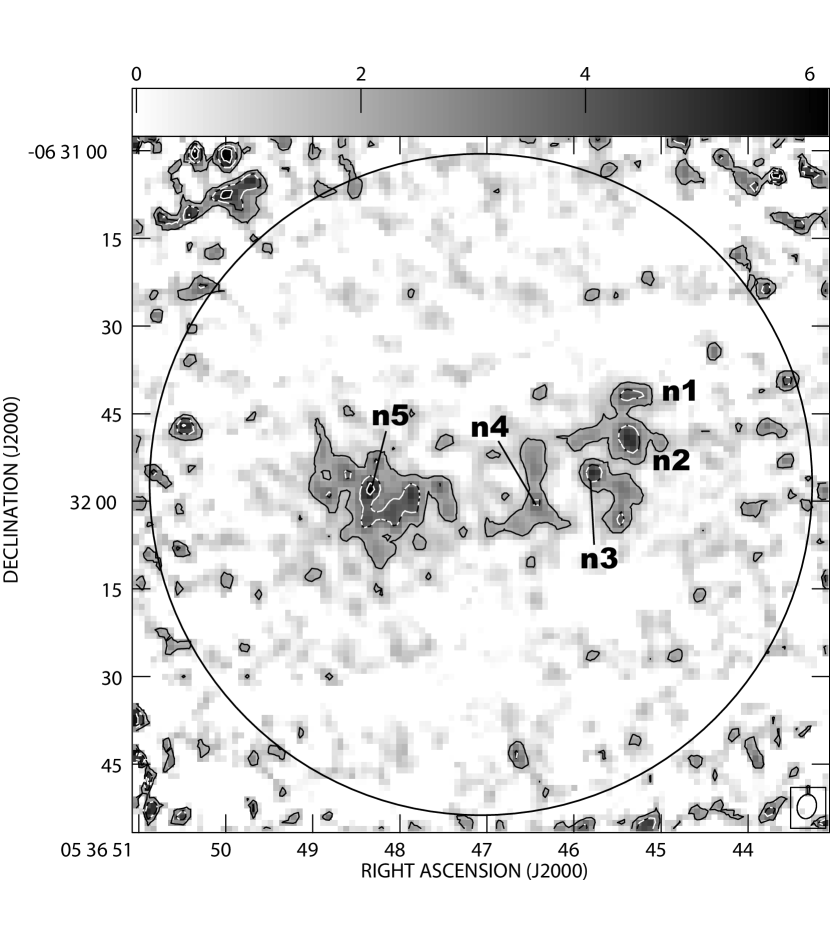
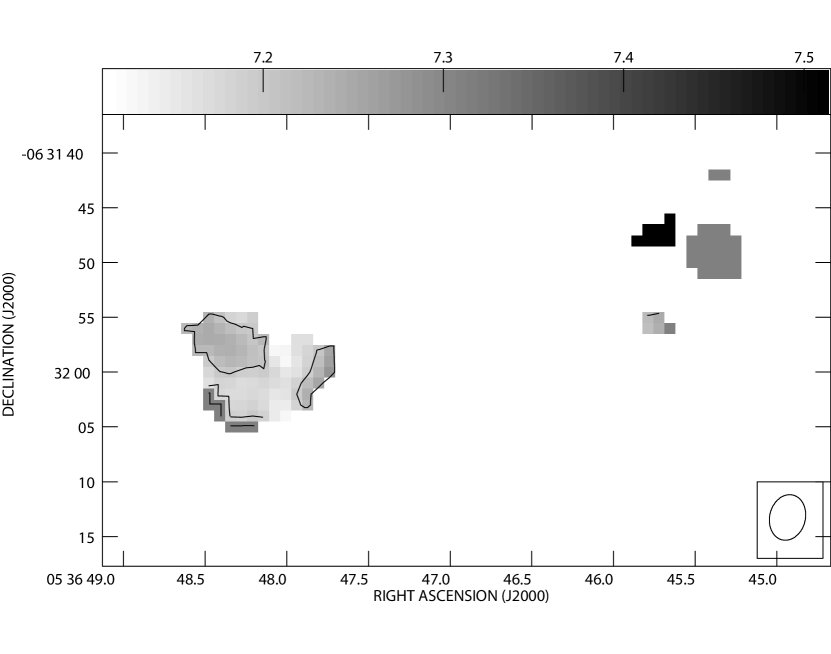
Figure 6 shows the NH3 map toward TUKH083. The emission is very clumpy. Table 3 lists 5 NH3 sub-cores TUKH083-n1 to n5. A feature at R.A. (J2000.0) = 5h36m505, Dec. (J2000.0) = 63147 is located near the edge of the primary beam, and is as compact as the synthesized beam. Because its intensity is close to 3, we do not catalog it as reliable detection. The overall complicated shape may suggest that the core is not dynamically relaxed yet. We did not detect the CCS emission toward TUKH083, although this source is the second most intense CCS = 4 core in Tatematsu et al. (2010). The 3 upper limit at 0.4 km s-1 resolution is 3.6 mJy beam-1 km s-1. This means that the CCS = 4 emission toward TUKH083 is extended and resolved out in our interferometric observations.
3.3 NH3 spectra
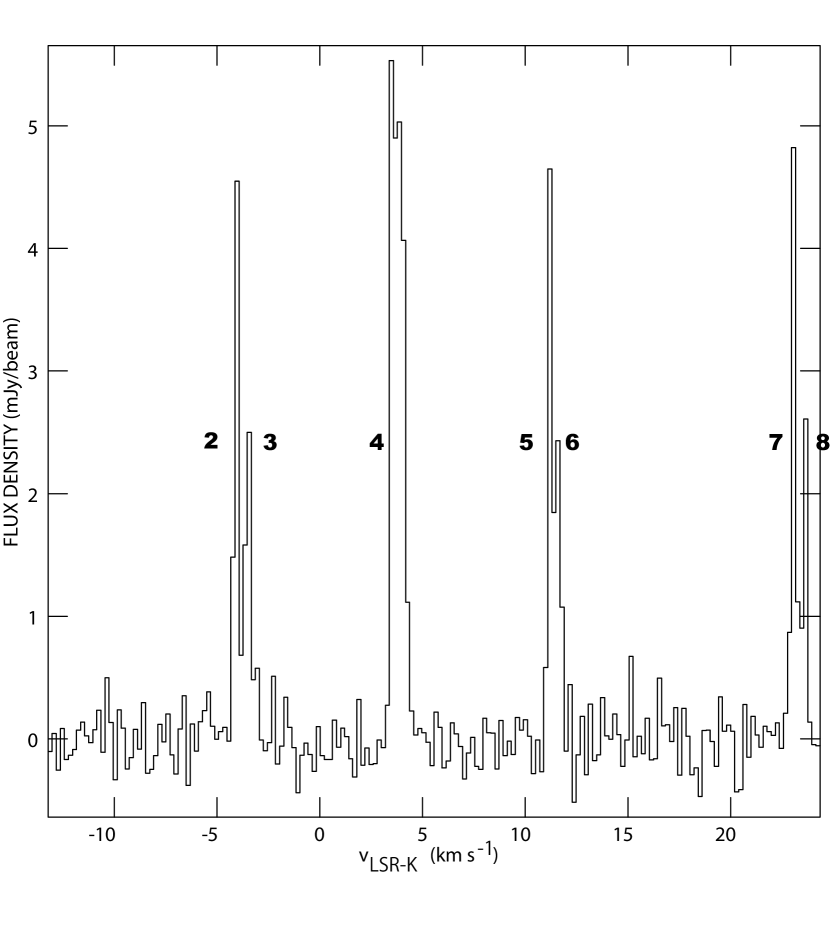
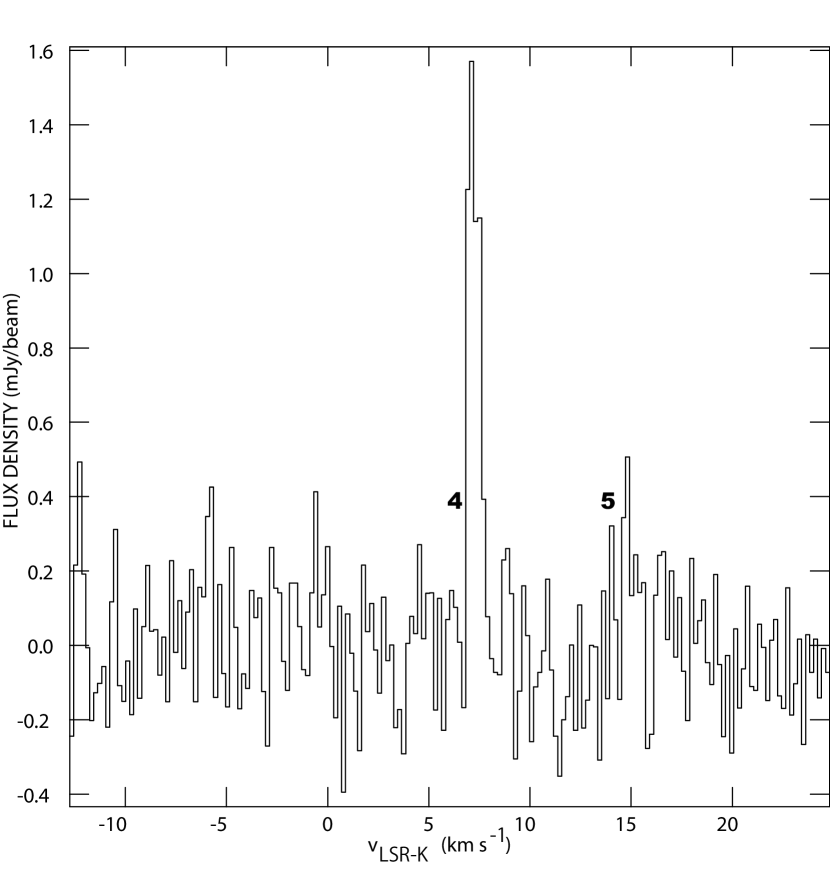
Figures 7 and 8 show the NH3 spectra toward TUK122 and TUKH083, respectively. See Myers & Benson (1983) for details of the hyperfine components of NH3 (1, 1) and their feature names (features 1 to 8). NH3 hyperfine feature 1 is located outside our effective spectral window. NH3 hyperfine feature 4 is the main component and the other features are satellite components. The intrinsic relative intensity of hyperfine components is 0.52, 0.38, 0.56, 0.33, 0.48, and 0.28 for satellite features 2, 3, 5, 6, 7, and 8 with respect to the main component feature 4, respectively (Rydbeck et al., 1977; Ho & Townes, 1983). Figure 7 shows the hyperfine component intensities toward TUKH122. Hyperfine fitting tells us that the optical depth of the main component is derived to be as large as 2. This is in contrast with the NH3 (1, 1) spectrum obtained toward the dark cloud core L1498 by Myers & Benson (1983), which looks optically thinner. TUKH083 (Figure 8) shows only NH3 hyperfine features 4 and 5, and their observed intensity ratio is close to the intrinsic relative intensity ratio. Then, even the main component is optically thin.
3.4 Velocity structure in NH3
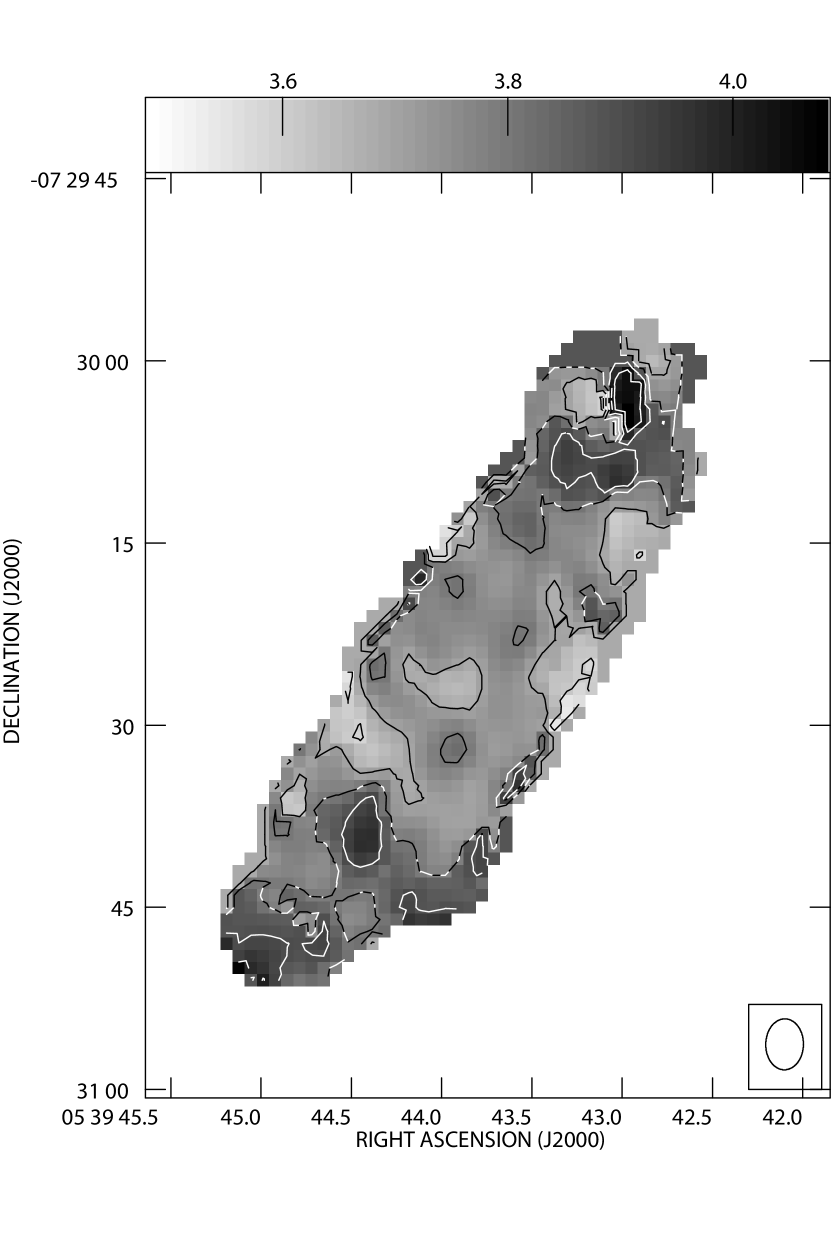
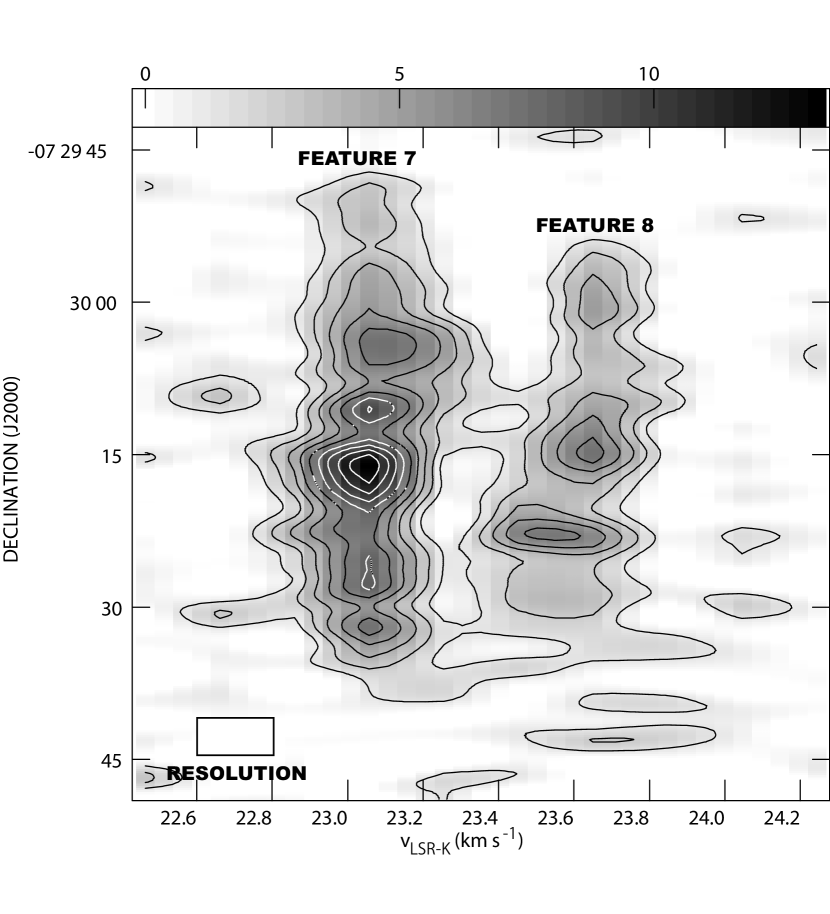
Figures 9 and 10 show the intensity-weighted radial velocity maps toward TUKH122 and TUKH083, respectively. The radial velocity in TUKH122 is fairly constant over the core. We investigate the velocity field toward TUKH122-n in NH3 in detail. To see the velocity structure along the elongation, we rotate the image data anticlockwise by 333 so that the elongation becomes vertical. Then, we average the data along the x axis (perpendicular to the elongation), and obtain the position-velocity diagram. Figure 11 illustrates the position-velocity diagram of NH3 hyperfine features 7 and 8 toward TUKH122. If all the hyperfine components are optically thin, we expect to see spatial components aligned parallel (horizontally) with each other. These hyperfine components do not show such correspondence well. Then, the optical depth probably affects the intensity distribution in these position-velocity diagrams. We derive the linewidth by using optically thinner line, NH3 hyperfine feature 8. By fitting a two-dimensional Gaussian to the NH3 hyperfine feature 8 in Figure 11, we obtain an FWHM linewidth of 0.2800.002 km s-1. Deconvolved with an instrumental velocity resolution of 0.197 km s-1, the intrinsic FWHM linewidth is 0.20 km s-1. This value is close to the thermal FWHM linewidth (th) = (8(ln 2) for NH3 at = 10 K of 0.16 km s-1. Here, is the Boltzmann constant, and is the mass of the molecule. The FWHM linewidth for the mean mass per particle (2.33 a.m.u.) at 10 K is 0.44 km s-1. The turbulent FWHM linewidth (turb) and total FWHM linewidth (tot) (Myers & Benson, 1983) are derived to be 0.16 and 0.47 km s-1, respectively. Because (th) (turb), TUKH122-n is thermally dominated. If there is a velocity gradient across (perpendicular to) the elongation, it may contribute to (turb), but we do not see any hint of such a gradient across the elongation. We observe a slight velocity gradient of 3.6 km s-1 pc-1 along the elongation from feature 8 in Figure 11. Then, the specific angular momentum (2/5 for a sphere) is 1.2 10-3 km s-1 pc. This follows the empirical best-fit relationship obtained by Goodman et al. (1993) for = 0.030.3 pc, or is located slightly lower (smaller ). We derive the ratio of rotational energy to the gravitational energy. We adopt the definition of = (1/3) (Goodman et al., 1993), and obtain = 1.6 10-2. Here, is the angular speed, and is the gravitational constant. This small value ( unity) is close to the typical value of 0.02 obtained in dark cloud cores (Goodman et al., 1993), and indicates that the core is not rotationally supported. Because the axial ratio of the core TUKH122-n is as small as 0.26 and rotation cannot account for core elongation, it is likely that magnetic fields play a key role in the core shaping of TUKH122. Nakano (1998) has concluded that molecular clouds are magnetically supercritical. Crutcher (1999) has shown that the mass-to-magnetic flux ratio is about twice as critical, and static magnetic fields and turbulence (MHD waves) are equally important in cloud energetics. He has concluded that magnetic fields are important in the physics of molecular clouds. Our observations seem to be consistent with his conclusion.
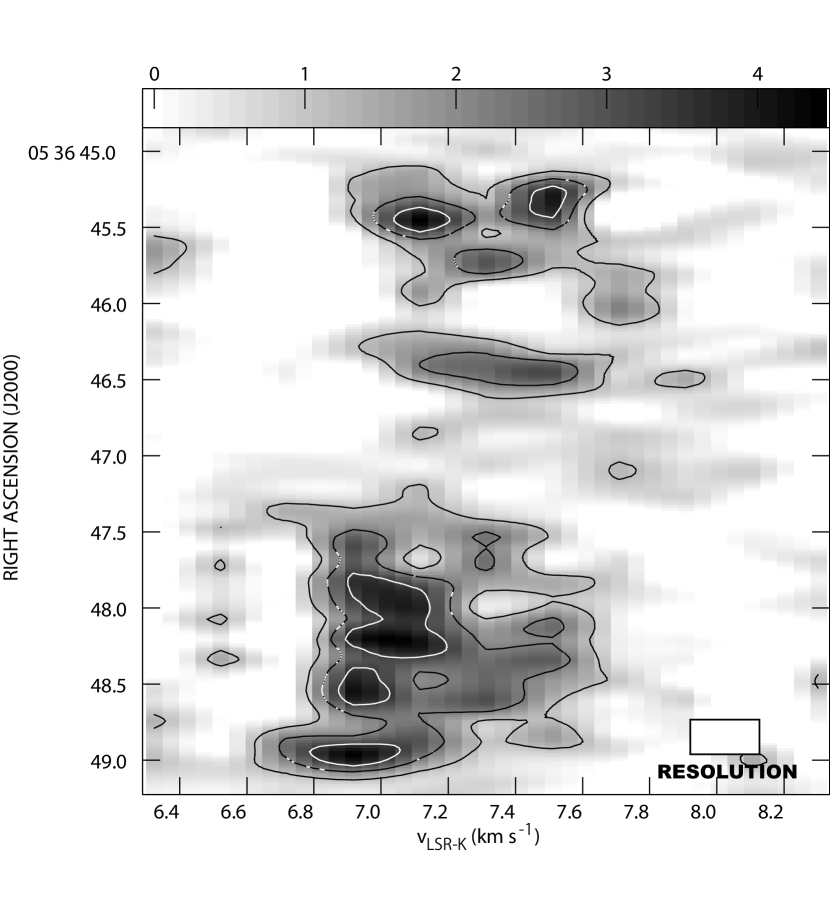
Next, we look into the case of TUKH083. Figure 12 shows the position-velocity diagram along right ascension toward TUKH083 of NH3 hyperfine feature 4. The emission is integrated along declination within a box containing the detected NH3 emission. Precisely, feature 4 consists of eight hyperfine components, and the two most intense components have a frequency difference corresponding to 0.32 km s-1 (Rydbeck et al., 1977). However, for the TUKH083 NH3 core, it is hard to separate hyperfine components in feature 4 because of overcrowding.
3.5 Comparison between TUKH122, TUKH 123, and the dark cloud core L1544
We compare the physical parameters of our cores in Orion and the dark cloud core L1544 in Taurus. To the east of TUKH122, a cluster-forming core TUKH123 accompanying L1641-south3 (Fukui, 1989) containing six protostars (Megeath et al., 2012) is located (Figure 2). Table 4 summarizes the physical parameters of TUKH122 and TUKH123 in the Orion A GMC, and that of L1544 in the dark cloud. The CS = 10 data of TUKH122, and TUKH123 are taken from Tatematsu et al. (1993), and the data of L1544 is taken from Benson & Myers (1989); Tafalla et al. (1998). We adopt the NH3 rotation temperature for Orion cores from Wilson et al. (1999), and converted it to the kinetic temperature using the relation given by Danby et al. (1988). For TUKH122 and TUKH123, Wilson et al. (1999) list upper limits of 15 K, and we adopted = 10 K assuming that they have temperatures similar to those in cores in cold dark clouds. Regarding the radius , we adopt the HWHM (= FWHM/2) radius. The major and minor radius at the half-maximum level are deconvolved values for the synthesized beam. Then, the radius is calculated from a geometrical mean of the major and minor radius. Regarding linewidth, we adopt the definition of the total linewidth (tot) from Myers (1983), which takes into account the difference between the mass of the observed molecule and the mean mass per particle. We use the virial mass instead of the LTE mass here, because the molecular abundance is not precisely known. The virial mass is derived by using the total linewidth instead of the observed linewidth, and therefore is slightly different from those reported in Tatematsu et al. (1993) and Tafalla et al. (1998). The gas density is derived from the radius and virial mass, and defined as = 1.2 (H2) by taking into account the contribution of He. We list the free-fall time estimated from density. Table 4 shows that TUKH122-n in NH3 and L1544 in N2H+ are very similar in the kinetic temperature (10 K), linear size (0.03 pc radius), and mass ( 2 ). It was often suggested that cores in GMCs and those in cold dark clouds are different in the physical properties (e.g. Turner, 1988), but our observations revealed that the Orion A GMC contains at least one core very similar to the dark cloud core.
4 Discussion
4.1 Turbulence in cores
The NH3 cores of TUKH083 and TUKH122 are embedded in the CS core observed by Tatematsu et al. (1993). The thermal Jeans length and mass of the CS core are calculated for the adopted kinetic temperature (table 3). The virial mass of the TUKH122-n core 1.5 is close to the Jeans mass in the parent turbulent CS core. This is consistent with an idea that TUKH122-n has been formed as gravitational instability in the parent turbulent equilibrium core.
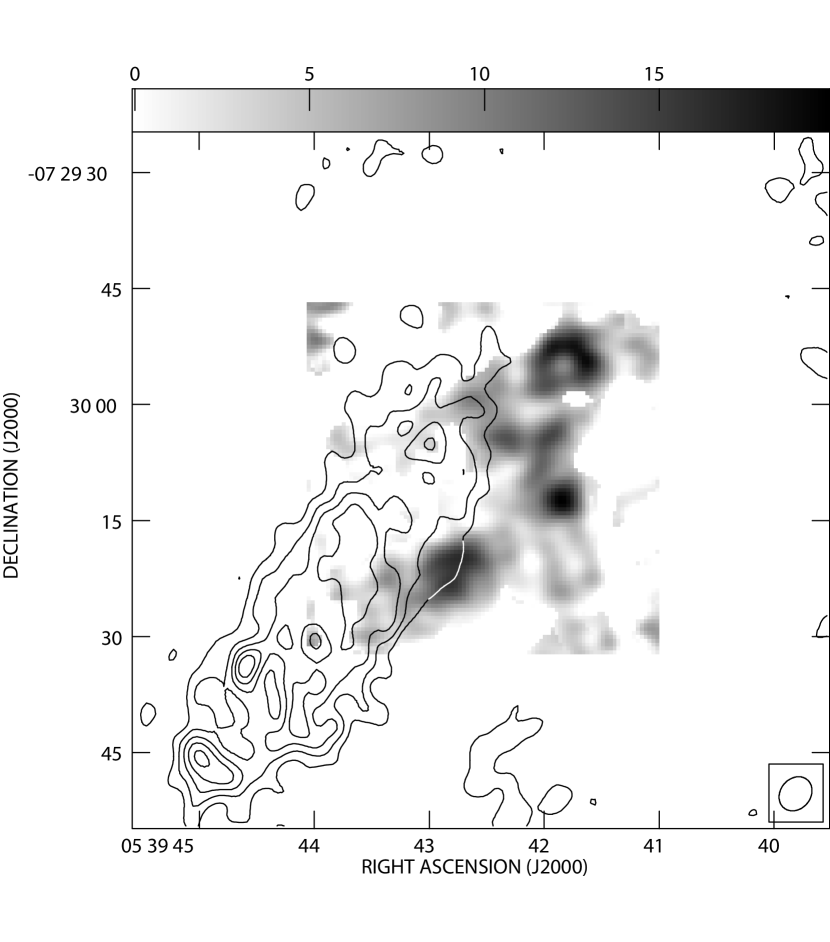
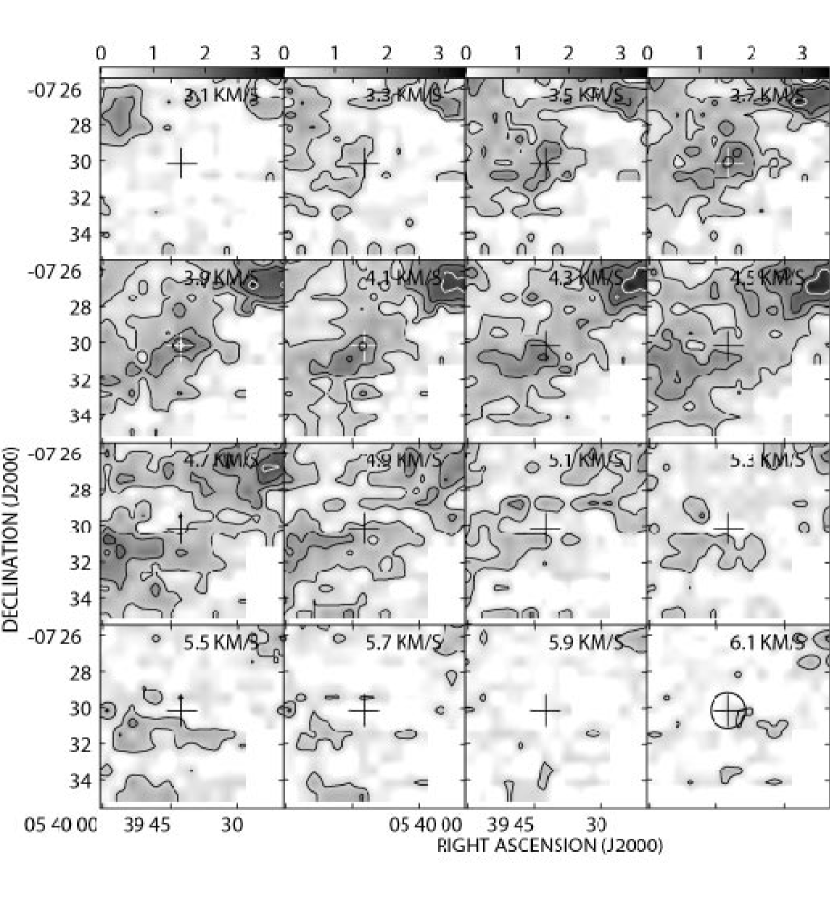
The intrinsic NH3 linewidth in our interferometric observations is as small as 0.20 km s-1. The single-dish CCS = 7 and N2H+ linewidth are 0.270.39 and 0.270.28 km s-1, respectively (Tatematsu et al., 2014), and are almost thermal. On the other hand, the single-dish CS = 10 linewidth toward TUKH122 is as large as 0.83 km s-1 (Tatematsu et al., 1993). According to Tatematsu et al. (1998) the optical depth of this line is 0.9, and therefore the linewidth will not be seriously affected. Figure 13 shows the CS = 10 velocity channel map of Tatematsu et al. (1993) toward TUKH122. The CS emission is centered at the field center of the NH3 and CCS observations, from = 3.6 to 4.2 km s-1. Then, it is observed as a non-thermal, turbulent core. In our observations, the CCS emission is observed only within a range of 0.4 km s-1 toward TUKH122, which is close to the thermal FWHM linewidth. These facts will imply turbulence dissipation in TUKH122: the turbulent TUKH122 CS core ( = 0.18 pc, (tot) = 0.94 km s-1) has formed the quiescent, thermal NH3 core associated with CCS inside. The viral mass and corresponding column density of the TUKH122 CS core is 33 and (H2) = 2.2 1021 cm-2, respectively. This column density is consistent with that obtained from dust continuum observations with the Herschel Observatory (Roy et al., 2013), (H2) = 1.61.9 1021 cm-2 from their figure. Furthermore, the NH3 core looks dynamically relaxed, reminding us of quasistatic evolution. The NH3 and CS cores are located in the CS filament (Figure 2). We suggest that the turbulent equilibrium CS cores are formed from the turbulent filamentary molecular cloud due to the gravitational instability (Hanawa et al., 1993), and the dynamically relaxed thermal NH3 cores are then formed slowly with turbulence dissipation and gravitational instability.
Although the TUKH122 and L1544 NH3 cores are very similar in terms of the kinetic temperature, linear size, and mass, they differ in terms of the mass of parent core: TUKH122 has a turbulent massive ( 30 ) parent core observed, while L1544 has a thermal less-massive ( 10 ) parent core. Indeed, it is known that 0.1 pc-sized cores in the Orion A GMC have systematically larger linewidths and larger masses than similar-size cores in cold dark clouds (Tatematsu et al., 1993). It is possible that such a difference is related to an ability for GMC cores to form star clusters. In dark cloud cores, Goodman et al. (1998); Lai & Crutcher (2000) investigated the single-tracer single-cloud linewidth-size relation, and concluded that linewidth becomes coherent (thermal-motion dominated constant values against radius) on length scales less than 0.1 pc. Pineda et al. (2010) concluded that a transition to coherence occurs at 0.04 pc at B5 in the Perseus cold dark cloud. GMC cores have different linewidth-size relation compared with dark cloud cores Tatematsu et al. (1993); Caselli & Myers (1995). Judging from Figure 6 of Caselli & Myers (1995), the transition in GMC cores may occur at a smaller radius (0.010.1 pc). This is consistent with our observations.
4.2 Comparison between TUKH083 and TUKH122
We found that TUKH083 and TUKH122 are very different in the distribution of the NH3 emission. TUKH083 is clumpy, while TUKH122 has a smooth oval boundary. In CCS, TUKH122 was detected in the interferometric observations, but TUKH083 was not detected. This means that the CCS emission distribution is more compact in TUKH122 than in TUKH083. There are two possibilities. First, because TUKH083 is warmer than TUKH122, different temperatures caused different core formation modes. Second, TUKH083 is younger, and has not been dynamically relaxed yet. From (NH3)/(CCS) and (N2H+)/(CCS) (Tatematsu et al., 2010, 2014), TUKH083 is most likely younger than TUKH122. However, clearly we need more samples to establish the picture of core evolution in various environments in GMCs.
5 Summary
We mapped two starless molecular cloud cores, TUKH083 and TUKH122, in the Orion A GMC in CCS and NH3 with the VLA. The TUKH122 NH3 core (TUKH122-n) is elongated, and has a smooth oval boundary. Where observed, the CCS emission surrounds the NH3 core. This is very similar to N2H+-CCS distribution in the Taurus cores L1544 and L1498. TUKH122-n has an NH3 linewidth of 0.20 km s-1, which implies that the core is thermally supported. The linewidth and shape of the NH3 core seem to represent a dynamically relaxed quiescent core. TUKH122-n (associated with CCS) is embedded in the parent turbulent CS core, which suggests TUKH122-n has formed through turbulence dissipation. The parent core of TUKH122-n is three times more massive than that of L1544, which may suggest difference in the capability of forming the cluster. The physical parameters of TUKH122-n resemble those of the L1544 NH3 core. The virial mass of the TUKH122-n core is 1.5 , and is on the order of the Jeans mass of the parent CS core. TUKH083 was detected in NH3 showing complicated distribution, but not in CCS. The CCS emission toward TUKH083 appears to be resolved out.
References
- Aikawa et al. (2001) Aikawa Y., Ohashi, N., Inutsuka, S., Herbst, E., & Takakuwa, S. 2001, ApJ, 552, 639
- Aso et al. (2000) Aso, Y., Tatematsu, K., Sekimoto, Y., Nakano, T., Umemoto, T., Koyama, K., & Yamamoto, S. 2000, ApJS, 131, 465
- Bally et al. (1987) Bally, J., Langer, W.D., Stark, A.A., & Wilson, R.W. 1987, ApJ, 312, L45
- Ballesteros-Paredes et al. (2003) Ballesteros-Paredes, J., Klessen, R. S., & Vázquez-Semadeni, E. 2003, ApJ592, 188
- Ballesteros-Paredes et al. (2007) Ballesteros-Paredes, J., Klessen, R. S., Mac Low, M.-M., & Vázquez-Semadeni, E. 2007, Protostars and Planets V, B. Reipurth, D. Jewitt, and K. Keil (eds.) (Tucson: University of Arizona Press), 63
- Batrla et al. (1983) Batrla, W., Wilson, T.L., Bastien, P. & Ruf, K. 1983, A&A, 128, 279
- Benson & Myers (1989) Benson, P.J. & Myers, P.C. 1989, ApJS, 71, 89
- Bergin & Tafalla (2007) Bergin, E.A., & Tafalla, M. 2007, ARA&A, 45, 339
- Caselli & Myers (1995) Caselli, P., & Myers, P.C. 1995, ApJ, 446, 665
- Castets et al. (1990) Castets, A., Duvert, G., Dutrey, A., Bally, J., Langer, W.D., & Wilson, R.W. 1990, A&A, 234, 469
- Cesaroni & Wilson (1994) Cesaroni, R., & Wilson, T.L. 1994, A&A, 281, 209
- Chitsazzadeh et al. (2014) Chitsazzadeh, S., Di Francesco, J., Schnee, S., Friesen, R.K., Shimajiri, Y., Langston, G.I., Sadavoy, S.I., Keto, E.R., Pineda, J.E., Takakuwa, S., $ Tatematsu, K. 2014, ApJ, in press
- Chini et al. (1997) Chini, R., et al. 1997, ApJ, 474, L135
- Choi et al. (1995) Choi, M., Evans, N.J., II, Gregersen, E.M., & Wang, Y. 1995, ApJ, 448, 742
- Crutcher (1999) Crutcher, R.M. 1999 ApJ, 520, 706
- Danby et al. (1988) Danby, G., et al. 1988, MNRAS, 235, 229
- Fukui (1989) Fukui, Y., in ESO Workshop on Low Mass Start Formation and Pre-Main Sequence Objects, ed. B. Reipurth (Garching: ESO), 95
- Genzel & Stutzki (1989) Genzel, R., & Stutzki, R. 1989, ARA&A, 27, 41
- Goodman et al. (1993) Goodman, A.A., Benson, P.J., Fuller, G.A., & Myers, P.C. 1993 ApJ, 406, 528
- Goodman et al. (1998) Goodman, A.A., Barranco, J.A., Wilner, D.J., & Heyer, M.H. 1998 ApJ, 504, 223
- Hanawa et al. (1993) Hanawa, T., Nakamura, F., Matsumoto, T., Nakano, T., Tatematsu, K., Umemoto, T., et al. 1993, ApJ404, L83; Erratum, 1993, 412, L75
- Hirota, Ohishi, & Yamamoto (2009) Hirota, T., Ohishi, M., & Yamamoto, S. 2009, ApJ, 699, 585
- Ho & Townes (1983) Ho, P.T.P., & Townes, C.H. 1983, ARA&A, 21, 239
- Ikeda et al. (2007) Ikeda, N., Sunada, K., & Kitamura, Y. 2007, ApJ, 665, 1194
- Johnstone & Bally (1999) Johnstone, D., & Bally, J. 1999, ApJ, 510, L49
- Johnstone & Bally (2006) Johnstone, D., & Bally, J. 2006, ApJ, 653, 383
- Keto & Burkert (2014) Keto, E., & Burkert, A. 2014, MNRAS, 441,1468
- Kim et al. (2008) Kim, M.K., et al. 2008, PASJ, 60, 991
- Lada et al. (2003) Lada, C.J., Bergin, E.A., Alves, J.F., Huard, T.L. 2003, ApJ, 586, 286
- Lai & Crutcher (2000) Lai, S.-P., & Crutcher, R.M. 2000, ApJS, 128, 271
- Lis et al. (1998) Lis, D.C., Serabyn, E., Dowell, C.D., Benford, D.J., Phillips, T.G., Hunter, T.R., & Wang, N. 1998, ApJ, 509, 299
- Lombardi et al. (2014) Lombardi, M., Bouy, H., Alves, J., & Lada, C.J. 2014, A&A, in press
- Megeath et al. (2012) Megeath, S.T., et al. 2012, ApJ, 144, 192
- Myers & Benson (1983) Myers, P.C., & Benson, P.J. 1983, ApJ, 266, 309
- Myers (1983) Myers, P.C. 1983, ApJ, 270, 105
- Myers et al. (1991) Myers, P.C., Fuller, G.A., Goodman, A.A., & Benson, P.J. 1991, ApJ, 376, 561
- Nagahama et al. (1998) Nagahama, T., Mizuno, A., Ogawa, H., & Fukui, Y. 1998, ApJ, 116, 336
- Nakano (1998) Nakano, T. 1998, ApJ, 494, 587
- Pineda et al. (2010) Pineda, J.E., Goodman, A.A., Arce, H.G., Caselli, P., Foster, J.B., Myers, P.C., & Rosolowsky, E.W. 2010, ApJ, 712, L116
- Pineda et al. (2011) Pineda, J.E., Goodman, A.A., Arce, H.G., Caselli, P., Longmore, S., & Corder, S. 2011, ApJ, 739, L2
- Roy et al. (2013) Roy, A., Martin, P.G., Polychroni, D., Bontemps, S., Abrgel, A., André, P., et al. 2013, ApJ, 763, 55
- Rydbeck et al. (1977) Rydbeck, O.E.H, Sume, A., Hjalmarson, Å, Elldér, J., Rönnäng, B.O., & Kollberg, E. 1977, ApJ, 215, L35
- Shu et al. (1987) Shu, F.H., Adams, F.C., & Lizano, S. 1987, ARA&A, 25, 23
- Suzuki et al. (1992) Suzuki, H., Yamamoto, S., Ohishi, M., Kaifu, N., Ishikawa, S.-I., Hirahara, Y., & Takano, S. 1992, ApJ, 392, 551
- Tafalla et al. (1998) Tafalla, M., Mardones, D., Myers, P.C., Caselli, P., Bachiller, R. & Benson, P.J. 1998 ApJ, 504, 900
- Takahashi et al. (2013) Takahashi, S., Ho, P.T.P, Teixeira, P.S., Zapata, L.A., & Su, Y.-N. 2013, ApJ, 763, 57
- Tatematsu et al. (1993) Tatematsu, K., et al. 1993, ApJ, 404, 643
- Tatematsu et al. (1998) Tatematsu, K., Umemoto, T., Heyer, M. H., Hirano, N., Kameya, O., & Jaffe, D. T. 1998, ApJS, 118, 517
- Tatematsu et al. (2008) Tatematsu, K., Kandori, R., Umemoto, T., & Sekimoto, Y. 2008, PASJ, 60, 407
- Tatematsu et al. (2010) Tatematsu, K., Hirota, T., Kandori, R., & Umemoto, T. 2010, PASJ, 62, 1473
- Tatematsu et al. (2014) Tatematsu, K., Ohashi, S., Umemoto, T., Lee, J.-E., Hirota, T., Yamamoto, S., et al. 2014, PASJ, 66, 16
- Turner (1988) Turner, B.E. 1988, in Galactic and Extragalactic Radio Astronomy, ed. G.L. Vershuur & K.I. Kellermann (2d ed.; New York: Springer-Verlag), 154
- Wilson et al. (1999) Wilson, T.L., Mauersberger, R., Gensheimer, P.D., Muders, D., & Bieging, J.H. 1999, ApJ, 525, 343
- Yamamoto et al. (1990) Yamamoto, S, Saito, S., Kawaguchi, K., Chikada, Y., Suzuki, H., Kaifu, N., Ishikawa, S. & Ohishi, M. 1990, ApJ, 361, 318
- Zhou et al. (1993) Zhou, S., Evans, N.J., II, Kümpe, C. & Walmsley, C.M. 1993, ApJ, 404, 232
- Zhou (1995) Zhou, S. 1995, ApJ, 442,685
| Date | Observation File Name | Band | Number of Usable Antennas | Used for Image? |
|---|---|---|---|---|
| 2010 August 29 | AT375sb169699881 | Q | 23 | Yes |
| 2010 September 2 | AT375sb1709698 | Q | 25 | Yes |
| 2010 September 2 | AT375sb1709503 | K | 27 | Yes |
| 2010 September 7 | AT375sb17100881 | Q | 22 | Yes |
| 2010 September 8 | AT375sb17098931 | Q | 25 | No |
| 2010 September 9 | AT375sb16971741 | K | 24 | No |
| TUKH083 | TUKH122 | |
|---|---|---|
| Phase Center RA (J2000.0) | 5h36m470 | 5h39m425 |
| Phase Center DEC (J2000.0) | 63156 | 73009 |
| Synthesized Beam at K | 4233 PA = 13.8 | 4231 PA = 1.0 |
| Synthesized Beam at Q | 4737 PA = 33.6 | 4739 PA = 39.7 |
| Primary Beam Size at K | 190 | 190 |
| Primary Beam Size at Q | 099 | 099 |
| rms Noise Level at K at 15.625 kHz (0.20 km s) resolution | 2.3 mJy beam-1 | 2.6 mJy beam-1 |
| rms Noise Level at Q at 31.25 kHz (0.20 km s) resolution | 17 mJy beam-1 | 15 mJy beam-1 |
| Line | TUKH | Suffix | RA | DEC | Flux Density | PAdeconv | ||||||
|---|---|---|---|---|---|---|---|---|---|---|---|---|
| h | m | s | mJy beam-1 km s-1 | |||||||||
| NH3 | 083 | -n1 | 5 | 36 | 45.34 | 6 | 31 | 42.0 | 3.5 | 9.6 | 4.8 | 122.5 |
| NH3 | 083 | -n2 | 5 | 36 | 45.37 | 6 | 31 | 49.4 | 4.5 | 7.3 | 5.4 | 62.2 |
| NH3 | 083 | -n3 | 5 | 36 | 45.77 | 6 | 31 | 55.1 | 4.9 | 3.8 | 1.3 | 30.4 |
| NH3 | 083 | -n4 | 5 | 36 | 46.43 | 6 | 32 | 0.7 | 3.5 | 6.3 | 2.9 | 2.9 |
| NH3 | 083 | -n5 | 5 | 36 | 48.26 | 6 | 32 | 0.3 | 4.2 | 18.2 | 13.3 | 73.7 |
| NH3 | 122 | -n | 5 | 39 | 43.85 | 7 | 30 | 26.0 | 10.6 | 56.3 | 14.9 | 147.6 |
| NH3 | 122 | -n1 | 5 | 39 | 44.57 | 7 | 30 | 34.0 | 13.0 | 6.3 | 3.4 | 163.1 |
| NH3 | 122 | -n2 | 5 | 39 | 44.89 | 7 | 30 | 46.8 | 11.8 | 8.5 | 6.5 | 50.4 |
| CCS | 122 | -c1 | 5 | 39 | 41.76 | 7 | 29 | 54.1 | 18.2 | 10.8 | 6.1 | 118.9 |
| CCS | 122 | -c2 | 5 | 39 | 41.90 | 7 | 30 | 12.0 | 18.1 | 6.3 | 4.2 | 60.6 |
| CCS | 122 | -c3 | 5 | 39 | 42.77 | 7 | 30 | 21.5 | 17.3 | 10.0 | 5.8 | 126.2 |
| TUKH122-n | TUKH122 aaTatematsu et al. 1993 | TUKH123 aaTatematsu et al. 1993 | L1544 bbTafalla et al. 1998 | L1544 bbTafalla et al. 1998 | |
|---|---|---|---|---|---|
| (K) | 15 ccWilson et al. 1999 | 15 ccWilson et al. 1999 | 15 ccWilson et al. 1999 | 9.8 ddBenson & Myers 1989 | 9.8 ddBenson & Myers 1989 |
| adopted (K) | 10 | 10 | 10 | 9.8 | 9.8 |
| Molecule | NH3 | CS = 10 | CS = 10 | N2H+ = 10 | C18O = 10 |
| (obs) (km s-1) | 0.20 | 0.83 | 1.16 | 0.37 | 0.30 |
| (tot) (km s-1) | 0.50 | 0.94 | 1.24 | 0.56 | 0.52 |
| (pc) | 0.03 | 0.18 | 0.23 | 0.03 | 0.16 |
| () | 1.5 | 33.0 | 74.3 | 2.1 | 9.2 |
| (cm-3) | 2.7E+05 | 2.4E+04 | 2.6E+04 | 2.8E+05 | 9.3E+03 |
| (yr) | 6.6E+04 | 2.2E+05 | 2.1E+05 | 6.4E+04 | 3.5E+05 |
| (pc) | 0.03 | 0.08 | 0.08 | 0.02 | 0.13 |
| () | 0.3 | 0.8 | 0.8 | 0.2 | 1.3 |