Rapid Evolution of the Innermost Dust Disk of Protoplanetary Disks Surrounding Intermediate-mass Stars
Abstract
We derived the intermediate-mass (1.5–7 ) disk fraction (IMDF) in the near-infrared JHK photometric bands as well as in the mid-infrared (MIR) bands for young clusters in the age range of 0 to 10 Myr. From the JHK IMDF, the lifetime of the innermost dust disk (0.3 AU; hereafter the disk) is estimated to be 3 Myr, suggesting a stellar mass () dependence of -disk lifetime . However, from the MIR IMDF, the lifetime of the inner disk (5 AU; hereafter the MIR disk) is estimated to be 6.5 Myr, suggesting a very weak stellar mass dependence (). The much shorter -disk lifetime compared to the MIR-disk lifetime for intermediate-mass (IM) stars suggests that IM stars with transition disks, which have only MIR excess emission but no -band excess emission, are more common than classical Herbig Ae/Be stars, which exhibit both. We suggest that this prominent early disappearance of the disk for IM stars is due to dust settling/growth in the protoplanetary disk, and it could be one of the major reasons for the paucity of close-in planets around IM stars.
keywords:
circumstellar matter – planetary systems: formation – planetary systems: proto-planetary discs – stars: pre-main-sequence – infrared: stars – stars: variables: T Tauri, Herbig Ae/Be.1 Introduction
Understanding protoplanetary disks is not only essential for understanding the star formation process, it is also critical for understanding planet formation (e.g. Lada & Lada, 2003). The lifetime of protoplanetary disks is one of the most fundamental parameters of a protoplanetary disk because it directly restricts the time for planet formation (e.g. Williams & Cieza, 2011). Many studies that derive the lifetime of protoplanetary disks are now available. In a pioneering work, Strom et al. (1989) studied the frequency of disk-harbouring stars with known ages in the Taurus molecular cloud that have a -band excess and suggested that the disk lifetime is in the range from 3 Myr to 10 Myr. Subsequently, a more direct method using the ‘disk fraction’, which is the frequency of near-infrared (NIR) or mid-infrared (MIR) excess stars within a young cluster with an assumed age, has been widely adopted to study the disk lifetime following the work by Lada (1999) and Haisch, Lada & Lada (2001a). Using the disk fraction that monotonically decreases as a function of cluster age, the disk lifetime is estimated at about 5–10 Myr in the solar neighborhood (Lada 1999; Haisch et al. 2001a; Hernández et al. 2008; see also Yasui et al. 2010). Mamajek (2009) compiled disk fractions for about 20 clusters and derived the characteristic disk decay time-scale () of 2.5 Myr, assuming the disk .
These estimated disk lifetimes were mainly derived from the disk fraction with all detected cluster members and thus the estimated lifetime has been primarily for low-mass stars (2 ), considering the characteristic mass of the initial mass function (IMF) (0.3 , Elmegreen, 2009) and the typical stellar mass detection limit (0.1 ). However, a number of assessments of the effect of the stellar mass dependence of the disk lifetime have recently suggested a shorter disk lifetime for the higher-mass stars (e.g. Hernández et al., 2005; Carpenter et al., 2006; Kennedy & Kenyon, 2009). Although the existence of disks of high-mass stars (8 ) is still under debate (e.g. Mann & Williams, 2009; Fuente et al., 2002), the disks of IM stars have been extensively studied and are well characterized (Hernández et al., 2005, 2007a, 2008). IM stars with optically thick disks are known as Herbig Ae/Be (HAeBe) stars. They were originally discovered with strong emission-lines by Herbig (1960). After Hernández et al. (2004) established the method for selecting HAeBe stars using the spectral energy distribution (SED) slope from the -band to the IRAS 12-m band, Hernández et al. (2005) derived the HAeBe-star disk fraction for six clusters in the age range of 3–10 Myr. They showed that the disk fraction is lower compared to the previously derived disk fraction for low-mass (LM) stars, in particular by a factor of 10 lower at 3 Myr.
Recently, the disk fraction studies have shifted to longer wavelengths (MIR or submm) mainly because of the interest in tracing the outer disk, where most of the disk mass resides (Williams & Cieza, 2011). However, the disk fractions can also be estimated using only JHK data, in particular, for the IM stars. Originally, the disk lifetime was estimated with disk fractions derived by using the color–color diagram based on imaging in the JHK and JHKL photometric bands (e.g. Haisch et al., 2001a; Lada, 1999). After the advent of the Spitzer Space Telescope, the SED slope () in the MIR wavelength range (3.6, 4.5, 5.8, and 8.0 m) is used for selecting disk-harbouring stars (e.g. ; Lada et al. 2006). However, the derived disk fractions and disk lifetime with Spitzer data were found to be almost the same as those with JHKL data (see Sicilia-Aguilar et al. 2006; Hernández et al. 2008), and even with JHK data (Lada, 1999; Yasui et al., 2010). Although the NIR disk fractions are known to show values systematically smaller and with a larger uncertainty due to contamination of the non–disk-harbouring stars on the colour–colour diagram (Haisch et al., 2001b; Yasui et al., 2010), Hernández et al. (2005) showed that the JHK colour–colour diagram can clearly distinguish disk-harbouring IM stars from non-disk IM stars. The JHK disk fraction value is robust both because of the large infrared excess and the higher stellar effective temperature of the IM stars, compared to LM stars.
In this paper, we derived the JHK IMDF using the Two Micron All Sky Survey (2MASS) Point Source Catalog of a large number (20) of well-established nearby ( kpc) young clusters with an age span of 0 to 10 Myr in order to quantitatively and comprehensively study the lifetime of protoplanetary disks surrounding IM stars (1.5–7 ). In particular, we included as many clusters as possible with ages 5 Myr. To securely identify IM cluster members, we made use of the spectral types of each cluster member from the literature, assuming a single age for each cluster. With the derived JHK IMDFs for a large number of younger clusters (5 Myr), we estimated the disk lifetime of the IM stars. We then estimated the stellar mass dependence of the disk lifetime by comparing the lifetime of IM stars to that of LM stars. We also derived the MIR IMDFs with Spitzer data in the literature to compare them to the JHK IMDFs. We found that the derived JHK IMDFs are significantly lower than the MIR IMDFs, in particular at younger ages (3 Myr), which results in shorter lifetime of the disk than the MIR disk. This suggests a potentially larger fraction of ‘transition disks’ for IM stars compared to those for LM stars. We discuss the implications of these results for dust growth and planet formation.
Because the sample clusters and the selection of the IM stars is critical for this paper, we discuss this in detail in Section 2. The definition and derivation of the JHK IMDF and the MIR IMDF are described in Sections 3 and 4, respectively. Before interpreting the results of the IMDFs, the definition of the disk lifetime is discussed in Section 5. Section 6 then discusses the results for JHK IMDFs. The mid-IR disk fraction is discussed in Section 7. Subsequently, Section 8 discusses the large difference between JHK and MIR IMDFs found in this study and potential disk evolution consequences for IM stars. Finally, Section 9 discusses the possible physical mechanisms of this rapid evolution of the disk. At the end, in Section 10, we briefly discuss possible implications for planet formation. Section 11 summarizes this paper.
2 Target Clusters and Selection of Intermediate-mass Star Samples
2.1 Target clusters
We selected our target clusters from previous studies of the disk fraction/disk evolution (Haisch et al. 2001a; Hernández et al. 2005, Hernández et al. 2008; Kennedy & Kenyon 2009; Mamajek 2009; Gáspár et al. 2009; Fedele et al. 2010; Roccatagliata et al. 2011). For estimating the disk lifetime with acceptable accuracy, it is necessary to derive the IMDFs for as many as young clusters as possible, ideally more than ten. We thus selected our target young clusters from the above papers, but with the following criteria: (1) Cluster ages are spaced from 0 to 10 Myrs, to cover the time period of disk dispersal. (2) The cluster membership is well defined from a variety of observations (astrometry, radial velocity, variability, H, X-ray, NIR excess, MIR excess, optical spectroscopy, NIR spectroscopy, etc.). This criterion naturally leads to clusters in the solar neighborhood (distance 1.5 kpc). (3) The spectral types of a large number of cluster members are available by spectroscopy. (4) Well-defined NIR and MIR photometry of the cluster members with is published or in a widely available catalogue, such as 2MASS. (5) At least three IM stars are available per cluster for IMDF derivation.
The resultant 19 target clusters are summarized in Table 1 along with the age, distance, and references for the disk fraction study. Almost all young (5 Myr) clusters in the references (Table 1) are included, though three young clusters (MBM 12, NGC 6231, and NGC 7129) are excluded. This is because it appears that no IM stars are present in MBM 12 (Luhman, 2001) and the spectral types of stars in NGC 6231 and NGC 7129 are limited only to brightest members (OB, A stars), and is not adequate to cover the entire IM star mass range down to 1.5 . Some older clusters (5 Myr), mostly those from Fedele et al. (2010), are excluded because they do not satisfy the above criterion. For several well-known clusters within the target clusters (Trapezium, Ori OB1a, Ori OB1bc, Per OB2), we could derive only JHK disk fractions because we could not find published Spitzer MIR data for the IM stars, probably because of saturation. As a result, we obtained the JHK IMDF for 19 clusters and the MIR IMDF for 13 clusters.
2.2 Selection of intermediate-mass stars
Although the original definition of mass for HAeBe is 2–10 with spectral types of B and A (and in a few cases F) (Herbig, 1960), the presence of disks around stars earlier than B5 (6–7 in the main-sequence phase) is not well established since the disk lifetime of high-mass stars is very rapid, e.g. 1 Myr (Zinnecker & Yorke, 2007; Fuente et al., 2002). Also, the number of high-mass stars (6–7 ) is very small because of the IMF, and the number stochastically fluctuates from cluster to cluster. Therefore, we set the upper-mass limit as 7 in this paper. This is also a good match with the mass range of the isochrone model by Siess, Dufour & Forestini (2000) (), which is used throughout this paper. As for the lower-mass limit, we employed 1.5 , which corresponds to spectral type ‘F1’ for main sequences, following past comprehensive works of disks for IM stars by Hernández et al. (2005) and Kennedy & Kenyon (2009). The latter defined a mass range bin of 1.57 , which can be directly compared to our results.
The IM star selection is a critical item for this study. Ideally, stellar mass and the age of each cluster member are determined from the HR diagram with the extinction-corrected luminosity and spectroscopically determined effective temperature through an isochrone model. However, this requires a time-consuming observational program, and thus the number of target clusters is limited as in the previous studies. Even if we had the complete observational data, the value of mass and age depends on the isochrone model, and could strongly depend on the extinction correction with different RV (e.g. Hernández et al. 2004, 2005). Another approach is to use a limited number of parameters, such as only the spectral type, to pick up cluster members in a broad mass range, such as IM or LM stars, and to use a larger number of clusters. Although sacrificing the accuracy of the mass estimate, a study including a larger number of clusters is possible. Although some past studies, in fact, focus on targets of certain spectral types (e.g. earlier than F1) to pick up IM stars (Hernández et al. 2005; Uzpen, Kobulnicky & Kinemuchi 2009), the true mass for a star of a certain spectral type varies with the age of the star, and such spectral-type–limited samples should be viewed with caution (Kennedy & Kenyon 2009). We assume the cluster age is the age of the members in the selection of the IM stars.
The choice of the isochrone model is critical for the mass estimate. Although a number of recent isochrone models are available (e.g., such as Yi, Kim, & Demarque, 2003; Tognelli, Prada Moroni, & Degl’Innocenti, 2011), we choose Siess et al. (2000) because it is the most used isochrone track in the target mass range with the reliability through various tests and application to many observational data. Using dynamically and kinematically determined stellar masses, Hillenbrand & White (2004) confirmed that virtually any isochrone model provides similar mass estimate for masses more than 1.2 . Hillenbrand & White (2004) also noted that the introduction of new isochrone models tend to bring new systematic uncertainty and should be used with caution. For this study, using Siess’s isochrone is also critical for comparison with the previous studies which used Siess’s isochrone in most cases (e.g., Kennedy & Kenyon 2009).
We take particular note of the fact that the age spread of young clusters in the solar neighborhood is in many cases small enough so that a single age can be assumed for each cluster (see Table 1). Therefore, the boundary masses of the IM stars (7 and 1.5 ) theoretically correspond to a unique spectral type for each cluster, which enables IM star selection only with the spectral type of the members without considering differential extinction. This method should be effective, in particular, for IM stars because most of the time they evolve along the Henyey track, which is roughly horizontal on the HR diagram, and even when the IM stars are on Hayashi track before switching to the Henyey track, the spectral type does not change because the track is almost vertical on the HR diagram. Table 2 shows the unique spectral types corresponding to the boundary masses for each cluster age based on the isochrone model by Siess et al. (2000).
However, there are several points to take note for using the above method in selecting the IM stars. First, each spectral type, in particular the later spectral type (G7–K5), corresponds to a slightly broader mass range as shown in the third column of Table 2. For example, the boundary spectral type K5 corresponds to 1.2–1.5 for the age of 2 Myr. Therefore, the sampling by spectral type naturally leads to the inclusion of stars with a mass of slightly lower than the nominal 1.5 . Next, note that the age spread of each cluster may cause contamination of lower-mass stars in our IM-star samples in the case where the age of the star is older than the cluster age. Table 2 also shows the possible mass range for an age spread of Myr, which is the maximum possible age spread in most cases (typically Myr: see Table 1). Although the age of most stars are within the age spread of 2 Myr, there are 15 % stars at most which are older than the age spread and are actually lower-mass stars (see Figs. 1–5 in Palla & Stahler 2000). Lastly, the distance uncertainties of target clusters may also influence on the selection of the IM stars. The typical uncertainties of distance is about 10 % for the clusters in the solar neighborhood (Reipurth, 2008a, b). For the clusters studied by Hernández et al. (2005), the uncertainties are even smaller (less than 5 %) with Hipparcos data. For deriving the mass and age of a star on H-R diagram, the effective temperature is independent of the distance because it is derived from spectroscopy, while luminosity is directly affected. However, the luminosity can differ by only 0.2 mag with the assumed distance uncertainties, which then cause a mass difference of 0.1 around lower mass limit of this study, 1.5 111Note that the age differences are 1 Myr for stars 3 Myr and 2 Myr for older stars. These differences are within the age spread (2 Myr) we are considering., from the isochrone models by Siess et al. (2000) in the target age range of this paper (11 Myr). Because this mass uncertainty is very small, the distance uncertainties for the selection of IM stars does not affect our results. The above three points (or any other unconsidered uncertainties) might mask the possible lifetime difference between IM and LM stars. However, if we find any significant difference, it is likely to be real and should be clearly seen with better selected IM-star samples in the future. Note that contamination of higher-mass stars can occur, but that should not affect the lifetime differences between the disks of IM and LM stars. We discuss the effect of IM star selection on the derived IMDF in section 8.1.2.
2.3 Selected samples
We searched the literature to gather all of the available spectral type information for the stars in the sample clusters. We then made a list of all the IM stars by selecting cluster members by spectral type earlier than that of the lower-mass boundary and also later than that of the higher-mass boundary. The clusters chosen are shown in column 1 and the references to the papers from which the IM stars were selected is shown in column 2 of Table 3. Following the fifth criterion in Section 2.1, we removed any target clusters for which less than three IM stars can be identified. Also, because IMDFs for clusters with age of 5 Myr are found to be 0 per cent as discussed in the following sections, we obtained IMDFs for only about 10 clusters. Disk fractions for clusters with age of 5 Myr are the most useful for studying stellar mass dependence of disk dispersal (cf. Kennedy & Kenyon 2009).
As a result, the total number of stars used for deriving JHK and MIR IMDF become 799 and 365, respectively. In Appendix A, the IM star samples for all clusters are summarized in tables as well as in colour-colour diagrams. For the following five clusters, the spectral type information for lower-mass stars in the literatures is incomplete, and we could not reach to the mass-limit of 1.5 : Vel (F5: 2 ), Ori (G0: 2 ), Per OB2 (G8:1.8 ), OB1bc (G3: 2.2 ), and OB1a (G6:1.7 ). Although it is desirable to set exactly the same mass limit, such as 2 , we used 1.5 as the lowest mass for the other clusters in order to obtain as many IM stars as possible.222We checked how much the IMDF changes with a mass limit of 2 and confirmed that the resultant IMDFs do not change within the uncertainty.
3 JHK IMDF
The optical-NIR SED difference between stars with and without disks is more prominent for IM stars than LM stars (Lada & Adams, 1992; Carpenter et al., 2006). This is mainly because the stellar SED for stars with higher masses peaks at the shorter wavelength side of the and bands (e.g. 0.3 m for A0V stars, with mass of 3 and of 9790 K; Cox 2000) compared to the disk SED that peaks near the band (2 m). HAeBe stars also have a large infrared excess from the optically thick disk ‘wall’, which arises from the inner edge of the disks and where dust disk is so hot as to evaporate (Natta et al. 2001; Dullemond, Dominik & Natta 2001). Therefore, even in the case of using only JHK photometry, IM stars with disks can be much more easily and more accurately selected than LM stars with disks. Indeed, Hernández et al. (2005) found an intrinsic region for HAeBe stars on a JHK colour–colour diagram (see their fig. 2). Also, the photometric uncertainties for IM stars in nearby clusters are very small, typically 0.02 mag for all JHK-bands. We make use of these characteristics to derive the JHK IMDF for each target cluster with the selected sample of IM stars.
3.1 Identification of IM stars in the colour–colour diagram
On the JHK colour–colour diagram, the stars with disks are known to be lying in the infrared-excess region that is separated from the region of stars without disks (e.g. Lada & Adams, 1992). For low-mass stars, disk fractions of various young clusters have been derived using JHK colour–colour diagram (Lada 1999; Yasui et al. 2010; see also Hillenbrand 2005). For IM stars, Lada & Adams (1992) showed that HAeBe stars occupy completely separated regions even from those for classical Be (CBe) stars based on the modelling of disk emission. CBe stars show near-infrared excess from gaseous free-free emission and are often confused with HAeBe stars, but the disk excess from HAeBe stars is much larger. After Hernández et al. (2005) defined the locus of HAeBe stars on the intrinsic JHK colour–colour diagram, Wolff, Strom & Rebull (2011) identified HAeBe stars of IC 1805 using their definition. Comerón et al. (2008a) defined the disk excess region for HAeBe stars on the JHK colour–colour diagram (non-intrinsic) by using a line that passes through and is parallel to the reddening vector as a border-line between the HAeBe stars and CBe stars.
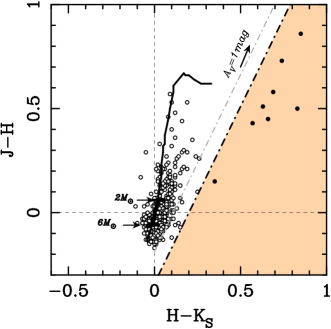
In Fig. 1, we plot the observed colors of the HAeBe stars (filled circles) and the CBe stars (open circles) for all the samples in Hernández et al. (2005, Upper Sco, Lac OB1, Ori OB 1a, Ori OB 1bc, and Tr 37) on the JHK colour–colour diagram. This shows that the HAeBe stars are spatially separated from the main-sequence track (Bessell & Brett, 1988, black line in the colour–colour diagram). Note that the data points shown are not corrected for reddening. There is a clear division between HAeBe stars and other objects, and a border-line can be set as the dot-dashed line, which passes through the point of and is parallel to reddening vector (black arrow). This border-line is slightly shifted to the right compared to Comerón et al.’s border-line (Fig. 1) to completely avoid contamination from CBe stars. Hereafter, we call the right-side region of the border-line the ‘IM disk excess region’ (orange shaded region). This border-line is more precise for dividing HAeBe stars and CBe stars than that of Comerón et al. (2008a) (gray dot-dashed line in Fig. 1) because some CBe stars are included in the IM disk excess region when using Comeron’s border-line. Therefore, we use the line passing through as the border-line, and the JHK IMDF is defined to be the ratio of the stars located in the IM disk excess region to the total number of stars in a cluster that are selected with the criteria in Section 2.2.
Note that there is a well-known classification for HAeBe stars by Meeus et al. (2001), Group I for younger flared disk phase and Group II for older flat disk phase. We confirmed that all stars in Group I and II, except for one star (HD 135344 in Group I) out of 14 stars, are recognized as HAeBe stars in our method.
.
3.2 Determination of the IMDF
We used the 2MASS Point Source Catalog333 http://www.ipac.caltech.edu/2mass/releases/allsky/doc/sec6_2.html to obtain the JHK magnitudes of all the sample IM stars. We rejected all IM stars that do not have an ‘A’ photometric quality flag (signal-to-noise 10 for all JHK bands) in the 2MASS catalogue. We then obtained the IMDF of the IM stars from the JHK colour–colour diagrams of each target cluster.
From previous studies of the disk fractions for low-mass stars, the systematic errors of the disk fraction are known to be less than the statistical errors when using data with small photometric uncertainties (Liu, Najita & Tokunaga 2003; Yasui et al. 2009). The present data should be in the same situation in view of the small uncertainties in JHK photometry of the IM star samples. For estimating the statistical errors of the disk fraction, we assumed that the errors are dominated by Poisson errors (), and we used for the one-sigma uncertainty of the disk fraction, where is the number of stars with optically thick disks ( HAeBe stars) and is the number of all cluster members, respectively. However, if the number of HAeBe stars is zero, the statistical error was calculated assuming one HAeBe star in the examined target cluster to give a one-sigma uncertainty of (e.g. Hernández et al., 2005). Table 3 summarizes the derived JHK IMDFs for all the target clusters.
4 MIR IMDF
In the previous studies utilizing the data from the Spitzer Space Telescope, the SED slope (; Adams, Lada & Shu 1987) in the MIR wavelength range (3.6, 4.5, 5.8, and 8.0 m) is used for selecting disk-harbouring stars (e.g. ; Lada et al. 2006; Hernández et al. 2007b). The number of such IM stars should be precisely determined with this method since disks show a large flux excess compared to the central star continuum in the MIR. For the derivation of the MIR IMDF, we made use of the published Spitzer photometric results in the literature because of the signal-to-noise and uniformity across target clusters.
For the definition of the MIR disk fraction, we followed the procedure by Kennedy & Kenyon (2009), who derived using the SED slope of Spitzer’s Infrared Array Camera (IRAC) [3.6] to [8] and regarded those with as cluster members with MIR dust disks. We estimated of the IM stars only in the cases where reliable photometry in all four IRAC bands is available. However, for the derivation of , we used only [3.6] and [8.0] because those two bands determine for almost all cases. For several clusters (e.g. IC 348, which shows moderate extinction), we cross-checked our values with those in the literature (Hernández et al., 2008) and confirmed that they are almost the same. Following Kennedy & Kenyon (2009), we set the boundary at to separate all the IM stars into the categories of ‘with disk’ and ‘without disk’.
For the target clusters with published Spitzer data (13 clusters out of 19 target clusters; see Table 3), we estimated for the IM stars. Unfortunately, the MIR Spitzer photometry of some IM stars in the nearby star-forming regions could not be obtained because they are too bright for Spitzer. Therefore, the number of IM stars for the MIR IMDF is, in most cases, less than those for the JHK IMDF (e.g. Tr 37). In some cases, we have more sample stars for the MIR than those for JHK (e.g. Ori) because some of the MIR stars do not have good JHK photometry with 2MASS. In this case, we calculated the MIR IMDF by rationing the number of stars with disks by the total number of stars in each MIR sample. The results are summarized in Table 3. The treatment of uncertainty is similar to that for the JHK IMDF, as described in Section 3).
5 Definition of the disk lifetime
Different terms have been used for the disk dispersal time-scale,: e.g. disk lifetime (Lada, 1999; Haisch et al., 2001a; Hernández et al., 2008), disk decay time-scale (Mamajek, 2009), and disk dissipation time-scale (Fedele et al., 2010). These terms are based on the observed cluster age–disk fraction plot with age on the horizontal axis and disk fractions on the vertical axis. However, these terms are not consistently used. Moreover, the value of disk fraction at zero age has not been considered with care because these studies are performed mainly for low-mass stars and all low-mass stars are thought to initially have disks in the standard picture of low-mass star formation (Shu, Adams & Lizano, 1987). Since this may not be the case for IM stars, we define these terms explicitly in this section.
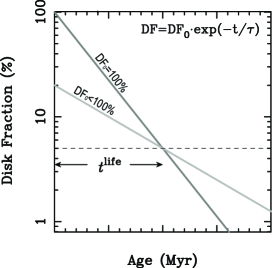
To fit with a single function to the disk fraction evolution curve, an exponential function is appropriate. The ‘disk decay time-scale’ () is defined as: (e.g. Mamajek, 2009). The decay time-scale is proportional to the slope of the curve on a semilog plot, log (IMDF)–age plot (Fig. 2). On the other hand, the most often used term ‘disk lifetime’ () is originally defined as the -intercept of the cluster age-disk fraction plotted as a linear function. However, fitting with a linear function does not appear appropriate to describe the shape of disk fraction evolution, which appears to decrease and level out at about 5–10 per cent (Hernández et al., 2008). Therefore, we define the disk lifetime to be the time when the disk fraction is 5 per cent () and use this for the discussion throughout this paper.
We define the ‘initial disk fraction’ (DF0) as the disk fraction at . Fig. 2 shows two possible cases: DF per cent and DF per cent for the same . The value of DF per cent (the dark gray line in Fig. 2) means that all stars initially have disks, while that of DF per cent (the light gray line in Fig. 2) means that all stars do not necessarily have disks from the beginning or that some disks disappear quickly within a very short time-scale that is not recognized within the accuracy of the age determination. Note that if DF0 is constant, then the disk lifetime is proportional to disk decay time-scale.
6 Evolution of the disk
The stellocentric distance of the disk () for HAeBe stars has a wide range, 0.1–1.0 AU for HAe stars to 1–10 AU for HBe stars (Millan-Gabet et al., 2007). However, because a large part of the IM stars in this paper are HAe stars, of 0.3 AU is taken to be the nominal radius in this paper. The JHK IMDF derived in this paper is the fraction of the HAeBe stars whose disks at a stellocentric distance () of 0.3 AU are optically thick with a temperature of 1500 K (see e.g. fig. 2 in Millan-Gabet et al. 2007).
In this section, we discuss the evolution of the disk of IM stars traced by band excess emission and on the JHK IMDF change with cluster age.
6.1 Disk lifetime
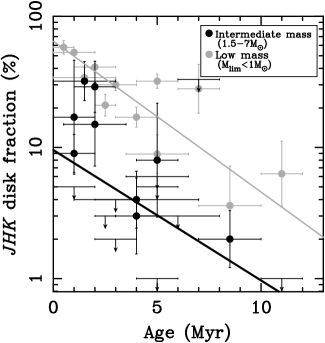
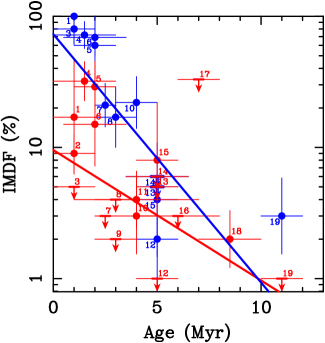
By making use of the method described in Section 3, the JHK IMDFs of 20 clusters are derived for the first time, in particular for clusters at ages 3 Myr. Fig. 3 shows the derived IMDF as a function of ages (black filled circles). The JHK IMDF is found to show an exponentially decreasing trend with increasing cluster age as seen in previous studies. There is a large scatter with many upper-limits at 1–3 Myr. In view of the upper-limit points, we used the astronomical survival analysis methods (Isobe et al. 1986; Lavalley, Isobe & Feigelson 1992) as a primary analysis tool. We used the schmidttbin task in the iraf/stsdas package. The resultant disk decay time-scale is Myr with DF per cent. The resulting disk lifetime is Myr. The fitted curve is shown in Fig. 3 as a thick black line. We refer to this fitting as ‘survival fitting’.
The IMDF data points at ages 3 Myr show a rather large scatter with upper-limit points. The clusters with zero disk fraction ( Oph, IC 348, Ori, NGC 2264) do not appear to have obvious common features. As for the initial disk fraction (DF0), the fitting results show a low value of 20 per cent. Although some non-zero data points at 1–2 Myr are apparently above the fitted line, all of them show relatively low values that are not more than 40 per cent. Whether all high-mass stars initially have disks or not is still under debate (e.g. Zinnecker & Yorke, 2007). On the other hand, all low-mass stars, are thought to initially have disks in the standard picture of low-mass star formation (Shu et al., 1987). Our results suggest a possible low initial disk fraction for IM stars, and further study of the IMDF is important, in particular, those of the younger clusters.
6.2 Comparison with low-mass stars
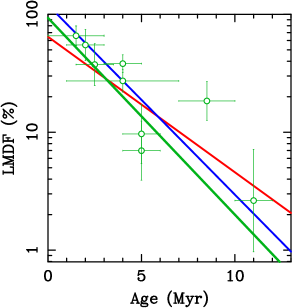
In Fig. 3, we show the JHK LMDF for comparison. The LMDF data points are for 12 clusters in the solar neighbourhood from Yasui et al. (2009, 2010). The fitting result of LMDFs is shown with a gray line (Fig. 3), which has Myr and per cent, leading to a disk lifetime of Myr. Fig. 3 clearly shows the difference in the disk fraction value, as well as the disk lifetime difference, between the IM and LM stars. The IMDFs for older clusters ( Myr) show systematically lower values compared to the LMDF, as Hernández et al. (2005) initially found for 5 clusters (Tr 37, Ori OB1bc, Upper Sco, Per OB2, and Ori OB1a). We increased the number of target clusters of age 3 Myr to 10 and confirmed this tendency. However, while fig. 10 in Hernández et al. (2005) shows an IMDF curve with only a single zero disk fraction point (Per OB2), our results in Table 3 show about half of the target clusters with a zero disk fraction (Fig. 3). Because the number of IM stars for each cluster is typically more than 20, a simple stochastic effect due to a small number of stars is not likely to be the reason for the many zero disk fraction points.
As a result of the fitting, the lifetime for the IM stars is found to be significantly shorter than that for the LM stars. The above results are summarized in Table 4. In the case of fitting, including the upper limits (survival fitting), the estimated lifetime ( Myr), is much shorter than that of the LM stars ( Myr) by about 7 Myr. These results clearly show the existence of a stellar mass dependence for the lifetime of the innermost disk.
6.3 Stellar mass dependence of the disk lifetime
The stellar mass dependence of the disk lifetime can be a strong constraint on the disk dispersal mechanism and the theory of planet formation, as discussed by Kennedy & Kenyon (2009). They compared the disk fraction for different mass bins, 1 (0.6–1.5 ) and 3 (1.5–7 ), in seven clusters and suggested that their data are more consistent with than with . is the disk decay time-scale defined by their model, in which the disks are dispersed when the accretion rate drops below the wind-loss rate. However, only four clusters appear to be the main contributors to the resultant mass dependency (see fig. 9 in Kennedy & Kenyon 2009) – the H disk fraction for three clusters and the MIR disk fraction for one cluster. Although Hernández et al. (2005) and Carpenter et al. (2006) found similar stellar mass dependence for clusters with ages 3 Myr, the dependence is uncertain because of an insufficient number of clusters, in particular those with ages 3 Myr. Obviously, it is necessary to increase the number of data points to clarify the mass dependence. Also, the large uncertainty in previous studies might be the result of differences in the evolution of the and MIR disks. Thus studying of only the JHK disk (or only the MIR disk) might show a clearer mass dependence.
The stellar mass dependence of the disk lifetime can be quantitatively estimated by combining the time-scales for the two mass ranges. For the IMDF, stars with mass of 1.5–7 are used in this paper. Considering the larger number of lower-mass stars with the typical universal IMF (e.g. Kroupa, 2002), the characteristic mass is set as 2–3 , or 2.5 . We estimated the stellar mass dependence with a characteristic mass from 2–3 , but no significant difference was found within the uncertainties. The characteristic mass of 0.50.5 (0.1–1 ) for the LMDF is set by considering the IMF and mass detection limit (0.1 ) for clusters used to derive disk fractions. Assuming the stellar mass dependence of the disk lifetime as a power-law function of stellar mass, we find using the survival fitting. These results are tabulated in Table 4. Our result is consistent with the results by Kennedy & Kenyon (2009), who found is proportional to about . However, note again that our results are derived only from the -disk data, while Kennedy & Kenyon (2009) used mostly data from the MIR disk or the H gas disk. We discuss the difference of disk lifetimes of the disk, MIR disk, and gas accretion disk in § 8.
7 Evolution of the MIR disk
In this section, we discuss the evolution of the inner disk of IM stars traced by the MIR excess emission and using the results on the MIR IMDF derived in Section 4.
7.1 Disk lifetime
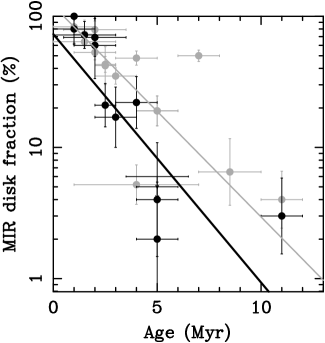
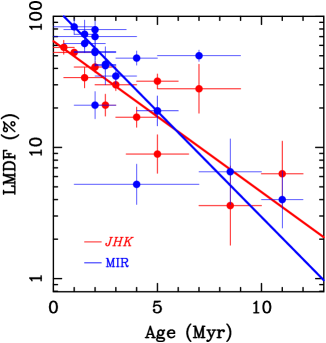
In Fig. 4, we plot the MIR IMDFs, showing a relatively clear exponential decay curve from cluster age zero to 10 Myr. We performed fitting in the same way as for the disks (Section 6). By including the upper limits (two clusters: NGC 2362 and Vel), a survival analysis was performed to obtain Myr and DF0(MIR) of per cent, which leads to a disk lifetime of Myr. The resultant fitted line is shown with the black line in Fig. 4. The fitted results are consistent with a 100 per cent initial disk fraction for the MIR IMDF.
7.2 Comparison with low-mass stars
We also plot the MIR LMDF for comparison in Fig. 4. The data points for MIR LMDFs are for 18 clusters from Spitzer observations: 16 clusters in Roccatagliata et al. (2011)444For the LMDF, we excluded two clusters from their 18 target clusters. First, NGC 2244 is excluded because the detection limit is not given. Second, Vel is excluded because the completeness limit for this cluster does not reach the low mass (1 ) limit. and Orion OB1bc and Orion OB1a/25 Ori in Kennedy & Kenyon (2009). We performed fitting in the same way as in Section 6 to obtain Myr and DF per cent with a reduced value of 1.0 with a degree of freedom of 16. This result is consistent with 100 per cent initial disk fraction for the MIR LMDF. There is no significant difference in the disk fraction lifetime between the IMDF and LMDF disk, unlike for the disk in the previous section.
7.3 Stellar mass dependence of the disk lifetime
The results of the lifetimes for the MIR disks of both IM and LM stars are summarized in Table 4. We derived the stellar mass dependence of the MIR disk lifetime as , assuming a power-law function and using the characteristic masses for the two mass ranges as for the JHK disk lifetime (Section 6.2) and the results for the survival fitting. These results are tabulated in Table 4.
Our results show no significant stellar mass dependence of the disk lifetime, which is apparently inconsistent with Kennedy & Kenyon (2009), who derived a steeper stellar mass dependence of . However, note that their results are based on the lifetime of both dust and gas disks. The strong dependency appears to be mainly contributed from the inclusion of H gas disk. They suggested a dependence rather than dependence mostly based on the data for three clusters (Taurus (H), Tr 37 (H & MIR), and OB1bc (H); see their fig. 9), but the existence of the disks is based mostly on the H gas disk for those three clusters. Using their data, we attempted to estimate the mass dependence and confirmed that is obtained in the case of using only the H disk fraction for the eight clusters in their list except for OB1a/25Ori, while is obtained in the case of using only the MIR disk fraction for the same eight clusters. Therefore, we conclude that there is no mass dependence of the lifetime of an MIR disk within the uncertainties.
8 DIFFERENCE IN THE EVOLUTION OF AND MIR DISKS
In the previous sections, we discussed the disk lifetime of the disk, which traces the innermost dust disk, and the MIR disk, which traces the inner disk outside of the disk. In this section, we compare the K and MIR disk fractions and discuss the evolution of the disk and the MIR disk. We also discuss the relation of the MIR disk to the inner gas disk, which is traced by accretion signatures, such as the H emission line.
8.1 Comparison of the disk and the MIR disk
8.1.1 Low-mass stars
Before discussing the case for the IM stars, we take a look at the case for the LM stars as a reference. Fig. 5 (right) shows the comparison of the JHK LMDF (red) and the MIR LMDF (blue). The derived lifetime for the disk (9.71.1 Myr) and the MIR disk (8.60.7 Myr) are identical within the uncertainties (see Table 4), which suggests that the disk and the MIR disk disperse almost simultaneously in the disks of LM stars. This is consistent with the recent view of disk dispersal that the entire disk disperses almost simultaneously for low-mass stars ( Myr; Andrews & Williams 2005).
8.1.2 Intermediate-mass stars

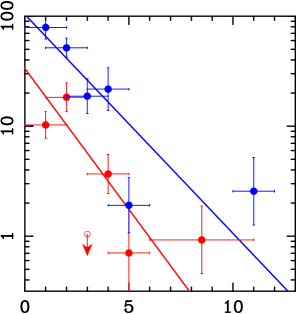
We compared JHK and the MIR IMDFs in Fig. 5 (left). The filled circles showing IMDFs and the arrows showing upper limits are labeled with the cluster numbers in Table 1. This figure immediately suggests that the MIR IMDFs are systematically larger than the JHK IMDFs. The MIR IMDF appears to be almost as high as 100 per cent at and exponentially declines, while the JHK IMDF is less than 50 per cent at the beginning and keeps smaller values than the MIR IMDF throughout the age span. Because this offset might be due to an incomplete cluster sampling that favors only the higher MIR or the lower JHK IMDFs, we directly compared the MIR and JHK IMDFs for the clusters that have both fractions estimated. The results (see Figure 6) show that the MIR IMDFs are systematically larger than the JHK IMDFs for all the 13 clusters that have both. We thus conclude that the large offset of the IMDFs is real, and that the smaller JHK IMDF is a unique property of the IM stars disk lifetimes compared to those of the LM stars. The significantly lower disk fraction of the disks means they disappear much earlier than the MIR disks. The lifetime difference is about 3 Myr ( Myr; see Table 4).
As suggested in section 2.2, possible contamination of LM stars in selecting IM stars may affect the above discussion. Therefore, it is safer to set the lower limit mass for IM-stars as 2 , which is slightly larger than the nominal mass limit in this paper (1.5 ). With this lower limit mass, we derived the JHK/MIR IMDFs in the same way as in section 2, 3, and 4. As a result, the derived IMDFs do not largely differ, and the estimated lifetimes of - and MIR-disk are Myr and Myr, respectively, which are very close to the results for the lower mass limit of 1.5 although the uncertainties for both disk fractions and disk lifetimes become larger. Therefore, we conclude that the effect of possible contamination of LM stars to our IM-star samples is very small, and that it does not change the conclusion.
.
An alternative approach was tried to confirm these results. To increase the statistical significance, we binned all of the disk-harbouring stars and cluster members in the cluster age range from 1 to 5 Myr with 1 Myr bins and 1 Myr steps and computed both the JHK and MIR IMDFs. To have enough clusters, all the members of the four clusters in the 6 to 11 Myr range are accumulated to estimate a binned IMDF at 8.52.5 Myr for the JHK IMDF. Because we have only one data point at Myr for the MIR IMDF, we simply used it without binning. This ‘binning’ process effectively reduces the number of upper-limit points, and the disk fraction curve becomes clearer with less scatter.
The results are plotted in Figure 7, which suggests the disk fraction offset between the JHK and the MIR IMDFs as well as the lifetime difference. The fitting results for the JHK IMDFs are as follows: disk lifetime () of 3.30.9 Myr with DF0(JHK) of 3513 per cent with of 1.0 with degree of freedom of 3. The derived lifetime is, in fact, very close to the results without binning (2.8 Myr). Note that the data point at Myr was not used because it remains an upper limit due to many upper limits in this age bin. As for MIR IMDF, a disk lifetime () of 6.71.1 Myr with DF0(MIR) of 10426 per cent with of 2.2 with degree of freedom of 4 were obtained. In summary, these ‘binning’ fitting results (see Table 4) confirm the survival analysis results without binning although there are very few data points in the binning fitting and we should be cautious of any unknown biases. The stellar mass dependence for this binning analysis is also listed in Table 4 and is consistent with previous results. Therefore, we conclude that there is a lifetime difference of 3–4 Myr between K and MIR disks.
8.2 Comparison with the submm disk
To investigate further the dependence on stellocentric distance, we also compared the disk fraction and lifetime of the K and MIR disks with that of the outer cold (10 K) dust disk traced by the submm and mm continuum. There are a number studies of submm observations of IM stars in Taurus (1.5 Myr), Oph (2 Myr), and Upper Sco (5 Myr) (Andrews & Williams, 2005, 2007; Mathews et al., 2012). We confirmed that the MIR disk is well correlated with the submm disk for the IM stars. Out of the observed 20 B-, A-, F, and G-type stars in the above papers, 19 stars are detected with MIR and submm disks, and only one star, HIP 76310 in Upper Sco, lacks a MIR disk but has a submm disk. The strong correlation clearly suggests that the MIR inner disk and submm outer disk disperse almost simultaneously for the IM stars. This behaviour is similar to that for LM stars (Andrews & Williams, 2005, 2007; Mathews et al., 2012). Thus the early disappearance of the innermost disk again appears to be the only unique property of the IM stars compared to the LM stars.
8.3 Comparison with the H gas disk
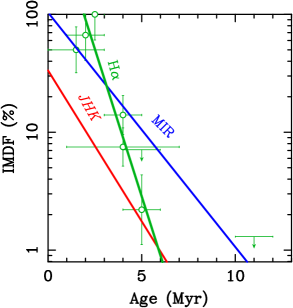
Another question we investigated is how the dust disk evolution is synchronized with the gas disk evolution. We compared the disk fraction and lifetime of the K and MIR disks with those of the innermost gas disk traced by the H emission as has been comprehensively studied by Fedele et al. (2010). They used spectroscopy of the H emission for the clusters in the solar neighbourhood. Because the H emission was not observed for many IM stars, we used the H disk fractions from Kennedy & Kenyon (2009) (their 1.5–7 samples for IMDF and all mass range samples for LMDF) and directly compared them with those of K and MIR disks. This is shown in Fig. 8. The left panel includes eight clusters (Taurus, Cha I, IC 348, Tr 37, Ori OB1bc, Upper Sco, NGC 2362, and NGC 7160), and the right panel includes an additional cluster (OB1a/25Ori).
In the right panel of Fig. 8, the H LMDF closely traces JHK and MIR LMDFs, and this shows the co-evolution of the dust and gas disks for LM stars. This is consistent with the results of Fedele et al. (2010), who found that the time-scale of H mass accretion is almost the same as that of the dust disk. In the left figure, however, the H IMDF shows a different cluster age dependence compared to the IMDF of the dust disk. We note that (1) it overlaps the MIR IMDF at younger ages (5 Myr), and (2) it is systematically larger than the JHK IMDF at younger ages with a longer lifetime than the disk. While the first point suggests the co-evolution of the gas and dust disk, which is suggested by Fedele et al. (2010), the second point has not been noted before. Only the disk appears to have a unique cluster age dependence among the different disk components of the IM stars.
8.4 Long transition disk phase for IM stars
In summary, for the IM stars there appears to be the following lifetime sequence for the various stellocentric radii: . On the other hand, all these time-scales are nearly the same for the LM stars (Andrews & Williams, 2005, 2007; Mathews et al., 2012). The above result suggests that for the IM stars the disk has a shorter time-scale and an evolutionary history that is different from that of the LM stars. The observed longer lifetime with larger stellocentric distance is qualitatively consistent with the recent view of the disk dispersal sequence for protoplanetary disks of LM stars (Williams & Cieza, 2011). However, the lifetime difference between the K and MIR disks for the IM stars (3–4 Myr) is significantly longer than that suggested previously for low-mass stars ( Myr; e.g. Williams & Cieza 2011).
That a time lag is clearly seen only for the IM stars gives us a clue to the mechanism of disk evolution. The time-lag between - and MIR-disk lifetimes can be interpreted as a transition disk phase, in which the innermost disk disappears while the outer MIR disk remains. Disks with no JHK excess emission and with MIR excess are called ‘classical’ transition disks (Muzerolle et al., 2010), while the original definition of ‘transition disk‘ is a disk that has no or little excess emission at m and a significant excess at m (Strom et al., 1989; Wolk & Walter, 1996). The two significant processes, disk dispersal (e.g. Muzerolle et al. 2010) and planet formation (e.g. Calvet et al. 2002), are thought to happen during this phase. Therefore, our finding suggests that such critical evolutionary events can be clearly recognized in the transition disk phase for IM stars as a time lag between the dispersal of the disk and the dispersal of the MIR disk, while both events happen nearly simultaneously for the LM stars ( Myr).
9 PHYSICAL MECHANISM OF THE DISK EVOLUTION OF INTERMEDIATE-MASS STARS
In this section, we discuss the implications of the observed time-scales of the gas/dust disks on the mechanism of disk evolution of the IM stars. Although there are many detailed processes related to disk evolution, we focus on discussing the following two categories, which are not intended to be comprehensive but broadly cover basic processes related to disk evolution: (1) the disk dispersal processes, such as mass accretion and dissipation by photoevaporation, and (2) the dust settling to the disk midplane and dust growth, which could be connected to planetesimal formation and planet formation. We suggest that the latter process is more likely for the early disappearance of the disks.
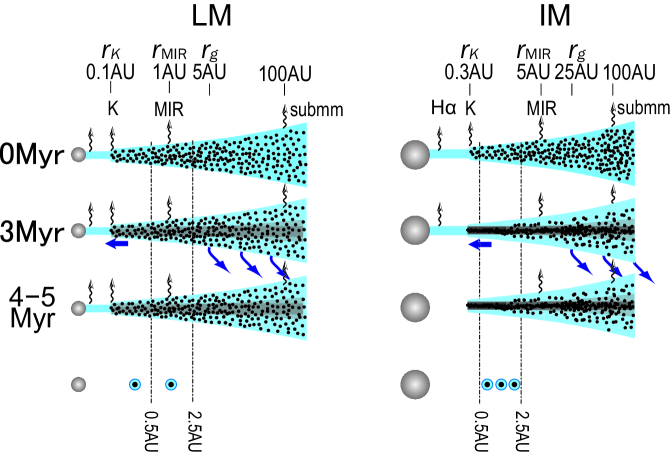
Before discussing the detailed evolution mechanisms, we first remark on the radial configuration of the dust disk in the steady state. If we consider an optically thick disk for disks with IR excess, the radius () with a temperature () is given by , where is the stellar luminosity and is the Stefan-Boltzmann constant. The dust temperature is about 1500 K for the disk and 500 K for the MIR disk as inferred from the peak wavelength of the black body emission. From those typical temperatures, the stellocentric distances to those disks regions are estimated to be AU, AU for IM stars (with the characteristic mass ) and AU, AU for LM stars (with the characteristic mass ) (see Fig. 9), considering the effective temperatures of the central star (see Millan-Gabet et al. 2007). Because the radius of an optically thick disk with IR excess is expressed with , is proportional to with the mass-luminosity relation of (Siess et al., 2000). Therefore, and should be roughly proportional to .
9.1 Disk dispersal?
The disk dispersal process consists of two kinds of processes: mass accretion onto the central star and dissipation into interstellar space (Hollenbach, Yorke & Johnstone, 2000). The combination of mass accretion and dissipation due to photoevaporation (e.g. the so called ‘UV-switch model’; Alexander, 2008) is thought to be one of the major mechanisms of overall disk dispersal (Williams & Cieza, 2011), because this can explain the almost simultaneous dispersal of the entire disk ( Myr), and thus the short transition disk phase as implied in Fig. 8 (right). Although there are a number of other proposed dispersal mechanisms (e.g. stellar encounter, disk wind), our discussion here focuses on the dispersal due to photoevaporation.
9.1.1 Accretion onto the central star?
The first possible mechanism for the short -disk lifetime of the IM stars is the faster mass accretion onto the central star for higher-mass stars. Mendigutía et al. (2011) suggested a very strong mass dependence of the mass accretion rate from observations of UV Balmer excess. However, our results suggest that the gas accretion disk has a longer lifetime than the disk (Fig. 8, left), about equal to that of the MIR disk. Therefore, more rapid accretion and the resultant deficiency of material are not likely to be the cause of the faster destruction of the disk.
9.1.2 Photoevaporation?
Photoevaporation is another strong candidate for the dispersal mechanism that may cause the short -disk lifetime. Photoevaporation is known to be effective for outside of the gravitational radius, , where the thermal energy balances with gravitational potential. This radius scales with the stellar mass as (Alexander, 2008), and for IM stars (2.5 ) and LM stars (0.5 ) are 25 AU and 5 AU, respectively. The corresponding disk radii () for IM and LM stars are only 0.3 and 0.1 AU, respectively, which are less than of . Similarly the corresponding MIR disk radii are 5 and 1 AU, respectively. Although all these radii change with the stellar mass (from 1.5 to 7 for IM stars), the relative magnitude of the radii, , should not change for both IM and LM star mass ranges, even considering the scaling with the stellar mass mentioned above. Therefore, photoevaporation is not likely the main cause of the fast -disk dispersal for IM stars.
9.2 Dust settling, dust growth, and planet formation
The transition disk phase is now interpreted as the most important phase in the standard planet formation scenario, and now much observational effort has been put into characterizing this phase (Williams & Cieza, 2011). In this interpretation, the early disappearance of the innermost dust disk compared to other portions of disk is due to dust settling to disk mid-plane (Kenyon & Hartmann, 1987; Dullemond & Dominik, 2005) and/or dust growth (Weidenschilling, 1997; Dullemond & Dominik, 2004). We discuss those possibilities in the following section with a schematic picture shown in Fig. 9.
9.2.1 Dust settling & growth
From the basic equations of protoplanetary disks in equilibrium, the radial dependence of the dust settling time can be analytically shown to be proportional to the Kepler rotation period, which is proportional to (Nakagawa et al., 1981). Although there are many new simulations incorporating more physical processes to show the dust settling time with a different r- or M∗-dependence (e.g., Tanaka, Himeno, & Ida 2005), we compare our results with this base relationship by Nakagawa et al. (1981) as an initial consistency check.
First, as for the radius dependence, the shorter -disk lifetime than that of MIR-disk for the IM stars (Fig. 9, right, Table 4) is qualitatively consistent with the base relationship in that the dust settling/growth is occurring more effectively in the inner disk. Although the observed results ( Myr at AU, and –7 Myr at AU) do not quantitatively follow the base relation and instead show a much weaker -dependence, this can be interpreted as that the turbulent process or some other processes that prevent the dust settling/growth have the opposite -dependence to reduce the -dependence of dust settling/growth (e.g., Dullemond & Dominik 2005). For the LM stars, on the other hand, the lifetimes of the inner , MIR, and the outer submm disks do not show any significant difference (see discussions in Section 8.1.1 and 8.2). This is even more inconsistent with the base relation than the IM stars. Most likely this means that the disk disperses before dust is totally settled in the entire disk, although dust settling/growth is reported for some LM stars (e.g., Pinte et al. 2008). In this case, the dust in the upper disk layer is dissipated in the process of mass accretion and photoevaporation (Fig. 9, left), and the disk lifetime (9–10 Myr) sets the lower limit of the dust setting/growth time-scale for most of the LM srars. However, it should be noted that the above discussion is intended to describe the typical case and is not applicable to all stars. The time scale of transition disk is still under debate, short (0.2 Myr; e.g. Luhman et al. 2010) or long ( a few Myr; e.g. Sicilia- Aguilar & Currie 2011), although the discrepancies among these studies are largely due to differing definitions of the transition disk and how to estimate the total disk lifetime (Espaillat et al., 2014).
Next, as for the stellar mass dependence, the much shorter -disk lifetime of the IM stars than that of the LM stars ( Myr, while –10 Myr; see Table 4; Fig. 5, left) is apparently consistent with the base relation in that dust settling/growth occurring effectively for higher-mass stars. However, if we also consider the -dependence, the characteristic IM stars ( , AU) are expected to have longer settling time-scale (about twice) than the characteristic LM stars ( , AU) which shows the opposite tendency compared to the observed timescales. This might suggest that turbulence of the innermost disk is much weaker for the IM stars than for the LM stars so that the dust growth/settling occurs quickly. Although the larger disk mass (surface density) for stars with higher mass (Andrews & Williams, 2005) might cause such a situation, the physical process is unknown.
9.2.2 Planet formation
Planetesimal and planet formation result from the dust settling/growth processes according to the standard core-accretion model (Lissauer & Stevenson, 2007). For IM stars, the quick dust settling/growth processes in the presence of gas may cause effective planetesimal formation (Hubickyj et al., 2005). This results in effective Jupiter-mass planet formation (e.g. Laughlin et al., 2004; Ida & Lin, 2004a; Robinson et al., 2006), which could accelerate the disappearance of the innermost disk with clearing by migration (Lin, Bodenheimer & Richardson, 1996; Trilling et al. (1998); Trilling et al. (2002)). Such a scenario is consistent with the trend of a higher probability of Jupiter-mass planets with a larger stellar mass for stars in the mass range of 0.2–1.9 for semimajor axes of 2.5 AU (Johnson et al., 2010). However, the mass range for IM stars (1.5–7 ) has only a small overlap with this trend. This trend is generally interpreted as a result of larger disk mass (high surface density) for larger stellar mass, which enables the rapid formation of Jupiter-mass planets (e.g. within 1 Myr; Ida & Lin 2004b).
9.2.3 Summary
In summary, dust settling/growth (and some planet formation) can generally explain the shorter -disk lifetime of IM stars, although the specific physical processes are not known. This interpretation is summarized in the schematic pictures shown in Fig. 9 (right): (1) The disk ( AU): Dust settling/growth works very efficiently from the beginning of disk evolution (cluster age 0) and is almost completed in 3 Myr. Because there is no left-over IR-emitting grains even in the upper disk layer, no NIR continuum is emitted, (2) The MIR disk ( AU): A significant amount of dust grains are in the upper disk layer due to the turbulence and give rise to the MIR continuum emission. After 4–5 Myr, dust settling has occurred, or dust in the upper layer of the MIR disk is dissipated, resulting in no emission of MIR–thermal continuum emission. If this picture is correct, the lifetime difference of JHK and MIR IMDFs constrains the time-scale of this settling process in the disk to about 4 Myr (Section 8.1.2) (Table 4). The low initial value of the JHK IMDF (50 %) might also be naturally explained with the effective settling in the inner disk. Future MIR spectroscopy of the silicate emission lines and the SED slope (Furlan et al., 2006) of those IM stars with and without the disk will test the idea that the disappearance of the disk is due to dust settling/growth.
10 Implications for Planet Formation around IM Stars
Two remarkable trends are known for the Jupiter-mass planets around IM stars: (1) the lack of close-in planets with semimajor axes of 0.5 AU orbiting stars with masses (such planets are common for stars with ), and (2) the higher probability of having planets with semimajor axes of 2.5 AU compared to low-mass stars. In this section, we discuss these trends in the context of our disk fraction lifetime results.
10.1 Implications for the lack of close-in planets
There appears to be a lack of close-in planets with semimajor axes of 0.5 AU orbiting stars with masses of 1.5–3 in planet-search surveys, while close-in planets are more frequent for lower-mass stars (Wright et al., 2009). Because planets are thought to form in situ or migrate inward in the formation phase (e.g. Lin et al., 1996), our suggestion of rapid planet formation in the disk appears to be inconsistent with the paucity of close-in planets. However, considering the possible radial range of ‘ disk’ (from 0.3 AU to 1 AU, depending on the mass of the central star, disk mass, etc.), the higher planet occurrence for higher-mass stars (Johnson et al., 2010) may reflect the rapid planet formation at AU. The planets that formed at AU may have dropped into the central stars due to migration (Papaloizou et al., 2007) because the gas disk traced by H still remains for about 2 Myr after the disappearance of the disk. Or, they may have disappeared due to collisional destruction that may have effectively occurred along with grain growth (Johansen et al., 2008). In any case more studies are necessary to understand the precise relation between disk lifetime and planet formation.
Regarding the lack of close-in planets for IM stars, two major scenarios have been proposed. The first scenario is planet engulfment caused by the stellar evolution of primary stars in the RGB phase (Villaver & Livio, 2009). Another scenario is that the observed differences in orbital distribution are primordial, and they are a consequence of the planet-formation mechanism around the more-massive stars (Currie, 2009). In this section, we focus on the latter scenario because our results are relevant to the early stages of star formation. Currie (2009) suggests that planets around IM stars cannot migrate to inner orbits because of the shorter gas-disk lifetime for IM stars. In addition, Kretke et al. (2009) suggest that the inner edge of the dead zone in protoplanetary disk, where the dead zone is the region of the disk without magnetorotational instability (Gammie, 1996), effectively determines the semimajor axes of giant planets because the dead zone traps inwardly migrating solid bodies. Thus, they suggested that the larger radius of the inner edge for higher mass stars explains the lack of close-in planets.
Our results are qualitatively consistent with Currie’s scenario in that shorter disk lifetimes are expected for higher-mass stars. We estimated that the stellar mass dependence of gas disk lifetime is about ( Myr and Myr in Fig. 8). However, this dependence is not as steep as assumed in Currie (2009), with –1.5. In any case, migration alone may not be able to explain the observed sharp outward step in giant planet orbits as pointed out in Kennedy & Kenyon (2009).
Our results that the innermost disks of IM stars disappear at a very early time also seem to be consistent with Kretke’s dead zone model. Kretke et al. (2009) assumed a smooth stellar mass dependence of the inner edge radius of the dead zone (proportional to ) from the theoretical relationship between the radius and the mass accretion, and they compared this to the mass accretion rate derived from observations. Our results, showing the early disappearance of the innermost disk, suggest that the radius becomes even larger because of low opacity, which makes the formation of dead zone difficult. If the critical stellar mass where the time lag between the disk and the MIR disk disk dispersal is observationally determined, then this dead zone idea may be able to explain the lack of close-in planets even for the sharp cut-off at 0.5 AU in the planet semimajor axes in the distribution of Jupiter-mass planets.
In addition, the difference in the planet formation site in disks of IM stars and LM stars may explain the lack of close-in planets for the IM stars. Planets are thought to form outward of the snow line, 3 AU for LM stars and 10 AU for IM stars (Kennedy & Kenyon, 2008). This difference might explain the observed difference in planet location even after the smearing out by the migration processes, although this idea does not explain the sharp step in planet semimajor axes.
10.2 Implications for higher planet formation probability
The probability of IM stars having Jupiter-mass planets is found to be proportional to for semimajor axes 2.5 (Johnson et al., 2010). This observed frequency is likely to be determined by two competing effects: the tendency of shorter disk lifetimes for more massive stars reduces the likelihood of giant planets forming (Butler et al., 2006), and the tendency of higher disk masses for more massive stars increases the probability of gas-giant planet formation (Wyatt, Clarke & Greaves, 2007). In Kennedy & Kenyon (2009), the stellar mass dependence of disk lifetime is estimated using the H disk and MIR disk fractions as , where is the disk decay time-scale defined by their model. However, from our results, the disk lifetime at for IM and LM stars is not significantly different, and the stellar mass dependence of disk lifetime () is as small as . The disk mass is known from submm observations to be roughly proportional to the stellar mass (Andrews & Williams, 2005). The stellar mass dependence of the disk lifetime is negative, while the stellar mass dependence of the disk mass is positive. Therefore, the higher probability of IM stars having planets compared to LM stars seems to be due to the difference in disk mass instead of the difference in disk lifetime.
11 Conclusion
We derived and compiled protoplanetary disk fractions of intermediate-mass stars (1.5–7 ) for a large number of nearby young clusters (within kpc and 5 Myr old) with the available JHK photometric data in the literature. From the results and by comparing them with those for other wavelengths (H, MIR, and submm), we found the following results:
-
•
The -disk lifetime of IM stars (), which is defined as the time-scale of disk fraction to bottom out at 5 per cent, is estimated to be 3.30.9 Myr.
-
•
The -disk lifetime for the IM stars, , is about one-third of that for the LM stars. Assuming a power-law dependence, the stellar mass dependence of the -disk lifetime is found to be proportional to .
-
•
By comparing the disk ( AU) evolution to that of the MIR disk ( AU) for IM stars, we find that the disk seems to disperse earlier than the MIR disk by 3–4 Myr. Because the disk and the MIR disk disperse almost simultaneously in LM stars ( Myr), the long time lag may be a characteristic of IM stars, suggesting that the transition disk is the common phase in IM stars.
-
•
Because the disk time-scale at for the IM stars does not seem to be significantly different from that of LM stars, the most likely cause for the time lag seems to be early dust growth/settling and/or Jupiter-mass planet formation in the innermost disk ( disk) in IM stars.
-
•
Our results for the disk of the IM stars suggest the possible reasons for the paucity of close-in planets around IM stars, but they are not conclusive. Our results also suggest that the disk mass is a more important factor for the stellar mass dependence of planet occurrence than the disk lifetime.
| Cluster | Agea | Distanceb | References for the disk fraction studyc | |
|---|---|---|---|---|
| (Myr) | (pc) | |||
| 1 | NGC 1333 | 11 (He08) | 318 (LL03) | He08, Ma09, Ro11 |
| 2 | Trapezium | 11 (Mu02) | 450 (LL03) | Ha01, He08, Ma09 |
| 3 | Oph | 11 (Fe10) | 125 (LL03) | Fe10 |
| 4 | Taurus | 1.51.5 (He08) | 140 (El78) | Ha01, He08, Ke09, Ma09, Fe10, Ro11 |
| 5 | Cha I | 21 (Ro11) | 170 (Lu08) | Ha01, He08, Ke09, Ma09, Fe10, Ro11 |
| 6 | NGC 2068/71 | 21.5 (Ro11) | 400 (LL03) | He08, Ma09, Ro11 |
| 7 | IC 348 | 2.50.5 (He08) | 320 (Ha01a) | Ha01, He08, Ke09, Ma09, Fe10, Ro11 |
| 8 | Ori | 31 (Ro11) | 440 (He07a) | He08, Ma09, Fe10, Ro11 |
| 9 | NGC 2264 | 31 (He08) | 760 (Da08a) | Ha01, He08, Ma09 |
| 10 | Tr 37 | 41 (He08) | 900 (Si05) | He08, Ke09, Ma09, Ro11 |
| 11 | Ori OB1bc | 43 (He05) | 443 (He05) | He05, He08, Ke09, Ma09, Ga09 |
| 12 | Upper Sco | 51 (Pr02) | 144 (He05) | He05, He08, Ke09, Ma09, Ga09, Fe10, Ro11 |
| 13 | NGC 2362 | 51 (He08) | 1500 (Da08b) | Ha01, He08, Ke09, Ma09, Fe10, Ro11 |
| 14 | Vel | 51.5 (He08) | 350 (He08) | He08, Ma09, Ro11 |
| 15 | Ori | 51 (He08) | 450 (He09) | He08, Ma09 |
| 16 | Per OB2 | 62 (He05) | 320 (He05) | He05 |
| 17 | Cham | 71 (He08) | 100 (Ma99) | He08,Ma09, Ga09, Fe10, Ro11 |
| 18 | Ori OB1a | 8.5 (Br05) | 330 (He05) | He05, He08, Ke09, Ma09, Ga09 |
| 19 | NGC 7160 | 111 (He08) | 900 (Si05) | He08, Ke09, Ma09, Ro11 |
Notes:
aAdopted age with reference in parenthesis.
bDistance with reference in parenthesis.
cLiteratures for disk fraction study in the past. Note that some
references show different cluster names (e.g., 25 Ori, which is named
as Ori OB1a in our list).
References: Br05: Briceño et al. (2005); Da08a: Dahm (2008a); Da08b: Dahm (2008b); El78: Elias (1978); Fe10: Fedele et al. (2010); Ga09: Gáspár et al. (2009); Ha01a: Haisch et al. (2001a); Ha01b: Haisch et al. (2001b); He05: Hernández et al. (2005); He07a: Hernández et al. (2007a); He08: Hernández et al. (2008); He09: Hernández et al. (2009); Ke09: Kennedy & Kenyon (2009); LL03: Lada & Lada (2003); Lu08: Luhman (2008); Ma09: Mamajek (2009); Ma99: Mamajek et al. (1999); Mu02: Muench et al. (2002); Pr02: Preibisch et al. (2002); Ro11: Roccatagliata et al. (2011); Si05: Sicilia-Aguilar et al. (2005).
| SpTypeb | Boundary mass with | |||
|---|---|---|---|---|
| (Myr) | 7 | 1.5 | 7 | 1.5 |
| ( Myr) | ( Myr) | |||
| 1 | B2.5 | K5 (1.5–1.6 ) | 7 | 1.2–1.5 |
| 1.5 | B3 | K5 (1.2–1.5) | 7 | 1.2–2.2 |
| 2 | B3 | K5 (1.2–1.5) | 7 | 1.2–2.2 |
| 2.5 | B3 | K5 (1.2–1.5) | 6–7 | 1.2–1.8 |
| 3 | B3 | K4 (1.5–1.6) | –7 | 1.2–1.6 |
| 4 | B3 | K4 | 7 | 1.4–1.8 |
| 5 | B3 | K4 (1.4–1.5) | 7 | 1.4–1.6 |
| 6 | B3 | K3 | 7 | 1.4–1.6 |
| 7 | B3 | K2 | 7 | 1.4–1.7 |
| 8.5 | B3 | K1 | 7 | 1.4–1.7 |
| 10 | B2 | K2 | 7 | 1.3–1.5 |
| 11 | B3 | G7 | 7 | 1.3–1.7 |
Notes:
aAge of cluster.
bSpectral type for the boundary mass (7 and 1.5 M⊙) based on the isochrone model by Siess et al. (2000). The range of stellar mass corresponding to the spectral type is shown in the parentheses when the range covers more than .
cThe possible shift of boundary mass for the age spread of 2 Myr based on the isochrone model by Siess et al. (2000).
| Cluster | Membership Refa | Age | SpTb | SpT Refc | JHK IMDFd | MIR Refe | MIR IMDFf | |
|---|---|---|---|---|---|---|---|---|
| (Myr) | (%) | (%) | ||||||
| NGC 1333 | St76,As97,Wi04 | 11 | B2.5–K5 | Win10,Co10,SB | 1717 | Gu09 | 10050 | |
| Trapezium | Hi97 | 11 | B2.5–K5 | Hi97 | 93 | — | —g | |
| Oph | Wi08 | 11 | B2.5–K5 | Wi08 | 05 | Wi08 | 8020 | |
| Taurus | Fu06, Fu11 | 1.51.5 | B3–K5 | Fu06, Fu11 | 3110 | Fu06,Lu06 | 7216 | |
| Cha I | Lu04 | 21 | B3–K5 | Lu04 | 2913 | Lu08 | 6035 | |
| NGC 2068/71 | Fl08 | 21.5 | B3–K5 | Fl08 | 1511 | Fl08 | 6923 | |
| IC 348 | Lu03 | 2.50.5 | B3–K5 | Lu03 | 03 | La06 | 218 | |
| Ori | He07a | 31 | B3–K4 | Ca10,Re09,SB | 04 | He07a | 179 | |
| NGC 2264 | Re02 | 31 | B3–K4 | Re02 | 02 | — | —g | |
| Tr 37 | Si05 | 41 | B3–K4 | Si05,SB | 32 | Si05, Si06 | 2210 | |
| Ori OB1bc | He05 | 43 | B3–K4 | He05 | 42 | — | —g | |
| Upper Sco | Ca06 | 51 | B3–K4 | Ca06 | 01 | Ca06 | 22 | |
| NGC 2362 | Da07 | 51 | B3–K4 | Da07 | 05 | Da07 | 05 | |
| Vel | He08 | 51.5 | B3–K4 | Ho78,SB | 06 | He08 | 06 | |
| Ori | He09 | 51 | B3–K4 | He09 | 88 | He09 | 44 | |
| Per OB2 | He05 | 62 | B3–K3 | He05 | 03 | — | —g | |
| Cham | Me05 | 71 | B3–K2 | Me05 | 033 | Me05 | —i | |
| Ori OB1a | He05 | 8.51.5 | B2–K1 | He05 | 21 | — | —g | |
| NGC 7160 | Si05 | 111 | B3–G7 | Si05 | 01 | Si06 | 32 |
Notes:
aReferences from which the members of the clusters were picked
up. The IM stars that were used for deriving the JHK IMDF were
obtained from these references. For the Trapezium Cluster, members are
selected from Hi97, but only those whose stated membership probability
is more than 50 % were used.
bThe range of spectral type for the target mass range (1.5—7 M⊙) for the cluster age listed in the third column. shows cluster for which the observed spectral types of cluster members do not completely reach to the boundary spectral type for the lowest mass (see the main text).
cReferences from which the spectral types in the clusters were obtained. For some clusters for which the spectral type listing in the published papers is incomplete, we supplemented the spectral type information with those listed in the SIMBAD database at http://simbad.u-strasbg.fr/simbad/ (denoted as SB).
dDerived JHK IMDF and uncertainties based on Poisson errors. Numbers in parentheses show the number of disk-harbouring members over total number of members. For the treatment of Poisson errors for zero detection, see the main text.
eReferences for the MIR photometric data.
fDerived MIR IMDF and uncertainties based on Poisson errors. Numbers in the parentheses shows the number of disk harbouring members over total number of members). For the treatment of Poisson errors for zero disk harbouring members, see the main text.
gThe clusters for which Spitzer MIR data are unavailable.
hFor MIR disk classification of this cluster, we use the slope between [4.5] and [8] rather than [3.6] and [8] because Carpenter et al. (2006) does not list photometry data in [3.6]. However, Kennedy and Kenyon (2009) confirms that use of [4.5] instead of [3.6] does not change the classification.
iMIR IMDF was not derived because of the small number of sample IM stars (3).
References:
As97: Aspin & Sandell (1997);
Ca06: Carpenter et al. (2006);
Ca10: Caballero et al. (2010);
Co10: Connelley & Greene (2010);
Da07: Dahm & Hillenbrand (2007);
Fl08: Flaherty & Muzerolle (2008);
Fu06: Furlan et al. (2006);
Gu09: Gutermuth et al. (2009)
He05: Hernández et al. (2005);
He07a: Hernández et al. (2007a);
He08: Hernández et al. (2008);
He09: Hernández et al. (2009);
Hi97: Hillenbrand (1997);
Ho78: Houk (1978);
La06: Lada et al. (2006);
Lu03: Luhman et al. (2003);
Lu04: Luhman (2004);
Lu06: Luhman et al. (2006);
Lu08: Luhman et al. (2008);
Me05: Megeath et al. (2005).
Re02: Rebull et al. (2002);
Re09: Renson & Manfroid (2009);
Si05: Sicilia-Aguilar et al. (2005);
Si06: Sicilia-Aguilar et al. (2006);
St76: Strom et al. (1976);
Wi04: Wilking et al. (2004);
Wi08: Wilking, Gagné, & Allen (2008);
Win10: Winston et al. (2010).
| (Myr) | (Myr) | |||||||
|---|---|---|---|---|---|---|---|---|
| Yasui et al. (2010) | Survival | Binningb | Yasui et al. (2010) | Survival | Binningb | |||
| Intermediate-mass | 2.5 | — | 2.82.4 | 3.30.9 | — | 6.14.2 | 6.71.1 | |
| Low-mass | 0.5 | 9.71.1 | — | — | 8.60.7 | — | — | |
| Mass dependence | ||||||||
Notes:
aCharacteristic mass for the mass range (see details in the main
text).
bSee Section 8.1 for the definition of this fitting.
References
- Adams et al. (1987) Adams F. C., Lada C. J., Shu F. H., 1987, ApJ, 312. 788
- Alexander (2008) Alexander R., 2008, New Astron. Rev., 52, 60
- Andrews & Williams (2005) Andrews S. M., Williams, J. P., 2005, ApJ, 631, 1134
- Andrews & Williams (2007) Andrews, S. M., Williams, J. P., 2007, ApJ, 671, 1800
- Aspin & Sandell (1997) Aspin, C., Sandell, G. 1997, MNRAS, 289, 1
- Bessell & Brett (1988) Bessell M. S., Brett, J. M., 1988, PASP, 100, 1134
- Briceño et al. (2005) Briceño, C., Calvet, N., Hernández, J., Vivas A. K., Hartmann L., Downes J. J., Berlind P., 2005, AJ, 129, 907
- Butler et al. (2006) Butler R. P., Johnson J. A., Marcy G. W., Wright J. T., Vogt S. S., Fischer D. A., 2006, PASP, 118, 1685
- Caballero et al. (2010) Caballero J. A., Albacete-Colombo J. F., López-Santiago J., 2010, A&A, 521, A45
- Calvet et al. (2002) Calvet N., D’Alessio P., Hartmann, L., Wilner D., Walsh A., Sitko M., 2002, ApJ, 568, 1008
- Carpenter et al. (2006) Carpenter J. M., Mamajek E. E., Hillenbrand L. A., Meyer M. R., 2006, ApJL, 651, L49
- Comerón et al. (2008a) Comerón F., Pasquali A., Figueras F., Torra J., 2008, A&A, 486, 453
- Connelley & Greene (2010) Connelley M. S., Greene, T. P., 2010, AJ, 140, 1214
- Cox (2000) Cox A. N., 2000, Allen’s Astrophysical Quantities. AIP Press, New York
- Currie (2009) Currie T., 2009, ApJL, 694, L171
- Dahm (2008a) Dahm S. E., 2008, in Reipurth, B, ed., Handbook of Star Forming Regions, Volume I. Astron. Soc. Pac., San Francisco, p. 966
- Dahm (2008b) Dahm S. E., 2008, in Reipurth, B, ed., Handbook of Star Forming Regions, Volume II. Astron. Soc. Pac., San Francisco, p. 26
- Dahm & Hillenbrand (2007) Dahm S. E., Hillenbrand L. A., 2007, AJ, 133, 2072
- Dullemond & Dominik (2004) Dullemond, C. P., Dominik, C., 2004, A&A, 417, 159
- Dullemond & Dominik (2005) Dullemond C. P., Dominik C., 2005, A&A, 434, 971
- Dullemond et al. (2001) Dullemond C. P., Dominik C., Natta A., 2001, ApJ, 560, 957
- Elias (1978) Elias J. H., 1978, ApJ, 224, 857
- Elmegreen (2009) Elmegreen B. G., 2009, The Evolving ISM in the Milky Way and Nearby Galaxies,
- Espaillat et al. (2014) Espaillat C., et al., 2014, arXiv, arXiv:1402.7103
- Fedele et al. (2010) Fedele D., van den Ancker M. E., Henning T., Jayawardhana R., Oliveira J. M., 2010, A&A, 510, A72
- Flaherty & Muzerolle (2008) Flaherty K. M., Muzerolle J., 2008, AJ, 135, 966
- Fuente et al. (2002) Fuente A., Martın-Pintado J., Bachiller R., Rodrıguez-Franco A., Palla F., 2002, A&A, 387, 977
- Furlan et al. (2006) Furlan E. et al., 2006, ApJS, 165, 568
- Furlan et al. (2011) Furlan E., et al., 2011, ApJS, 195, 3
- Gammie (1996) Gammie C. F., 1996, ApJ, 457, 355
- Gáspár et al. (2009) Gáspár A., Rieke G. H., Su K. Y. L., Balog Z., Trilling D., Muzzerole J., Apai D., Kelly B. C., 2009, ApJ, 697, 1578
- Gutermuth et al. (2009) Gutermuth R. A., Megeath S. T., Myers P. C., Allen L. E., Pipher J. L., Fazio G. G., 2009, ApJS, 184, 18
- Haisch et al. (2001a) Haisch K. E., Jr., Lada E. A., Lada C. J., 2001a, ApJL, 553, L153
- Haisch et al. (2001b) Haisch K. E., Jr., Lada E. A., Lada C. J., 2001, AJ, 121, 2065
- Herbig (1960) Herbig G. H., 1960, ApJS, 4, 337
- Hernández et al. (2004) Hernández J., Calvet N., Briceño C., Hartmann L., Berlind P., 2004, AJ, 127, 1682
- Hernández et al. (2005) Hernández J., Calvet N., Hartmann L., Briceño C., Sicilia-Aguilar A., Berlind P., 2005, AJ, 129, 856
- Hernández et al. (2007a) Hernández J. et al., 2007a, ApJ, 662, 1067
- Hernández et al. (2007b) Hernández J. et al., 2007b, ApJ, 671, 1784
- Hernández et al. (2008) Hernández J., Hartmann L., Calvet N., Jeffries R. D., Gutermuth R., Muzerolle J., Stauffer J., 2008, ApJ, 686, 1195
- Hernández et al. (2009) Hernández J., Calvet N., Hartmann L., Muzerolle J., Gutermuth R., Stauffer J., 2009, ApJ, 707, 705
- Hillenbrand (1997) Hillenbrand L. A., 1997, AJ, 113, 1733
- Hillenbrand & White (2004) Hillenbrand L. A., White R. J., 2004, ApJ, 604, 741
- Hillenbrand (2005) Hillenbrand L. A., 2008, in Livio, M., Sahu K., Valenti J., eds, Proc. STScI Symp. 19, A Decade of Extrasolar Planets around Normal Stars. Space Telescope Science Institute, Baltimore, MD, p. 84
- Hollenbach et al. (2000) Hollenbach D. J., Yorke H. W., Johnstone D., 2000, in Mannings V., Boss A., Russell, S. S., eds, Protostars and Planets IV. Univ. Arizona Press, Tucson, AZ, p. 401
- Houk (1978) Houk, N., 1978, Michigan catalogue of two-dimensional spectral types for the HD stars . Dept. of Astronomy, University of Michigan, Ann Arbor. Distributed by University Microfilms International.
- Hubickyj et al. (2005) Hubickyj O., Bodenheimer P., Lissauer J. J., 2005, Icarus, 179, 415
- Ida & Lin (2004a) Ida S., Lin D. N. C., 2004a, ApJ, 604, 388
- Ida & Lin (2004b) Ida S., Lin D. N. C., 2004b, ApJ, 616, 567
- Isobe et al. (1986) Isobe T., Feigelson E. D., Nelson P. I., 1986, ApJ, 306, 490
- Jeffries et al. (2009) Jeffries R. D., Naylor T., Walter F. M., Pozzo M. P., Devey C. R., 2009, MNRAS, 393, 538
- Johansen et al. (2008) Johansen A., Brauer F., Dullemond C., Klahr H., Henning T., 2008, A&A, 486, 597
- Johnson et al. (2007) Johnson J. A., Butler R. P., Marcy G. W., Fischer D. A., Vogt S. S., Wright J. T., Peek K. M. G., 2007, ApJ, 670, 833
- Johnson et al. (2010) Johnson J. A., Aller K. M., Howard A. W., Crepp J. R., 2010, PASP, 122, 905
- Kennedy & Kenyon (2008) Kennedy G. M., Kenyon S. J., 2008, ApJ, 673, 502
- Kennedy & Kenyon (2009) Kennedy G. M., Kenyon S. J., 2009, ApJ, 695, 1210
- Kenyon & Hartmann (1987) Kenyon S. J., Hartmann L., 1987, ApJ, 323, 714
- Kenyon & Hartmann (1995) Kenyon S. J., Hartmann L., 1995, ApJS, 101, 117
- Kretke et al. (2009) Kretke K. A., Lin D. N. C., Garaud P., Turner N. J., 2009, ApJ, 690, 407
- Kroupa (2002) Kroupa P. 2002, Science 295, 82
- Lada (1999) Lada E. A. 1999, in Lada C. J., Kylafis N. D., eds, The Origin of Stars and Planetary Systems. Kluwer, Dordrecht, p. 441
- Lada & Adams (1992) Lada, C. J., Adams, F. C., 1992, ApJ, 393, 278
- Lada & Lada (2003) Lada, C. J., Lada, E. A., 2003, ARA&A, 41, 57
- Lada et al. (1996) Lada, C. J., Alves, J., Lada, E. A., 1996, AJ, 111, 1964
- Lada et al. (2006) Lada C. J. et al., 2006, AJ, 131, 1574
- Laughlin et al. (2004) Laughlin G., Bodenheimer P., Adams F. C., 2004, ApJL, 612, L73
- Lavalley et al. (1992) Lavalley M., Isobe T., Feigelson E., 1992, in Worrall D. M., Biemesderfer C., Barnes J., eds, ASP Conf. Ser. Vol. 25, Astronomical Data Analysis Software and Systems I. Astron. Soc. Pac., San Francisco, p. 245
- Lin et al. (1996) Lin D. N. C., Bodenheimer P., Richardson D. C., 1996, Nature, 380, 606
- Lissauer & Stevenson (2007) Lissauer J. J., Stevenson D. J., 2007, in Reipurth, B., Jewitt, D., Keil, K., eds., Protostars and Planets V. Univ. Arizona Press, Tucson, AZ, p. 591
- Liu et al. (2003) Liu M. C., Najita J., Tokunaga A. T., 2003, ApJ, 585, 372
- Luhman (2001) Luhman K. L., 2001, ApJ, 560, 287
- Luhman (2004) Luhman K. L., 2004, ApJ, 602, 816
- Luhman et al. (2003) Luhman K. L., Stauffer J. R., Muench A. A., Rieke G. H., Lada E. A., Bouvier J., Lada C. J., 2003, ApJ, 593, 1093
- Luhman et al. (2006) Luhman K. L., Whitney B. A., Meade M. R., Babler B. L., Indebetouw R., Bracker S., Churchwell E. B., 2006, ApJ, 647, 1180
- Luhman (2008) Luhman K. L., 2008a, in Reipurth, B, ed., Handbook of Star Forming Regions, Volume II. Astron. Soc. Pac., San Francisco, p. 169
- Luhman et al. (2008) Luhman K. L. et al., 2008b, ApJ, 675, 1375
- Mamajek (2009) Mamajek E. E., 2009, in Usuda T., Ishii M., Tamura, M., eds, AIP Conf. Proc. Vol. 1158, Exoplanets and Disks: Their Formation and Diversity. American Institute of Physics, Melville, NY, p. 3
- Mamajek et al. (1999) Mamajek E. E., Lawson W. A., Feigelson E. D., 1999, ApJL, 516, L77
- Mann & Williams (2009) Mann R. K., Williams J. P., 2009, ApJL, 694, L36
- Mathews et al. (2012) Mathews G. S., Williams J. P., Ménard F., Phillips N., Duchêne G., Pinte C., 2012, ApJ, 745, 23
- Meeus et al. (2001) Meeus G., Waters L. B. F. M., Bouwman J., van den Ancker M. E., Waelkens C., Malfait K., 2001, A&A, 365, 476
- Meeus et al. (2012) Meeus G., et al., 2012, A&A, 544, A78
- Megeath et al. (2005) Megeath S. T., Hartmann L., Luhman K. L., Fazio G. G., 2005, ApJL, 634, L113
- Megeath et al. (2008) Megeath S. T., Townsley L. K., Oey M. S., Tieftrunk A. R., 2008, hsf1.book, 264
- Mendigutía et al. (2011) Mendigutía I., Calvet N., Montesinos B., Mora A., Muzerolle J., Eiroa C., Oudmaijer R. D., Merín B., 2011, A&A, 535, A99
- Millan-Gabet et al. (2007) Millan-Gabet R., Malbet F., Akeson R., Leinert C., Monnier J., Waters R., 2007, in Reipurth, B., Jewitt, D., Keil, K., eds., Protostars and Planets V. Univ. Arizona Press, Tucson, AZ, p. 539
- Muench et al. (2002) Muench A. A., Lada E. A., Lada C. J., Alves J., 2002, ApJ, 573, 366
- Muzerolle et al. (2010) Muzerolle J., Allen L. E., Megeath S. T., Hernández J., Gutermuth R. A., 2010, ApJ, 708, 1107
- Nakagawa et al. (1981) Nakagawa Y., Nakazawa K., Hayashi C., 1981, Icarus, 45, 517
- Natta et al. (2001) Natta A., Prusti T., Neri R., Wooden D., Grinin V. P., Mannings V., 2001, A&A, 371, 186
- Palla & Stahler (2000) Palla F., Stahler S. W., 2000, ApJ, 540, 255
- Papaloizou et al. (2007) Papaloizou J. C. B., Nelson R. P., Kley W., Masset F. S., Artymowicz P., 2007, Protostars and Planets V, in Reipurth, B., Jewitt, D., Keil, K., eds., Protostars and Planets V. Univ. Arizona Press, p. 655
- Pinte et al. (2008) Pinte C., et al., 2008, A&A, 489, 633
- Preibisch et al. (2002) Preibisch T., Brown A. G. A., Bridges T., Guenther E., Zinnecker H., 2002, AJ, 124, 404
- Rebull et al. (2002) Rebull L. M. et al., 2002, AJ, 123, 1528
- Reipurth (2008a) Reipurth B., 2008, hsf1.book,
- Reipurth (2008b) Reipurth B., 2008, hsf2.book,
- Renson & Manfroid (2009) Renson P., Manfroid J., 2009, A&A, 498, 961
- Robinson et al. (2006) Robinson S. E., Laughlin G., Bodenheimer P., Fischer D., 2006, ApJ, 643, 484
- Roccatagliata et al. (2011) Roccatagliata V., Bouwman J., Henning T., Gennaro M., Feigelson E., Kim J. S., Sicilia-Aguilar A., Lawson W. A., 2011, ApJ, 733, 113
- Schaefer et al. (2006) Schaefer G. H., Simon M., Beck T. L., Nelan E., Prato L., 2006, AJ, 132, 2618
- Shu et al. (1987) Shu F. H., Adams F. C., Lizano S., 1987, ARA&A, 25, 23
- Sicilia-Aguilar et al. (2004) Sicilia-Aguilar A., Hartmann L. W., Briceño C., Muzerolle J., Calvet N., 2004, AJ, 128, 805
- Sicilia-Aguilar et al. (2005) Sicilia-Aguilar A., Hartmann L. W., Hernández J., Briceño C., Calvet N., 2005, AJ, 130, 188
- Sicilia-Aguilar et al. (2006) Sicilia-Aguilar, A., et al., 2006, ApJ, 638, 897
- Siess et al. (2000) Siess L., Dufour E., Forestini M., 2000, A&A, 358, 593
- Simon, Dutrey, & Guilloteau (2000) Simon M., Dutrey A., Guilloteau S., 2000, ApJ, 545, 1034
- Strom et al. (1989) Strom K. M., Strom S. E., Edwards S., Cabrit S., Skrutskie M. F., 1989, AJ, 97, 1451
- Tanaka, Himeno, & Ida (2005) Tanaka H., Himeno Y., Ida S., 2005, ApJ, 625, 414
- Strom et al. (1976) Strom S. E., Vrba F. J., Strom K. M., 1976, AJ, 81, 314
- Tognelli, Prada Moroni, & Degl’Innocenti (2011) Tognelli E., Prada Moroni P. G., Degl’Innocenti S., 2011, A&A, 533, A109
- Trilling et al. (2002) Trilling D. E., Lunine J. I., Benz W., 2002, A&A, 394, 241
- Trilling et al. (1998) Trilling D. E., Benz W., Guillot, T., Lunine J. I., Hubbard W. B., Burrows A., 1998, ApJ, 500, 428
- Uzpen et al. (2009) Uzpen B., Kobulnicky H. A., Kinemuchi K., 2009, AJ, 137, 3329
- Villaver & Livio (2009) Villaver E., Livio M., 2009, ApJL, 705, L81
- Weidenschilling (1997) Weidenschilling S. J., 1997, Icarus, 127, 290
- Wilking et al. (2004) Wilking B. A., Meyer M. R., Greene T. P., Mikhail A., Carlson G., 2004, AJ, 127, 1131
- Wilking, Gagné, & Allen (2008) Wilking B. A., Gagné M., Allen L. E., 2008, in Reipurth, B, ed., Handbook of Star Forming Regions, Volume II. Astron. Soc. Pac., San Francisco, p.351
- Williams & Cieza (2011) Williams J. P., Cieza L. A., 2011, ARA&A, 49, 67
- Winston et al. (2010) Winston E., et al., 2010, AJ, 140, 266
- Wolff et al. (2011) Wolff S. C., Strom S. E., Rebull L. M., 2011, ApJ, 726, 19
- Wolk & Walter (1996) Wolk S. J., Walter F. M., 1996, AJ, 111, 2066
- Wright et al. (2009) Wright, J. T., Upadhyay, S., Marcy, G. W., Fischer D. A., Ford E. B., Johnson J. A., 2009, ApJ, 693, 1084
- Wyatt et al. (2007) Wyatt M. C., Clarke C. J., Greaves J. S., 2007, MNRAS, 380, 1737
- Yasui et al. (2009) Yasui C., Kobayashi N.,Tokunaga A. T., Saito, M., Tokoku, C., 2009, ApJ, 705, 54
- Yasui et al. (2010) Yasui C., Kobayashi N., Tokunaga A. T., Saito M., Tokoku C., 2010, ApJL, 723, L113
- Yi, Kim, & Demarque (2003) Yi S. K., Kim Y.-C., Demarque P., 2003, ApJS, 144, 259
- Zinnecker & Yorke (2007) Zinnecker H., Yorke H. W., 2007, ARA&A, 45, 481
Appendix A List of Sample Intermediate-mass Stars in Target Clusters
In this appendix, the intermediate-mass star samples for all 19 clusters listed in Table 3 are summarized in tables (Tabs. A1–A19) as well as in colour–colour diagrams (Figs. A1–A19).
In the tables, only RA, Dec coordinates (in J2000) are shown in case objects names are not available in the references. “SpT” shows the spectral types in the literatures. The “ disk” and “MIR disk” columns show objects with a disk (o) and without a disk (X). The numbers in the parenthesis in MIR disk column is as defined in Section 1. The stars with -disk emission are judged from the colour–colour diagram, in which the red and black circles show those with a disk and without a disk, respectively.
The values for MIR disk are directly referred from Gutermuth et al. (2009). Though extinction is not corrected for values in this reference, it should not affect the disk judgement because the value is much larger than . The spectral type with mark is from SIMBAD database.
| Name | RAJ2000 | DEJ2000 | SpT | K disk | MIR disk |
|---|---|---|---|---|---|
| (h:m:s) | (d:m:s) | ||||
| 2MASS J03291977+3124572 | 03 29 19.77605 | +31 24 57.0474 | B8* | X | … |
| 2MASS J03285720+3114189 | 03 28 57.2107 | +31 14 19.056 | B* | X | … |
| 2MASS J03290575+3116396 | 03 29 05.754 | +31 16 39.69 | A3 | X | o (0.28) |
| 2MASS J03291037+3121591 (LZK 12) | 03 29 10.379 | +31 21 59.16 | F4–G0 | o | o (0.40) |
| 2MASS J03285930+3115485 | 03 28 59.306 | +31 15 48.52 | K2 | X | o (0.25) |
| 2MASS J03292187+3115363 (LkHA 271) | 03 29 21.873 | +31 15 36.30 | K4.0 | X | o (1.49) |
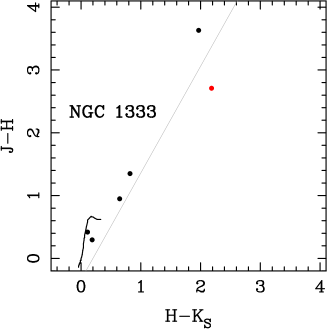
| RAJ2000 | DEJ2000 | SpT | disk |
|---|---|---|---|
| (h:m:s) | (d:m:s) | ||
| 05 35 06.08 | 05 12 15.22 | B3–B5 | X |
| 05 35 31.35 | 05 25 15.92 | B3–B6 | X |
| 05 35 40.06 | 05 17 29.12 | B6 | X |
| 05 35 54.10 | 05 37 42.50 | B5–B7 | X |
| 05 34 39.93 | 05 10 06.81 | B8–A0 | X |
| 05 34 55.20 | 05 30 21.52 | B8–B9 | X |
| 05 35 00.03 | 05 25 15.82 | B9–A1 | X |
| 05 35 58.45 | 05 22 30.62 | B8–B9.5 | X |
| 05 35 28.32 | 05 26 19.82 | B9.5–A0V | X |
| 05 35 16.88 | 05 21 45.02 | A0–A2 | X |
| 05 34 46.90 | 05 34 14.82 | B9–A1 | X |
| 05 36 27.08 | 05 24 30.20 | B9–A0 | X |
| 05 35 55.33 | 05 13 55.52 | A0–A5 | X |
| 05 35 35.67 | 05 12 20.32 | B9–A1 | X |
| 05 34 49.91 | 05 18 44.42 | A2–A7 | o |
| 05 35 50.36 | 05 28 34.62 | B8–A5 | o |
| 05 35 19.03 | 05 20 38.52 | B5–A7 | X |
| 05 35 18.70 | 05 17 28.92 | A8–F0 | o |
| 05 35 15.89 | 05 23 52.52 | F2–F7 | X |
| 05 35 31.28 | 05 33 08.62 | A8–F8 | o |
| 05 35 54.65 | 05 10 55.22 | F7–G4 | X |
| 05 35 05.11 | 05 14 50.22 | F8–G5 | X |
| 05 35 18.57 | 05 20 33.52 | F8–K0 | X |
| 05 35 11.53 | 05 16 57.52 | G0–K0 | X |
| 05 34 24.83 | 05 22 05.09 | G0–G1 | X |
| 05 35 21.16 | 05 09 15.82 | F8–K2 | o |
| 05 35 26.75 | 05 11 07.12 | G3 | o |
| 05 34 19.39 | 05 27 11.57 | G6 | X |
| 05 34 14.39 | 05 28 16.30 | G6–K0 | X |
| 05 35 26.10 | 05 27 36.22 | G3–K3 | X |
| 05 35 15.15 | 05 22 56.42 | G6–G8 | … |
| 05 35 35.89 | 05 12 25.02 | G6–K2 | o |
| 05 35 21.70 | 05 23 53.62 | G6–K3 | X |
| 05 35 20.94 | 05 23 48.62 | G8–K5 | X |
| RAJ2000 | DEJ2000 | SpT | disk |
|---|---|---|---|
| (h:m:s) | (d:m:s) | ||
| 05 35 26.19 | 05 08 39.72 | G8–K5.5 | … |
| 05 35 15.53 | 05 22 56.12 | G8–K1 | X |
| 05 35 18.95 | 05 23 49.22 | G8–K5 | … |
| 05 35 21.21 | 05 12 12.42 | G8–G0 | X |
| 05 35 28.49 | 05 31 26.12 | G | X |
| 05 35 02.75 | 05 22 07.92 | G | X |
| 05 34 53.52 | 05 26 36.72 | G | X |
| 05 35 20.11 | 05 20 56.72 | F7–K3 | o |
| 05 35 05.55 | 05 25 19.02 | A0–K4 | X |
| 05 35 23.73 | 05 30 46.92 | G8–K3 | X |
| 05 35 41.87 | 05 28 12.42 | K0–K1 | X |
| 05 35 54.56 | 05 22 00.72 | K0–K2 | X |
| 05 35 16.96 | 05 23 33.72 | K0–K2 | … |
| 05 35 11.77 | 05 19 26.02 | K0–K3 | … |
| 05 35 14.60 | 05 39 11.42 | K0–K3 | X |
| 05 35 20.65 | 05 15 49.12 | K0–K5 | X |
| 05 35 15.85 | 05 23 49.42 | G5–K0 | X |
| 05 35 25.63 | 05 09 49.22 | K0–K4 | X |
| 05 34 39.80 | 05 26 41.62 | K0–K3 | X |
| 05 35 21.18 | 05 24 56.92 | K1–K2 | X |
| 05 35 02.91 | 05 30 00.92 | K1–K2 | X |
| 05 35 34.81 | 05 29 14.02 | K1–K4 | X |
| 05 35 35.05 | 05 33 49.02 | K1–K5 | X |
| 05 35 31.18 | 05 15 32.92 | K1 | X |
| 05 35 38.74 | 05 12 41.72 | K2 | X |
| 05 35 08.29 | 05 28 28.92 | K2 | X |
| 05 34 51.48 | 05 25 12.62 | K2 | X |
| 05 35 19.19 | 05 20 07.72 | K2 | X |
| 05 34 33.87 | 05 28 24.22 | K2 | X |
| 05 34 45.10 | 05 25 03.62 | K2 | X |
| 05 34 55.89 | 05 23 12.62 | K0–K4 | X |
| 05 35 53.53 | 05 15 41.42 | K2–K3 | X |
| 05 35 17.41 | 05 17 39.82 | K2–K3 | X |
| 05 35 11.40 | 05 26 01.82 | K2–K3 | X |
| 05 35 13.69 | 05 39 10.52 | K2–K4 | X |
| 05 35 24.98 | 05 23 46.32 | K2–K4 | X |
| 05 35 15.96 | 05 20 36.32 | K2–K4 | X |
| 05 35 18.55 | 05 23 13.52 | K2–K5 | … |
| 05 34 37.35 | 05 34 51.92 | K2–K5 | X |
| 05 34 35.05 | 05 32 10.22 | K2 | X |
| 05 35 25.30 | 05 10 47.92 | K3 | X |
| 05 35 02.30 | 05 15 47.82 | K3 | X |
| 05 36 10.38 | 05 19 44.62 | K1–K3 | X |
| 05 35 29.74 | 05 32 53.12 | G8–K3 | X |
| 05 35 22.15 | 05 20 29.02 | K2–K4 | X |
| 05 35 17.50 | 05 22 56.22 | K3–K4 | X |
| 05 35 18.79 | 05 16 13.72 | K2–K5 | X |
| 05 35 14.88 | 05 21 59.62 | K3–K4 | X |
| 05 35 31.13 | 05 23 39.72 | K3–K5 | X |
| 05 35 05.52 | 05 11 50.62 | K3–K5 | X |
| 05 35 35.17 | 05 21 26.92 | K4 | … |
| 05 35 08.75 | 05 31 48.52 | K4 | X |
| 05 35 27.19 | 05 23 36.32 | K4 | X |
| 05 35 26.31 | 05 23 01.92 | K4–K5 | … |
| 05 35 04.43 | 05 29 37.82 | K4–K5 | … |
| 05 35 24.14 | 05 25 18.32 | K0-K5 | X |
| 05 35 50.66 | 05 16 29.02 | K5 | X |
| 05 35 23.54 | 05 23 31.62 | K5 | … |
| 05 35 21.47 | 05 09 38.72 | K5 | X |
| 05 35 20.90 | 05 31 21.22 | K5 | X |
| 05 35 06.19 | 05 22 02.32 | K5 | X |
| 05 35 04.67 | 05 17 42.12 | K5 | X |
| 05 35 02.34 | 05 20 46.32 | K5 | X |
| 05 34 58.71 | 05 21 17.52 | K5 | X |
| 05 34 50.63 | 05 24 01.02 | K5 | … |
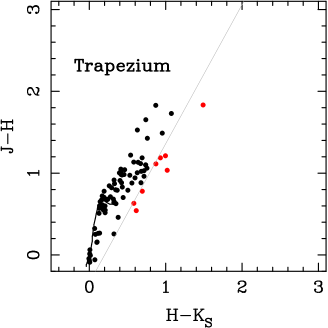
Because we could not find published IRAC photometry data, we directly used the MIR disk classification in Wilking, Gagné, & Allen (2008).
| RAJ2000 | DEJ2000 | SpT | disk | MIR disk |
|---|---|---|---|---|
| (h:m:s) | (d:m:s) | |||
| 16 26 9.31 | 24 34 12.10 | A0 V | X | … |
| 16 27 49.87 | 24 25 40.20 | A7 | X | X |
| 16 28 25.16 | 24 45 0.90 | F2 V | X | … |
| 16 25 7.93 | 24 31 57.20 | F5 | X | … |
| 16 27 10.28 | 24 19 12.70 | G1 | X | o |
| 16 25 19.24 | 24 26 52.60 | G1IV | X | … |
| 16 26 46.43 | 24 12 0.10 | G3.5 | X | … |
| 16 26 23.36 | 24 20 59.80 | G6 | X | o |
| 16 28 32.66 | 24 22 44.90 | G7 | X | … |
| 16 26 3.02 | 24 23 36.00 | K0 | X | … |
| 16 26 58.51 | 24 45 36.90 | K1 | … | … |
| 16 27 17.08 | 24 47 11.20 | K1 | X | … |
| 16 25 24.35 | 23 55 10.30 | K3/M0: (BA92) | X | … |
| 16 25 49.64 | 24 51 31.90 | K3/M0 (BA92W94) | X | … |
| 16 24 56.52 | 24 59 38.20 | K5 | X | … |
| 16 25 22.43 | 24 02 5.70 | K5 | X | … |
| 16 26 23.68 | 24 43 13.90 | K5 | X | … |
| 16 27 39.43 | 24 39 15.50 | K5 | X | o |
| 16 27 40.29 | 24 22 4.00 | K5 | X | o |
| 16 28 16.73 | 24 05 14.30 | K5 | X | … |
| 16 28 23.33 | 24 22 40.60 | K5 | X | … |
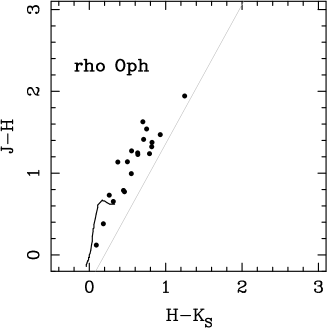
The and marks show the members that are identified as w/disks or w/o disks from SEDs in Furlan et al. (2006) and Furlan et al. (2011), respectively.
| Name | SpT | disk | MIR disk |
|---|---|---|---|
| V892 Tau | B9 | o | o |
| AB Aur | A0 | o | o |
| HP Tau/G2 | G0 | X | X |
| RY Tau | G1 | X | o |
| SU Aur | G1 | X | o |
| HD 283572 | G5 | X | X (2.82) |
| IRAS 04278+2253 | G8 | X | o |
| LkCa 19 | K0 | X | X |
| T Tau | K0 | o | o |
| HBC 388 | K1 | X | X |
| HQ Tau | K2 | X | o |
| IT Tau | K2 | X | o (1.47) |
| CW Tau | K3 | o | o |
| HP Tau | K3 | o | o |
| RW Aur | K3 | X | o |
| V773 Tau | K3 | X | o |
| HBC 356 | K3 | X | X |
| V410 Tau | K3 | X | X (2.79) |
| 2MASS J04390525+2337450 | K5 | X | o |
| DR Tau | K5 | o | o |
| DS Tau | K5 | o | o |
| FV Tau (A, B) | K5 | X | o (0.90) |
| FS Tau B (Haro 6-5B) | K5 | o | o |
| HN Tau (A, B) | K5 | o | o |
| LkCa 15 | K5 | X | o |
| UX Tau (A, Ba, Bb, C) | K5 | X | o |
| V807 Tau | K5 | X | o |
| HBC 392 | K5 | X | X |
| HBC 427 | K5 | X | X |
Notes:
The sample includes two low-mass stars with measured dynamical masses,
Lk Ca 15 (Hillenbrand &
White 2004; 0.84 ) and V807 Tau
(Schaefer et al. 2006; 1.15 ). By our criteria, both
objects have spectral type of K5 and are classified as IM stars. The
dynamical mass of V807 Tau is almost within the mass uncertainty of our
method as described in section 2.2. Lk Ca 15 has an estimated age
(3–5 Myr; Simon, Dutrey, & Guilloteau 2000) that is much higher than the average
Taurus cluster age (1.5 Myr; see also Fig. 3 in Simon et al. 2000),
which we employed for our IM star selection (see § 2.2 and
§ 8.1.2). However, these stars are included for consistency with the
other clusters. As discussed in section 2.2 up to 15 % of our sample
of IM stars could be low mass stars.
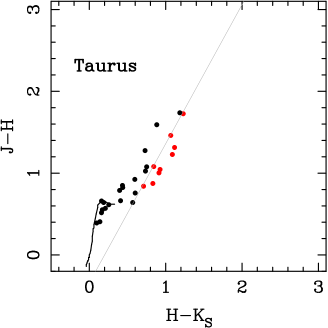
| RAJ2000 | DEJ2000 | SpT | disk | MIR disk |
|---|---|---|---|---|
| (h:m:s) | (d:m:s) | |||
| 11 05 57.81 | 76 07 48.9 | B6.5 | X | … |
| 11 08 03.30 | 77 39 17.4 | B9.5 | o | … |
| 11 09 50.03 | 76 36 47.7 | B9 | X | … |
| 10 46 37.95 | 77 36 03.6 | F0 | X | … |
| 11 06 15.41 | 77 21 56.8 | G5 | X | X (-2.67) |
| 11 07 20.74 | 77 38 07.3 | G2 | o | … |
| 11 08 15.10 | 77 33 53.2 | G7 | o | … |
| 11 12 27.72 | 76 44 22.3 | G9 | X | o (-1.27) |
| 11 12 42.69 | 77 22 23.1 | G8 | X | … |
| 10 58 16.77 | 77 17 17.1 | K0 | X | … |
| 10 59 06.99 | 77 01 40.4 | K2 | X | … |
| 11 10 38.02 | 77 32 39.9 | K3 | X | o (-1.24) |
| 11 12 24.41 | 76 37 06.4 | K3.5 | X | o (-0.57) |
| 11 12 43.00 | 76 37 04.9 | K4.5 | X | X (-2.78) |
| 11 04 09.09 | 76 27 19.4 | K5 | X | … |
| 11 09 53.41 | 76 34 25.5 | K5 | o | … |
| 11 10 00.11 | 76 34 57.9 | K5 | o | … |
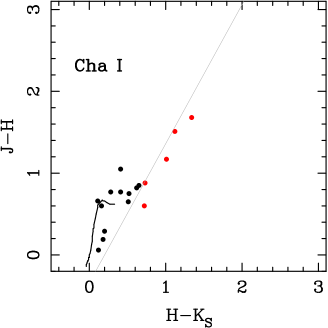
| Name | RAJ2000 | DEJ2000 | SpT | disk | MIR disk |
|---|---|---|---|---|---|
| (FM2008) | (h:m:s) | (d:m:s) | |||
| 1173 | 05 47 10.98 | 00 19 14.81 | G6 | X | o (1.08) |
| 1099 | 05 47 06.00 | 00 32 08.48 | K0 | o | o (1.04) |
| 618 | 05 46 22.44 | 00 08 52.62 | K1 | X | o (1.64) |
| 571 | 05 46 18.30 | 00 06 57.85 | K1 | X | o (0.73) |
| 515 | 05 46 11.86 | 00 32 25.91 | K2 | X | X (2.24) |
| 590 | 05 46 19.47 | 00 05 20.00 | K2.5 | X | o (0.65) |
| 984 | 05 46 56.54 | 00 20 52.91 | K3 | X | X (2.46) |
| 458 | 05 46 07.89 | 00 11 56.87 | K3 | X | o (1.92) |
| 739 | 05 46 34.54 | 00 06 43.45 | K4 | X | o (1.12) |
| 581 | 05 46 18.89 | 00 05 38.11 | K4 | X | o (1.27) |
| 177 | 05 45 41.94 | 00 12 05.33 | K4 | X | X (2.63) |
| 1116 | 05 47 06.96 | 00 00 47.74 | K4.5 | X | o (0.95) |
| 584 | 05 46 19.06 | 00 03 29.59 | K5 | o | o (1.00) |
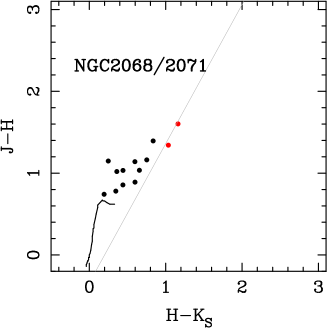
| RAJ2000 | DEJ2000 | SpT | disk | MIR disk |
|---|---|---|---|---|
| (h:m:s) | (d:m:s) | |||
| 03 44 34.20 | +32 09 46.3 | B5 | X | X (2.58) |
| 03 44 08.48 | +32 07 16.5 | A0 | X | X (2.79) |
| 03 44 50.65 | +32 19 06.8 | A0 | X | X (2.82) |
| 03 44 30.82 | +32 09 55.8 | A2 | X | o (0.73) |
| 03 44 09.15 | +32 07 09.3 | A2 | X | X (2.53) |
| 03 44 35.36 | +32 10 04.6 | A2 | X | o (1.37) |
| 03 44 32.06 | +32 11 44.0 | A3 | … | … |
| 03 45 01.42 | +32 05 02.0 | A4 | X | X (2.69) |
| 03 44 47.72 | +32 19 11.9 | A4 | X | X (2.70) |
| 03 44 19.13 | +32 09 31.4 | F0 | X | X (2.81) |
| 03 44 31.19 | +32 06 22.1 | F0 | X | X (2.79) |
| 03 44 24.66 | +32 10 15.0 | F2 | X | X (2.82) |
| 03 44 23.99 | +32 11 00.0 | G0 | X | X (2.77) |
| 03 44 31.96 | +32 11 43.9 | G0 | X | o (1.01) |
| 03 44 18.16 | +32 04 57.0 | G1 | X | o (1.66) |
| 03 45 07.61 | +32 10 28.1 | G1 | X | X (2.67) |
| 03 44 36.94 | +32 06 45.4 | G3 | X | o (1.93) |
| 03 45 07.96 | +32 04 02.1 | G4 | X | X (2.68) |
| 03 43 51.24 | +32 13 09.4 | G5 | X | X (2.70) |
| 03 44 32.74 | +32 08 37.5 | G6 | X | X (2.75) |
| 03 44 39.17 | +32 09 18.3 | G8 | X | X (2.89) |
| 03 44 26.03 | +32 04 30.4 | G8 | X | o (1.31) |
| 03 45 01.52 | +32 10 51.5 | K0 | X | X (2.60) |
| 03 44 16.43 | +32 09 55.2 | K0 | X | X (2.77) |
| 03 43 55.51 | +32 09 32.5 | K0 | X | X (2.61) |
| 03 44 08.86 | +32 16 10.7 | K0 | X | X (2.72) |
| 03 44 56.15 | +32 09 15.5 | K0 | X | o (1.88) |
| 03 44 40.13 | +32 11 34.3 | K2 | X | X (2.66) |
| 03 44 31.53 | +32 08 45.0 | K2 | X | X (2.70) |
| 03 44 39.25 | +32 07 35.5 | K3 | X | X (2.60) |
| 03 44 38.72 | +32 08 42.0 | K3 | X | X (2.91) |
| 03 44 05.00 | +32 09 53.8 | K3.5 | X | X (2.77) |
| 03 45 01.74 | +32 14 27.9 | K4 | X | X (2.75) |
| 03 44 55.63 | +32 09 20.2 | K4 | X | X (2.74) |
| 03 44 24.29 | +32 10 19.4 | K5 | X | X (2.68) |
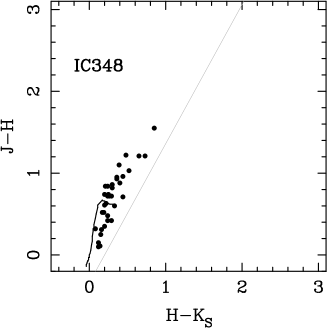
The spectral type with mark is from SIMBAD database.
| Name | RAJ2000 | DEJ2000 | SpT | disk | MIR disk |
|---|---|---|---|---|---|
| (h:m:s) | (d:m:s) | ||||
| HD 37525 | 05 39 01.49131 | 02 38 56.3650 | B5 | X | X (2.85) |
| HD 294271 | 05 38 36.5494 | 02 33 12.740 | B5V* | X | X (2.91) |
| 2MASS J053834220234160 | 05 38 34.235 | 02 34 16.08 | B8V* | X | X (2.81) |
| HD 37545 | 05 39 09.2145 | 02 56 34.732 | B9* | X | X (2.79) |
| V1147 Ori | 05 39 46.1950 | 02 40 32.054 | B9 | X | X (2.81) |
| HD 294272 | 05 38 34.799 | 02 34 15.78 | B9.5III | X | X (2.91) |
| HD 37564 | 05 39 15.0594 | 02 31 37.618 | A0* | X | X (2.51) |
| HD 294275 | 05 37 31.8728 | 02 45 18.473 | A1V* | X | X (2.81) |
| HD 294279 | 05 38 31.3795 | 02 55 03.075 | A2* | X | X (2.76) |
| HD 294273 | 05 38 27.5241 | 02 43 32.596 | A3* | X | X (2.87) |
| HD 294299 | 05 39 40.572 | 02 25 46.82 | F2* | X | X (2.76) |
| HD 294268 | 05 38 14.1139 | 02 15 59.741 | F8* | X | o (0.17) |
| HD 294274 | 05 37 45.3662 | 02 44 12.491 | G0* | X | X (2.85) |
| HD 294298 | 05 39 59.318 | 02 22 54.35 | G0* | X | X (2.84) |
| 2MASS J053753030233344 | 05 37 53.036 | 02 33 34.41 | K0 | X | X (2.82) |
| 2MASS J053838480234550 | 05 38 38.486 | 02 34 55.02 | K0 | X | X (2.63) |
| 2MASS J053936540242171 | 05 39 36.543 | 02 42 17.16 | K0* | X | X (2.79) |
| 2MASS J053754400239298 | 05 37 54.405 | 02 39 29.85 | K0: | X | X (2.86) |
| TY Ori | 05 38 35.873 | 02 43 51.22 | K3* | X | o (1.85) |
| 2MASS J053841290237225 | 05 38 41.292 | 02 37 22.57 | K3 | X | X (2.78) |
| 2MASS J053848030227141 | 05 38 48.036 | 02 27 14.19 | K3 | X | o (1.55) |
| 2MASS J053854100249297 | 05 38 54.107 | 02 49 29.77 | K3* | X | X (2.80) |
| TX Ori | 05 38 33.685 | 02 44 14.15 | K4* | X | o (0.97) |
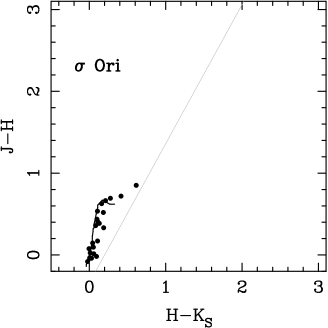
| RAJ2000 | DEJ2000 | SpT | disk |
|---|---|---|---|
| (h:m:s) | (d:m:s) | ||
| 06 41 32.7 | +09 53 24 | A2 | X |
| 06 41 27.7 | +09 55 13 | A2 | X |
| 06 41 36.6 | +09 37 56 | A5 | X |
| 06 41 24.3 | +09 46 10 | A5 | X |
| 06 40 39.3 | +09 59 22 | A5 | X |
| 06 40 47.0 | +09 55 03 | F0 | X |
| 06 40 37.8 | +09 40 11 | F0 | X |
| 06 41 26.2 | +09 47 22 | F1 | X |
| 06 41 24.3 | +09 56 09 | F1 | X |
| 06 40 50.4 | +09 54 16 | F1 | X |
| 06 41 26.0 | +09 57 15 | F3 | X |
| 06 40 33.5 | +09 42 55 | F5 | X |
| 06 41 13.8 | +09 55 44 | G0 | X |
| 06 40 37.3 | +09 42 15 | G0 | X |
| 06 39 41.6 | +09 34 40 | G0 | X |
| 06 40 41.4 | +09 54 13 | G1 | X |
| 06 41 08.9 | +09 46 01 | G2.5 | X |
| 06 41 03.5 | +09 31 19 | G3 | X |
| 06 40 56.6 | +09 54 10 | G4 | X |
| 06 41 29.2 | +09 39 36 | G5 | X |
| 06 41 04.5 | +09 51 50 | G5 | X |
| 06 39 46.8 | +09 40 54 | G5 | X |
| 06 40 59.4 | +09 55 20 | G6 | X |
| 06 40 59.4 | +09 55 20 | G6 | X |
| 06 40 21.1 | +09 36 32 | G6 | X |
| 06 41 06.8 | +09 34 46 | G6: | X |
| 06 40 09.7 | +09 41 43 | G9 | X |
| 06 41 02.6 | +09 34 56 | K0 | X |
| 06 41 02.3 | +09 51 52 | K0 | X |
| 06 39 43.6 | +09 36 04 | K0 | X |
| 06 41 23.3 | +09 52 42 | K0: | X |
| 06 41 15.4 | +09 46 40 | K1 | X |
| 06 41 06.9 | +09 23 22 | K1.5 | X |
| 06 41 00.3 | +09 58 49 | K1.5 | X |
| 06 41 01.0 | +09 32 45 | K1: | X |
| 06 41 36.8 | +09 58 20 | K2 | X |
| 06 41 31.6 | +09 48 33 | K2 | X |
| 06 41 27.2 | +09 35 07 | K2 | X |
| 06 41 05.0 | +09 50 46 | K2 | X |
| 06 40 58.8 | +09 30 57 | K2 | X |
| 06 40 48.8 | +09 32 43 | K2 | X |
| 06 40 47.6 | +09 49 29 | K2 | X |
| 06 40 45.2 | +09 28 45 | K2 | X |
| 06 40 30.0 | +09 50 10 | K2 | X |
| 06 41 04.2 | +09 52 02 | K3 | X |
| 06 41 00.5 | +09 45 03 | K3 | X |
| 06 41 21.5 | +09 58 35 | K4 | X |
| 06 41 18.3 | +09 33 54 | K4 | X |
| 06 41 16.8 | +09 27 30 | K4 | X |
| 06 41 09.4 | +09 59 38 | K4 | X |
| 06 41 01.6 | +10 00 36 | K4 | X |
| 06 40 51.6 | +09 43 24 | K4 | X |
| 06 40 39.2 | +09 50 58 | K4 | X |
| 06 40 30.7 | +09 46 11 | K4 | X |
| 06 40 28.8 | +09 31 01 | K4 | X |
| 06 40 16.1 | +09 57 37 | K4 | X |
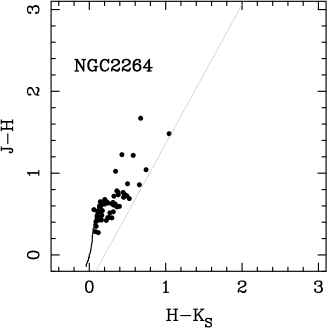
| Name | SpT | disk | MIR disk |
|---|---|---|---|
| CCDM+5734Ae | B3 | X | X (2.61) |
| MVA-63 | B4 | X | … |
| MVA-1312 | B4 | X | … |
| CCDM+5734Aw | B5 | X | X (2.61) |
| MVA-805 | B6 | X | … |
| MVA-437 | B7 | X | X (2.78) |
| AG+561491 | B7 | X | |
| MVA-426 | B7 | o | … |
| MVA-468 | B7 | X | X (2.32) |
| MVA-252 | B7 | X | … |
| MVA-182 | B8 | X | … |
| KUN-196 | B9 | X | o (1.86) |
| MVA-662 | B9 | X | X (2.60) |
| MVA-535 | B9 | X | X (2.80) |
| MVA-463 | A0 | X | … |
| SBZ-2-46 | A0 | X | … |
| MVA-81 | A0 | X | … |
| tr37-185 | A1 | X | … |
| BD+572362 | A1 | X | … |
| MVA-497 | A1 | X | … |
| MVA-566 | A1 | X | … |
| KUN-318 | A1 | X | X (2.90) |
| KUN-197 | A2 | X | X (2.93) |
| MVA-660 | A2 | X | … |
| MVA-258 | A2 | X | … |
| MVA-164 | A3 | X | … |
| BD+572355 | A4 | X | X (2.67) |
| MVA-169 | A4 | X | … |
| MVA-640 | A7 | X | … |
| BD+572356 | A7 | X | X (2.74) |
| MVA-545 | A7 | X | … |
| MVA-224e | A7 | X | X (2.94) |
| KUN-89 | A8 | X | X (2.66) |
| MVA-472 | A8 | X | … |
| MVA-564 | A9 | X | … |
| MVA-657 | F0 | X | … |
| KUN-87 | F0 | X | … |
| MVA-447 | F0 | X | … |
| KUN-93 | F1 | X | X (2.79) |
| KUN-327 | F1 | X | … |
| KUN-100 | F3 | X | … |
| KUN-198 | F3 | X | X (2.58) |
| KUN-191 | F5 | X | X (2.83) |
| KUN-97 | F6 | X | … |
| KUN-58 | F6 | X | … |
| KUN-85 | F7 | X | … |
| MVA-523 | F7 | X | … |
| MVA-232 | F7 | X | X (2.77) |
| KUN-92 | F9 | X | … |
| KUN-86 | F9 | X | o (2.15) |
| KUN-84 | F9 | X | … |
| KUN-83 | F9 | X | X (3.04) |
| MVA-234 | F9 | X | … |
| KUN-56 | F9 | X | … |
| KUN-314S | A* | o | … |
| KUN-56 | F9.0 | X | … |
| SHB2004 11-581 | G | X | X (2.79) |
| SHB2004 11-1864 | G–K | … | X (2.35) |
| SHB2004 93-361 | G1 | … | … |
| SHB2004 13-277 | G1 | X | o (0.76) |
| SHB2004 73-537 | G1.5 | … | o (0.88) |
| SHB2004 12-1091 | G2.5 | X | o (1.17) |
| Name | SpT | disk | MIR disk |
|---|---|---|---|
| SHB2004 22-404 | G7 | X | … |
| SHB2004 21-1974 | G7.5 | X | … |
| SHB2004 82-272 | G9 | X | o (1.20) |
| SHB2004 13-669 | K1 | X | o (1.01) |
| SHB2004 13-236 | K2 | X | o (1.35) |
| SHB2004 11-2031 | K2 | X | o (0.75) |
| SHB2004 24-542 | K4 | X | X (2.70) |
| SHB2004 13-1087 | K4 | X | X (2.69) |
| SHB2004 12-94 | K4 | X | X (2.55) |
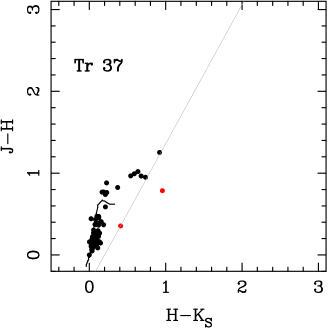
| RAJ2000 | DEJ2000 | SpT | disk |
|---|---|---|---|
| (h:m:s) | (d:m:s) | ||
| 05 41 08.1 | 03 37 57 | B3 | X |
| 05 35 35.9 | 03 15 10 | B3 | X |
| 05 35 12.8 | 00 44 07 | B3 | X |
| 05 33 07.3 | 01 43 02 | B3 | X |
| 05 37 45.9 | 00 46 42 | B4 | X |
| 05 35 22.3 | 04 25 28 | B4 | X |
| 05 48 46.0 | +00 43 32 | B5 | X |
| 05 39 02.4 | 05 11 40 | B5 | X |
| 05 39 01.5 | 02 38 56 | B5 | X |
| 05 37 34.8 | 01 25 20 | B5 | X |
| 05 37 14.5 | 01 40 04 | B5 | X |
| 05 36 17.8 | 01 38 07 | B6 | X |
| 05 35 09.2 | 00 16 11 | B6 | X |
| 05 59 37.7 | 01 26 39 | B7 | X |
| 05 43 43.8 | 00 56 19 | B7 | X |
| 05 40 25.3 | 04 25 16 | B7 | X |
| 05 38 06.5 | 00 11 03 | B7 | X |
| 05 34 56.5 | 00 07 22 | B7 | X |
| 05 34 19.8 | +04 49 30 | B7 | X |
| 05 20 07.8 | 05 50 46 | B7 | X |
| 05 53 27.1 | +00 46 45 | B8 | X |
| 05 49 32.7 | 00 40 55 | B8 | X |
| 05 42 48.8 | +04 51 09 | B8 | X |
| 05 38 31.3 | 00 08 52 | B8 | X |
| 05 37 30.3 | 00 14 25 | B8 | X |
| 05 33 07.5 | 05 20 26 | B8 | X |
| 05 32 14.8 | 04 31 06 | B8 | X |
| 05 30 48.7 | +00 01 43 | B8 | X |
| 05 30 43.0 | 05 29 27 | B8 | X |
| 05 28 52.6 | 00 36 11 | B8 | X |
| 05 16 34.3 | 05 03 41 | B8 | X |
| 05 14 52.8 | 04 37 36 | B8 | X |
| 05 59 14.6 | 04 21 34 | B9 | X |
| 05 58 36.1 | 02 05 57 | B9 | X |
| 05 51 09.5 | 04 34 57 | B9 | X |
| 05 49 13.1 | +01 27 30 | B9 | X |
| 05 46 41.3 | +02 14 27 | B9 | X |
| 05 42 17.6 | +02 22 02 | B9 | X |
| 05 41 02.3 | 02 43 01 | B9 | o |
| 05 39 55.4 | 03 19 50 | B9 | X |
| 05 39 45.2 | +04 26 05 | B9 | X |
| 05 38 50.2 | 04 16 18 | B9 | X |
| 05 36 14.1 | 02 15 32 | B9 | X |
| 05 35 39.9 | 03 18 58 | B9 | X |
| 05 35 13.8 | 02 22 52 | B9 | X |
| 05 33 45.5 | 00 01 44 | B9 | X |
| 05 33 26.1 | +00 37 17 | B9 | X |
| 05 33 05.6 | 01 43 16 | B9 | X |
| 05 33 03.7 | 01 14 28 | B9 | X |
| 05 30 10.4 | 05 12 06 | B9 | X |
| 05 29 08.9 | 05 47 28 | B9 | X |
| 05 28 40.4 | 02 44 01 | B9 | X |
| 05 27 43.2 | 00 15 33 | B9 | X |
| 05 20 32.9 | 05 17 17 | B9 | X |
| 05 20 28.9 | 05 48 44 | B9 | X |
| 05 17 54.8 | 04 29 24 | B9 | X |
| 05 15 05.2 | 05 15 09 | B9 | X |
| 05 10 47.6 | 05 10 11 | B9 | X |
| 05 59 35.6 | 04 20 15 | A0 | X |
| 05 55 57.3 | +00 50 10 | A0 | X |
| 05 50 24.1 | +01 46 43 | A0 | X |
| 05 49 53.7 | 00 11 01 | A0 | X |
| 05 46 43.2 | +02 42 26 | A0 | X |
| RAJ2000 | DEJ2000 | SpT | disk |
|---|---|---|---|
| (h:m:s) | (d:m:s) | ||
| 05 46 12.4 | 01 31 25 | A0 | X |
| 05 44 48.6 | 00 03 43 | A0 | X |
| 05 43 11.9 | 04 59 50 | A0 | o |
| 05 42 58.8 | 04 49 58 | A0 | X |
| 05 40 40.6 | 03 55 11 | A0 | X |
| 05 35 37.5 | 03 34 42 | A0 | X |
| 05 32 49.8 | 02 11 49 | A0 | X |
| 05 56 26.6 | 01 49 27 | A1 | X |
| 05 34 23.7 | +05 25 11 | A1 | X |
| 05 31 21.2 | 02 05 57 | A1 | X |
| 05 50 28.6 | 04 58 37 | A2 | X |
| 05 50 23.9 | +04 57 24 | A2 | X |
| 05 38 09.2 | 00 10 56 | A2 | o |
| 05 16 06.6 | 04 27 51 | A2 | X |
| 05 45 15.1 | 05 06 41 | A3 | X |
| 05 26 16.3 | 03 04 34 | A3 | X |
| 05 52 22.6 | 00 55 03 | A4 | X |
| 05 37 40.5 | 02 26 37 | A4 | X |
| 05 32 16.7 | 03 33 51 | A4 | X |
| 05 56 49.4 | 03 04 17 | A5 | X |
| 05 50 13.1 | +02 24 53 | A5 | X |
| 05 44 18.8 | +00 08 40 | A9 | o |
| 05 26 41.1 | 05 09 24 | F0 | X |
| 05 31 18.4 | 05 42 14 | F1 | X |
| 05 02 44.0 | 05 42 22 | F1 | X |
| 05 44 16.9 | 02 20 36 | F2 | X |
| 05 57 01.0 | 02 10 00 | F4 | X |
| 05 31 04.7 | 03 56 00 | F5 | X |
| 05 18 26.7 | 04 37 16 | F6 | X |
| 05 40 24.4 | +02 04 20 | G3 | X |
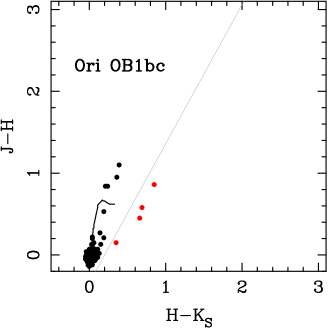
| Name | SpT | disk | MIR disk |
|---|---|---|---|
| HIP 78168 | B3V | X | X (2.94) |
| HIP 78246 | B5V | X | X (2.93) |
| HIP 77858 | B5V | X | X (2.90) |
| HIP 79530 | B6IV | X | X (2.92) |
| HIP 77900 | B7V | X | X (2.94) |
| HIP 78207 | B8Ia/Iab | X | o (2.02) |
| HIP 80338 | B8II | X | X (2.86) |
| HIP 77909 | B8III/IV | X | X (2.92) |
| HIP 79739 | B8V | X | X (2.92) |
| HIP 78877 | B8V | X | X (2.90) |
| HIP 78956 | B9.5V | X | X (2.89) |
| HIP 78549 | B9.5V | X | X (2.93) |
| HIP 80024 | B9II/III | X | X (2.91) |
| HIP 80493 | B9V | X | X (2.91) |
| HIP 79897 | B9V | X | X (2.93) |
| HIP 79785 | B9V | X | X (2.89) |
| HIP 79771 | B9V | X | X (2.89) |
| HIP 79439 | B9V | X | X (2.83) |
| HIP 79410 | B9V | X | X (2.75) |
| HIP 78968 | B9V | X | X (-3.01) |
| HIP 78809 | B9V | X | X (2.92) |
| HIP 78702 | B9V | X | X (2.90) |
| HIP 78530 | B9V | X | X (2.92) |
| HIP 77911 | B9V | X | X (2.88) |
| HIP 76633 | B9V | X | X (2.86) |
| HIP 76071 | B9V | X | X (2.94) |
| HIP 80311 | A0V | X | X (2.87) |
| HIP 79878 | A0V | X | X (2.88) |
| HIP 79860 | A0V | X | X (2.87) |
| HIP 79156 | A0V | X | X (2.77) |
| HIP 79124 | A0V | X | X (2.90) |
| HIP 78847 | A0V | X | X (2.88) |
| HIP 78196 | A0V | X | X (2.93) |
| HIP 78099 | A0V | X | X (2.92) |
| HIP 76310 | A0V | X | X (2.83) |
| HIP 80324 | A0V+A0V | X | X (2.88) |
| HIP 79733 | A1mA9-F2 | X | X (2.88) |
| HIP 77545 | A2/3V | X | X (2.82) |
| HIP 79392 | A2IV | X | X (2.86) |
| HIP 78494 | A2mA7-F2 | X | X (2.90) |
| HIP 79250 | A3III/IV | X | X (2.91) |
| HIP 82397 | A3V | X | X (2.90) |
| HIP 79366 | A3V | X | X (2.95) |
| HIP 77960 | A4IV/V | X | X (2.95) |
| HIP 77815 | A5V | X | X (2.88) |
| HIP 80059 | A7III/IV | X | X (2.77) |
| HIP 77457 | A7IV | X | X (2.91) |
| HIP 80130 | A9V | X | X (2.98) |
| HIP 80088 | A9V | X | X (2.77) |
| HIP 78996 | A9V | X | X (2.73) |
| HIP 78963 | A9V | X | X (2.96) |
| HIP 79643 | F2 | X | X (2.84) |
| HIP 78233 | F2/3IV/V | X | X (2.84) |
| HIP 82319 | F3V | X | X (2.87) |
| HIP 80896 | F3V | X | X (2.93) |
| HIP 79097 | F3V | X | X (2.86) |
| HIP 79083 | F3V | X | X (2.89) |
| HIP 79644 | F5 | X | X (2.85) |
| HIP 79606 | F6 | X | X (2.84) |
| RX J1550.9-2534 | F9 | X | X (2.83) |
| PZ99 J160000.7-250941 | G0 | X | X (2.83) |
| HD 149598 | G0 | X | X (2.79) |
| HD 146516 | G0IV | X | X (2.81) |
| HIP 78483 | G0V | X | X (2.80) |
| HD 147810 | G1 | X | X (2.83) |
| PZ99 J155812.7-232835 | G2 | X | X (2.79) |
| HIP 79462 | G2V | X | X (2.80) |
| PPM 747978 | G3 | X | X (2.81) |
| PPM 747651 | G3 | X | X (2.78) |
| HD 142361 | G3V | X | X (2.78) |
| PZ99 J161402.1-230101 | G4 | X | X (2.75) |
| HD 142987 | G4 | X | X (2.75) |
| PZ99 J161459.2-275023 | G5 | X | X (2.74) |
| PPM 732705 | G6 | X | X (2.79) |
| RX J1541.1-2656 | G7 | X | X (2.76) |
| PZ99 J161618.0-233947 | G7 | X | X (2.74) |
| SAO 183706 | G8e | X | X (2.81) |
| RX J1600.6-2159 | G9 | X | X (2.78) |
| PZ99 J161318.6-221248 | G9 | X | X (2.75) |
| RX J1603.6-2245 | G9 | X | X (2.77) |
| RX J1548.0-2908 | G9 | X | X (2.78) |
| PZ99 J161411.0-230536 | K0 | X | o (1.18) |
| RX J1602.8-2401A | K0 | X | X (2.70) |
| PZ99 J161933.9-222828 | K0 | X | X (2.68) |
| PZ99 J161329.3-231106 | K1 | X | X (2.72) |
| ScoPMS 21 | K1IV | X | X (2.74) |
| PZ99 J160814.7-190833 | K2 | X | X (2.75) |
| PZ99 J160421.7-213028 | K2 | X | X (2.55) |
| ScoPMS 27 | K2IV | X | X (2.75) |
| PZ99 J155847.8-175800 | K3 | X | X (2.73) |
| PZ99 J153557.8-232405 | K3: | X | X (2.75) |
| RX J1558.1-2405A | K4 | X | X (2.75) |
| PZ99 J161302.7-225744 | K4 | X | X (2.76) |
| PZ99 J160251.2-240156 | K4 | X | X (2.73) |
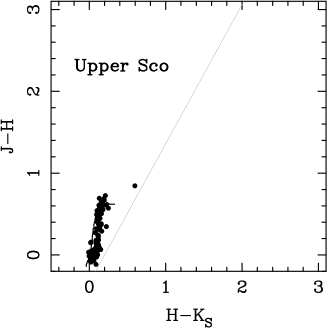
| RAJ2000 | DEJ2000 | SpT | disk | MIR disk |
|---|---|---|---|---|
| (h:m:s) | (d:m:s) | |||
| 07 18 58.40 | 24 57 41.2 | B3 | X | X (2.88) |
| 07 18 36.85 | 24 56 05.7 | B3 | X | X (2.95) |
| 07 18 40.81 | 24 58 27.5 | B5 | X | X (2.91) |
| 07 18 45.74 | 24 59 35.6 | B7 | X | X (2.93) |
| 07 18 38.10 | 24 59 01.6 | B9 | X | X (2.88) |
| 07 18 54.54 | 24 57 29.2 | A0 | X | X (2.72) |
| 07 18 35.48 | 24 58 59.5 | F2 | X | X (2.91) |
| 07 18 34.01 | 24 58 04.6 | F2 | X | X (2.79) |
| 07 18 48.54 | 25 01 48.6 | G2 | X | X (2.73) |
| 07 18 46.89 | 24 57 01.6 | G6 | X | X (2.81) |
| 07 18 59.61 | 24 58 51.3 | G8 | X | X (2.87) |
| 07 18 32.46 | 24 58 09.3 | K1 | X | X (2.73) |
| 07 18 24.51 | 24 54 32.3 | K1 | X | X (2.78) |
| 07 18 43.36 | 24 56 17.9 | K2 | X | X (2.87) |
| 07 18 40.20 | 24 55 13.1 | K2 | X | X (2.91) |
| 07 18 46.46 | 24 57 09.6 | K3 | X | X (3.02) |
| 07 18 31.63 | 25 01 47.5 | K3 | X | X (2.89) |
| 07 18 50.90 | 24 57 03.5 | K4 | X | X (2.78) |
| 07 18 35.31 | 25 00 35.3 | K4 | X | X (2.87) |
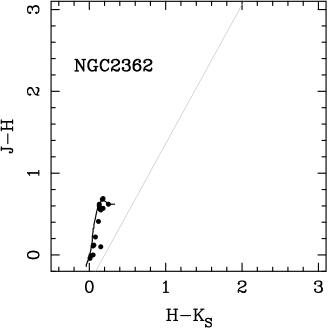
The spectral type with mark is from SIMBAD database.
| RAJ2000 | DEJ2000 | SpT | disk | MIR disk |
|---|---|---|---|---|
| (h:m:s) | (d:m:s) | |||
| 08 11 3929 | 47 21 06.5 | B2/B3III/IV | X | X (2.89) |
| 08 08 5123 | 47 10 27.7 | B3V | X | X (2.87) |
| 08 07 4074 | 47 15 17.5 | B8IV | X | X (2.85) |
| 08 08 2188 | 47 09 28.6 | B8Vne* | X | X (2.72) |
| 08 09 1107 | 46 59 53.4 | B9V | X | X (2.80) |
| 08 09 0430 | 47 41 02.4 | A0/A1V | X | X (2.78) |
| 08 08 2593 | 47 36 06.9 | A0V | X | X (2.85) |
| 08 09 0738 | 47 38 13.6 | A0V | X | X (2.79) |
| 08 11 1618 | 47 13 18.8 | A0V | X | X (2.82) |
| 08 09 1637 | 47 13 37.4 | A1/A2V | X | X (2.80) |
| 08 08 0690 | 47 15 07.4 | A1V | X | X (2.85) |
| 08 10 3253 | 47 12 40.9 | A2* | X | X (2.86) |
| 08 10 5813 | 47 29 13.6 | A2V | X | X (2.85) |
| 08 11 2187 | 47 11 28.1 | A5* | X | X (2.82) |
| 08 09 3482 | 47 21 06.9 | F0* | X | X (2.86) |
| 08 09 3763 | 47 21 25.6 | F0* | X | X (2.78) |
| 08 10 4836 | 47 34 55.9 | F5* | X | X (2.79) |

| Name | RAJ2000 | DEJ2000 | SpT | disk | MIR disk |
|---|---|---|---|---|---|
| (h:m:s) | (d:m:s) | ||||
| HD36895 | 05 35 1280 | +09 36 47.8 | B3 | X | X (2.91) |
| HD245203 | 05 35 1380 | +09 41 49.4 | B8 | X | X (2.89) |
| HD37035 | 05 35 5825 | +09 31 54.1 | B9 | X | X (2.84) |
| HD37110 | 05 36 2962 | +09 37 54.2 | B8 | X | X (2.75) |
| HD37051 | 05 36 0418 | +09 49 55.0 | B9 | X | X (2.77) |
| HD245140 | 05 34 5817 | +09 56 26.7 | B9 | X | X (2.81) |
| HD245168 | 05 35 02968 | +09 56 04.1 | B9 | … | X (2.78) |
| HD37034 | 05 35 5938 | +09 42 48.0 | A0 | X | X (2.73) |
| HD245185 | 05 35 0960 | +10 01 51.5 | A0 | o | o (0.29) |
| HD245385 | 05 36 1338 | +09 59 24.4 | A0 | … | X (2.83) |
| HD244908 | 05 33 4712 | +09 40 26.1 | A2 | … | X (2.85) |
| HD245386 | 05 36 2132 | +09 50 41.4 | A2 | … | X (2.89) |
| HD37159 | 05 36 5811 | +10 16 58.6 | A3 | X | X (2.80) |
| … | 05 34 4857 | +09 30 57.1 | A4 | … | X (2.73) |
| HD245275 | 05 35 4485 | +09 55 24.3 | A5 | … | X (2.83) |
| HD244927 | 05 33 5042 | +10 04 21.1 | A7 | X | X (2.87) |
| … | 05 34 5914 | +09 33 50.8 | F3 | … | X (2.88) |
| 299-3 | 05 36 0529 | +10 21 27.1 | F3 | … | X (2.87) |
| HD245370 | 05 36 0940 | +10 01 25.4 | F4 | X | X (2.58) |
| … | 05 33 4028 | +09 48 01.3 | F6 | … | X (2.86) |
| … | 05 33 5032 | +09 58 18.5 | F7 | X | X (2.86) |
| … | 05 35 2468 | +10 11 45.2 | F7 | … | X (2.86) |
| HD244907 | 05 33 5115 | +09 46 42.1 | F8 | X | X (2.84) |
| h-star | 05 35 0920 | +10 02 51.8 | F8 | … | X (2.87) |
| … | 05 36 5226 | +09 29 58.4 | F9 | … | X (2.88) |
| … | 05 35 4220 | +10 13 44.7 | G0 | … | X (2.83) |
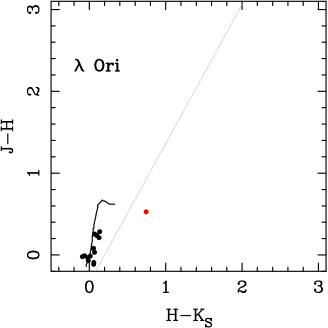
| RAJ2000 | DEJ2000 | SpT | disk |
|---|---|---|---|
| (h:m:s) | (d:m:s) | ||
| 04 06 39.0 | +32 23 06 | B3 | X |
| 03 47 52.7 | +33 36 00 | B3 | X |
| 03 47 25.7 | +29 52 33 | B3 | X |
| 04 06 55.8 | +33 26 47 | B4 | X |
| 03 49 07.3 | +32 15 51 | B6 | X |
| 03 25 50.1 | +30 55 54 | B6 | X |
| 03 50 51.3 | +35 05 59 | B7 | X |
| 03 44 40.7 | +29 49 21 | B7 | X |
| 03 55 58.7 | +32 09 48 | B8 | X |
| 04 12 45.2 | +31 47 41 | B9 | X |
| 04 07 24.5 | +33 05 17 | B9 | X |
| 04 02 56.6 | +31 55 54 | B9 | X |
| 03 58 35.5 | +31 24 30 | B9 | X |
| 03 55 54.9 | +32 09 18 | B9 | X |
| 03 54 20.7 | +30 59 55 | B9 | X |
| 03 44 51.3 | +30 08 09 | B9 | X |
| 03 28 17.4 | +29 52 07 | B9 | X |
| 03 20 53.5 | +38 53 07 | B9 | X |
| 03 07 51.0 | +33 03 18 | B9 | X |
| 03 06 35.1 | +38 36 07 | B9 | X |
| 03 58 55.5 | +32 45 23 | A0 | X |
| 03 34 57.9 | +29 18 48 | A0 | X |
| 03 11 57.6 | +38 32 17 | A0 | X |
| 03 10 06.3 | +38 20 44 | A0 | X |
| 03 03 11.3 | +41 20 07 | A1 | X |
| 03 40 40.3 | +29 27 17 | A5 | X |
| 03 02 23.6 | +43 11 02 | F8 | X |
| 03 36 00.0 | +23 54 51 | G4 | X |
| 03 55 06.9 | +27 03 52 | G5 | X |
| 03 22 11.9 | +27 36 27 | G6 | X |
| 03 46 09.5 | +28 51 33 | G8 | X |
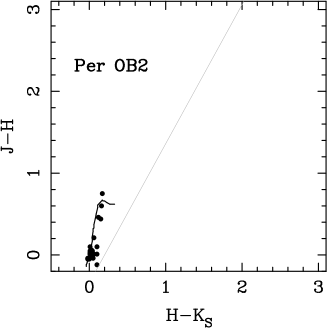
| Name | RAJ2000 | DEJ2000 | SpT | disk |
|---|---|---|---|---|
| (h:m:s) | (d:m:s) | |||
| Cha | 08 41 19.51 | 78 57 48.1 | B8V | X |
| HD 75505 | 08 41 44.71 | 79 02 53.3 | A1V | X |
| RS Cha | 08 43 12.22 | 79 04 12.3 | A7V | X |
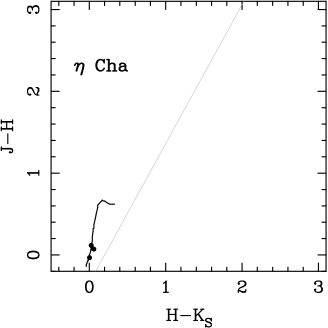
| RAJ2000 | DEJ2000 | SpT | disk |
|---|---|---|---|
| (h:m:s) | (d:m:s) | ||
| 05 31 29.9 | +01 41 24 | B3 | X |
| 05 27 09.4 | 01 22 02 | B3 | X |
| 05 21 31.8 | 00 24 59 | B3 | X |
| 05 28 45.3 | +01 38 38 | B4 | X |
| 05 27 45.8 | 02 08 44 | B4 | X |
| 05 26 54.3 | +03 36 53 | B4 | X |
| 05 24 36.1 | +02 21 11 | B4 | X |
| 05 22 51.0 | +03 33 08 | B4 | X |
| 05 13 39.1 | 03 37 19 | B4 | X |
| 05 04 54.5 | 03 02 23 | B5 | X |
| 05 37 56.3 | +00 59 15 | B6 | X |
| 05 37 53.5 | +00 58 07 | B6 | X |
| 05 33 08.9 | +03 07 52 | B6 | X |
| 05 31 41.2 | +02 49 58 | B6 | X |
| 05 28 48.5 | +02 09 53 | B6 | X |
| 05 27 44.7 | 01 48 47 | B6 | X |
| 05 25 01.2 | 02 48 56 | B6 | X |
| 05 18 01.0 | 00 02 16 | B6 | X |
| 05 27 54.2 | +01 06 18 | B7 | X |
| 05 23 10.1 | +01 08 23 | B7 | X |
| 05 02 44.6 | +03 27 28 | B7 | X |
| 05 30 04.4 | 01 44 59 | B8 | X |
| 05 29 55.6 | +02 08 32 | B8 | X |
| 05 29 36.4 | +05 13 38 | B8 | X |
| 05 28 12.6 | 01 56 29 | B8 | X |
| 05 28 10.1 | +00 47 14 | B8 | X |
| 05 27 36.9 | +01 06 27 | B8 | X |
| 05 25 11.4 | +01 55 24 | B8 | X |
| 05 23 51.4 | +00 51 46 | B8 | X |
| 05 23 01.9 | +01 41 49 | B8 | X |
| 05 21 03.3 | +04 28 41 | B8 | X |
| 05 08 21.4 | 02 17 23 | B8 | X |
| 05 06 22.9 | +02 40 24 | B8 | X |
| 05 34 26.0 | +01 21 37 | B9 | X |
| 05 33 21.9 | +02 22 36 | B9 | X |
| 05 32 39.5 | +02 05 32 | B9 | X |
| 05 27 20.6 | +02 12 57 | B9 | X |
| 05 26 48.1 | +02 04 06 | B9 | X |
| 05 26 06.0 | +00 50 02 | B9 | X |
| 05 25 55.9 | 02 20 08 | B9 | X |
| 05 23 50.4 | +02 04 56 | B9 | X |
| 05 23 28.1 | 01 00 09 | B9 | X |
| 05 23 22.9 | 01 26 27 | B9 | X |
| 05 22 43.1 | +00 08 21 | B9 | X |
| 05 21 28.4 | 01 32 46 | B9 | X |
| 05 20 24.7 | 03 30 35 | B9 | X |
| 05 19 38.8 | 01 06 31 | B9 | X |
| 05 19 07.5 | 01 05 56 | B9 | X |
| 05 18 30.0 | 01 08 18 | B9 | X |
| 05 17 09.8 | 02 34 48 | B9 | X |
| 05 16 43.8 | 00 53 20 | B9 | X |
| 05 13 37.9 | +04 12 40 | B9 | X |
| 05 12 50.0 | 01 33 49 | B9 | X |
| 05 10 57.3 | 01 45 50 | B9 | X |
| 05 10 04.9 | +02 56 09 | B9 | X |
| 05 07 35.9 | +04 32 30 | B9 | X |
| 05 07 29.4 | 03 18 41 | B9 | X |
| 05 03 21.6 | 02 58 57 | B9 | X |
| 05 00 48.8 | 00 30 03 | B9 | X |
| 05 00 39.8 | +03 15 55 | B9 | X |
| 05 40 17.1 | +00 58 21 | A0 | X |
| 05 39 43.2 | +00 54 27 | A0 | X |
| 05 33 27.4 | +02 39 06 | A0 | X |
| RAJ2000 | DEJ2000 | SpT | disk |
|---|---|---|---|
| (h:m:s) | (d:m:s) | ||
| 05 27 15.8 | +05 01 09 | A0 | X |
| 05 22 57.8 | 02 08 59 | A0 | X |
| 05 19 40.1 | 01 21 22 | A0 | X |
| 05 19 03.5 | +00 26 19 | A0 | X |
| 05 05 54.6 | +01 51 08 | A0 | X |
| 05 05 04.2 | 01 18 41 | A0 | X |
| 05 28 10.5 | 01 46 18 | A1 | X |
| 05 22 38.8 | 01 02 34 | A1 | X |
| 05 14 37.0 | +02 33 49 | A1 | X |
| 05 05 01.0 | +02 38 44 | A1 | X |
| 05 03 21.7 | 00 00 16 | A1 | X |
| 05 30 52.6 | +01 36 41 | A2 | X |
| 05 18 29.9 | +02 05 29 | A2 | X |
| 05 13 26.8 | 02 37 37 | A2 | X |
| 05 24 08.0 | +02 27 47 | A3 | o |
| 05 23 53.3 | 03 04 59 | A3 | X |
| 05 15 57.6 | +01 19 39 | A3 | X |
| 05 08 06.4 | +03 44 55 | A3 | X |
| 05 20 52.9 | +01 01 00 | A4 | X |
| 05 18 24.3 | 02 32 07 | A5 | X |
| 05 36 29.4 | +03 18 30 | A6 | X |
| 05 28 09.6 | +03 37 23 | A6 | X |
| 05 02 43.5 | +05 49 50 | A7 | X |
| 05 30 53.3 | +05 41 34 | A8 | X |
| 05 24 42.8 | +01 43 48 | A8 | o |
| 05 15 46.4 | 01 16 40 | A8 | X |
| 05 28 10.7 | +02 22 35 | F1 | X |
| 05 02 19.0 | 01 11 55 | F1 | X |
| 05 00 34.4 | +00 00 20 | F1 | X |
| 05 37 48.2 | +02 44 47 | F3 | X |
| 05 36 41.8 | +02 41 11 | F4 | X |
| 05 19 36.8 | +01 33 02 | F7 | X |
| 05 08 12.6 | +01 08 36 | G1 | X |
| 05 05 38.6 | +01 27 31 | G1 | X |
| 05 02 15.1 | 01 43 08 | G6 | X |
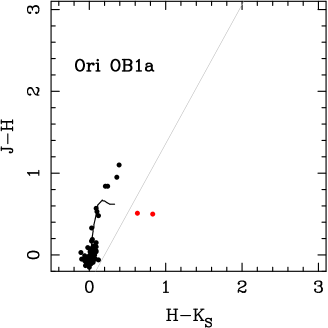
| Name | RAJ2000 | DEJ2000 | SpT | disk | MIR disk |
|---|---|---|---|---|---|
| (h:m:s) | (d:m:s) | ||||
| DG-513 | 21 52 32.89 | +62 23 56.9 | B5.0 | X | X (2.42) |
| DG-32 | 21 54 22.86 | +62 27 55.3 | B5.5 | X | X (2.80) |
| DG-940 | 21 56 07.66 | +62 34 06.9 | B8.5 | X | X (2.52) |
| DG-37 | 21 54 19.40 | +62 28 06.7 | B9.0 | X | X (2.91) |
| DG-424 | 21 51 55.66 | +62 27 13.8 | B9.0 | X | X (2.96) |
| DG-36 | 21 54 14.24 | +62 45 57.7 | B9.5 | X | X (2.99) |
| DG-720 | 21 54 02.85 | +62 26 34.8 | A0.0 | X | X (2.86) |
| DG-39 | 21 53 27.80 | +62 35 18.7 | A0.0 | X | X (2.68) |
| DG-460 | 21 52 11.46 | +62 38 45.6 | A0.0 | X | X (2.96) |
| DG-682 | 21 53 45.12 | +62 36 54.8 | A2.0 | X | X (2.57) |
| DG-529 | 21 52 39.25 | +62 44 49.5 | A2.0 | X | X (2.91) |
| DG-934 | 21 56 03.59 | +62 38 54.8 | A2.5 | X | X (2.95) |
| DG-853 | 21 55 07.13 | +62 43 33.7 | A2.5 | X | X (2.65) |
| DG-45 | 21 53 45.51 | +62 40 57.4 | A3.0 | X | X (2.98) |
| DG-67 | 21 52 59.85 | +62 42 06.4 | A4.0 | X | X (2.76) |
| DG-920 | 21 55 54.91 | +62 44 33.4 | A4.5 | X | X (2.87) |
| DG-954 | 21 56 15.84 | +62 45 44.1 | A5.0 | X | … |
| DG-47 | 21 53 55.61 | +62 36 18.0 | A5.0 | X | X (2.82) |
| DG-687 | 21 53 46.15 | +62 46 35.4 | A5.0 | X | X (2.90) |
| DG-946 | 21 56 10.81 | +62 34 54.9 | A5.5 | X | X (2.43) |
| DG-409 | 21 51 45.66 | +62 42 58.2 | A5.5 | X | X (2.99) |
| DG-42 | 21 53 36.84 | +62 32 48.5 | A6.0 | X | X (2.99) |
| DG-398 | 21 51 42.28 | +62 33 14.5 | A6.0 | X | X (2.92) |
| DG-685 | 21 53 45.42 | +62 45 25.0 | A6.5 | X | X (3.04) |
| DG-382 | 21 51 31.43 | +62 28 46.2 | A6.5 | X | X (2.86) |
| DG-907 | 21 55 43.05 | +62 42 28.9 | A7.0 | X | X (2.93) |
| DG-65 | 21 54 36.79 | +62 33 59.5 | A7.0 | X | X (2.87) |
| DG-526 | 21 52 38.57 | +62 45 52.3 | A7.0 | X | X (2.96) |
| DG-481 | 21 52 21.13 | +62 45 03.4 | A7.0 | X | o (1.75) |
| DG-794 | 21 54 33.51 | +62 47 53.1 | A8.0 | X | X (2.83) |
| DG-49 | 21 53 51.91 | +62 33 24.5 | A8.0 | X | X (2.92) |
| DG-531 | 21 52 39.31 | +62 46 58.1 | A8.0 | X | X (2.50) |
| DG-725 | 21 54 05.40 | +62 43 42.7 | A8.5 | X | X (2.95) |
| DG-899 | 21 55 38.35 | +62 45 53.0 | A9.0 | X | X (2.85) |
| DG-399 | 21 51 41.82 | +62 47 13.8 | F0.0 | X | X (2.90) |
| DG-408 | 21 51 45.44 | +62 47 05.3 | F0.5 | X | X (2.95) |
| DG-48 | 21 54 13.27 | +62 43 09.2 | F1.0 | X | X (2.86) |
| DG-952 | 21 56 14.29 | +62 41 41.7 | F1.5 | X | X (2.93) |
| DG-60 | 21 54 33.59 | +62 28 52.9 | F1.5 | X | X (2.89) |
| DG-41 | 21 53 19.42 | +62 37 38.7 | F2.0 | X | X (2.90) |
| DG-936 | 21 56 05.45 | +62 26 53.5 | F2.5 | X | X (2.86) |
| DG-52 | 21 55 19.88 | +62 39 15.0 | F3.0 | X | X (2.93) |
| DG-55 | 21 53 33.08 | +62 37 03.1 | F3.0 | X | X (2.94) |
| DG-58 | 21 54 15.89 | +62 36 04.5 | F3.5 | X | X (2.94) |
| DG-472 | 21 52 20.24 | +62 27 58.8 | F4.5 | X | X (2.71) |
| DG-423 | 21 51 54.64 | +62 44 06.7 | F4.5 | X | X (2.83) |
| DG-949 | 21 56 11.16 | +62 47 04.6 | F5.0 | X | … |
| DG-59 | 21 54 39.40 | +62 36 21.9 | F5.0 | X | X (2.97) |
| DG-62 | 21 54 30.34 | +62 31 15.7 | F5.0 | X | X (2.62) |
| DG-603 | 21 53 07.41 | +62 27 19.6 | F5.0 | X | X (2.87) |
| DG-394 | 21 51 38.59 | +62 35 50.6 | F5.0 | X | X (2.98) |
| DG-392 | 21 51 37.31 | +62 38 06.5 | F5.0 | X | X (2.82) |
| DG-912 | 21 55 47.60 | +62 35 43.2 | F5.5 | X | o (2.19) |
| DG-533 | 21 52 40.42 | +62 46 06.6 | F5.5 | X | X (2.93) |
| DG-825 | 21 54 52.61 | +62 45 28.2 | F6.0 | X | X (2.87) |
| DG-921 | 21 55 55.07 | +62 43 55.5 | F6.5 | X | X (2.88) |
| DG-422 | 21 51 54.87 | +62 38 34.6 | F6.5 | X | X (2.84) |
| DG-64 | 21 53 22.52 | +62 34 24.9 | F7.0 | X | X (2.77) |
| DG-40 | 21 52 49.71 | +62 31 30.9 | F7.0 | X | X (2.91) |
| DG-61 | 21 53 30.14 | +62 30 09.7 | F8.0 | X | X (2.96) |
| DG-414 | 21 51 46.81 | +62 46 11.6 | F8.0 | X | X (2.91) |
| DG-644 | 21 53 27.03 | +62 44 50.4 | F8.5 | X | X (2.97) |
| Name | RAJ2000 | DEJ2000 | SpT | disk | MIR disk |
|---|---|---|---|---|---|
| (h:m:s) | (d:m:s) | ||||
| DG-462 | 21 52 12.89 | +62 44 08.6 | F8.5 | X | X (2.84) |
| DG-50 | 21 53 35.48 | +62 30 03.2 | F9.0 | X | X (2.88) |
| DG-349 | 21 51 17.53 | +62 43 41.1 | F9.5 | X | X (2.94) |
| DG-56 | 21 54 07.28 | +62 44 26.0 | G0.5 | X | X (2.92) |
| DG-455 | 21 52 09.98 | +62 25 31.2 | G2.0 | X | X (2.96) |
| DG-895 | 21 55 36.36 | +62 43 53.8 | G2.5 | X | X (2.86) |
| DG-371 | 21 51 26.25 | +62 29 16.1 | G3.5 | X | X (2.88) |
| SHB2004 03-180 | 21 53 54.11 | +62 38 10.2 | F9 | X | X (2.78) |
| SHB2004 03-479 | 21 54 17.22 | +62 41 33.8 | G0 | X | X (2.88) |
| SHB2004 03-872 | 21 53 52.96 | +62 45 24.8 | G0 | X | … |
| SHB2004 03-791 | 21 54 56.24 | +62 44 42.2 | G2 | X | X (2.68) |
| SHB2004 03-228 | 21 53 59.59 | +62 38 43.3 | G2 | X | X (2.88) |
| SHB2004 03-654 | 21 53 58.11 | +62 43 21.3 | G2 | X | X (2.89) |
| SHB2004 04-1027 | 21 53 07.62 | +62 46 14.4 | G2 | X | X (2.93) |
| SHB2004 01-615 | 21 52 35.60 | +62 29 08.2 | G2 | X | X (2.77) |
| SHB2004 03-835 | 21 54 04.98 | +62 45 04.8 | G3.5 | X | X (2.91) |
| SHB2004 02-592 | 21 54 08.60 | +62 30 14.0 | G4 | X | … |
| SHB2004 04-521 | 21 52 58.91 | +62 41 34.7 | G4 | X | X (2.84) |
| SHB2004 03-500 | 21 55 04.86 | +62 41 47.9 | G5 | X | X (2.84) |
| SHB2004 01-1164 | 21 53 32.07 | +62 34 05.3 | G5.5 | X | X (2.91) |
