A Hadronic-Leptonic Model for the Fermi Bubbles: Cosmic-Rays in the Galactic Halo and Radio Emission
Abstract
We investigate non-thermal emission from the Fermi bubbles on a hadronic model. Cosmic-ray (CR) protons are accelerated at the forward shock of the bubbles. They interact with the background gas in the Galactic halo and create -decay gamma-rays and secondary electrons through proton-proton interaction. We follow the evolution of the CR protons and electrons by calculating their distribution functions. We find that the spectrum and the intensity profile of -decay gamma-rays are consistent with observations. We predict that the shock front is located far ahead of the gamma-ray boundary of the Fermi bubbles. This naturally explains the fact that a clear temperature jump of thermal gas was not discovered at the gamma-ray boundary in recent Suzaku observations. We also consider re-acceleration of the background CRs in the Galactic halo at the shock front. We find that it can significantly affect the gamma-rays from the Fermi bubbles, unless the density of the background CRs is % of that in the Galactic disk. We indicate that secondary electrons alone cannot produce the observed radio emission from the Fermi bubbles. However, the radio emission from the outermost region of the bubbles can be explained, if electrons are directly accelerated at the shock front with an efficiency of % of that of protons.
1 Introduction
The Fermi bubbles are huge gamma-ray structure detected by the Fermi gamma-ray satellite (Dobler et al., 2010; Su et al., 2010; Su & Finkbeiner, 2012). The two bubbles are symmetric about the Galactic plane and they extend above and below the Galactic center (GC). Their surface brightness is almost uniform and they have sharp rims. The gamma-ray spectrum is hard (). Similar structures have been found in the radio (Finkbeiner, 2004; Dobler, 2012; Planck Collaboration et al., 2013) and X-ray bands (Snowden et al., 1995; Sofue, 2000). While the morphology of the bubbles suggests that they were created through some violent activities around the GC, the origin of the cosmic-rays (CRs) that are responsible for the non-thermal emission has not been identified.
Several models have been proposed to explain properties of the Fermi bubbles. In some models, star formation activities around the GC are thought to be the origin of the CRs (Crocker & Aharonian, 2011; Crocker, 2012). In other models, CRs are carried by jets or outflows generated by the super-massive black hole at the GC (Zubovas et al., 2011; Guo & Mathews, 2012; Yang et al., 2012) or they are accelerated in the bubbles (Mertsch & Sarkar, 2011; Cheng et al., 2011). Alternatively, the Fermi bubbles may be a result of diffusive injection of Galactic CR protons during their propagation through the Galaxy, if the bubbles are expanding very slowly (Thoudam, 2013). The gamma-rays can be generated by interaction between CR protons and ambient gas (hadronic models), or by inverse Compton scattering by CR electrons (leptonic models).
Fujita et al. (2013, hereafter Paper I) proposed that CR protons accelerated at the forward shock of the bubbles generate gamma-rays through the hadronic interaction with gas protons (-interaction). We showed that the observed gamma-ray properties of the Fermi bubbles, such as the flat intensity profile, the sharp edge, and the hard spectrum, can be reproduced if the CRs were accelerated when the bubbles were small, and if the time scale of the energy injection at the GC was much smaller than the current age of the bubbles. The CRs are confined in the bubbles, because they excite Alfvén waves around the bubbles through streaming instabilities and the waves scatter the CRs well.
In this paper, we further develop the hadronic model. We study re-acceleration of background CRs by the Fermi bubbles. Those background CRs have escaped from the Galactic disk, and they are distributed in the Galactic halo. If the density of the background CRs is large and/or if they are effectively re-accelerated, the gamma-ray emission from the bubbles would be significantly affected by them. We also investigate radio emission from CR electrons in the Fermi bubbles, which was not investigated in Paper I. This paper is organized as follows. In Section 2, we describe our model for the evolution of the bubble and the acceleration of the CRs. In Section 3, we show the results of our calculations and discuss the re-acceleration of the background CRs and the radio emission from the bubbles. Finally, Section 4 is devoted to conclusions.
2 Models
2.1 Hydrodynamics of the Halo Gas
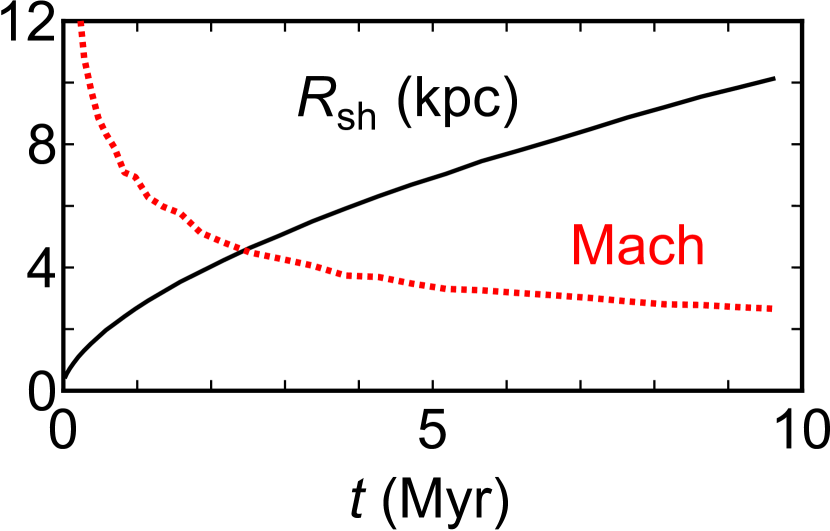
After energy is injected at the GC, a forward shock propagates in the Galactic halo. We do not consider the details of the energy injection; it may be caused by the activities of the super-massive black hole at the GC. In Paper I, we approximately treated the shock propagation using self-similar solutions under the assumption that the shock is strong. In this study, we numerically calculate the evolution, which enables us to include the effects of gravity from the Galaxy and decreasing Mach number of the shock. We assume that the time-scale of the energy injection is much smaller than the current age of the bubbles ( yr), because long-time injection is inconsistent with the gamma-ray intensity profile (Paper I). We do not consider the feedback from the accelerated CRs on gas because the Mach number is small (; see Figure 1).
For the sake of simplicity, we assume that the bubble is spherically symmetric, and we mainly focus on the high-galactic-latitude part of the Fermi bubbles (large and small in the Galactic coordinate). We solve the following equations:
| (1) |
| (2) |
| (3) |
where is the gas density, is the velocity, is the pressure, and the Galactic potential. The total energy is defined as , where is the adiabatic index for the gas.
We use a fixed Galactic potential adopted by Yang et al. (2012). The potential along the rotation axis of the Galaxy can be written as
| (4) |
where
| (5) |
is the halo potential,
| (6) |
is the potential for the Miyamoto-Nagai disk (Miyamoto & Nagai, 1975), and
| (7) |
is the potential for the Hernquist stellar bulge. We assume that , kpc, , kpc, kpc, , and kpc. At , the gas in the potential is isothermal and in hydrostatic equilibrium. The temperature is K and the density at is .
2.2 Cosmic-Rays
In Paper I, we solved a diffusion-convection equation to follow the evolution of CR distribution functions , where is the momentum of CRs. The equation was applied in the region far enough away from the shock and the CR acceleration at the shock front was separately treated by adopting a simple model. In this study, we treat not only protons () but also electrons () and positrons (). The equations are
| (8) |
where is the diffusion coefficient, and is the velocity of the waves that scatter CRs. The source describes particle injection for , where is the shock radius. The third term in the right-hand side represents cooling. For protons, the cooling can be ignored, and hence . Moreover, we assume that for protons, because they are injected (accelerated) only at the shock front. We also assume that for , where is the Alfvén velocity, and that for because the waves would isotropically propagate there.
In Paper I, we considered the evolution of by calculating growth of Alfvén waves through streaming instabilities. The results showed that CRs are well scattered by the waves and confined around the bubbles because of decrease of . While this also happens around supernova remnants (Fujita et al., 2010, 2011), the inefficiency of the CR diffusion is more significant for the Fermi bubbles because of their huge size for a given diffusion scale. Thus, we assume that the diffusion coefficient is much smaller than the Galactic value (say by an order of magnitude as is shown in Figure 3 in Paper I). In this case, the results are not much different from the one with . Therefore, we take from now on. Note that is the diffusion coefficient outside a very narrow region around the shock where the coefficient could be close to the Bohm limit and CR are accelerated to high energies. We do not explicitly solve CR acceleration there, and is generally much larger than the Bohm limit.
CRs accelerated at the shock front are swept downward from the shock with the gas. In Paper I, we considered only protons accelerated at the shock front (). In this study, we also investigate re-acceleration of CRs in the Galactic halo. Thus, instead of giving at , we approximate distribution functions at the shock front, , based on a steady-state, test-particle solution about a plane shock. Assuming that the CRs are confined around the bubble, we can integrate a diffusion-convection equation between the far upstream region of the shock and . We obtain
| (9) |
where is the distribution function of the pre-existing CRs, and is the compression ratio of the shock (Blandford & Ostriker, 1978; Drury, 1983). From this equation, we obtain
| (10) |
where is the normalization and is the lowest momentum, above which CRs can cross the shock; particles are not accelerated for (Blandford & Ostriker, 1978; Drury, 1983). The index is given by
| (11) |
where is the Mach number of the shock (Blandford & Eichler, 1987). The first term in the right-hand side of equation (10) refers to the re-acceleration of CRs advected into the shock from upstream region, and the second term represents CRs accelerated from the thermal background plasma. The index () is the increasing function of time in our calculations.
For the injection of CR protons at the shock front, we adopt a thermal leakage model (Kang et al., 2002; Kang & Ryu, 2011):
| (12) |
where is the downstream proton number density, is the thermal peak momentum of the downstream gas with a temperature of , is the proton mass, and is the Boltzmann constant. Here, and are defined as
| (13) |
where is the downstream flow speed in the shock rest frame. The factor depends on the structure of magnetic fields and we take .
The acceleration of the CR protons is limited by the age of the bubble. Since the acceleration time must be smaller than the age, the maximum momentum is
| (14) |
where is the proton charge, is the background magnetic field, is the gyro factor, is the shock velocity, and is the bubble age (Aharonian & Atoyan, 1999; Ohira et al., 2010). Thus, for , equation (10) cannot be applied and pre-existing CRs are just advected downstream. The maximum momentum decreases as the bubble expands in our calculations.
Although electrons (primary electrons) should be accelerated at the shock front in the same way as protons, their injection is expected to be less efficient than that of protons. Thus, we assume that , where is the parameter. The lowest energy of accelerated electrons, , is the same as but in equation (13) is replaced by the electron mass . The maximum momentum of electrons is limited by cooling, mainly synchrotron emission and inverse Compton (IC) scattering. The maximum momentum is obtained by replacing in equation (14) by :
| (15) |
We ignore positrons in the thermal plasma, and thus . The minimum and maximum momentums for positrons are the same as those for electrons ( and ).
The CR proton spectrum in the Galactic disk is approximated by
| (16) |
for GeV and for GeV, where is the energy (e.g. Gabici et al., 2009; Neronov et al., 2012). The CR proton spectrum in the Galactic halo is given by , where is the parameter (). We assume that , because cooling times of CR electrons and positrons are much shorter than the Galactic age ( Gyr, see Figure 28 in Su et al. 2010) and because they are not supplied in the halo. The background distribution functions are written as
| (17) |
The production rates of secondary electrons and positrons ( and , respectively) created through -interaction between CR protons and gas protons are calculated using the code provided by Karlsson & Kamae (2008) and the gas density distribution obtained by hydrodynamic simulations (Section 2.1). We do not consider re-acceleration of secondary electrons at the shock front because most of them are generated in the far downstream region of the shock and not in the vicinity of the shock. In order to calculate the cooling () and radiative processes for electrons and positrons, we adopt the models of Fang & Zhang (2008). We include synchrotron radiation, IC scattering, Coulomb interaction, and Bremsstrahlung. For IC scattering, we approximate the interstellar radiation field (ISRF) by four blackbody components at 2.7, 35, 3000, and 7000 K. On the Galactic rotation axis, their energy densities at 5 kpc away from the GC are , , , and , respectively (Porter & Strong, 2005; Porter et al., 2008). The ISRF data in GALPROP code111http://galprop.stanford.edu/ show that the energy density of the ISRF except for the cosmic microwave background component (2.7 K) scales as
| (18) |
along the rotation axis of the Galaxy, where is distance from the GC. For the background magnetic fields outside of the bubble (), we adopt a standard model in GALPROP with a lower limit:
| (19) |
where , and kpc. For , we assume that , because turbulence inside the bubble would increase magnetic fields. However, it is unlikely that the magnetic pressure exceeds the thermal pressure . In our calculation shown later in Figure 2, they are comparable at Myr, and at Myr. For , the cooling time of CR electrons responsible for synchrotron radiation ( GHz) is comparable to the age of the bubble.
3 Results
We solve equation (8) with a boundary condition at (equation (10)). The gradient of is zero at the inner boundary ( kpc). The density and velocity of the background gas are obtained by solving equations (1)–(3). We take the current time at Myr.
3.1 Fiducial Model
In this subsection, we show the results for the fiducial model (Model FD) that gives almost the same results as the fiducial model in Paper I. We put a kinetic energy of erg at and kpc. We do not include the background CRs escaped from the Galactic disk (). We consider only secondary electrons (and positrons) that are created through -interactions, and we do not treat primary electrons that are directly accelerated at the shock front (). From now on, the term ’electron’ includes ’positron’ unless otherwise mentioned.
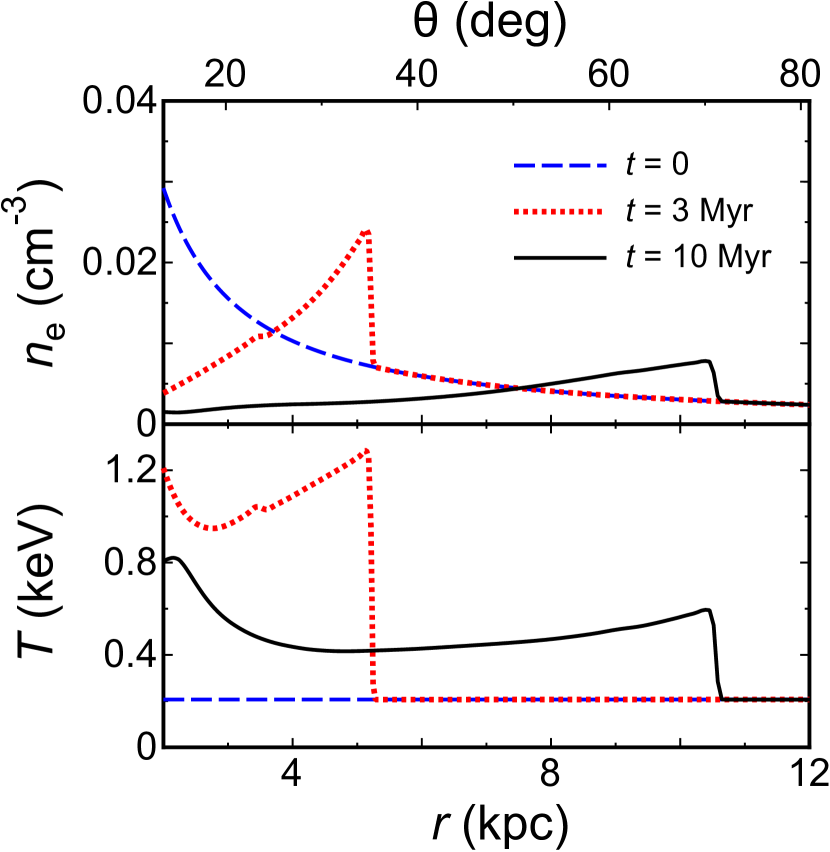
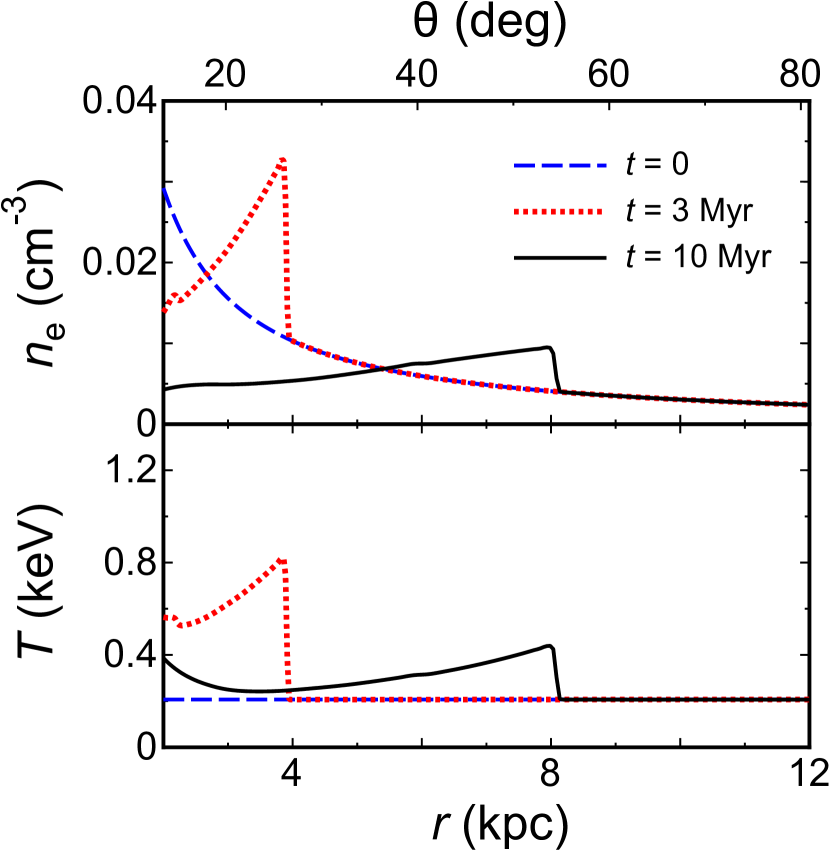
Figure 1 shows the evolution of the shock radius and the Mach number . We start CR acceleration at Myr. In Paper I, we stopped the acceleration when , because although a shock with a decreasing Mach number weakens the CR acceleration, the model did not include that effect explicitly. In this study, we include the effect by using equation (12). Therefore, less-efficient acceleration continues even when . In Figure 2, we show the gas density (assumed to be the thermal electron number density) and temperature profiles for Model FD. The apparent size of the bubble (degree) is simply given by , where kpc is the distance to the GC. As the Mach number of the shock decreases, the density and temperature jumps at the shock front also decrease. This effect was not included when we calculated the gamma-ray emission through interaction in Paper I. Figure 2 shows that some amount of gas remains even far behind the shock, because the initial gas profile (at ) is centrally concentrated (Paper I).
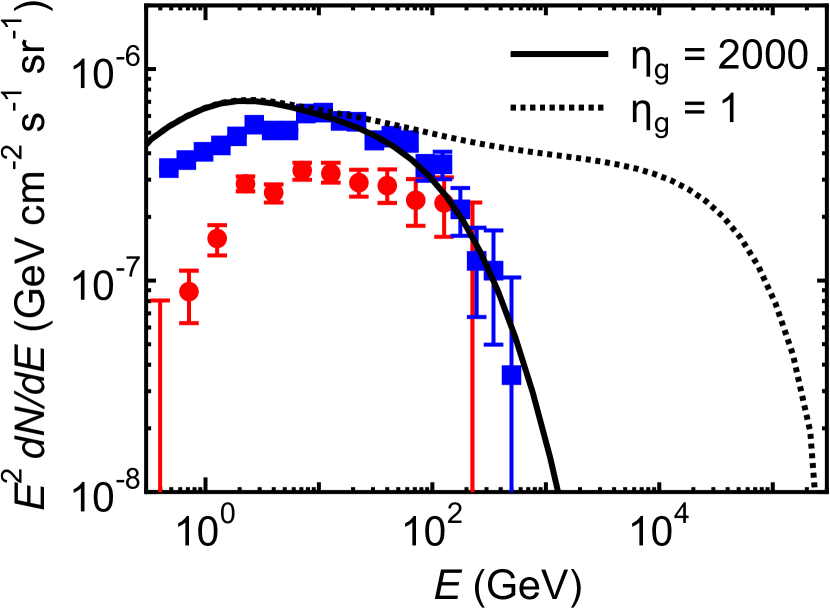
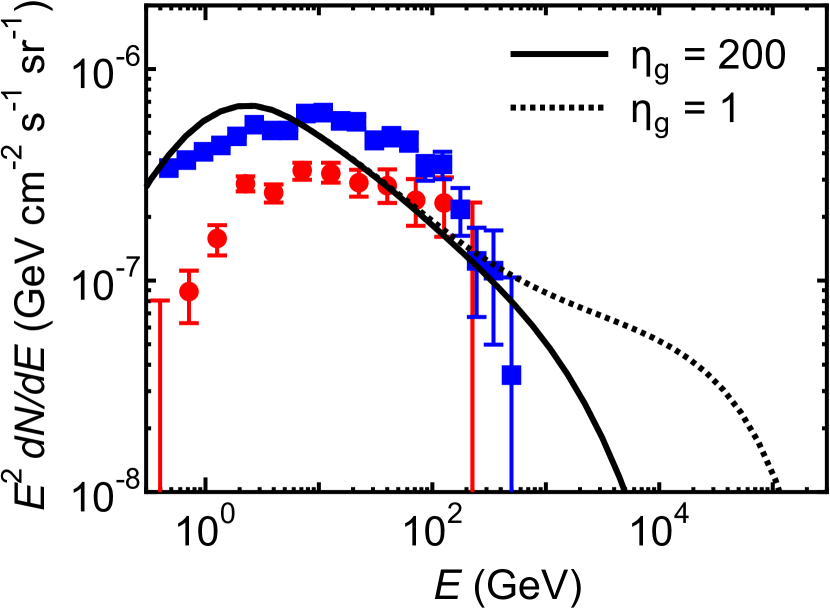
In Figure 3, we present the gamma-ray spectrum at for Model FD. The gamma-ray emission is originated from the -decay process associated with the -interaction. We show the results for and 2000, which correspond to a large and a small , respectively (equation (14)). Since the result for is consistent with the observations, we adopt that value hereafter unless otherwise mentioned. Note that is related to the small diffusion coefficient of CRs in the vicinity of the shock where CRs are accelerated. The coefficient there is times the Bohm limit and is different from in equation (8). Although the value of may be rather large compared with for supernova remnants in the Galactic plane, we do not think that it is rejected for the Fermi bubbles. We expect that seed magnetic fluctuations in the Galactic halo are smaller than those in the Galactic plane because of fewer sources of turbulence in the halo. This may prevent rapid growth of the fluctuations around the shock of the Fermi bubbles and may result in a larger . Moreover, the Mach number of the shock of the Fermi bubble (Figure 1) is much smaller than that of supernova remnants in the Galactic plane (100). This would also lead to the increase of . The fairly hard spectra in Figure 3 are mostly created by the CRs that are accelerated when is large, because the acceleration efficiency decreases as decreases. Since the CRs accelerated at a shock with a large have a hard spectrum with a small (equations (10) and (11)), the gamma-ray spectrum is also hard. The low energy part of the model spectrum ( GeV) does not fit the date well (Figure 3). This may be because our model overestimates low energy CRs. Alternatively, uncertainty of the data may be the reason as is shown by the discrepancy between the data by Su et al. (2010) and those by Franckowiak et al. (2013).
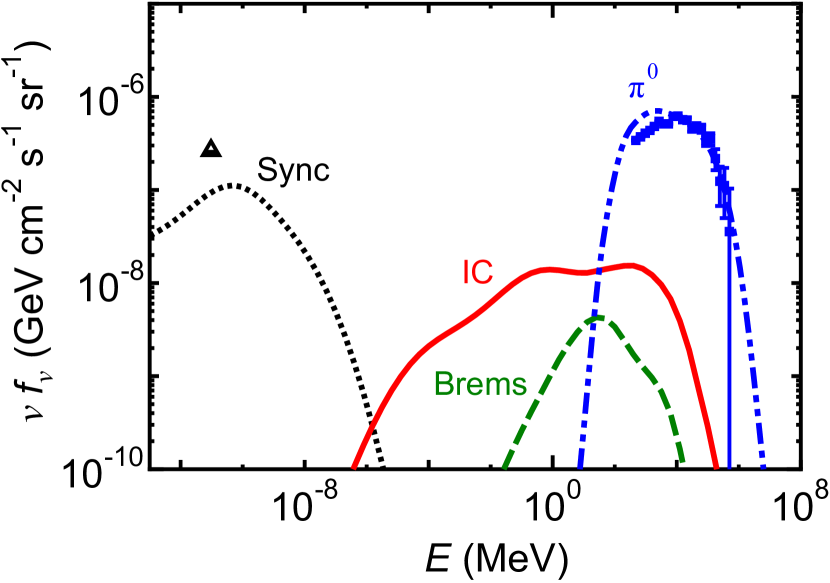
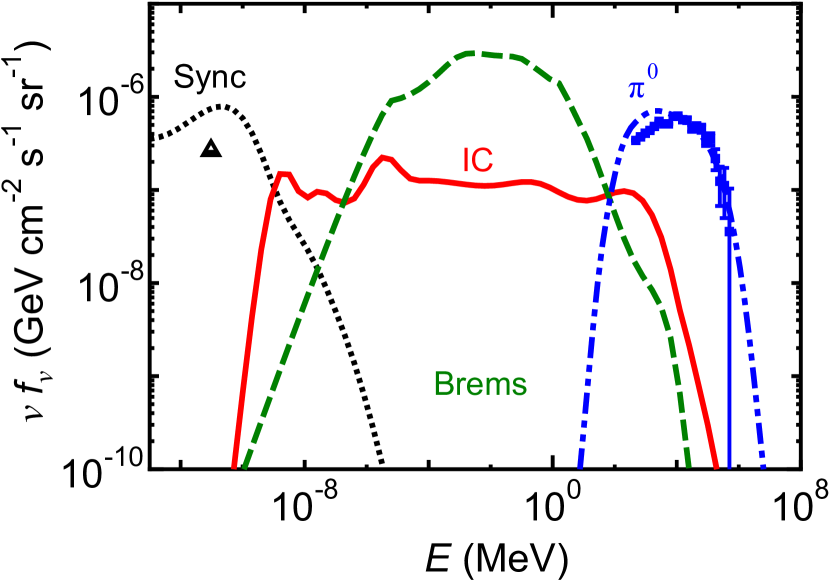
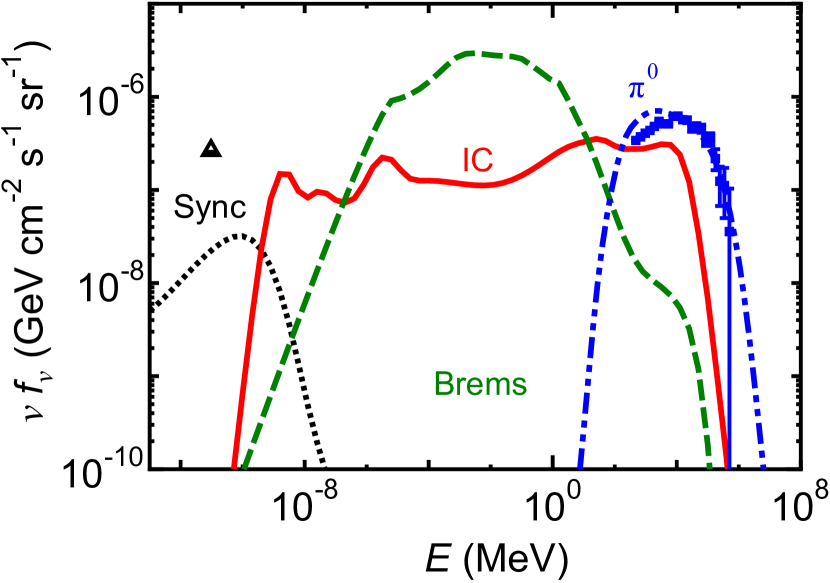
In Figure 4, we present the broad-band spectrum of non-thermal emission from the bubble at . The -decay gamma-rays come from the protons, while synchrotron, IC scattering, and non-thermal Bremsstrahlung emissions come from the secondary electrons. While the predicted gamma-ray spectrum is generally consistent with the observations, the radio flux is smaller than that of the radio observations. The deficiency of the radio luminosity to the gamma-ray luminosity remains even if we change the background magnetic fields, because the luminosity ratio intrinsically depends on the ratio of the production rate of charged pions to that of neutral pions in the -interaction (e.g. Crocker & Aharonian, 2011). For the given magnetic fields inside the bubble (), the cooling time of electrons is comparable with the age of the bubble (Section 2.2). Thus, smaller gives smaller synchrotron luminosity because the emissivity decreases. Larger does not lead to larger synchrotron luminosity because radiative cooling reduces the number of high-energy electrons.
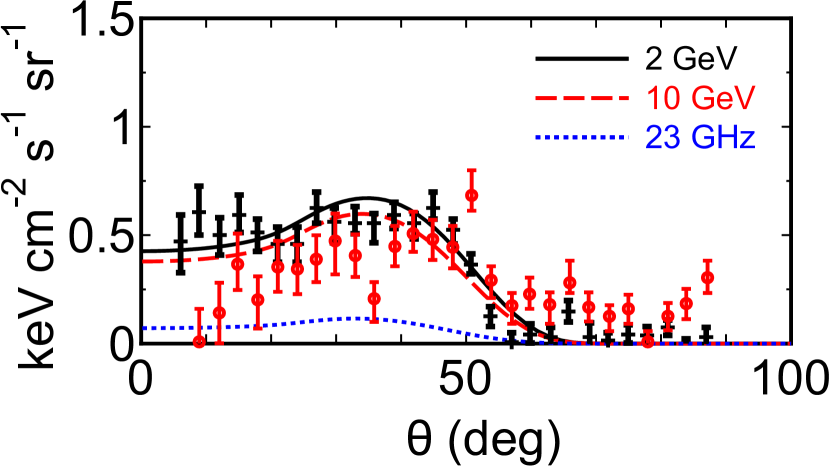
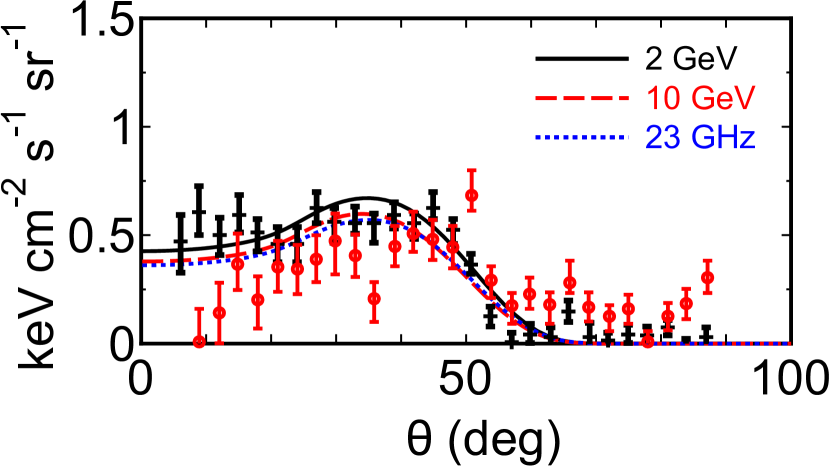
Figure 5 shows that the gamma-ray intensity profile is consistent with the observed profile. The former is calculated simply by projecting the gamma-ray emission on a plane at a distance of kpc and we do not consider detailed geometrical effects that come up when the distance to the Fermi bubbles is finite. This is because we assumed the spherical symmetry and the size of the bubble is comparable to . Thus, the detailed comparison with the observations may be premature. However, the line of sight cross section near the bubble edge, or the curvature of the bubble, does not much differ between a more realistic model considering the position of the Sun (e.g. Figure 4 of Sofue 2000) and our model for a given bubble volume. Since we do not include background gamma-rays, we shift the observational data along the vertical axis ( in the 1–5 GeV band and in the 5–20 GeV band). The brightness profile is fairly flat for , because the bubble is not empty of gas and the CR protons interact with the gas protons contained in the bubble (Figure 2, see also Paper I). The brightness rapidly decreases outside of the edge at , because the CRs confined in the bubble and do not diffuse out (see Paper I). Another reason is that the gas density is high just behind the shock front (Figure 2). The gamma-ray edge is inside the shock front at (Figure 2). Recent X-ray observations with Suzaku have shown that there is no clear temperature jump at the gamma-ray edge (Kataoka et al., 2013). This is consistent with this model prediction because the edge does not reflect the shock front. In Figure 5, the radio intensity profile is flat and it is smaller than the gamma-ray one. Recent analyses of WMAP and Planck data have revealed that the radio intensity profile is almost identical to the gamma-ray profile around the edge of the Fermi bubbles (Figure 3 in Dobler 2012 and Figure 10 in Planck Collaboration et al. 2013). This means that the predicted radio surface brightness falls short of the observed one.
3.2 Re-Acceleration of the Galactic Halo CRs
In this subsection, we investigate re-acceleration of the CRs in the Galactic halo. Since our model is rather simple and we know little about the amount of CRs and their distribution in the Galactic halo, we only focus on whether a significant amount of CRs () affect the results or not. We assume that the background CRs are uniform for simplicity, because equation (9) assumes that the upstream CRs are uniformly distributed.
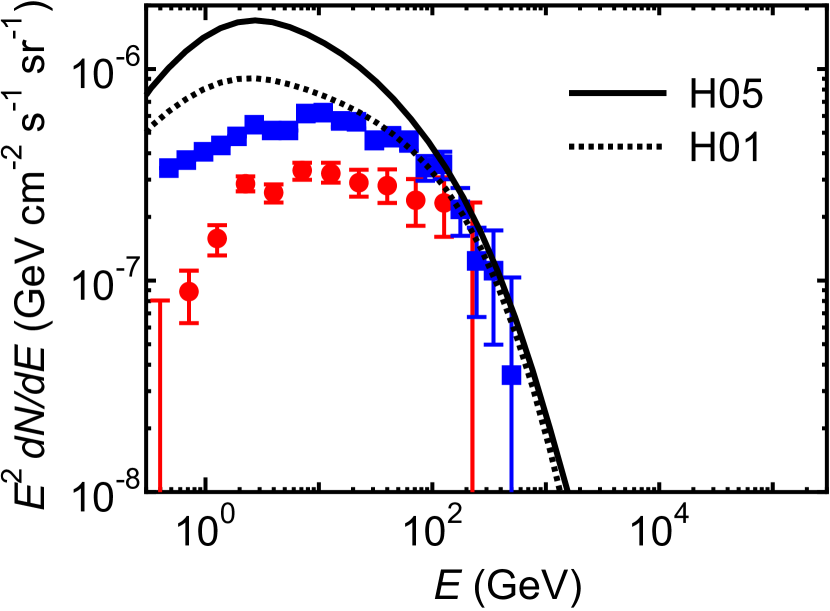
Model H05 is the same as Model FD but for . In Figure 6, we present the gamma-ray spectrum for Model H05. We ignore the emission from CRs at . Compared with Model FD (Figure 3), the gamma-ray flux at a few GeV is larger in Model H05. This is because the re-accelerated CRs also contribute to the gamma-ray flux. In this model, the Galactic CRs re-accelerated later with smaller and larger contribute more to the gamma-rays than the CRs accelerated earlier from the background thermal gas with larger and smaller . Thus, for GeV, the gamma-ray spectrum is softer than that predicted in Model FD and the observations (Figures 6 and 3). The intensity profile is displayed in Figure 7. The gamma-ray profile has a shape edge at (Figure 7), which corresponds to the position of the shock front at kpc (Figure 2). This means that there should be a temperature jump of a factor of three at the gamma-ray edge, which is inconsistent with the Suzaku observations (Kataoka et al., 2013). If we take (Model H01), the contribution from the re-accelerated CRs becomes much smaller (Figures 6 and 3). This means that the density of the background CRs at the position of the Fermi bubbles (–10 kpc above the Galactic plane) must be much smaller than that in the Galactic disk.
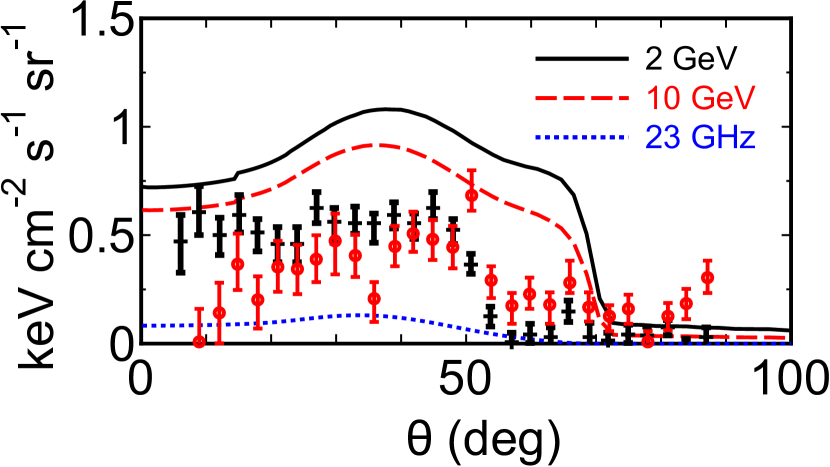
We study another re-acceleration model in which the gamma-rays from the Fermi bubbles are totally attributed to the re-accelerated CRs. In this model (Model HS), the input energy at the GC is chosen so that the size of the gamma-ray bubble matches with the observed one. The CRs accelerated from the thermal gas are not included (). We take erg and . Figure 8 shows the density and temperature profiles of the background halo gas. At Myr, the shock front is at kpc and the Mach number is . In Figure 9, we show the gamma-ray spectra for and 1. As can be seen, they are not much different in the GeV band. When , the spectrum is softer than that in Model FD at GeV (Figures 9 and 3). In Model FD, the gamma-rays are largely originated from the CRs accelerated from the thermal gas when is small or is large. In Model HS, on the contrary, the CRs re-accelerated when is large or is small contribute to the gamma-rays. Thus, the gamma-ray spectrum is softer. Although the gamma-ray profile reproduces the observations (Figure 10), the predicted spectra in Figure 9 are softer than the observations at GeV. In Model HS, the shock front corresponds to the gamma-ray edge (Figures 8 and 10). The temperature jump of a factor of two at the shock front (Figure 8) is larger than that measured with Suzaku at the gamma-ray edge (a factor of ; Kataoka et al., 2013). Even if we change and/or , we cannot adjust the gamma-ray spectrum and the gas temperature profile with the observations at the same time. Thus, we conclude that this model cannot reproduce the observations. Moreover, the surface brightness in the radio band is too small to be consistent with the observations (Figure 10).
3.3 Electron Acceleration and Radio Emission
The models studied above cannot explain the observed radio emission. In hadronic models, the radio luminosity is essentially smaller than the gamma-ray luminosity (e.g. Crocker & Aharonian, 2011). One idea to solve this problem is to assume that CR electrons that are accelerated around the GC are supplied to the inside of the Fermi bubbles. Alternatively, the electrons may be accelerated within the bubbles. The synchrotron radiation from the electrons may fill the gap in the radio luminosity between the observations and the hadronic models.
Here, we consider another solution in which primary electrons are included. Model EL is the same as Model FD but for . The value of is chosen to reproduce the observations. The broad-band spectrum for Model EL is shown in Figure 11. The gamma-ray spectrum is identical to that for Model FD (Figure 4), because IC scattering hardly contributes the emission in that band. On the contrary, the radio luminosity is increased, owing to the synchrotron radiation from the primary electrons. In Figure 12, we present the intensity profiles in the gamma-ray and radio bands. Since the predicted radio profile is almost the same as the gamma-ray profile around the bubble edge, it is consistent with the observations (Dobler, 2012; Planck Collaboration et al., 2013). Moreover, the spectral index at –40 GHz is (for in Figure 11). This is consistent with the Planck observations at the bubble edge. Actually, Figure 10 of Planck Collaboration et al. (2013) shows that the radio surface brightness at 43 GHz is a factor of 1.15 smaller than that at 30 GHz.
However, the Planck observations have shown that for , the radio surface brightness is significantly larger than that for (Figure 9 in Planck Collaboration et al. 2013). As is mentioned in Section 2.1, we focus on the high-galactic-latitude part of the Fermi bubbles, and the inner emission cannot be reproduced by this model. It may be generated by freshly injected electrons from the GC. The spectrum index of the whole Fermi bubbles in the Planck band is 0.5 (for ; Planck Collaboration et al., 2013). Most of the emission may be associated with the inner bright emission. Note that the radio luminosity in Figure 11 is a factor of a few larger than the observations (Carretti et al., 2013), while the radio profile is consistent with the radio observations (Figure 12). This may be owing to the broader region Carretti et al. (2013) studied or the difference of the background estimation.
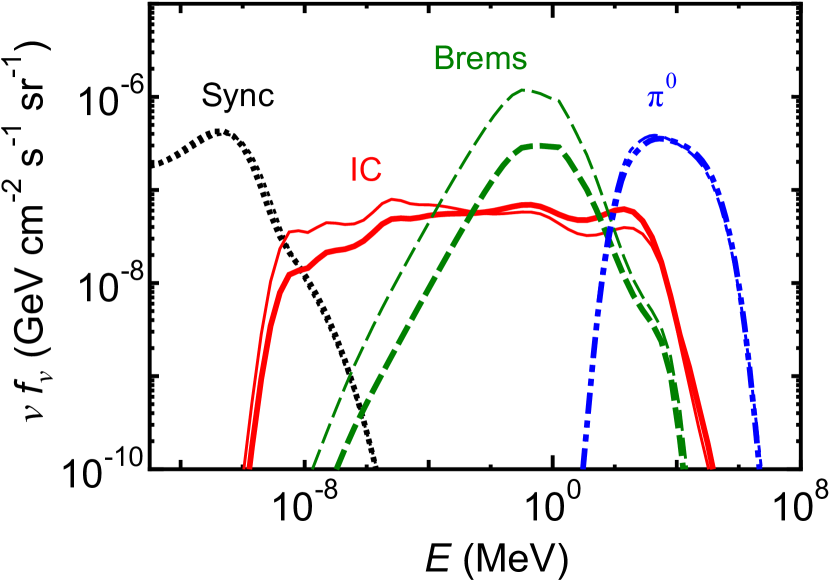
Figure 13 shows the spectra for and for . The effect of projection is not included. Note that the shock radius corresponds to . The spectra in the inner and the outer regions are almost the same in the gamma-ray (-decay) and radio (synchrotron) bands. The IC scattering and Bremsstrahlung spectra are a little harder in the inner region, because the Mach number of the shock is larger and the spectrum of the accelerated electrons is harder when is smaller. Since in equation (10) is the increasing function of time, we cannot ignore the contribution of lower-energy CR electrons () that are recently accelerated at the shock to the IC scattering and Bremsstrahlung emissions (Figure 12). Figure 14 shows the spectra of Model ELS, which is the same as Model EL but . While the IC luminosity is larger than that in Model EL, the synchrotron luminosity is smaller and cannot reproduce radio observations.
4 Conclusions
We have studied non-thermal radiation from the Fermi bubbles. In our model, CR protons are accelerated at the forward shock of the bubbles. They produce gamma-rays and secondary CR electrons via -interaction. We followed the evolution of the distribution functions of the CRs. Our fiducial model can reproduce the observed hard spectrum and flat intensity profile in the gamma-ray band, because most CRs are accelerated at early times when the Mach number of the shock is large and because the bubble is not empty of gas. In this model, the edge of the gamma-ray bubble does not correspond to the shock front. This is consistent with recent Suzaku observations showing that there is no temperature jump at the edge. However, the predicted radio flux from secondary electrons is much smaller than the observations.
The Galactic halo may be filled with background CRs escaped from the Galactic disk. Thus, we investigated re-acceleration of those CRs by the Fermi bubbles. We found that the gamma-rays from the re-accelerated CRs significantly affect the luminosity and the intensity profile, which may indicate that the density of the background CRs in the halo is % of that in the disk. Although the observed gamma-ray intensity profile can be reproduced by a model in which only re-accelerated CRs are included, the model contradicts the observed hard gamma-ray spectrum and the non-detection of X-ray temperature jump at the gamma-ray edge.
Since secondary electrons alone cannot explain the observed radio luminosity, we include primary electrons that are accelerated from thermal plasma at the shock. We found that the radio intensity profile around the bubble edge can be reproduced if electrons are accelerated with an efficiency of % of that of protons.
References
- Aharonian & Atoyan (1999) Aharonian, F. A., & Atoyan, A. M. 1999, A&A, 351, 330
- Blandford & Eichler (1987) Blandford, R., & Eichler, D. 1987, Phys. Rep., 154, 1
- Blandford & Ostriker (1978) Blandford, R. D., & Ostriker, J. P. 1978, ApJ, 221, L29
- Carretti et al. (2013) Carretti, E., Crocker, R. M., Staveley-Smith, L., et al. 2013, Nature, 493, 66
- Cheng et al. (2011) Cheng, K.-S., Chernyshov, D. O., Dogiel, V. A., Ko, C.-M., & Ip, W.-H. 2011, ApJ, 731, L17
- Crocker (2012) Crocker, R. M. 2012, MNRAS, 423, 3512
- Crocker & Aharonian (2011) Crocker, R. M., & Aharonian, F. 2011, Physical Review Letters, 106, 101102
- Dobler et al. (2010) Dobler, G., Finkbeiner, D. P., Cholis, I., Slatyer, T., & Weiner, N. 2010, ApJ, 717, 825
- Dobler (2012) Dobler, G. 2012, ApJ, 760, L8
- Drury (1983) Drury, L. O. 1983, Reports on Progress in Physics, 46, 973
- Fang & Zhang (2008) Fang, J., & Zhang, L. 2008, MNRAS, 384, 1119
- Finkbeiner (2004) Finkbeiner, D. P. 2004, ApJ, 614, 186
- Franckowiak et al. (2013) Franckowiak, A., Malyshev, D., & The Fermi-LAT Collaboration 2013, http://143.107.180.38/indico/contributionDisplay.py?contribId=996&sessionId=3&confId=0
- Fujita et al. (2010) Fujita, Y., Ohira, Y., & Takahara, F. 2010, ApJ, 712, L153
- Fujita et al. (2013) Fujita, Y., Ohira, Y., & Yamazaki, R. 2013, ApJ, 775, L20 (Paper I)
- Fujita et al. (2011) Fujita, Y., Takahara, F., Ohira, Y., & Iwasaki, K. 2011, MNRAS, 415, 3434
- Gabici et al. (2009) Gabici, S., Aharonian, F. A., & Casanova, S. 2009, MNRAS, 396, 1629
- Guo & Mathews (2012) Guo, F., & Mathews, W. G. 2012, ApJ, 756, 181
- Karlsson & Kamae (2008) Karlsson, N., & Kamae, T. 2008, ApJ, 674, 278
- Kataoka et al. (2013) Kataoka, J., Tahara, M., Totani, T., et al. 2013, ApJ, 779, 57
- Kang et al. (2002) Kang, H., Jones, T. W., & Gieseler, U. D. J. 2002, ApJ, 579, 337
- Kang & Ryu (2011) Kang, H., & Ryu, D. 2011, ApJ, 734, 18
- Mertsch & Sarkar (2011) Mertsch, P., & Sarkar, S. 2011, Physical Review Letters, 107, 091101
- Miyamoto & Nagai (1975) Miyamoto, M., & Nagai, R. 1975, PASJ, 27, 533
- Neronov et al. (2012) Neronov, A., Semikoz, D. V., & Taylor, A. M. 2012, Physical Review Letters, 108, 051105
- Ohira et al. (2010) Ohira, Y., Murase, K., & Yamazaki, R. 2010, A&A, 513, A17
- Planck Collaboration et al. (2013) Planck Collaboration, Ade, P. A. R., Aghanim, N., et al. 2013, A&A, 554, A139
- Porter et al. (2008) Porter, T. A., Moskalenko, I. V., Strong, A. W., Orlando, E., & Bouchet, L. 2008, ApJ, 682, 400
- Porter & Strong (2005) Porter, T. A., & Strong, A. W. 2005, International Cosmic Ray Conference, 4, 77 (arXiv:astro-ph/0507119)
- Snowden et al. (1995) Snowden, S. L., Freyberg, M. J., Plucinsky, P. P., et al. 1995, ApJ, 454, 643
- Sofue (2000) Sofue, Y. 2000, ApJ, 540, 224
- Su et al. (2010) Su, M., Slatyer, T. R., & Finkbeiner, D. P. 2010, ApJ, 724, 1044
- Su & Finkbeiner (2012) Su, M., & Finkbeiner, D. P. 2012, ApJ, 753, 61
- Thoudam (2013) Thoudam, S. 2013, ApJ, 778, L20
- Yang et al. (2012) Yang, H.-Y. K., Ruszkowski, M., Ricker, P. M., Zweibel, E., & Lee, D. 2012, ApJ, 761, 185
- Zubovas et al. (2011) Zubovas, K., King, A. R., & Nayakshin, S. 2011, MNRAS, 415, L21