A new measurement of the rare decay with the Crystal Ball/TAPS detectors at the Mainz Microtron
Abstract
A new measurement of the rare, doubly radiative decay was conducted with the Crystal Ball and TAPS multiphoton spectrometers together with the photon tagging facility at the Mainz Microtron MAMI. New data on the dependence of the partial decay width, , on the two-photon invariant mass squared, , as well as a new, more precise value for the decay width, eV, are based on analysis of decays from a total of mesons produced in the reaction. The present results for are in good agreement with previous measurements and recent theoretical calculations for this dependence.
pacs:
14.40.Aq, 13.20.-v, 12.39.FeI Introduction
The rare, doubly radiative decay attracts much interest due to large uncertainties in the experimental data and in the calculations based on Chiral Perturbation Theory (PTh). In many cases, PTh provides a good description of the low-energy dynamics of light pseudoscalar mesons using an expansion in powers of small meson masses and momenta Gasser . The uncertainties in PTh calculations for the transition are related to the fact that the tree-level amplitudes of the lowest orders (order two in particle four-momentum or masses) and vanish. The first non-zero contribution comes at either from loops involving kaons, strongly suppressed owing to large kaon masses, or from pion loops, suppressed as they violate G parity. The major contribution to the decay amplitude comes from the counterterms that are needed in PTh to cancel various divergences. The coefficients of these counterterms are not determined by PTh itself; they have to be either adjusted by fitting a model to experimental data or estimated using model assumptions, e.g. vector-meson dominance (VMD) or Nambu-Jona-Lasinio models Th_Models . Since light vector mesons play a critical role in these models, the dynamical role of the vector mesons has to be included systematically Oset_2003 ; Oset_2008 ; Ch_Lag_2012 to reach a deeper understanding of the decay as well as photon-fusion reactions into pseudoscalar mesons (e.g., and ).
To test the models based on PTh or to provide an input for adjusting their parameters, one has to measure both the decay rate for and its Dalitz plot, the features of which reflect the decay amplitude. The experimental challenges in measuring are formidable because of the smallness of its decay rate in conjuction with large background contributions. This makes the direct measurement of the Dalitz plot very difficult; it is easier to measure the distribution instead.
The first results on measuring the dependence, obtained by the Crystal Ball (CB) collaboration at the AGS and by the A2 collaboration at MAMI-B, were presented in Refs. Prakhov_MENU07 ; CB_AGS . The history of experimental and theoretical efforts to measure and calculate the decay width is reviewed in Ref. CB_AGS and references therein. Another recent attempt Lalwani_PhD to measure the dependence has not been finalized so far.
The publication of the first experimental data Prakhov_MENU07 ; CB_AGS on inspired the revision of the previous theoretical calculations and the adjustment of model parameters according to these data. Describing the magnitude of , those calculations were not constrained by details of the shape. This situation changed after obtaining the new data Prakhov_MENU07 ; CB_AGS .
A chiral unitary approach Oset_2003 used to calculate the decay was revised in Ref. Oset_2008 . According to the authors, the largest changes in the calculated decay properties were due to using the latest results for radiative widths of vector mesons as input for their model. The agreement between the revised calculation of Ref. Oset_2008 and the first data points Prakhov_MENU07 was reasonably good for both the shape and the magnitude of the dependence. The integrated partial decay width, eV, from the calculation of Ref. Oset_2008 is in good agreement with the present value, eV, from the Particle Data Group (PDG) PDG_2012 .
A theoretical study of photon-fusion reactions based on a chiral Lagrangian with dynamical light vector mesons was recently presented in Ref. Ch_Lag_2012 . In that work, the chiral Lagrangian contains five unknown constants that are relevant for the photon-fusion reactions and parameterize the strength of interaction terms involving two vector meson fields. These parameters were fitted to the data of three well-known photon-fusion reactions and to existing data CB_AGS ; Prakhov_MENU07 ; Lalwani_PhD . The results of that study show good agreement with existing data for photon-fusion reactions and predict cross sections for poorer known photon-fusion processes.
This article presents a new measurement of the dependence by the A2 collaboration at MAMI. The results obtained are based on the analysis of decays from a total of mesons produced in the reaction, allowing the experimental uncertainties in measuring the decay to be decreased. The results presented in this work were also used to repeat the analysis of photon-fusion reactions Ch_Lag_2012 ; Ch_Lag_refit .
II Experimental setup
The process was measured using the Crystal Ball (CB) CB as the central spectrometer and TAPS TAPS ; TAPS2 as a forward spectrometer. These detectors were installed in the energy-tagged bremsstrahlung photon beam of the Mainz Microtron (MAMI) MAMI ; MAMIC . The photon energies were determined using the Glasgow-Mainz tagging spectrometer TAGGER ; TAGGER1 ; TAGGER2 .
The CB detector is a sphere consisting of 672 optically isolated NaI(Tl) crystals, shaped as truncated triangular pyramids, which point toward the center of the sphere. The crystals are arranged in two hemispheres that cover 93% of , sitting outside a central spherical cavity with a radius of 25 cm, which holds the target and inner detectors. In this experiment, TAPS was arranged in a plane consisting of 384 BaF2 counters of hexagonal cross section. It was installed 1.5 m downstream of the CB center and covered the full azimuthal range for polar angles from to . More details on the energy and angular resolution of the CB and TAPS are given in Refs. slopemamic ; etamamic .
The present measurement used 1508-MeV and 1557-MeV electron beams from the Mainz Microtron, MAMI-C MAMIC . The data with the 1508-MeV beam were taken in 2007 and those with the 1557-MeV beam in 2009. Bremsstrahlung photons, produced by the 1508-MeV electrons in a 10-m Cu radiator and collimated by a 4-mm-diameter Pb collimator, were incident on a 5-cm-long liquid hydrogen (LH2) target located in the center of the CB. The energies of the incident photons were analyzed up to 1402 MeV by detecting the post-bremsstrahlung electrons in the Glasgow-Mainz tagger TAGGER ; TAGGER1 ; TAGGER2 . With the 1557-MeV electron beam, the incident photons were analyzed up to 1448 MeV, and a 10-cm-long LH2 target was used. The uncertainty in the energy of the tagged photons is mainly determined by the width of tagger focal-plane detectors and the energy of the MAMI electron beam used in the experiments. For the MAMI energies of 1508 and 1557 MeV, such an uncertainty was about MeV.
The target was surrounded by a Particle IDentification (PID) detector PID used to distinguish between charged and neutral particles. It was made of 24 scintillator bars (50 cm long, 4 mm thick) arranged as a cylinder with a radius of 12 cm.
The experimental trigger in the measurement with the 1508-MeV electron beam required the total energy deposited in the CB to exceed 320 MeV and the number of so-called hardware clusters in the CB (multiplicity trigger) to be larger than two. Depending on the data-taking period, events with cluster multiplicity two were prescaled with a different rate. TAPS was not in the multiplicity trigger for these experiments. With the 1557-MeV electron beam, the trigger on the total energy in the CB was increased to 340 MeV.
More details on the experimental conditions during the measurements with the 1508-MeV electron beam in 2007 are given in Refs. slopemamic ; etamamic .
III Data handling
To search for a signal from decay, candidates for the process were extracted from the analysis of events having five clusters (four from the photons and one from the proton) reconstructed in the CB and TAPS together. Four-cluster events, with only four photons detected, were neglected in the present analysis as the probability of non-detecting the final-state proton for the process in these experiments was only about 20%. Also, for such events, the proton information missing in the analysis resulted in a much stronger background contamination.
The selection of event candidates was based on the kinematic-fit technique. The details of the kinematic-fit parameterization of the detector information and resolution are given in Ref. slopemamic . Events that satisfied the hypothesis with the confidence level (CL) greater than 5% were accepted as possible reaction candidates. The kinematic-fit output was used to reconstruct the kinematics of the outgoing particles.
The analysis technique and the selection criteria used in the present work were very similar to the ones described in detail in Refs. CB_AGS ; Prakhov_MENU07 . A signal from the decay was searched for as a peak in the invariant-mass spectrum of the final state, , at the mass region of the meson. Since the major contribution to the four-photon final state comes from the reaction , it was partially suppressed by eliminating all events for which the CL of satisfying the hypothesis was greater than 0.0001%. Because of this cut, the measurement of the decay is impossible for the region when the two-photon invariant mass is close to the mass. This cut would also eliminate decays if they exist. However, the decay is CP-violating and was never observed experimentally. Similar to the analysis of Ref. CB_AGS , further suppression of the background was achieved by cuts on the larger value of the two possible invariant masses with respect to . Three different cuts were tested. They are shown by three blue lines in Fig. 1(a), which plots the remaining background from the Monte Carlo (MC) simulation for , and in Fig. 1(d) depicting events from the MC simulation for . Each of the three cuts on implies discarding all events that lie above the corresponding line. Although the background is comparably smooth in the region of the mass and cannot mimic a peak from decays, the additional suppression of this background was important for observing a small signal above statistical fluctuations in the background events.
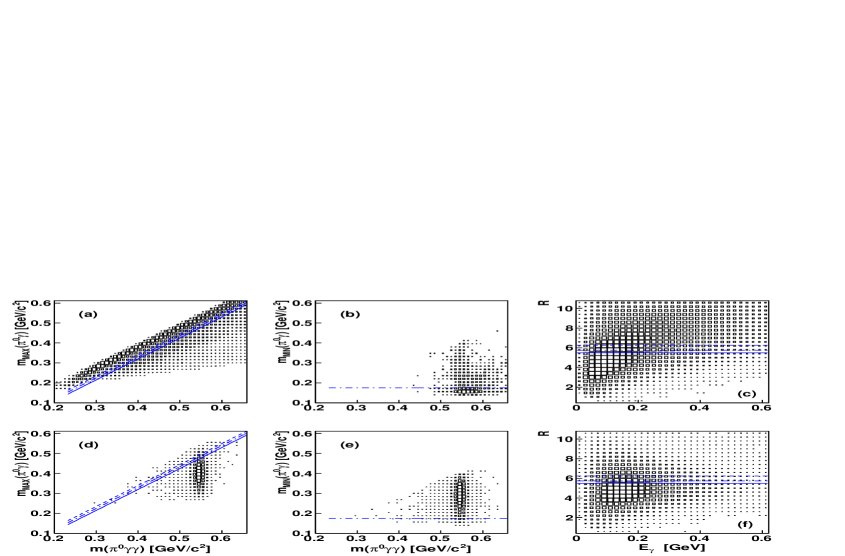
There are two background sources that can mimic a peak from decays. These backgrounds are caused by and decays, which have much larger partial decay widths ( and PDG_2012 ) than . The decay can mimic the signal when the electromagnetic (e/m) showers of both outgoing photons split off. Similar to the analysis of Ref. CB_AGS , this background was practically eliminated by a cut on the smaller value of the two possible invariant masses . This cut is shown by a blue line in Fig. 1(b), which plots the remaining background from the MC simulation for , and in Fig. 1(e) depicting events from the MC simulation for . The cuts on implies discarding all events that lie below the line.
The decay mimics the signal when the e/m showers of some outgoing photons overlap or are not detected. The case of overlapping e/m showers is more difficult to identify as the total energy of all the photons is conserved. As shown in Ref. CB_AGS , the background with overlapping e/m showers can be significantly suppressed by applying a cut on a so-called effective radius of the clusters, which are systematically wider in the case of overlapping showers. The effective radius of a cluster containing crystals with energy deposited in crystal is defined as , where is the opening angle (in degrees) between the cluster direction and the crystal axis. A density distribution of the cluster effective radii as a function of the cluster energy is shown in Fig. 1(c) for the MC simulation of and in Fig. 1(f) for the MC simulation of . These distributions are plotted for the two clusters ascribed to the photons produced not from the decay. Three different cuts on the value were tested; they are shown by three blue lines in Figs. 1(c) and 1(f). Each of the cuts discards all events for which at least one of the two values is above the corresponding line.
Besides the so-called physical background, there are two more background sources. The first one comes from interactions of incident photons in the windows of the target cell. The subtraction of this background from experimental spectra is typically based on the analysis of data samples that were taken with an empty (no liquid hydrogen) target. In the present analysis, the empty-target background was small and did not feature any visible peak in its spectra. Another background was caused by random coincidences of the tagger counts with the experimental trigger; its subtraction was carried out using event samples for which all coincidences were random (see Refs. slopemamic ; etamamic for more details).

The selection criteria were optimized using MC simulations of the process and all the background reactions. To reproduce the experimental yield of the mesons as a function of the incident-photon energy, the reaction was generated according to its excitation function, measured in the same experiment etamamic , which was then folded with the bremsstrahlung energy dependence of the incident photons. Since the photon-beam energy range used in the analysis is large (nearly 700 MeV), the production angular distribution changes with energy. However, the production angle was generated isotropically as its experimental distribution, averaged over all energies, was sufficiently close to isotropic. The decay was generated according to the matrix element of the transition amplitude from Ref. Ng1 , calculated assuming vector-meson dominance. The dependence from this amplitude was found to be close to the experimental data CB_AGS ; Prakhov_MENU07 . The MC simulation of the reaction was done in the same way as reported in Ref. p2pi0mamic .
For all reactions, the generated events were propagated through a GEANT (version 3.21) simulation of the experimental setup. To reproduce resolutions of the experimental data, the GEANT output (energy and timing) was subject to additional smearing, allowing both the simulated and experimental data to be analyzed in the same way. The simulated events were also tested for whether they passed the trigger requirements. From the analysis of the MC simulation, the average acceptance for the process varied between 7% and 14%, depending on the criteria used for event selection.
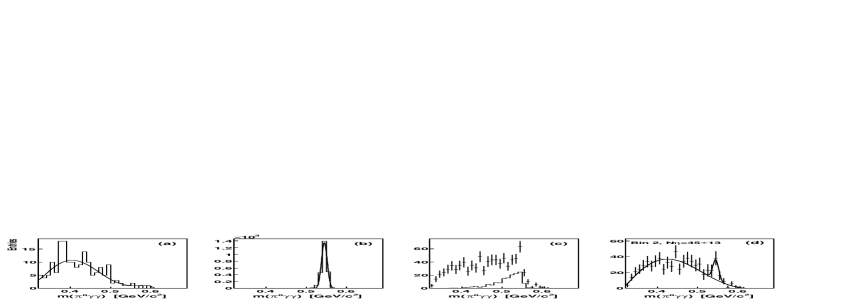
To measure the decay rate as a function of the diphoton invariant mass squared, the data were divided into eight bins. The bin corresponding to the the mass was not analyzed since it was almost empty due to suppressing events by the 0.0001% cut on the kinematic-fit CL for this reaction. The number of decays observed in each bin was determined by fitting an peak above a relatively smooth background, containing mostly the events survived the cuts. The fitting procedure is illustrated in Fig. 2 for bin GeV of the 2009 data set. Figure 2(a) depicts the invariant-mass distribution for the MC simulation of the background reaction fitted with a polynomial. Figure 2(b) shows the same distribution for the MC simulation of fitted with a Gaussian. The experimental distribution after subtracting the random background is shown by crosses in Fig. 2(c). The MC simulation for the background is shown in the same figure by a solid line. The normalization of this background is based on the ratio of the number of events produced in this experiment to the number of events generated for this process in the MC simulation. The experimental distribution after subtraction of the background is shown in Fig. 2(d). This distribution was fitted with the sum of a Gaussian and a polynomial. The mean value and of the Gaussian were fixed to the values obtained from the previous fit to the MC simulation for . The initial values for polynomial coefficients were taken equal to the output parameters of the polynomial fit to the MC simulation. The order of the polynomial was chosen to be sufficient for fairly good description of the background distribution in its full range. Typically, a polynomial of order seven was sufficient for fitting to background spectra of lower bins, having wider distributions. While, for the bins with the highest values, having quite narrow distributions, the fit with a polynomial of order four provided a sufficient quality.
The experimental number of decays in the distribution shown in Fig. 2(d) was determined from the area under the Gaussian. For consistency, the corresponding detection efficiency was calculated in the same way (i.e, based on a Gaussian fit to the MC simulation for , instead of just using the number of entries in the distribution). The uncertainty in the number of decays observed, which is calculated from the fit results, does not reflect the actual statistic in the signal peak. This uncertainty is much larger because of the background remaining under the peak and the increase in the error bars in the experimental distribution after subtracting the random and the backgrounds.
| [GeV] | ||||
| 2007 | ||||
| 2009 | ||||
| 2007+2009 | ||||
| [GeV] | ||||
| 2007 | ||||
| 2009 | ||||
| 2007+2009 |
IV Experimental results
For every fit to the experimental distributions (see Section III for details), the number of decays initially produced was obtained by dividing the number of decays determined from the fit by the corresponding detection efficiency. Values of for every fit were obtained from the initial number of by taking into account the full decay width keV PDG_2012 , the total number of mesons produced in the experiment, and the width of the corresponding bin. The uncertainty in an individual value was obtained in the same way from the uncertainty in the number of decays determined from every fit. The calculation of the total number of mesons produced in the experiment was based on the analysis of the process in both the 2007 etamamic and 2009 data sets, using for the branching ratio PDG_2012 . Since the data of 2007 and 2009 were taken under different experimental conditions, both the data sets were analyzed independently. As a signal from decays in each bin was quite small, compared to the magnitude of the error bars in the final spectra, the fitting procedure was repeated many times for each bin, testing different combinations of selection criteria. This provided a check on the stability of the results, the average of which was used to obtain a more reliable value for each bin.
Three different cuts on , shown in Figs. 1(a) and 1(d), were used to change the level of the background under the signal in the bins with lower masses. Since the production of etamamic is mostly accumulated in the region of , whereas the total cross section changes much less between the threshold ( GeV) and the incident-photon energy GeV p2pi0mamic , different cuts on were used to change the ratio of the signal to the background in each bin. Three different cuts on the cluster effective radius, shown in Figs. 1(c) and 1(f), were used to change the ratio of the signal to the background. Different cuts on the kinematic-fit CL (such as 5%, 10%, 15%, and 20%) for the hypothesis were used to change the ratio of the signal to both the and background.
Since the same data were used to obtain the values after applying different selection criteria, all results corresponding to an individual bin were correlated. Although all those results were in agreement within their uncertainties, the magnitude of the uncertainties themselves did not allow a careful study of the systematics in the results. In the end, the calculation of the final values and their uncertainties was carried out in the same way as in the analyses of Refs. CB_AGS ; Prakhov_MENU07 . The value in one bin was obtained by averaging the results of all tests made for this bin. Then, the average of the corresponding uncertainties, calculated from the fit errors, was considered, for simplicity, as the statistical uncertainty of the value in this bin. Whereas, the systematic uncertainty of the value was taken as the root mean square of the results from all tests made for this bin. The total uncertainty of the value in each bin was calculated by adding in quadrature its statistical and systematic uncertainties. In the end, the results from 2007 and 2009, which were independent measurements, were combined as a weighted average with weights taken as inverse values of their total uncertainties in quadrature. The numerical values obtained from the data of 2007, 2009, and their average are listed in Table 1.
V Discussion of the results
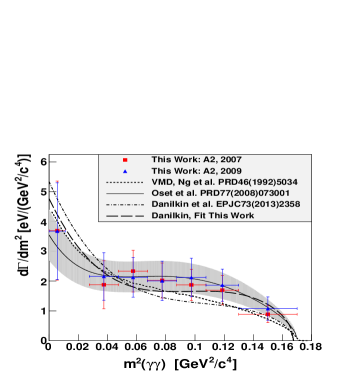
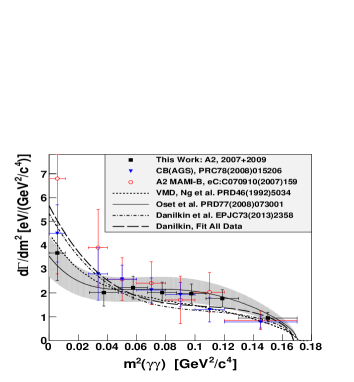
The individual results from the two measurements in 2007 and 2009 are plotted in Fig. 5, demonstrating very good agreement of the two data sets within the error bars that correspond to the total uncertainties. In Fig. 6, the results combined from 2007 and 2009 are compared to the existing data CB_AGS ; Prakhov_MENU07 , again, within the error bars, showing good agreement with the previous measurements. As also seen, the uncertainties of the combined results from the present work are smaller than the uncertainties of the results from Refs. CB_AGS ; Prakhov_MENU07 .
In Figs. 5 and 6, the data points are also compared to calculations from different models. The VMD calculation from Ref. Ng1 is shown by a short-dashed line; the matrix element of the corresponding transition amplitude was used to generate decays in the MC simulation made for the acceptance calculation. The revised calculation based on a chiral unitary approach Oset_2008 is shown by a solid line with a shaded error band. The calculation involving a theoretical study of photon-fusion reactions based on a chiral Lagrangian with dynamical light vector mesons Ch_Lag_2012 is shown by a dash-dotted line.
The impact of the present results on models was tested by repeating the analysis of photon-fusion reactions after including the new data in their fits Ch_Lag_refit . Their first fit, in which only the new data from this work were used, is shown in Fig. 5 by a long-dashed line. The second fit, shown by a long-dashed line in Fig. 6, involves the present data together with the data points from Refs. CB_AGS ; Prakhov_MENU07 . As seen, the results of the second fit are much closer to the original fit Ch_Lag_2012 than the results of the first fit. These two fits resulted in a new determination of the two low-energy constants, and 111The first fit yields values and for the Lagrangian parameters, compared to and from the second fit and to and from Ref. Ch_Lag_2012 ., of the chiral vector-meson Lagrangian Ch_Lag_2012 , in which these constants parametrize contact interactions between two pseudoscalar and two vector mesons. Despite the impact of the present data on the parameters of the chiral Lagrangian, the results for the photon-fusion reactions remained quite stable with respect to these changes and so do not affect any conclusions made in Ref. Ch_Lag_2012 .
As seen in Fig. 5, all the calculations go through the error bars of the individual 2007 and 2009 data points. The combined results from the 2007 and 2009 data sets, shown in Fig. 6 , have smaller uncertainties and, in our opinion, overlap better with the revised calculation based on a chiral unitary approach Oset_2008 . Nevertheless, the magnitude of the experimental uncertainties is still not sufficient to rule out any of the theoretical calculations shown, and the need for more accurate measurements is obvious.
In all previous experiments, the partial decay width was determined via measuring the total number of decays observed and correcting it with the detection efficiency. However, if the dependence has been already measured, the partial decay width can be determined just by integrating such a distribution, where the value and its uncertainty for the missing bin at the mass can be extrapolated from the values and uncertainties of the adjacent bins. If, for simplicity, a linear extrapolation is used for the missing bin, integrating the experimental distribution from this work results in
where the total uncertainty is calculated by using the error-propagation formula for a sum of values with independent errors.


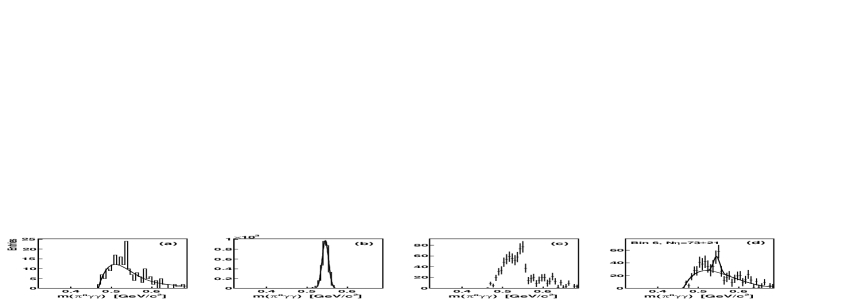
The determination of in the so-called traditional approach would again require repeating the fitting procedure for the full range with different combinations of selection criteria to evaluate the average result and its statistical and systematic uncertainties and to combine the results from the 2007 and 2009 data sets in the end. To demonstrate that the traditional approach gives similar results, the corresponding fitting procedure is illustrated in Figs. 7 and 8 for the 2007 data set with two different cuts on the cluster effective radius. Figure 7 corresponds to a looser effective-radius cut (shown by the dashed blue line in Figs. 1(c) and 1(f)), which provides a poorer ratio of the signal to the background, but leaves a greater statistic for the decays. The number of decays found for this case is , and the partial decay width is calculated to be eV. Figure 8 corresponds to a tighter effective-radius cut (shown by the solid blue line in Figs. 1(c) and 1(f)), which provides a better ratio of the signal to the background, but leaves a lower statistic for the decays. The number of decays found here is only , and the decay width, eV, has almost the same value but with a larger uncertainty, hinting on the smallness of the systematics because of applying cuts on a value for . As also seen, the results of the traditional approach for determining are in good agreement with the value obtained from integrating the data points.
The result obtained in this work for the partial decay width, eV, is in good agreement with the present PDG PDG_2012 value, eV, and with the values from the calculations shown in Figs. 5 and 6. The calculation based on the VMD transition amplitude from Ref. Ng1 gives eV. The calculation based on a chiral unitary approach Oset_2008 results in eV. The results from Refs. Ch_Lag_2012 ; Ch_Lag_refit are not considered as their unknown parameters were fitted to existing data.
VI Summary and conclusions
A new measurement of the rare, doubly radiative decay was conducted by the A2 collaboration at MAMI. The results are based on analysis of decays from a total of mesons produced in the reaction. The statistical accuracy of the new results for the dependence and the partial decay width, eV, is better than all previous measurements of . The present results for are in good agreement with previous measurements and recent theoretical calculations for this dependence.
Acknowledgments
This paper is devoted to the memory of our appreciated colleague B.M.K. Nefkens who passed away just before the paper submission. B.M.K. Nefkens was the driving force behind the research program dedicated to -meson decays with the Crystal Ball at MAMI.
The authors wish to acknowledge the excellent support of the accelerator group and operators of MAMI. This work was supported by the Deutsche Forschungsgemeinschaft (SFB443, SFB/TR16, and SFB1044), DFG-RFBR (Grant No. 09-02-91330), the European Community-Research Infrastructure Activity under the FP6 “Structuring the European Research Area” program (Hadron Physics, Contract No. RII3-CT-2004-506078), Schweizerischer Nationalfonds, the UK Science and Technology Facilities Council (Grant No. STFC 57071/1, 50727/1), the U.S. Department of Energy and National Science Foundation, INFN (Italy), and NSERC (Canada). The work of I.V. Danilkin is supported by the U.S. Department of Energy (Contract No. DE-AC05-06OR23177). A. Fix acknowledges additional support from the Russian Federation federal program “Kadry” (Contract No. P691) and the MSE Program “Nauka” (Contract No. 1.604.2011). We thank the undergraduate students of Mount Allison University and The George Washington University for their assistance.
References
- (1) J. Gasser and H. Leutwyler, Nucl. Phys. B 250, 465 and 539 (1985).
- (2) A. Bel’kov, A.V. Lanyov, and S. Scherer, J. Phys. G 22, 1383 (1996).
- (3) E. Oset, J.R. Pelaez, and L. Roca, Phys. Rev. D 67, 073013 (2003).
- (4) E. Oset, J.R. Peláez, and L. Roca, Phys. Rev. D 77, 073001 (2008).
- (5) I.V. Danilkin, M.F.M. Lutz, S. Leupold, and C. Terschlüsen, Eur. Phys. J. C 73, 2358 (2013).
- (6) S. Prakhov (for the CB Collab. at AGS and the A2 Collab. at MAMI), Proceedings of MENU 2007 Conference, IKP, Forschungzentrum Jülich, Germany; published in eConf C070910, 159 (2007).
- (7) S. Prakhov et al., Phys. Rev. C 78, 015206 (2008).
- (8) K. Lalwani, Ph.D. thesis, Depart. of Physics, Indian Inst. of Technology, Bombay (2010).
- (9) J. Beringer et al. (Particle Data Group), Phys. Rev. D 86, 010001 (2012).
- (10) M.F.M. Lutz, private communication.
- (11) A. Starostin et al., Phys. Rev. C 64, 055205 (2001).
- (12) R. Novotny, IEEE Trans. Nucl. Sci. 38, 379 (1991).
- (13) A.R. Gabler et al., Nucl. Instr. Meth. A 346, 168 (1994).
- (14) H. Herminghaus et al., IEEE Trans. Nucl. Sci. 30, 3274 (1983).
- (15) K.-H. Kaiser et al., Nucl. Instr. Meth. A 593, 159 (2008).
- (16) I. Anthony et al., Nucl. Instr. Meth. A 310, 230 (1991).
- (17) S.J. Hall et al., Nucl. Instr. Meth. A 368, 698 (1996).
- (18) J.C. McGeorge et al., Eur. Phys. J. A 37, 129 (2008).
- (19) S. Prakhov et al., Phys. Rev. C 79, 035204 (2009).
- (20) E.F. McNicoll et al., Phys. Rev. C 82, 035208 (2010).
- (21) D. Watts, Proceedings of the 11th International Conference on Calorimetry in Particle Physics, Perugia, Italy, 2004 (World Scientific, 2005) p. 560.
- (22) J.N. Ng and D.J. Peters, Phys. Rev. D 46, 5034 (1992).
- (23) V.L. Kashevarov et al., Phys. Rev. C 85, 064610 (2012).