On the Progenitors of Local Group Novae - I. The M31 Catalog
Abstract
We report the results of a survey of M31 novae in quiescence. This is the first catalog of extragalactic systems in quiescence to be published, and contains data for 38 spectroscopically confirmed novae from 2006 to 2012. We used Liverpool Telescope (LT) images of each nova during eruption to define an accurate position for each system. These positions were then matched to archival Hubble Space Telescope (HST) images and we performed photometry on any resolved objects that were coincident with the eruption positions. The survey aimed to detect quiescent systems with red giant secondaries, as only these, along with a few systems with bright sub-giant secondaries, will be resolvable in the HST images. There are only a few confirmed examples of such red giant novae in our Galaxy, the majority of which are recurrent novae. However, we find a relatively high percentage of the nova eruptions in M31 may occur in systems containing red giant secondaries. Of the 38 systems in this catalog, 11 have a progenitor candidate whose probability of being a coincidental alignment is less than . We show that, at the limit, up to only two of these eleven systems may be due to chance alignments, leading to an estimate of the M31 nova population with evolved secondaries of up to , compared to the seen Galactically. Such an elevated proportion of nova systems with evolved secondaries may imply the presence of a much larger population of recurrent novae than previously thought. This would have considerable impact, particularly with regards their potential as Type Ia supernova progenitors.
Additionally, for several novae, serendipitous HST images had been taken when the nova was still fading; this allowed us to produce light curves that go fainter than is usually achievable for most extragalactic systems. Finally, as this survey is astrometric in nature, we also update the position of each nova in the catalog.
Subject headings:
galaxies: individual (M31) — galaxies: stellar content — stars: binaries: symbiotic — novae, cataclysmic variables1. Introduction
The eruptions of classical novae (CNe) are only surpassed in luminosity by a handfull of other phenomena, such as gamma-ray bursts, supernovae (SNe), and some luminous blue variable stars, although in any given galaxy, nova eruptions are far more commonplace that these other transients. Novae are a sub-class of the cataclysmic variables, their canonical model consisting of a white dwarf (WD; the primary) which accretes material from a typically late-type, main-sequence star (the secondary). Mass is lost from the secondary usually via Roche Lobe overflow and is typically transferred to the WD by means of an accretion disk around the primary, although in a number of systems the magnetic field of the WD may significantly affect the accretion process. CN eruptions are powered by a thermonuclear runaway within the accreted material on the surface of the WD and are predicted to recur on time-scales years (Truran & Livio, 1986). CNe are typically classified based on the properties of the eruptions; either by the rate of decline of their optical light curve (the speed class; Gaposchkin, 1957) or via their spectroscopic behaviour (into the sub-types of Fe II and He/N novae; Williams, 1992).
Closely related to CNe are the recurrent novae (RNe), which have been seen to have undergone more than one eruption, with observed recurrence time-scales of approximately years (Darnley et al., 2014). Observed RNe have typically been divided into three sub-types, based not only on the properties of their eruption but also on the nature of the progenitor system. The three subclasses are RS Oph/T CrB, U Sco and T Pyx type, which harbor red giant, sub-giant and main-sequence secondaries respectively (see Anupama, 2008, for a review).
Darnley et al. (2012) recently proposed a nova classification system that unifies CNe and RNe and is based only on the properties of each system at quiescence; i.e. the evolutionary state of the secondary star. The majority of CN systems harbor a main-sequence secondary star and define the MS-nova class; this class also includes the T Pyx sub-class of RNe. The U Sco class of RNe and also CNe such as GK Persei all have sub-giant secondaries and make up the SG-nova class. The third class, the RG-nova class (also commonly referred to as symbiotic novae), contain nova systems with red giant secondaries, including the RS Oph/T CrB class of RNe and systems such as EU Scuti.
Amongst the hundreds of known Galactic CNe, there are only ten firmly established RNe. Traditionally, RNe have only been confirmed by the observation of more than one eruption from the system. Using multiple eruptions as the sole discriminator between RNe and CNe is subject to a number of significant selection effects, mainly the decreasing completeness and deepness of sky coverage as one goes back in time. As such, a Galactic population of ten RNe is a lower limit and clearly far from the true picture. Hence, there is approximately only one confirmed Galactic RN eruption each year, compared to an overall Galactic nova rate of year-1 (Shafter, 1997; Darnley et al., 2006). However, more indirect methods have recently been employed to introduce a small number of new candidate RN systems that have only one previous recorded eruption. These systems include V2491 Cygni (Page et al., 2010; Darnley et al., 2011), KT Eridani (Jurdana-Šepić et al., 2012) and the Andromeda Galaxy (M31) nova M31N 2007-12b (Bode et al., 2009). These analyses include other parameters of the system, such as ejection velocity, accretion rate, WD mass, super-soft source (SSS) behaviour, orbital period and secondary type.
From the Sun’s position within the Milky Way, our ability to study the entire nova population of the Galaxy is hindered by the obscuring effect of dust in the Galactic plane and large uncertainties when determining distances and extinction. As such, we have turned to the nearby galaxy M31, which, whilst far from ideal, provides us with the best opportunity to observe the nova population of a whole galaxy. Novae in M31 can all be assumed to be at the same distance, and whilst there are still dust extinction effects, these are generally much smaller than Galactic extinction. With a nova rate of (Darnley et al., 2006), M31 also presents us with a much larger sample size to study, compared to the Galactic novae that are practically observable each year.
The ability to successfully detect RNe in M31 using the traditional method – the observation of more than one eruption from the same system – is severely hampered in a number of ways. These include; our inability to observe M31 for several months each year; large gaps in the observations of M31, time between surveys, etc.; the astrometric accuracy required to match two eruptions at the distance of M31; the nova distribution in M31 – bulge-centric; all of these selection effects are worse the older the data source. Nonetheless, there have been a number of attempts to explore the recurrent nova population of M31 by searching for multiple eruptions at similar positions (e.g. Rosino, 1973; della Valle & Livio, 1996; Ansari et al., 2004; Henze et al., 2008; Lee et al., 2012; Shafter et al. in preparation). However, these have all been severely limited by the large positional uncertainties of the old novae, and have only yielded a handful of RN candidates. Additionally, astrometric errors can give rise to incorrect association between multiple eruptions, (see Figure 4 of Bode et al., 2009, for example). This technique is further hampered by the misidentification of long period Mira variables as M31 novae (see, for example, Darnley et al., 2004; Shafter et al., 2008a, b).
Some of these problems can be overcome by using a spectroscopically confirmed sample of novae which all have well determined astrometric positions. But this essentially limits us only to M31 novae that have produced eruptions since around 2006, when spectroscopy of large samples of M31 novae in eruption became viable (see Shafter et al., 2011e). Based on the recurrence time-scales of their Galactic counterparts, such a short baseline is not long enough to recover a good sample of RNe using multiple eruptions alone.
Here we propose a technique that can be used to recover the progenitor systems of novae belonging to the RG-nova class (which is dominated by confirmed and candidate RNe of the RS Oph/T CrB sub-class) from a spectroscopically confirmed sample of M31 novae. In some (exceptional) cases this technique may also be able to recover SG-novae in M31 (a class dominated by RNe of the U Sco sub-class) as was recently achieved for the (albeit much closer) Large Magellanic Cloud (LMC) RN LMCN 2009-02a (Bode et al. in preparation).
The technique presented in this paper was also recently used to locate the progenitor system of a RN in M31 with a year recurrence time-scale (Darnley et al., 2014, see also Williams et al., 2013a). The first optical eruption of this system, M31N 2008-12a, was recorded in 2008111http://www.cbat.eps.harvard.edu/CBAT_M31.html#2008{-}12a, with coincident eruptions also being reported in 2011222http://www.cbat.eps.harvard.edu/unconf/followups/J00452885+4154094.html, 2012333http://www.cbat.eps.harvard.edu/unconf/followups/J00452884+4154095.html and 2013 (Tang et al., 2013). A spectrum taken after the 2012 eruption confirmed the transient to be a He/N nova in M31 (Shafter et al., 2012b). Williams et al. (2013a) found a coincident source, with only a 2.5% probability of being a chance alignment, making this system the first confirmed RN in M31 with a resolved progenitor. Work by Darnley et al. (2014), Henze et al. (2014) and Tang et al. (2014) following the 2013 eruption has revealed that the nova system likely contains a high-mass WD and has a high accretion rate. Their work also indicated the nova may have a -year recurrence time, with further eruptions being found in 1992, 1993 (White et al., 1995), 2001 (Williams et al., 2004) and 2009 (Tang et al., 2014). M31N 2008-12a was not included in the survey presented here, as we did not have any eruption photometry taken prior to the end of the survey (February 2013), with the nova having faded beyond detection by the time observations were taken after the 2008 and 2012 eruptions and no observations being made after the 2011 eruption.
A number of space-based and the larger ground-based optical telescopes are capable of resolving red giant stars within M31. As such, the progenitor systems of RG-novae can in principle be directly imaged. Similar work has been used to directly image the lensed system for M31 microlensing events (see, for example Aurière et al., 2001) and indeed for the RN candidate M31N 2007-12b (see Bode et al., 2009, on which this work is largely based), as well as the RN M31N 2008-12a. Kasliwal et al. (2011) have also recently discussed such an approach, as have Williams et al. (2013b), who presented a summary of the initial results of this survey.
2. Type Ia Supernovae
Novae are candidates for the progenitors of Type Ia supernovae (SNe Ia). It is now widely believed that SNe Ia are the result of the thermonuclear explosion of a carbon-oxygen WD, but their progenitors are still uncertain. The two proposed pathways for SN Ia progenitors are the single-degenerate and the double-degenerate models.
The single-degenerate model involves a WD accreting matter from a less evolved secondary and increasing in mass (e.g. Whelan & Iben, 1973). Eventually the WD mass approaches the Chandrasekhar mass and a SN explosion occurs when carbon ignites. One of the leading single-degenerate progenitor candidates are novae, particularly those classified as RNe, due to their high WD masses and low ejecta masses. The main problem with the single-degenerate model concerns the occurrence rate of SNe Ia versus the population of likely progenitors (e.g. della Valle & Livio, 1996). As most WDs in RN systems are generally thought to be increasing in mass with each eruption (e.g. Hachisu et al., 2000, 2007; Osborne et al., 2011) they are prime candidates for the progenitors of SNe Ia. However as most CNe are thought to be decreasing in mass as they undergo eruption, they are unlikely candidates for progenitors of SNe Ia. One of the reasons for this difference may be related to mixing between the WD material and the accreted envelope (see e.g. Starrfield et al., 2012; Newsham et al., 2013 for recent discussions).
The double-degenerate model involves the merger of two WDs, with their combined mass exceeding the Chandrasekhar limit. There seems to be evidence supporting both of these channels and it may be the case that SNe Ia have more than one progenitor pathway. For example Schaefer & Pagnotta (2012) could find no resolvable companion star in the LMC SN Ia remnant SNR 050967.5, implying this SN at least was produced by a double-degenerate system. On the other hand Dilday et al. (2012) suggest that a single-degenerate system with a red giant companion was the progenitor of SN PTF 11kx. Nugent et al. (2011) suggested that SN 2011fe was caused by a single-degenerate system with a main-sequence companion. Li et al. (2011) showed that a system very similar to the RN RS Ophiuchi could not be the progenitor of the same SN; however Darnley et al. (2013) pointed out that this analysis did not exclude a less (optically) luminous RG-nova being the SN Ia progenitor system.
The first nova progenitor system discovered in M31 was that of M31N 2007-12b (Bode et al., 2009). The current paper builds on this work, using Liverpool Telescope (LT) data to search archival Hubble Space Telescope (HST) images for 38 quiescent M31 novae. The light curves for some M31 novae published by Shafter et al. (2011e) are also extended to include HST data taken whilst the nova was still fading. This allowed us to produce light curves that go deeper than is usually possible for extragalactic systems. Additionally, from LT data, we produced a few light curves for novae that underwent eruptions in 2010 as well as updating the positions of all 38 systems.
3. Method
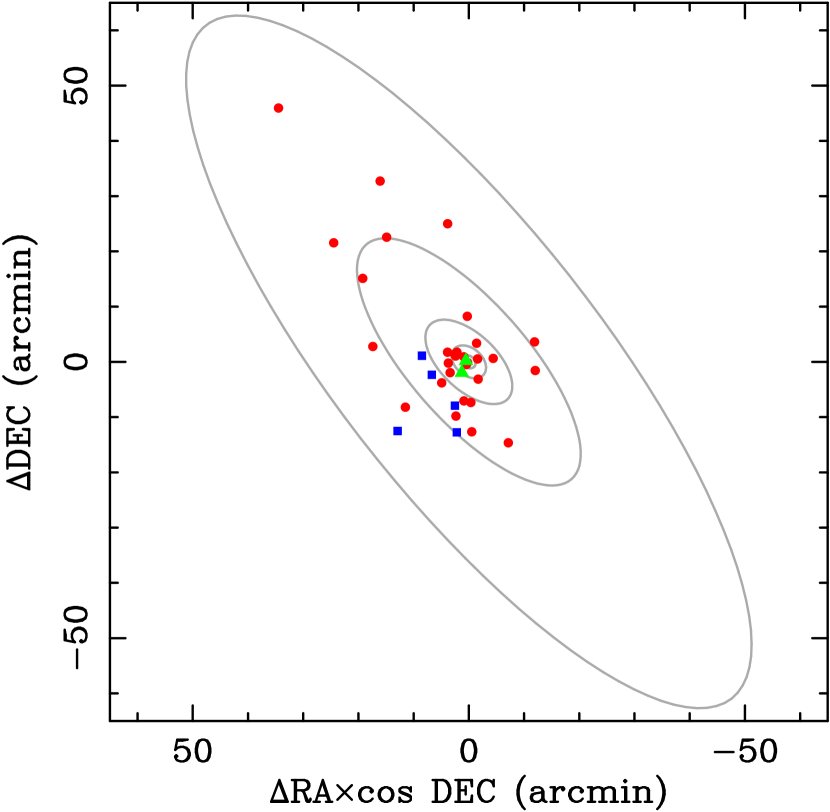
The technique employed in this paper to attempt to recover the progenitor system for each nova is that outlined in Bode et al. (2009). This method relies upon accurate registration between images containing the nova in eruption and deeper (typically archival) high-resolution images where the system is likely to be in quiescence. For this paper we use a catalog of Local Group novae selected by virtue of their spectroscopic confirmation (see Shafter et al., 2011e) and astrometric precision of the eruption. The input catalog of 38 novae is presented in Table 3 and their spatial distribution is shown in Figure 1.
| Nova | Spectral- | (band) | Astrometry | HST archive | Proposal ID of | ||
|---|---|---|---|---|---|---|---|
| Class | in days | LT | FTN | WFPC2 | ACS/WFC | images used | |
| M31N 2006-09c | Fe II11footnotemark: | ()11footnotemark: | 10273 | ||||
| M31N 2006-11a | Fe II11footnotemark: | ()11footnotemark: | 10273 | ||||
| M31N 2007-02b | Fe II1,21,2footnotemark: | ()11footnotemark: | 10260, 11218 | ||||
| M31N 2007-10a | He/Nn1,31,3footnotemark: | ()11footnotemark: | 9719 | ||||
| M31N 2007-10b | He/Nn1,41,4footnotemark: | ()11footnotemark: | 12058 | ||||
| M31N 2007-11b | He/Nn1,51,5footnotemark: | ()11footnotemark: | 10273 | ||||
| M31N 2007-11c | Fe II66footnotemark: | ()11footnotemark: | 12058 | ||||
| M31N 2007-11d | Fe II77footnotemark: | ()11footnotemark: | 12057 | ||||
| M31N 2007-11e | Fe II88footnotemark: | 27 ()99footnotemark: | 12110 | ||||
| M31N 2007-12a | Fe II11footnotemark: | ()11footnotemark: | 12057 | ||||
| M31N 2007-12b | He/N1010footnotemark: | ()11footnotemark: | 12058 | ||||
| M31N 2008-10b | Fe II1111footnotemark: | ()11footnotemark: | 10006, 11833, 12058 | ||||
| M31N 2008-12b | Fe II1212footnotemark: | ()11footnotemark: | 12109 | ||||
| M31N 2009-08a | Fe II1313footnotemark: | ()11footnotemark: | 10760, 12058 | ||||
| M31N 2009-08b | Fe II1414footnotemark: | ()11footnotemark: | 12114 | ||||
| M31N 2009-08d | Fe II1515footnotemark: | ()11footnotemark: | 10006 | ||||
| M31N 2009-10b | Fe II1616footnotemark: | ()11footnotemark: | 11013, 12058 | ||||
| M31N 2009-10c | Fe II1717footnotemark: | ()11footnotemark: | 10006, 12058 | ||||
| M31N 2009-11a | Fe II1818footnotemark: | ()11footnotemark: | 10273 | ||||
| M31N 2009-11b | Fe II1919footnotemark: | ()11footnotemark: | 10273 | ||||
| M31N 2009-11c | Fe II2020footnotemark: | ()11footnotemark: | 10273, 12058 | ||||
| M31N 2009-11d | Fe II2121footnotemark: | ()11footnotemark: | 12105 | ||||
| M31N 2009-11e | Fe II2222footnotemark: | ()11footnotemark: | 5907, 12058 | ||||
| M31N 2010-01a | Fe II2323footnotemark: | ()2424footnotemark: | 10760, 12058 | ||||
| M31N 2010-05a | Fe II2525footnotemark: | ()2424footnotemark: | 10006, 12058 | ||||
| M31N 2010-09b | Fe II26,2726,27footnotemark: | ()2424footnotemark: | 12073 | ||||
| M31N 2010-10a | Fe II2727footnotemark: | ()2424footnotemark: | 12109 | ||||
| M31N 2010-10b | Fe II2828footnotemark: | 2929footnotemark: | 10273 | ||||
| M31N 2010-10c | Fe II3030footnotemark: | 202929footnotemark: | 10407 | ||||
| M31N 2010-10d | Fe II3131footnotemark: | ()2424footnotemark: | 10006, 12058 | ||||
| M31N 2010-10e | He/N3232footnotemark: | 2929footnotemark: | 10273 | ||||
| M31N 2011-10a | Fe II33,3433,34footnotemark: | 12058 | |||||
| M31N 2011-10d | Fe II35,3635,36footnotemark: | 12058 | |||||
| M31N 2011-12a | Fe II3737footnotemark: | 10273 | |||||
| M31N 2012-01a | Fe II3838footnotemark: | 11647 | |||||
| M31N 2012-09a | Fe IIb3939footnotemark: | 12058 | |||||
| M31N 2012-09b | Fe IIb4040footnotemark: | 12058 | |||||
| M31N 2012-12a | Fe II4141footnotemark: | 12058 | |||||
References. — (1) Shafter et al. (2011e), (2) Pietsch et al. (2007a), (3) Gal-Yam & Quimby (2007), (4) Rau et al. (2007), (5) Rau (2007), (6) Ciroi et al. (2007), (7) Shafter et al. (2009), (8) Di Mille et al. (2007), (9) Shafter et al. (2011b), (10) Bode et al. (2009), (11) Di Mille et al. (2010), (12) Kasliwal et al. (2009), (13) Valeev et al. (2009), (14) Rodríguez-Gil et al. (2009), (15) Di Mille et al. (2009), (16) Barsukova et al. (2009), (17) Fabrika et al. (2009), (18) Hornoch et al. (2009b), (19) (Kasliwal, 2009), (20) Hornoch et al. (2009c), (21) Hornoch et al. (2009a), (22) Hornoch & Pejcha (2009), (23) Hornoch et al. (2010c), (24) this work (see Section 6), (25) Hornoch et al. (2010a), (26) Shafter et al. (2010c), (27) Shafter et al. (2010e), (28) Shafter et al. (2010f), (29) Cao et al. (2012), (30) Shafter et al. (2010d), (31) Shafter et al. (2010b), (32) Shafter et al. (2010a), (33) Cao et al. (2011), (34) Cao (2011) (35) Shafter et al. (2011c), (36) Shafter et al. (2011d), (37) Shafter et al. (2011a), (38) Shafter et al. (2012a), (39) Shafter et al. (2012c), (40) Shafter et al. (2012e), (41) Shafter et al. (2012d)
LT and Faulkes Telescope North (FTN) data were taken as part of a monitoring survey of Local Group novae post-eruption. Observations were generally taken through , , and filters, with a typical exposure time per filter of 180s (each comprising s images combined by taking the median). For most of these observations the cameras were operated in a binning mode, giving an effective pixel size of . Towards the end of this survey, the observations in the and filters were dropped in favour of first a higher cadence through the and filters and more recently, greater exposure times.
The accuracy of the registration between the LT data and the HST data is dependent upon a number of factors, including: the size of the common overlap region; the stellar density in the overlap; the seeing of the ground-based data; the luminosity of the nova, and the HST instrument available. Typically, it is the seeing in the ground-based data that has the largest detrimental effect, but some compromise must be reached between the ground-based seeing and the luminosity of the nova for each eruption. In order to minimise these effects we employ a number of approaches. We preferentially used ground-based data in and filters, as these are where the LT is most sensitive, yielding superior position measurements on fainter objects and usually more numerous objects for registration. Ideally we would compare the ground-based data to HST data taken using the Wide-Field Camera 3 - UVIS Channel (WFC3/UVIS), however there is to-date little data taken within the M31 field in suitable filters and indeed none coincident with the novae in this survey. Therefore we preferentially choose Advanced Camera for Surveys - Wide-Field Channel (ACS/WFC) data over Wide-Field Planetary Camera 2 (WFPC2) data. This is due to the greater spatial resolution and quantum efficiency improvement and hence better sampling of the PSF. As the ideal ground based data are generally “red”, we chose the most appropriate HST filter if possible, typically F814W.
For this study, we use data taken by the LT (Steele et al., 2004) on La Palma, backed-up by one of its sister telescopes, the FTN in Hawaii (the FTN data were not required to complete this survey), to determine the eruption position of the nova and archival HST data for the identification and photometry of the progenitor candidate. The ground-based data were processed and analysed using a combination of Starlink444http://starlink.jach.hawaii.edi and IRAF (Tody, 1986, 1993) software. We used imaging data from WFPC2, ACS/WFC and WFC3/UVIS on-board HST, all three of which provide very good overlap with the LT RATCam fields. The HST data are again processed using Starlink and IRAF software, the HST photometry is performed using HSTphot (v1.1; Dolphin, 2000) for the WFPC2 data and DOLPHOT (v1.1)555http://purcell.as.arizona.edu/dolphot, a photometry package based on HSTphot, for the ACS/WFC data.
4. Observations
4.1. Eruption Photometry
The LT data were reduced using a combination of IRAF and Starlink software, calibrated using standard stars from Magnier et al. (1992), Haiman et al. (1994) and Massey et al. (2006). The time (in days) it takes a nova to fade by two magnitudes () was calculated using different methods, depending on the data available. Typically, for well populated light curves, this involved a simple linear extrapolation of the data around maximum and around 2 magnitudes below the peak. Where different approaches were employed this is described for the respective novae in Section 6.
4.2. LT Image Selection
We used LT images taken using the RATCam instrument in the Sloan-like and filters along with and Bessel filters. We selected the images that would produce the most reliable position for each nova, taking into consideration both the seeing and brightness of the nova. In this survey, no ground-based data with FWHM seeing poorer than were used. We also matched the filters with those used for the HST images where possible. The position of each nova in the catalog with respect to 2MASS (Skrutskie et al., 2006) is shown in Table 2.
4.3. HST Image Selection
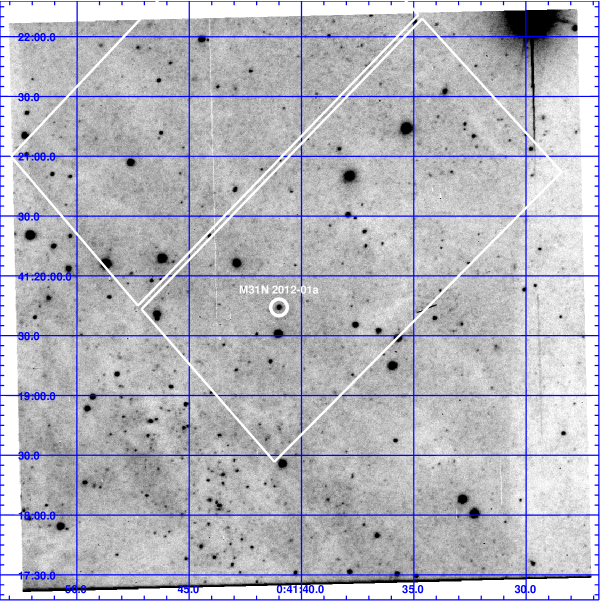
For this work, we used archival HST images taken with ACS/WFC and WFPC2 using the F435W, F475W, F555W, F606W, F625W, and F814W filters. For some novae, pre-eruption archival HST images were not available, but images taken long after the eruption were. In such cases we have ensured that the system is likely to be at quiescence using the speed of the nova and the images themselves. For example, a nova with a of just a few days will clearly have faded to quiescence if the images were taken some years after the eruption. Additionally, for novae which we could not be sure were at quiescence using the previous method, we looked at multiple HST images. A system was assumed to be at quiescence if it has not faded between one HST image and the next when they were taken several months apart. For the individual novae with only post-eruption data, we have noted why the system is believed to be at quiescence in Section 5. A typical example of how LT images of novae in eruption coincide with archival HST data is shown in Figure 2.
4.4. Astrometry
We combined the best images for a given nova, taking into account the seeing and the brightness of the nova itself, in order to produce the most precise position possible for the system. Typically, around stars were selected and matched up with the corresponding stars in the other images. The necessary translation, rotation, magnification and distortion needed for the images to align were then calculated and executed using standard routines in IRAF. We then combined the newly aligned images using the median. Finally the position of the nova within the combined image was measured.
The positions of about stars in the combined image were then recorded, as were their respective positions in the chosen HST image. For the astrometric analysis we used the drizzled (drz) HST images. The drizzling process is an algorithm used on HST data to correct for geometric distortion and cosmic rays by combining pre-processed images. We then matched the two lists of coordinates and transformed the LT coordinates using the same IRAF routines. The position of the nova in the LT data was therefore transformed into a position in the HST image.
Using the position determined from the LT image we also calculated the coordinates of each nova using 2MASS (Skrutskie et al., 2006). These were computed using the same method as described above by utilising the positions of the stars in 2MASS, rather than the HST images. The resulting positions are more accurate than those previously published in the majority of cases and are shown in Table 2.
| Nova | Telescope | Date (UT) | Filter | Right Ascension (J2000) | Declination (J2000) |
|---|---|---|---|---|---|
| M31N 2006-09c | LT | 2006 September 19.0 | |||
| M31N 2006-11a | LT | 2007 February 9.9 | |||
| M31N 2007-02b | LT | 2007 February 14.9 | |||
| M31N 2007-10a | LT | 2007 October 10.9 | |||
| M31N 2007-10b | LT | 2007 October 16.0 | |||
| M31N 2007-11b | LT | 2007 November 16.9 | |||
| M31N 2007-11c | LT | 2007 November 17.0 | |||
| M31N 2007-11d | LT | 2007 November 28.0 | |||
| M31N 2007-11e | LT | 2007 December 5.1 | |||
| M31N 2007-12a | LT | 2007 Dec 16.9, 31.8, 2008 Jan 8.9 | |||
| M31N 2007-12b | LT | 2007 December 14.9 | |||
| M31N 2008-10b | LT | 2008 October 21.0 | |||
| M31N 2008-12b | LT | 2009 January 15.0 | |||
| M31N 2009-08a | LT | 2009 August 27.1, September 4.1 | |||
| M31N 2009-08b | LT | 2009 August 18.0 | |||
| M31N 2009-08d | LT | 2009 August 20.1 | |||
| M31N 2009-10b | LT | 2009 October 15.0 | |||
| M31N 2009-10c | LT | 2009 October 15.0 | |||
| M31N 2009-11a | LT | 2009 November 13.9 | |||
| M31N 2009-11b | LT | 2009 December 6.8 | |||
| M31N 2009-11c | LT | 2009 November 12.9 | |||
| M31N 2009-11d | LT | 2009 November 24.0 | |||
| M31N 2009-11e | LT | 2009 November 27.0 | |||
| M31N 2010-01a | LT | 2010 January 15.9 | |||
| M31N 2010-05a | LT | 2010 June 17.2 | |||
| M31N 2010-09b | LT | 2010 October 5.1 | |||
| M31N 2010-10a | LT | 2010 October 10.1 | |||
| M31N 2010-10b | LT | 2010 October 11.1 | |||
| M31N 2010-10c | LT | 2010 October 22.1 | |||
| M31N 2010-10d | LT | 2010 October 30.0 | |||
| M31N 2010-10e | LT | 2010 November 7.0 | |||
| M31N 2011-10a | LT | 2011 October 26.1 | |||
| M31N 2011-10d | LT | 2011 October 26.1 | |||
| M31N 2011-12a | LT | 2011 December 26.8 | |||
| M31N 2012-01a | LT | 2012 January 10.8 | |||
| M31N 2012-09a | LT | 2012 September 10.0 | |||
| M31N 2012-09b | LT | 2012 September 18.2 | |||
| M31N 2012-12a | LT | 2012 December 20.9 |
4.5. Photometry
Crowded field, PSF-fitting photometry was performed on the available HST data around the position of each nova using the specific ACS/WFC modules for the DOLPHOT photometry software and the HSTphot software for the WFPC2 data. These software packages create catalogs of all objects (above a certain detection threshold; above the local background in this case) simultaneously across all available filters for each data-set. For the purpose of this work HSTphot and DOLPHOT were essentially run as “black-boxes” following the standard procedure and parameters given in the manuals/cookbooks. We combined photometry taken in the same filter from multiple observations (all taken at one HST observation epoch; i.e. all the raw (flt) data used to created one drz image) by using a weighted mean, with the associated errors propagated with the weightings in mind.
The results of this photometry were first used to determine the position of all objects in the vicinity of the nova eruption, and from this the position of the most likely (statistically closest) matching object is drawn. We also use the positional information to determine the object density in the region surrounding each nova eruption. The object density is then used – through a Monte Carlo technique – to calculate the probability that a positional offset, between the nova and progenitor candidate, at least as small can occur through chance. We use this probability to examine how significant the detection of any progenitor candidates, which appear to be coincident with the nova, may be.
The HSTphot/DOLPHOT software also computes photometry for each object in the catalog. This photometry is presented in the native HST photometric/filter system, and where photometry in at least two filters is available for a particular object we convert these data from the HST flight system to the UBVRI system using the relations from Dolphin (2009) and Sirianni et al. (2005) for the WFPC2 and ACS/WFC data respectively. Additionally, the extinction internal to M31 that the novae may be subject to was calculated for each individual system based on its apparent position within the galaxy. The extinction estimates were based on the internal extinction map of M31 published by Darnley (2005). This extinction map gives the -band extinction for an object positioned at the far side of M31. We then used the extinction law from Cardelli et al. (1989) to estimate the equivalent , , and extinction. Extrapolation was used for novae located in regions not covered by the extinction map. We assumed that the actual line-of-sight internal extinction will be distributed randomly (linearly) between this maximum value and zero, and incorporated this into the magnitude and color determinations of the quiescent systems.
5. Progenitor Systems
Here we present detailed information regarding the outcome of the progenitor candidate search for each of the 38 novae in the input catalog. The positional information for the most likely matching objects for each nova, along with the probability of coincidence are summarised in Table 3.
| Nova | Distance from nova position | Significance | Coincidence | Limiting | |
|---|---|---|---|---|---|
| (pixels) | (arcsec) | () | probability | Magnitude (filter) | |
| M31N 2006-09c | 1.688 | 3.90 | 0.285 | 23.8 (F814W) | |
| M31N 2006-11a | 2.825 | 3.95 | 0.580 | 26.1 (F814W) | |
| M31N 2007-02b | 0.325 | 0.30 | 0.011 | 26.6 (F814W) | |
| M31N 2007-10a | 0.517 | 1.00 | 0.027 | 26.3 (F814W) | |
| M31N 2007-10b | 1.529 | 1.85 | 0.212 | 25.4 (F814W) | |
| M31N 2007-11b | 0.319 | 1.75 | 0.0005 | 22.3 (F814W) | |
| M31N 2007-11c | 2.317 | 2.80 | 0.422 | 24.7 (F814W) | |
| M31N 2007-11d | 0.181 | 0.25 | 0.003 | 26.3 (F814W) | |
| 2.018 | 1.75 | 0.344 | |||
| M31N 2007-11e | 0.786 | 1.40 | 0.042 | 26.4 (F814W) | |
| M31N 2007-12a | 0.446 | 1.30 | 0.017 | 26.1 (F814W) | |
| M31N 2007-12b | 0.684 | 0.95 | 0.043 | 25.5 (F814W) | |
| M31N 2008-10b | 1.815 | 2.95 | 0.309 | 26.4 (F435W) | |
| M31N 2008-12b | 1.431 | 1.75 | 0.180 | 26.0 (F475W)aaDue to problems with the F814W photometry, short exposure images had to be used, leading to a relatively bright limiting magnitude. For F814W limiting magnitudes see text for each nova. | |
| M31N 2009-08a | 1.118 | 1.40 | 0.121 | 26.0 (F435W) | |
| M31N 2009-08b | 2.830 | 3.25 | 0.571 | 26.6 (F814W) | |
| M31N 2009-08d | 3.236 | 2.95 | 0.627 | 25.9 (F435W) | |
| M31N 2009-10b | 1.803 | 4.30 | 0.291 | 26.7 (F435W) | |
| M31N 2009-10c | 2.128 | 2.40 | 0.287 | 25.9 (F435W) | |
| M31N 2009-11a | 3.999 | 3.45 | 0.683 | 26.5 (F814W) | |
| M31N 2009-11b | 1.971 | 4.15 | 0.386 | 23.8 (F814W) | |
| M31N 2009-11c | 2.975 | 3.35 | 0.550 | 25.8 (F814W) | |
| M31N 2009-11d | 0.505 | 0.60 | 0.022 | 26.4 (F814W) | |
| M31N 2009-11e | 1.104 | 0.80 | 0.099 | 22.8 (F814W) | |
| M31N 2010-01a | 1.058 | 1.45 | 0.094 | 26.1 (F435W) | |
| M31N 2010-05a | 1.939 | 2.20 | 0.369 | 25.8 (F435W) | |
| M31N 2010-09b | 0.579 | 0.55 | 0.026 | 26.3 (F814W) | |
| 2.264 | 2.05 | 0.363 | |||
| M31N 2010-10a | 1.181 | 1.20 | 0.112 | 26.7 (F814W) | |
| M31N 2010-10b | 1.968 | 3.60 | 0.334 | 26.1 (F814W) | |
| M31N 2010-10c | 1.083 | 1.05 | 0.124 | 27.1 (F606W) | |
| 1.988 | 1.90 | 0.385 | |||
| 2.084 | 2.00 | 0.416 | |||
| 3.405 | 3.00 | 0.786 | |||
| M31N 2010-10d | 2.992 | 4.25 | 0.656 | 26.3 (F435W) | |
| M31N 2010-10e | 1.216 | 0.80 | 0.156 | 25.9 (F814W) | |
| 1.859 | 1.45 | 0.344 | |||
| 4.310 | 2.75 | 0.923 | |||
| M31N 2011-10a | 2.540 | 4.80 | 0.468 | 26.1 (F475W)aaDue to problems with the F814W photometry, short exposure images had to be used, leading to a relatively bright limiting magnitude. For F814W limiting magnitudes see text for each nova. | |
| M31N 2011-10d | 1.400 | 3.25 | 0.164 | 26.1 (F475W)aaDue to problems with the F814W photometry, short exposure images had to be used, leading to a relatively bright limiting magnitude. For F814W limiting magnitudes see text for each nova. | |
| M31N 2011-12a | 1.129 | 1.15 | 0.036 | 24.2 (F814W) | |
| M31N 2012-01a | 1.712 | 2.50 | 0.220 | 26.2 (F814W) | |
| M31N 2012-09a | 2.152 | 3.65 | 0.328 | 25.8 (F475W)aaDue to problems with the F814W photometry, short exposure images had to be used, leading to a relatively bright limiting magnitude. For F814W limiting magnitudes see text for each nova. | |
| M31N 2012-09b | 3.659 | 10.55 | 0.784 | 24.6 (F814W) | |
| M31N 2012-12a | 1.532 | 2.00 | 0.199 | 25.6 (F475W)aaDue to problems with the F814W photometry, short exposure images had to be used, leading to a relatively bright limiting magnitude. For F814W limiting magnitudes see text for each nova. | |
| M31N 2009-08a | 0.516 | 2.85 | 0.024 | 26.0 (F435W) | |
| M31N 2010-01a | 0.641 | 2.65 | 0.038 | 26.1 (F435W) | |
-
1.
M31N 2006-09c. Nova M31N 2006-09c was an Fe II type nova with an -band of days (Shafter et al., 2011e). The LT eruption detection images were taken using a -band filter on 2006 September 19.0 and we calculated the position of the nova to be , . The HST images used were taken using WFPC2 with F814W and F555W filters on 2004 August 22. There is no resolvable source within 3 of the calculated position, with the nearest object being 1.688 WFPC2 pixels, or away from the defined position. The local population density suggests there is a 28.5% probability of an object alignment this close occurring by chance. We note that due to the data being taken with WFPC2, which typically cannot resolve sources as faint as those accessible to ACS/WFC, there may be sources that would have been visible in ACS/WFC data closer to the position of the nova than . Therefore the 28.5% coincidence probability is valid for objects with an F814W magnitude brighter than 23.8. From the overall distribution of stars in the M31 field that are detectable by ACS/WFC, we would expect a source to be at least as close as to a random point in a typical ACS/WFC image about of the time. The location around the nova eruption position is shown in Figure 3 (top left).
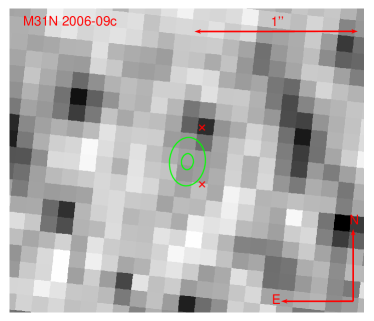
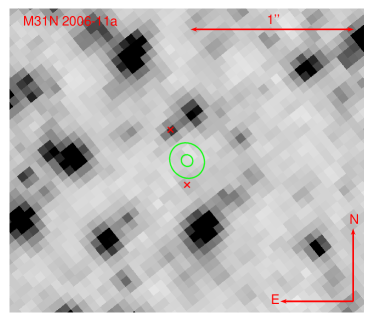
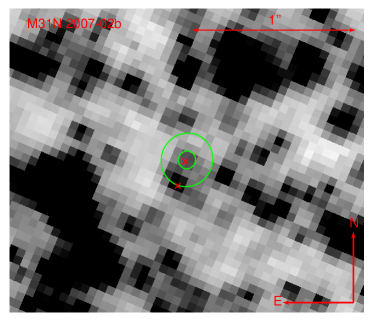
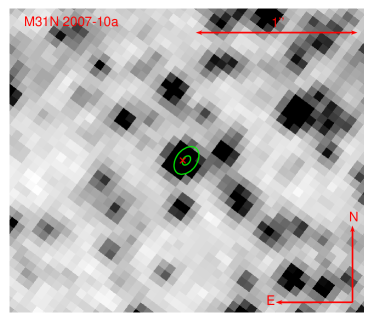
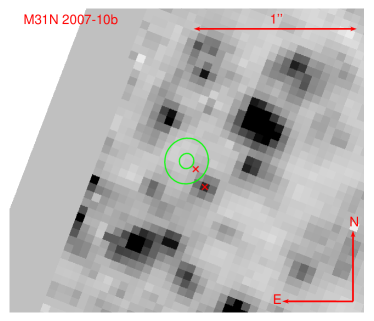
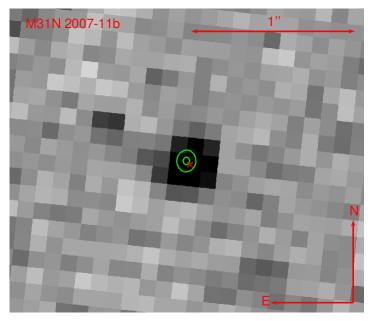
Figure 3.— HST images of the region surrounding each nova. Top left: WFPC2 F555W image, M31N 2006-09c eruption position determined from LT -band data. Top right: ACS/WFC F814W image, M31N 2006-11a eruption position determined from LT -band data. Middle left: ACS/WFC F814W image, M31N 2007-02b eruption position determined from LT -band data. Middle right: ACS/WFC F625W image, M31N 2007-10a eruption position determined from LT -band data. Bottom Left: ACS/WFC F814W image, M31N 2007-10b eruption position determined from LT -band data. Bottom Right: WFPC2 F814W image, M31N 2007-11b eruption position determined from LT -band data. In each case, the inner green ellipse indicates the radius uncertainty of the eruption position, the outer ellipse the region. The red indicates the position of any nearby resolvable objects in the archival data. (A color version of this figure is available in the online journal.) -
2.
M31N 2006-11a. The region where the progenitor system of nova M31N 2006-11a lies is covered by HST images that were taken with ACS/WFC using F814W and F555W filters on 2004 August 17. Again, there is no resolvable source within of the calculated position, with the closest resolvable source being 2.825 ACS/WFC pixels, or away from the defined position. The local population density suggests that the coincidence probability at this separation is . The limiting F814W magnitude is 26.1. The region where this system lies is shown in Figure 3 (top right).
-
3.
M31N 2007-02b. The archival HST images of the location of M31N 2007-02b were taken with ACS/WFC using an F814W filter on 2004 July 4 and an F606W filter on 2004 August 2. There is a resolvable source within of the calculated position and no other resolvable source within . The source is 0.325 ACS/WFC pixels, or away from the defined position. The local population density, which is resolved down to an F814W magnitude of 26.6, suggests there is only a 1.1% chance of coincidence at such a separation. The candidate had an F814W magnitude of on 2004 July 4 and an F606W magnitude of on 2004 August 2. If we simply assume the source remained at a constant brightness between the two dates, this gives a -band magnitude of , -band magnitude of and () color of . However, all novae show some variation in their luminosity during quiescence. Such variation is typically related to the accretion disk, generally the greater the accretion rate the higher the amplitude of the variation. RS Oph shows some of the largest amplitude variation at quiescence, around 1 magnitude (Darnley et al., 2008). We can see from Darnley (2005) that a nova at the apparent position of M31N 2007-02b would be subject to -band extinction of if it were at the far side of the galaxy. Using the extinction law from Cardelli et al. (1989) this equates to maximum -band extinction of and -band extinction of . If we take this into account we derive a -band magnitude of , -band magnitude of and () color of . This system is shown in Figure 3 (middle left). By chance, M31N 2007-02b was also observed during its eruption with WFPC2 on 2007 September 13, which is described in Section 6. As the nova is relatively faint at this time any attempt to calculate the position of the system in the quiescent HST image from the eruption HST image is dominated by the error on the position in the WFPC2 eruption image and does not aid the progenitor search.
-
4.
M31N 2007-10a. The region where M31N 2007-10a lies is covered by HST images that were taken with ACS/WFC using an F625W filter on 2003 August 5. There is a resolvable source near of the calculated position and no other resolvable source within . The source is 0.517 ACS/WFC pixels, or away from the defined position. The local resolved stellar density suggests that the coincidence probability at this separation is 2.7%. The source had an F625W magnitude of at this time. The HST images were only taken in one filter, so we were unable to calculate the color of the source, although we estimate it to have an -band magnitude of with internal extinction in M31 taking it to . The location of this system is shown in Figure 3 (middle right).
-
5.
M31N 2007-10b. The location around the position of nova M31N 2007-10b was observed by HST with ACS/WFC using F814W and F475W filters on 2010 July 22. In the F475W data, there is one source within of the calculated position that is not detected in the F814W image, which has a limiting magnitude of 25.4. The source is 1.529 ACS/WFC pixels, or away from the defined position and the probability of such an alignment occurring by chance is 21.2%. The nearest resolvable source in the F814W data is 3.842 ACS/WFC pixels, or 4.40 away from the defined position. The local population density suggests that the coincidence probability at this separation is 81.1%. The region where this nova erupted is shown in Figure 3 (bottom left).
-
6.
M31N 2007-11b. Although the area of M31 where M31N 2007-11b lies has not yet been observed with ACS/WFC, HST images were taken with WFPC2 using F814W and F555W filters on 2005 February 18. There is a resolvable source within of the calculated HST position and no other resolvable source within 3. The source is 0.319 WFPC2 pixels, or away from the defined position, with the local object density suggesting a coincidence probability at this separation of only 0.05%. However these images have an F814W limiting magnitude as bright as 22.3. Therefore the 0.05% coincidence probability is valid only for objects with an F814W magnitude . The candidate had an F555W magnitude of and F814W magnitude of at this time. This gives an I-band magnitude of and V-band magnitude of , with color of . Darnley (2005) showed that a nova at the apparent position of M31N 2007-11b would be subject to -band extinction of approximately if it were at the far side of the galaxy. Therefore we derive a V-band magnitude of , I-band magnitude of and () color of . Notably, from the overall distribution of stars in the M31 field in ACS/WFC, we would predict a source to be at least as close as in a typical ACS/WFC image only about 4% of the time. M31N 2007-11b is shown in Figure 3 (bottom right).
-
7.
M31N 2007-11c. The location around the position of M31N 2007-11c was observed by HST with ACS/WFC using F814W and F475W filters on 2010 July 21. There is one resolvable source just within of the calculated position. The source is 2.317 ACS/WFC pixels, or away from the defined position. The local population density, which is resolved down to an F814W magnitude of 24.7, suggests there is a 42.2% chance of coincidence at such a separation. The location of this nova is shown in Figure 4 (top left).
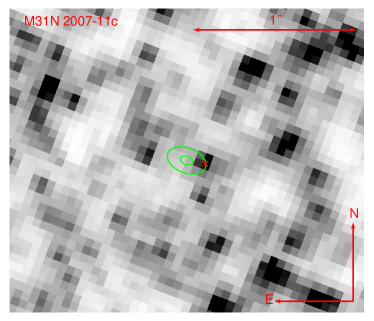
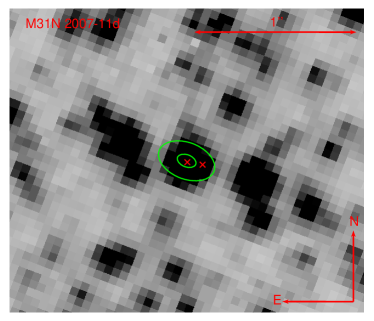
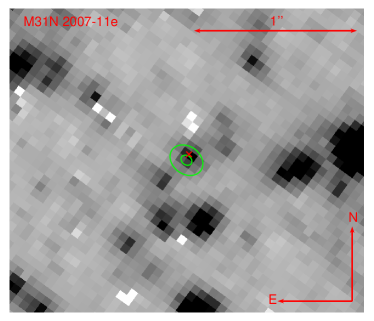
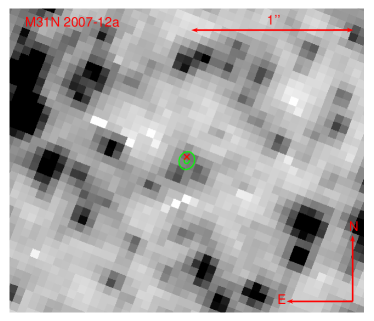
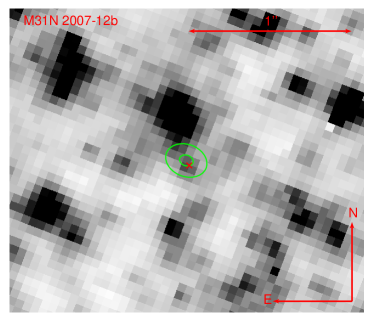
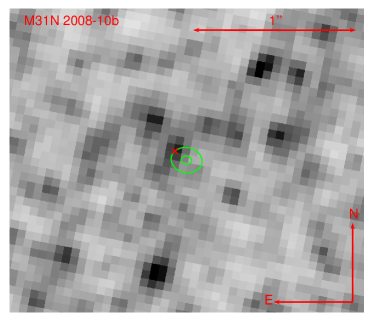
Figure 4.— As Figure 3. Top left: ACS/WFC F814W image, M31N 2007-11c eruption position determined from LT -band data. Top right: ACS/WFC F814W image, M31N 2007-11d eruption position determined from LT -band data. Middle left: ACS/WFC F814W image, M31N 2007-11e eruption position determined from LT -band data. Middle right: ACS/WFC F814W image, M31N 2007-12a eruption position determined from LT -band data. Bottom left: ACS/WFC F814W image, M31N 2007-12b eruption position determined from LT -band data. Bottom right: ACS/WFC F435W image, M31N 2008-10b eruption position determined from LT -band data. (A color version of this figure is available in the online journal.) -
8.
M31N 2007-11d. HST images were taken of the position where M31N 2007-11d lies with ACS/WFC using F814W and F475W filters on 2010 July 13. There is a resolvable source within of the calculated position and another within . The closest candidate is 0.181 ACS/WFC pixels, or away from the defined position. The local resolved stellar density, which is resolved down to an F814W magnitude of 26.3, suggests there is only a 0.3% chance of coincidence at such a separation. This candidate had an F475W magnitude of and F814W magnitude of . This gives I-band magnitude of , B-band magnitude of and a color of . The other candidate is 2.018 ACS/WFC pixels, or away from the defined position, with a 34.4% chance of coincidence at this separation. We can see from Darnley (2005) that a nova at the apparent position of M31N 2007-11d would be subject to -band extinction of if it were at the far side of the galaxy. Taking this into account gives a B-band magnitude of , I-band magnitude of and () color of for the closer of the two progenitor candidates. The area around M31N 2007-11d is shown in Figure 4 (top right).
-
9.
M31N 2007-11e. HST images were taken with ACS/WFC using F814W and F475W filters on 2012 February 5 that encompass the position of M31N 2007-11e. There is a resolvable source within of the calculated HST position and no other resolvable sources within . The candidate is 0.786 ACS/WFC pixels, or away from the defined position of the nova and has an F814W magnitude of and F475W magnitude of . This gives an I-band magnitude of , B-band magnitude of , with a color of . We estimate from Darnley (2005) that a nova at the apparent position of M31N 2007-11e may be subject to a maximum -band extinction of . Taking this into account gives a B-band magnitude of , I-band magnitude of and () color of for the progenitor candidate. At the separation of , the local population density suggests a coincidence probability of 4.2%. These images have an F814W limiting magnitude of 26.4. M31N 2007-11e is shown in Figure 4 (middle left).
-
10.
M31N 2007-12a. The HST images that were used to locate M31N 2007-12a were taken with ACS/WFC using F814W and F475W filters on 2010 December 31. There is only one resolvable source within of the calculated position. The candidate is 0.446 ACS/WFC pixels, or away from the defined position, with an F475W magnitude of and F814W magnitude of . This gives an -band magnitude of and -band magnitude of , with a color of . We can see from Darnley (2005) that a nova at the apparent position of M31N 2007-12a would be subject to -band extinction of if it were at the far side of the galaxy. Therefore we derived a B-band magnitude of , I-band magnitude of and () color of . The local population density, which has an F814W limiting magnitude of 26.1, suggests there is only a 1.7% chance of coincidence at such a separation. This nova is shown in Figure 4 (middle right).
-
11.
M31N 2007-12b. The location of M31N 2007-12b was observed by HST with ACS/WFC using F814W and F475W filters on 2010 July 21 and 22. There is a resolvable source within of the calculated position and no other resolvable sources within . The candidate is 0.684 ACS/WFC pixels, or away from the defined position, with the local resolved stellar density suggesting there is a 4.3% chance of coincidence at such a separation. The progenitor candidate had an F475W magnitude of and F814W magnitude of at this time, which gives an -band magnitude of , -band magnitude of and color of . This is the same candidate that was identified by Bode et al. (2009), who used a different set of HST images and found that the probability of a star being as close by change was 3.4% (the 2010 post-eruption observations were not available at the time of that publication) They found the candidate to have -band apparent magnitude of and color of in August 2004 (it is worth noting that Bode et al. (2009) indicated that their F814W observations may have been affected by a cosmic ray). The location of the quiescent M31N 2007-12b is shown in Figure 4 (bottom left). Darnley (2005) found that a nova at the apparent position of M31N 2007-12b would be subject to -band extinction of if it were at the far side of the galaxy. We therefore calculate an unextinguished B-band magnitude of and I-band magnitude of , and a de-reddened () color of .
-
12.
M31N 2008-10b. HST images, coincident with the position of M31N 2008-10b, were taken with ACS/WFC using an F435W filter on 2004 October 2. There is one resolvable source within of the calculated position. The candidate is 1.815 ACS/WFC pixels, or away from the defined position. The local population density, which is resolved down to an F435W magnitude of 26.4, suggests there is a 30.9% chance of coincidence at such a separation. The HST images were only taken in one filter, so were unable to measure the color of the source. The location of M31N 2008-10b is shown in Figure 4 (bottom right). Additional post-eruption ACS/WFC F435W data taken on 2010 January 1 allow us to determine that the source listed above is not related to the nova, this is illustrated in Figure 5 (see also Section 6 for further discussion).

Figure 5.— As Figure 3. HST ACS/WFC F435W FLT image with the M31N 2008-10b eruption position determined from additional post-eruption ACS/FWC F435W data. The marked source is the same as that marked in Figure 4 (bottom right). (A color version of this figure is available in the online journal.) -
13.
M31N 2008-12b. The location of nova M31N 2008-12b was observed by HST with ACS/WFC using F814W and F475W filters on 2012 July 9. The closest resolvable source, and the only one within , is 1.431 ACS/WFC pixels, or away from the defined position. It has an F475W magnitude of , but is not detected in the F814W data. However, it should be noted that due to problems with the photometry and a short-exposure F814W image having to be used, the limiting F814W magnitude was only 22.7, whereas the F475W magnitude limit was 26.0. The local population density suggests that there is an 18.0% probability of such an alignment occurring by chance. The closest source resolvable in the F814W data was 4.558 ACS/WFC pixels, or away from the defined position. The location of this nova eruption, including the candidate only visible in the F475W image, is shown in Figure 6 (top left).
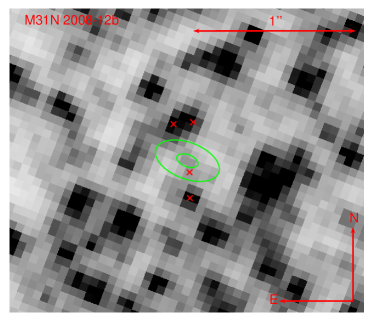

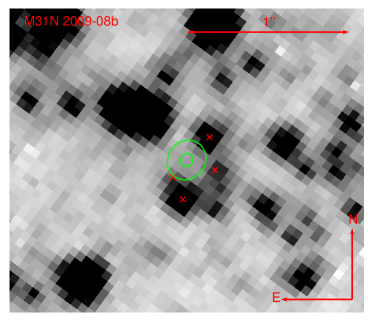


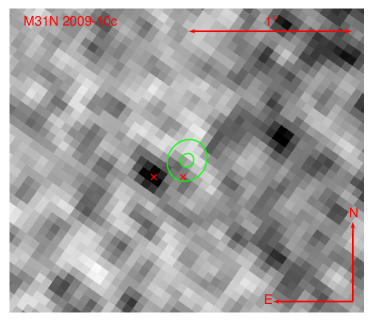
Figure 6.— As Figure 3. Top left: ACS/WFC F814W image, M31N 2008-12b eruption position determined from LT -band data. Top right: ACS/WFC F435W image, M31N 2009-08a eruption position determined from LT -band data. Middle left: ACS/WFC F814W image, M31N 2009-08b eruption position determined from LT -band data. Middle right: ACS/WFC F435W image, M31N 2009-08d eruption position determined from LT -band data. Bottom left: ACS/WFC F435W image, M31N 2009-10b eruption position determined from LT -band data. Bottom right: ACS/WFC F435W image, M31N 2009-10c eruption position determined from LT -band data. (A color version of this figure is available in the online journal.) -
14.
M31N 2009-08a. The HST images used to locate the quiescent M31N 2009-08a were taken with ACS/WFC using an F435W filter on 2007 January 10. There is a resolvable source within of the calculated position and no other resolvable sources within . The source is 1.118 ACS/WFC pixels, or away from the defined position, with the local population density suggesting there is a 12.1% chance of coincidence at such a separation. The source has an F435W magnitude of and the images have a limiting magnitude of 26.0. The HST images were only taken in one filter, so we were unable to calculate the color of the source, although we estimate it to have a B-band magnitude of with internal extinction in M31 taking in to . The position of the system, as determined from the LT images, is shown in Figure 6 (top right). M31N 2009-08a was also observed in eruption with ACS/WFC on 2010 July 21 and December 14, which is described in Section 6. Using this post-eruption HST data, we were able to determine the position of the progenitor without using LT data. Here we used the same method as previously described, but used the photometrically determined positions for the transformations. The closest resolvable source is 0.516 ACS/WFC pixels, or away from the defined position of the nova, with a 2.4% probability of a chance alignment. Due to the small errors associated with the transformation and the source being relatively faint, the errors on the position of the pre-eruption source may be more significant than in the regular transformations using LT data. The position of the nova, as determined from the post-eruption HST data, is shown in Figure 7.

Figure 7.— As Figure 3. ACS/WFC F435W FLT image with M31N 2009-08a eruption position determined from post-eruption F475W data. (A color version of this figure is available in the online journal.) -
15.
M31N 2009-08b. HST images, coincident with the position of M31N 2009-08b, were taken with ACS/WFC using F814W and F475W filters on 2013 January 6. The closest resolvable source is 2.830 ACS/WFC pixels, or away from the defined position. The local population density, which is resolved down to an F435W magnitude of 26.6, suggests there is a 57.1% chance of coincidence at such a separation. Additionally, we note there is a source visible around the area in the F475W image, but it is too faint to determine the PSF and hence perform photometry or accurate astrometry. The location of M31N 2009-08b is shown in Figure 6 (middle left).
-
16.
M31N 2009-08d. The HST images used to locate position of the quiescent M31N 2009-08d were taken with ACS/WFC using an F435W filter on 2004 January 23. The closest resolvable source is 3.236 ACS/WFC pixels, or away from the defined HST position. The local population density, which is resolved down to an F435W magnitude of 25.9, suggests there is a 62.7% chance of coincidence at such a separation. There is also a very faint source about away from the defined position, but it is too faint to determine a PSF. The location of M31N 2009-08d is shown in Figure 6 (middle right).
-
17.
M31N 2009-10b. Nova M31N 2009-08d had coincident HST images taken with ACS/WFC using an F435W filter on 2009 August 25. There is no resolvable source within of the calculated position, with the closest source being 1.803 ACS/WFC pixels, or away from the defined position. The local population density suggests there is a 29.1% chance of coincidence at such a separation. The data had an F435W limiting magnitude of 26.7. The location of M31N 2009-10b in quiescence is shown in Figure 6 (bottom left). It is clear from the post-eruption F475W HST images taken on 2010 December 26 (see Section 6) that neither of the sources shown in the figure are the quiescent nova system.
-
18.
M31N 2009-10c. The HST images used to locate the position of the quiescent M31N 2009-10c were taken with ACS/WFC using an F435W filter on 2004 January 23. There is one resolvable source within of the calculated position. The source is 2.128 ACS/WFC pixels, or away from the defined position and the local population density, which is resolved down to an F435W magnitude of 25.9, suggests there is a 28.7% chance of coincidence at such a separation. The location of this system is shown in Figure 6 (bottom right). It is clear from the post-eruption F475W HST images taken on 2010 December 22 (see Section 6) that the source listed above is not the quiescent nova.
-
19.
M31N 2009-11a. HST images, coincident with the position of M31N 2009-11a, were taken with ACS/WFC using F814W and F555W filters on 2004 August 15. There are no resolvable sources within of the calculated position, with the closest resolvable source being 3.999 ACS/WFC pixels, or away from the defined position. The local population density, which is resolved to an F814W magnitude of 26.5, suggests there is a 68.3% chance of coincidence at such a separation. The location of this system is shown in Figure 8 (top left).
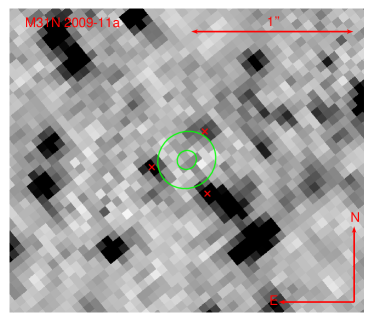
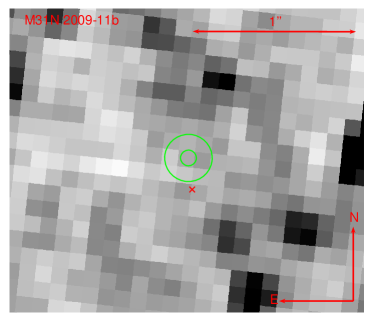
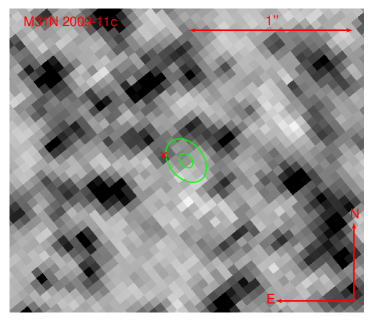
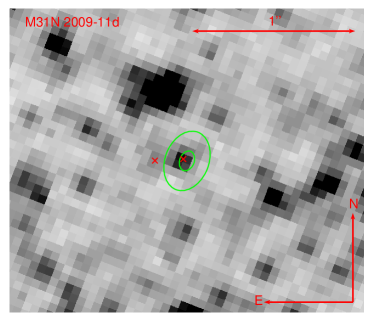
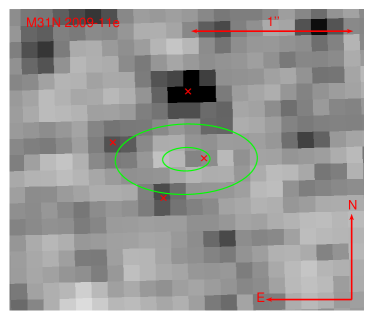
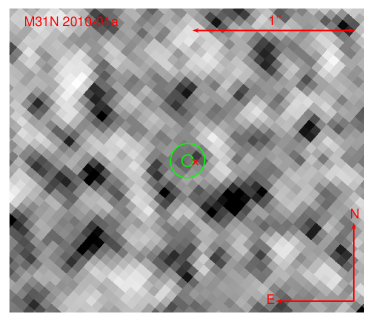
Figure 8.— As Figure 3. Top left: ACS/WFC F555W image, M31N 2009-11a eruption position determined from LT -band data. Top right: WFPC2 F555W image, M31N 2009-11b eruption position determined from LT -band data. Middle left: ACS/WFC F555W image, M31N 2009-11c eruption position determined from LT -band data. Middle right: ACS/WFC F475W image, M31N 2009-11d eruption position determined from LT -band data. Bottom left: WFPC2 F555W image, M31N 2009-11e eruption position determined from LT -band data. Bottom right: ACS/WFC F435W image, M31N 2010-01a eruption position determined from LT -band data. (A color version of this figure is available in the online journal.) -
20.
M31N 2009-11b. Nova M31N 2009-11b is thought to be recurrent, with previous eruptions having occurred in 1997 and 2001 (Shafter et al. in preparation). The location of M31N 2009-11b was observed by HST with WFPC2 using F814W and F555W filters on 2004 August 22. There are no resolvable sources within of the calculated position, with the closest resolvable source being 1.971 WFPC2 pixels, or away from the defined position. The local population density suggests there is a 38.6% probability of an object alignment this close occurring by chance, although the limiting F814W magnitude is only 23.8. If we were looking at a typical ACS/WFC image of M31, we would expect an object at a distance of to have approximately an 81% chance of being aligned by chance. The location of M31N 2009-11b in the WFPC2 image is shown in Figure 8 (top right).
-
21.
M31N 2009-11c. The HST images used to locate M31N 2009-11c in quiescence were taken with ACS/WFC using F814W and F555W filters on 2004 August 22. There are no resolvable sources within of the calculated position. The closest resolvable source is 2.975 ACS/WFC pixels, or away from the defined position, with the local population density, which is resolved to an F814W magnitude of 25.8, suggesting there is a 55.0% chance of coincidence at such a separation. The location of this system is shown in Figure 8 (middle left). It is clear from the post-eruption F475W HST images taken on 2010 July 23 (see Section 6) that the source listed above is not the nova.
-
22.
M31N 2009-11d. Nova M31N 2009-11d had coincident HST images taken with ACS/WFC using F475W and F814W filters on 2011 December 22. There is a resolvable source within of the calculated position and no other source within . The source is 0.505 ACS/WFC pixels, or away from the defined position. The local population density suggests there is only a 2.2% chance of an object alignment this close occurring by chance. The data has an F814W limiting magnitude of 26.4. On 2011 December 22, the source had an F814W magnitude of and F475W magnitude of . This gives a -band magnitude of , -band magnitude of and (B-I) color of . From Darnley (2005) we can see that a nova at the apparent position of M31N 2009-11d would be subject to -band extinction of if it were at the far side of the galaxy. This gives a B-band magnitude of , I-band magnitude of and () color of when the effects of internal extinction are included. M31N 2009-11d is shown in quiescence in Figure 8 (middle right).
-
23.
M31N 2009-11e. The location of M31N 2009-11e was observed by HST with WFPC2 using F814W and F555W filters on 1996 February 14. There is a resolvable source within of the calculated position and no other source within . The source is 1.104 WFPC2 pixels, or away from the defined position. The local population density, which is only resolvable to an F814W magnitude of 22.8, suggests there is a 9.9% chance of an object alignment this close occurring by chance. If a standard ACS/WFC image of the M31 field had been available, we would predict an object to be at least from a random point in the image approximately 33% of the time. The location of this system is shown in Figure 8 (bottom left). It is clear from the post-eruption F475W HST images taken on 2010 December 25 (see Section 6) that the source listed above is not the nova.
-
24.
M31N 2010-01a. The HST images used to locate the quiescent nova M31N 2010-01a were taken with ACS/WFC using an F435W filter on 2006 February 10. There is a resolvable source within of the calculated position and no other source within . The source is 1.058 ACS/WFC pixels, or away from the defined position. The local stellar density, which is resolved down to an F435W magnitude of 26.1, suggests there is a 9.4% chance of an object alignment this close occurring by chance. The source had an F435W magnitude of , but the HST images were only taken in one filter, so we were unable to calculate the color of the source, although we estimate it to have had a B-band magnitude of with internal extinction in M31 taking in to . The location of this nova is shown in Figure 8 (bottom right). M31N 2010-01a was also observed in eruption with ACS/WFC on 2010 July 21, which is described in Section 6. Using this post-eruption HST data, we were able to determine the position of the progenitor without using LT data. Here we used the same method as previously described, but used the photometrically determined positions for the transformations. The closest resolvable source is 0.641 ACS/WFC pixels, or 2.65 away from the defined position of the nova, with a 3.8% probability of a chance alignment at this separation. As previously noted, due to the small errors associated with the transformation and the source being relatively faint, the errors on the position of the pre-eruption source may be more significant than in the regular transformations using LT data. The position of the quiescent nova, as determined from the post-eruption HST data, is shown in Figure 9. Later in 2010 there was a nova eruption (M31N 2010-12c) very close to the position of M31N 2010-01a, however the precise positions reveal that they are not the same system (Hornoch et al., 2010b; Shafter et al. in preparation).
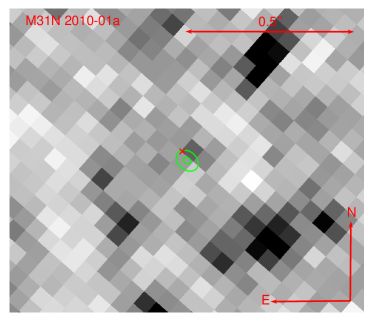
Figure 9.— As Figure 3. ACS/WFC F435W FLT image with M31N 2010-01a eruption position determined from post-eruption F475W data. (A color version of this figure is available in the online journal.) -
25.
M31N 2010-05a. The location of M31N 2010-05a was observed by HST with ACS/WFC using an F435W filter on 2004 January 23. There is one resolvable source within of the calculated position. This source is 1.939 ACS/WFC pixels, or away from the defined position. The local population density suggests there is a 36.9% probability of an object alignment this close occurring by chance. The data have a limiting F435W magnitude of 25.8. The location of this nova is shown in Figure 10 (top left).
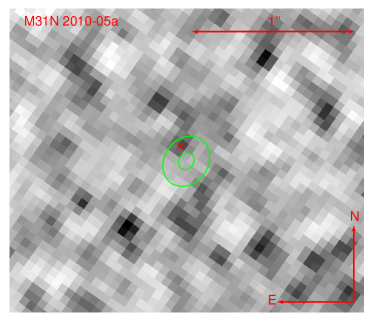

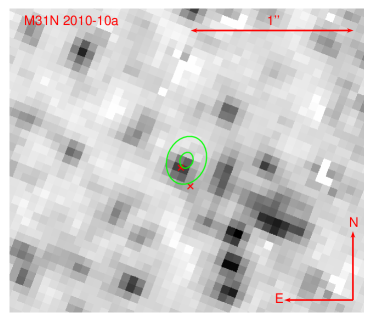
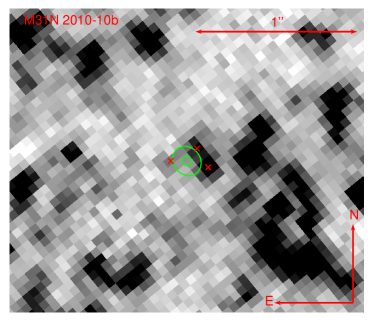
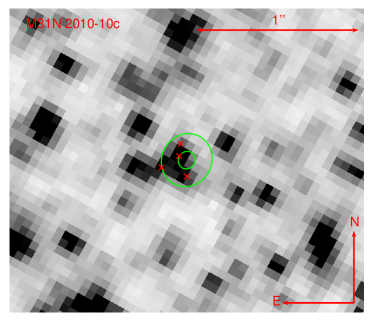
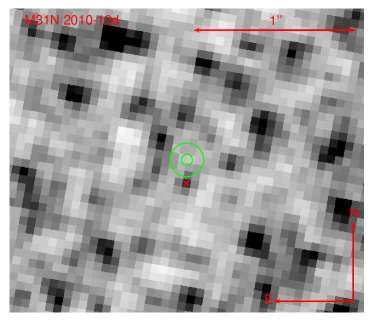
Figure 10.— As Figure 3. Top left: ACS/WFC F435W image, M31N 2010-05a eruption position determined from LT -band data. Top right: ACS/WFC F475W image, M31N 2010-09b eruption position determined from LT -band data. Middle left: ACS/WFC F475W image, M31N 2010-10a eruption position determined from LT -band data. Middle right: ACS/WFC F555W image, M31N 2010-10b eruption position determined from LT -band data. Bottom left: ACS/WFC F606W image, M31N 2010-10c eruption position determined from LT -band data. Bottom right: ACS/WFC F435W image, M31N 2010-10d eruption position determined from LT -band data. (A color version of this figure is available in the online journal.) -
26.
M31N 2010-09b. The HST images used to locate M31N 2010-09b in quiescence were taken with ACS/WFC using F814W and F475W filters on 2011 December 9. There is a resolvable source within of the calculated position and another resolvable source within . The closest source is 0.579 ACS/WFC pixels, or away from the defined position. The local stellar density, which is resolvable down to an F814W magnitude of 26.3, suggests there is a chance of coincidence at such a separation. This source had an F814W magnitude of and F475W magnitude of . This gives a -band magnitude of , -band magnitude of and () color of . We can see from Darnley (2005) that a nova at the apparent position of M31N 2010-09b would be subject to -band extinction of if it were at the far side of the galaxy. Therefore we calculated an unextinguished B-band magnitude of and I-band magnitude of , and a de-reddened () color of . The other source is 2.264 ACS/WFC pixels, or away from the defined position. The local population density suggests there is a chance of a resolvable source being within this distance of a random object in the image. The location of M31N 2010-09b is shown in Figure 10 (top right).
-
27.
M31N 2010-10a. HST observed the location of M31N 2010-10a with ACS/WFC using F475W and F814W filters on 2012 December 15. Although the HST data were taken more than two years post-eruption, the nova has a maximum -band of only days (see Section 6), so will have faded back to quiescence. There is a resolvable source just outside 1 of the calculated position and no other resolvable source within 3. The source is 1.181 ACS/WFC pixels, or 1.20 away from the defined position. The local population density suggests there is a chance of coincidence at such a separation. The location around this nova system is shown in Figure 10 (middle left).
-
28.
M31N 2010-10b. The HST images used to locate the position of the quiescent M31N 2010-10b were taken with ACS/WFC using F555W and F814W filters on 2004 August 14. There are no resolvable sources within 3 of the calculated position, the closest resolvable source being 1.968 ACS/WFC pixels, or away from the defined position. The local population density suggests there is a 33.4% probability of such an alignment occurring by chance. The location of M31N 2010-10b is shown in Figure 10 (middle right).
-
29.
M31N 2010-10c. The location of M31N 2010-10c was observed by HST with ACS/WFC using F606W and F435W filters on 2005 July 22. There are three resolvable sources within of the calculated position and another resolvable source within . The closest resolvable source is 1.083 ACS/WFC pixels, or away from the defined position. The local population density, which is resolvable down to an F606W magnitude of 27.1, suggests there is a probability of such an alignment occurring by chance. The second closest resolvable source is 1.988 ACS/WFC pixels, or away from the defined position. The local population density suggests there is a probability of chance alignment and the third closest source is 2.084 ACS/WFC pixels, or away from the defined position, with a probability of chance alignment. The fourth closest resolvable source is 3.405 ACS/WFC pixels, or away from the defined position, with a probability of chance alignment. The location of M31N 2010-10c, with the four closest progenitor candidates, is shown in Figure 10 (bottom left).
-
30.
M31N 2010-10d. The HST images used to locate M31N 2010-10d in quiescence were taken with ACS/WFC using an F435W filter on 2004 June 14. There are no resolvable sources within of the calculated position, with the closest resolvable source being 2.992 ACS/WFC pixels, or away from the defined position. The local population density, which is resolved down to an F435W magnitude of 26.3, suggests that the coincidence probability at this separation is . The location of this system is shown in Figure 10 (bottom right). It can clearly be seen from the HST data taken during eruption (see Section 6) that the above source is not the progenitor of M31N 2010-10d.
-
31.
M31N 2010-10e. Nova M31N 2010-10e has been suggested as another eruption of M31N 1963-09c (Pietsch et al., 2010a; Shafter et al., 2010a; Shafter et al. in preparation). The HST images were taken with ACS/WFC using F814W and F555W filters on 2004 August 17. There is a resolvable source within of the calculated position, one within and another within . The closest resolvable source is 1.216 ACS/WFC pixels, or away from the defined position. The local population density suggests there is a 15.6% probability of such an alignment occurring by chance. The next closest source is 1.859 ACS/WFC pixels, or away from the defined position, with a 34.4% probability of chance alignment. The third closest source is 4.310 ACS/WFC pixels, or away from the defined position, with a 92.3% probability of chance alignment. The HST data are resolvable down to an F814W magnitude of 25.9. The position of M31N 2010-10e is shown in Figure 11 (top left). The relatively large errors on the position of the quiescent nova were caused by the nova being very faint in the LT images. This is simply because M31N 2010-10e was a fast nova and the first LT images were taken several days after discovery.
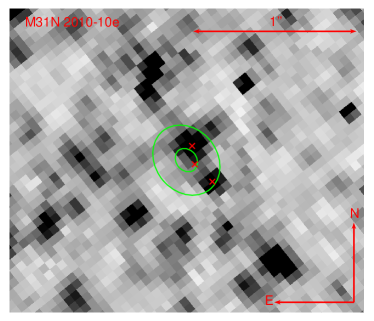
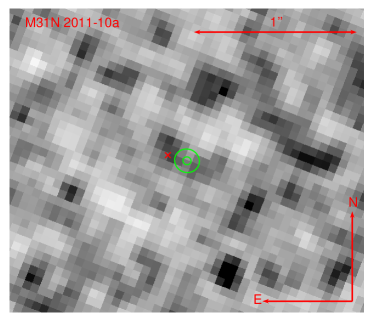
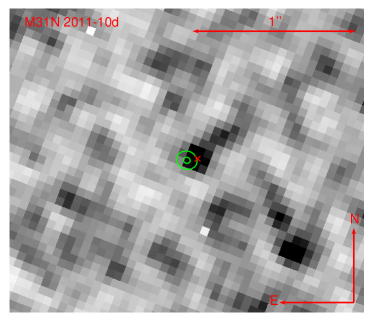
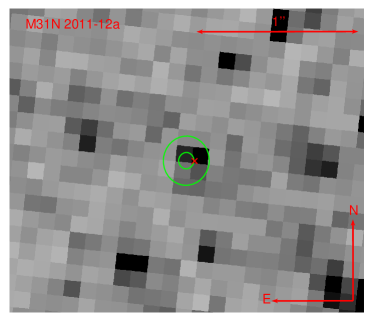
Figure 11.— As Figure 3. Top left: ACS/WFC F555W image, M31N 2010-10e eruption position determined from LT -band data. Top right: ACS/WFC F475W image, M31N 2011-10a eruption position determined from LT -band data. Bottom left: ACS/WFC F475W image, M31N 2011-10d eruption position determined from LT -band data. Bottom right: WFPC2 F555W image, M31N 2011-12a eruption position determined from LT -band data. (A color version of this figure is available in the online journal.) -
32.
M31N 2011-10a. The HST images used to locate the quiescent nova M31N 2011-10a were taken with ACS/WFC using F814W and F475W filters on 2010 December 14. There are no resolvable sources within of the calculated position and the closest resolvable source in the F475W image is 2.540 ACS/WFC pixels, or away from the defined position. The source was not detected in the F814W filter due to problems with the photometry, leading to a magnitude limit of 22.6, whereas the F475W magnitude limit was 26.1. The local population density suggests that the coincidence probability at this separation is 46.8%. The location around this nova system is shown in Figure 11 (top right).
-
33.
M31N 2011-10d. The location of nova M31N 2011-10d was observed by HST with ACS/WFC using F814W and F475W filters on 2010 December 14. There are no resolvable sources within of the calculated position, with the closest resolvable source bring 1.400 ACS/WFC pixels, or away from the defined position. The local population density, which has an F435W limiting magnitude of 26.1, suggests there is a 16.4% probability of such an alignment occurring by chance. The images have an F475W limiting magnitude of 26.1, although as with M31N 2011-10a, the F814W limiting magnitude is only 22.6. The location of the quiescent system is shown in Figure 11 (bottom left).
-
34.
M31N 2011-12a. We located the position of the M31N 2011-12a system using HST images taken with WFPC2 using F814W and F555W filters on 2004 August 14. There is a resolvable source within of the calculated position and no other resolvable source within . The source is 1.129 WFPC2 pixels, or away from the defined position. The local population density, which is resolved down to an F814W magnitude of 24.2, suggests there is a 3.6% probability of such an alignment occurring by chance. The source had an F814W magnitude of and an F555W magnitude of . This gives a -band magnitude of and a -band magnitude of , with color . However, from the overall distribution of stars in the M31 field in a typical ACS/WFC image, we would expect a source to be at least as close as in a typical ACS/WFC image about 35% of the time. Therefore such a detection in ACS/WFC would be relatively insignificant. For this reason we do not include it in the list of systems with a high likelihood of a recovered progenitor. The location of M31N 2011-12a is shown in Figure 11 (bottom right).
-
35.
M31N 2012-01a. The HST images used to locate M31N 2012-01a in quiescence were taken with ACS/WFC using F814W and F555W filters on 2011 February 16 and there is one resolvable source within of the calculated HST position. The source is 1.712 ACS/WFC pixels, or away from the defined position. The local population density suggests there is a 22.0% probability of such an alignment occurring by chance. Figure 2 shows the nova in the combined LT image taken during eruption and how the coincident HST field overlaps its position. The data in the vicinity of this system is shown in Figure 12 (top left).
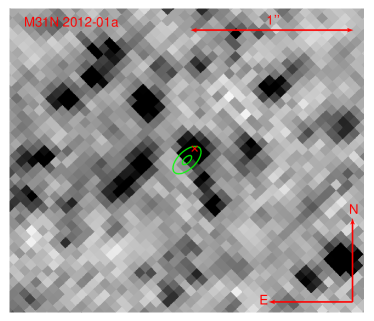
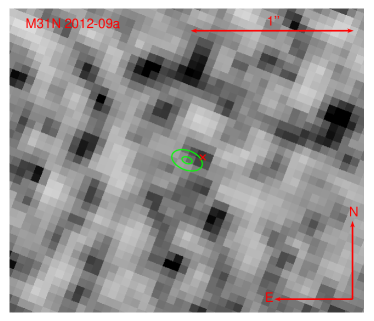
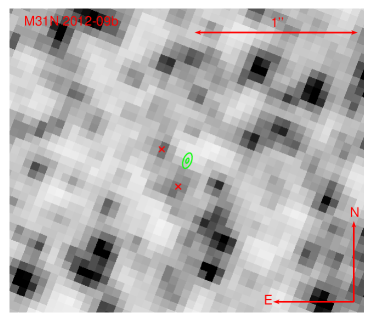
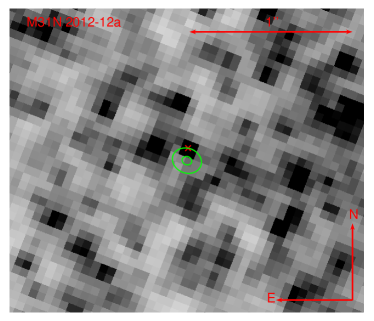
Figure 12.— As Figure 3. Top left: ACS/WFC F555W image, M31N 2012-01a eruption position determined from LT -band data. Top right: ACS/WFC F814W image, M31N 2012-09a eruption position determined from LT -band data. Bottom left: ACS/WFC F814W image, M31N 2012-09b eruption position determined from LT -band data. Bottom right: ACS/WFC F814W image, M31N 2012-12a eruption position determined from LT -band data. (A color version of this figure is available in the online journal.) -
36.
M31N 2012-09a. Nova M31N 2012-09a is a recurrent candidate, with the first observed eruption being M31N 1984-07a (Pietsch et al., 2007b; Shafter et al., 2012c). The HST images were taken with ACS/WFC using F814W and F475W filters on 2010 December 20 and 24. There are no resolvable sources within of the calculated position, with the closest resolvable source being 2.152 ACS/WFC pixels, or away from the defined position. The local population density suggests that the coincidence probability at this separation is 32.8%. The F475 limiting magnitude of this data is 25.8, with that of F814W being 22.2. The location around this nova system is shown in Figure 12 (top right).
-
37.
M31N 2012-09b. We located the expected position of the quiescent nova M31N 2012-09b using HST images taken with ACS/WFC using F814W and F475W filters on 2010 December 20. There are no resolvable sources within of the calculated position. The closest resolvable source is 3.659 ACS/WFC pixels, or away from the defined position. The local population density, which is resolvable down to an F814W magnitude of 24.6, suggests there is a probability of such a distant alignment occurring by chance. The F814W limiting magnitude was 24.6, although that of F475W was 26.0 and there were no sources closer to the position of the nova in this filter. The position of this nova is shown in Figure 12 (bottom left).
-
38.
M31N 2012-12a. The HST images used to find the position of M31N 2012-12a in quiescence were taken with ACS/WFC using F814W and F475W filters on 2010 December 14. There is a resolvable source at of the calculated position. The source is 1.532 ACS/WFC pixels or away from the defined position, with the local population density suggesting that the coincidence probability at this separation is 19.9%. The F475W limiting magnitude is 25.6 and the F814W limiting magnitude is 22.3. The location of M31N 2012-12a is shown in Figure 12 (bottom right).
6. Light curves
In this section we present additional, previously unpublished, photometry following the eruptions of twelve M31 novae taken or retrieved in the course of this survey. This includes data from the LT and serendipitous HST data.
-
1.
M31N 2007-02b. Nova M31N 2007-02b had WFPC2 F555W data taken on 2454356 HJD. The nova had an F555W magnitude of at that time. This was added to the light curve published by Shafter et al. (2011e) and is shown in Figure 13 (top left).
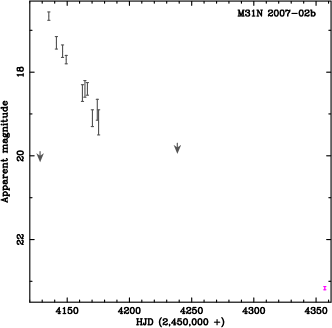
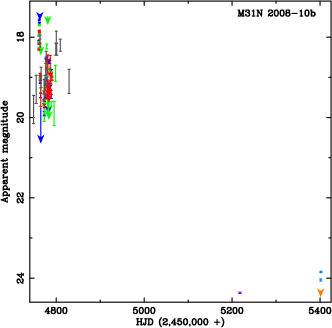
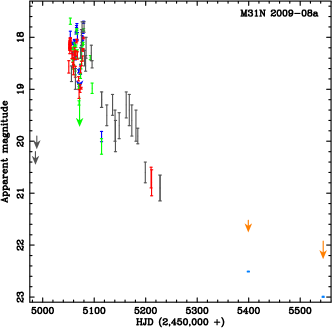
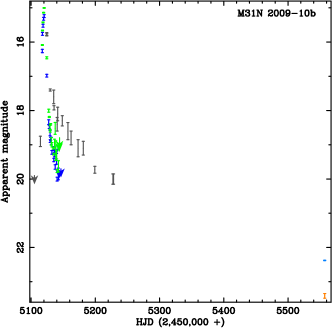
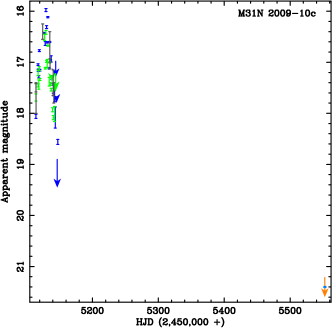
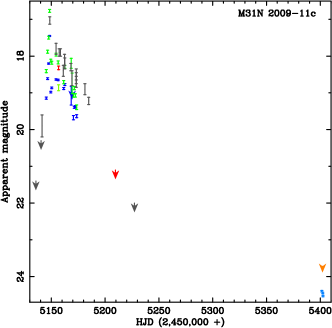
Figure 13.— Nova light curves (with 2009 and earlier eruptions being first published in Shafter et al., 2011e), with the following colors representing different bandpasses: , royal blue; , green; , dark gray; , red. We have extended these light curves using archival HST data where available. Top left: M31N 2007-02b, magenta point is F555W filter. Top right: M31N 2008-10b, purple point is F435W filter, light blue point is F475W filter, orange arrow is F814W filter. Middle left: M31N 2009-08a, blue points are F475W filter. Middle right: M31N 2009-10b. Bottom left: M31N 2009-10c, blue point is F475W filter. Bottom right: M31N 2009-11c, blue points are F475W filter, orange arrow is F814W filter. (A color version of this figure is available in the online journal.) -
2.
M31N 2008-10b. Nova M31N 2008-10b had ACS/WFC F435W data taken on 2455217 HJD, when the nova had a magnitude of . The system also had ACS/WFC data taken on 2455401 and 2455402 with F475W and F814W filters. On 2455401 the nova had an F475W magnitude of and on 2455402 it had an F475W magnitude of . The nova was not resolvable in the F814W images, but for reference we added an upper limit for the magnitude, derived simply by measuring the magnitude of a relatively faint nearby star, clearly much brighter than the nova. This produced an F814W upper limit of on 2455402. The points were added to the light curve published by Shafter et al. (2011e) and are shown in Figure 13 (top right). As noted in Section 5, it is clear from the F435W eruption image taken on 2010 January 21 that the candidate shown in Figure 4 (bottom right) is not the progenitor of this nova system.
-
3.
M31N 2009-08a. Nova M31N 2009-08a had ACS/WFC F475W and F814W data taken on 2455399 and 2455544 HJD. On 2455399 the system had an F475W magnitude of and on 2455544 it had an F474W magnitude of . The nova was not resolvable in the F814W images on either of these dates, in the first dataset we derived an upper limit of , with an upper limit of in the later set of images. These data points were added to the light curve published by Shafter et al. (2011e) and the extended light curve is shown in Figure 13 (middle left). These data were also used to help locate the progenitor candidate (see Section 5).
-
4.
M31N 2009-10b. Nova M31N 2009-10b had ACS/WFC F475W and F814W data taken on 2455557 HJD. At this time the nova had an F475W magnitude of and F814W magnitude of . These points were added to the light curve published by Shafter et al. (2011e) and are shown in Figure 13 (middle right). These data were also used to rule out some nearby sources as progenitor candidates (see Section 5).
-
5.
M31N 2009-10c. Nova M31N 2009-10c had one set of ACS/WFC F475W and F814W data taken on 2455552 HJD and another on 2455555. In the latter set of images the system had an F475W magnitude of . In the images taken on 2455552, the nova had an F475W magnitude of . There is a source in the F814W image that has a magnitude of , but we cannot be certain that this is the nova itself, so it is considered as an upper limit. The points were added to the light curve published by Shafter et al. (2011e) and are shown in Figure 13 (bottom left). Note that of the two F475W measurements, only the one taken on 2455552 is shown. This is due to the close proximity in the time of the two measurements and the much lower error on the slightly earlier measurement. These data were also used to rule out a nearby source as progenitor candidate for this nova (see Section 5).
-
6.
M31N 2009-11c. Nova M31N 2009-11c had ACS/WFC F475W and F814W images taken on 2455401 and 2455402 HJD. On 2455401, the nova had an F475W magnitude of . It had an F475W magnitude of on 2455402.3 and on 2455402.6. There is a nearby candidate with an F814W magnitude of on 2455401, but we cannot be certain this is the nova, so it is considered as an upper limit. These points were added to the light curve published by Shafter et al. (2011e) and are shown in Figure 13 (bottom right). These HST data taken during eruption were also used to rule out a nearby source as progenitor candidate (see Section 5).
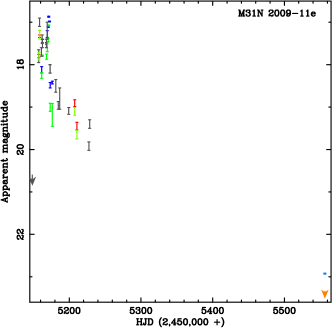

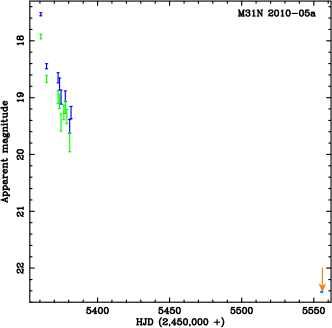


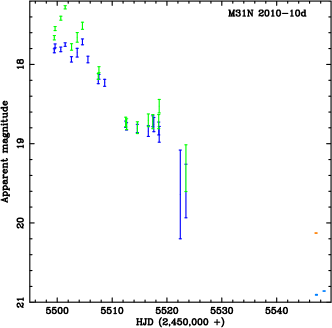
Figure 14.— Nova light curves with archival HST data as in Figure 13. Top left: M31N 2009-11e, light curve published by Shafter et al. (2011e) extended with HST points, blue point is F475W filter, orange arrow is F814W filter. Top right: M31N 2010-01a from LT data extended with HST points, light blue points are F475W filter, orange arrows are F814W filter. Middle left: M31N 2010-05a from LT data extended with HST points, light blue point is F475W filter, orange arrow is F814W filter. Middle right: M31N 2010-09b from LT data. Bottom left: M31N 2010-10a from LT data. Bottom right: M31N 2010-10d from LT data extended with HST points, light blue point is F475W filter, orange point in F814W filter. (A color version of this figure is available in the online journal.) -
7.
M31N 2009-11e. Nova M31N 2009-11e had ACS/WFC F475W and F814W data taken on 2455556 HJD. At this time the nova had an F475W magnitude of , but was not visible in the F814W image. For reference we have added the magnitude of a nearby faint (but clearly brighter than the nova) star as an upper limit. The points were added to the light curve published by Shafter et al. (2011e) and shown in Figure 14 (top left). These data were also used to rule out a nearby source as progenitor candidate (see Section 5).
-
8.
M31N 2010-01a. Nova M31N 2010-01a was observed by the LT on 2455210.36 and 2455212.39 HJD with B and V filters. The observations taken on January 13.86 appear to be close to the optical maximum. The object increased its -band brightness between 2455208.59 and 2455209.59 (Burwitz et al., 2010) and our observations show that the nova had started to fade by 2455212.39. In Addition to the LT photometry, the system was observed with ACS/WFC on 212455399 and 2455544 with F475W and F814W filters. On 2455399 the nova had an F475W magnitude of and F814W upper limit of . On 2455544 it had F475W magnitude of and an F814W upper limit of . The F814W photometry listed above are likely to be the nova itself, however as we do not have any quiescent F814W data and we cannot be certain we are seeing the nova, we list them as upper limits. The light curve showing the LT and HST data points is shown in Figure 14 (top right). From the above, we know that the nova must have reached maximum between 2455208.59 and 2455210.36. Therefore to calculate the upper limits we linearly extrapolate the measurements taken on 2455208.59 and 2455209.59 to compute the expected brightness at 2455210.36. We then linearly extrapolate between the two LT measurements. This gives a and lower limits of 7 and 5 days respectively. To calculate the upper limit we extrapolate between the second LT points and the first HST point, taking the first LT point as the maximum. This gives a and upper limits of 49 and 40 days respectively. This approach yields mean and values of days and days respectively. The large errors are unsurprising given the lack of data. The HST data taken during eruption were also used to help locate the progenitor candidate (see Section 5).
-
9.
M31N 2010-05a. Nova M31N 2010-05a was observed by the LT in and filters multiple times between 2455360.65 and 2455381.62 HJD. In our data, the nova was at its brightest in both the - and -bands on 2455360.65, when it had a magnitude of in -band and in -band. The nova brightened in the R-band between 2455344.55 and 2455351.28 (Hornoch et al., 2010d; Nishiyama & Kabashima, 2010) and then appeared to remain near the maximum for several days (see Hornoch et al., 2010a, e). The LT observations appear to start just as the nova began to fade. The system was also observed with ACS/WFC in F475W and F814W filters between 2455555.38 and 2455556.11. At this time the nova had an F475W magnitude of . Although the nova was not resolvable in the F814W image, we have added an upper limit of for reference. This was calculated from a nearby faint star that was clearly brighter than the nova. A light curve of the LT and HST points is shown in Figure 14 (middle left). As the nova appears to stay near maximum for a few days, we cannot calculate directly. We also note that there is a significant gap between the end of the LT observations and the time of the HST observations. To calculate the lower limit we assume that the first LT observations were at maximum and then linearly extrapolate the LT points (excluding the first two measurements) until is reached. This gives a and lower limit of 22 and 23 days respectively. For the upper limit we assume that the nova was at peak (and the same magnitude as the first LT measurements) when it first appeared to plateau on 2455351.28. We then extrapolate between the final LT point and the F475W HST point. This gives a and upper limit of 56 and 50 days respectively. Therefore producing a -band estimate of days and a -band estimate of days.
-
10.
M31N 2010-09b. Nova M31N 2010-09b was observed by the LT in B and V filters between 2455470.63 and 2455487.64 HJD. In these data, the nova was at its brightest in both and filters in the images taken on 2455470.63, when it had a -band magnitude of and -band magnitude of . The nova brightened significantly in the -band between 2455469.91 and 2455470.68 (Pietsch et al., 2010b). Our observations also constrain that the nova must have faded significantly by 2455471.60. Therefore it appears that the LT started observing the nova when it was at, or very close to, maximum brightness. A light curve of the LT points is shown in Figure 14 (middle right). Assuming the first set of observations were indeed taken at maximum, a -band of days and a -band of days were derived.
-
11.
M31N 2010-10a. Nova M31N 2010-09b was observed by the LT between 2455478.72 and 2455507.51 HJD with B and V filters. The light curve for this nova is shown in Figure 14 (bottom left). The nova brightened in the R-band between 2455475.05 and 2455476.04 (Nishiyama et al., 2010). The LT images show that the nova fades in both B and V bands between 2455478.72 and 2455479.56. Therefore it is likely that the nova reached peak between 2455475.05 and 2455478.72. As the peak may have been missed we cannot calculate an accurate . However by calculating how long it takes the nova to fade by two magnitudes from the first LT observation we can calculate an upper limit on , which for -band is days and for -band a maximum of days. From the R-band observations Cao et al. (2012) constrained the decline time to days.
-
12.
M31N 2010-10d. Nova M31N 2010-10d was observed by the LT in and filters regularly between 2455499.47 and 2455523.45 MJD. It is unclear from the LT data when maximum light was reached in the -band and there appear to be two clear peaks in the -band. Similarly, it is also unclear from the light curve presented in Cao et al. (2012) when the peak brightness is reached. The nova was observed through the HST ACS/WFC F475W and F814W filters on 2455547 and 2455548. On 2455547 the nova had an F475W magnitude of and an F814W magnitude of . On 2455548 it had an F475W magnitude of . A light curve of the LT and HST points is shown in Figure 14 (bottom right). From the -band maximum (i.e. the first peak) we calculate a of days. As the -band LT data do not cover the nova fading by two magnitudes, we need to extrapolate to the first F475W data point. If we take the -band point that corresponds to the -band maximum we calculate a of days. If we take the point of the highest -band flux as the maximum we calculate a of days. These are the upper and lower limits respectively, which gives a -band of days. As noted in Section 5, the HST data taken during eruption were also used to rule out a nearby source as progenitor candidate.
7. Discussion
Eleven nova systems ( of the original catalog of 38 novae) are positionally aligned with a resolved point source in archival HST data, with the probability of such a close alignment occurring by chance being in each case. The novae with candidate progenitor systems are M31N 2007-02b, -10a, -11b, -11d, -11e, -12a, -12b, 2009-08a, -11d, 2010-01a and -09b (the progenitor system of M31N 2007-12b had already been identified by Bode et al., 2009). The photometry of these eleven candidate progenitor systems is summarised in Tables 4 and 5.
| Nova | Broadband Photometry | |||||
|---|---|---|---|---|---|---|
| F435W | F475W | F555W | F606W | F625W | F814W | |
| M31N 2007-02b | ||||||
| M31N 2007-10a | ||||||
| M31N 2007-11b | ||||||
| M31N 2007-11d | ||||||
| M31N 2007-11e | ||||||
| M31N 2007-12a | ||||||
| M31N 2007-12b | ||||||
| M31N 2009-08a | ||||||
| M31N 2009-11d | ||||||
| M31N 2010-01a | ||||||
| M31N 2010-09b | ||||||
| Nova | Broadband Photometry | color | ||||
|---|---|---|---|---|---|---|
| M31N 2007-02b | ||||||
| M31N 2007-10a | ||||||
| M31N 2007-11b | ||||||
| M31N 2007-11d | ||||||
| M31N 2007-11e | ||||||
| M31N 2007-12a | ||||||
| M31N 2007-12b | ||||||
| M31N 2009-08a | ||||||
| M31N 2009-11d | ||||||
| M31N 2010-01a | ||||||
| M31N 2010-09b | ||||||
The only confirmed RG-novae in our Galaxy are RS Oph (Anupama & Mikołajewska, 1999), T Coronae Borealis (Kenyon & Fernandez-Castro, 1987), V3890 Sagittarii and V745 Scorpii (Harrison et al., 1993), all of which are RNe. Although this is a small percentage of the overall Galactic nova population of almost 400 (Bode, 2010), in many cases the systems have simply not been observed in quiescence. KT Eri is also believed to contain a red giant secondary (Jurdana-Šepić et al., 2012), as are EU Sct and V2487 Ophiuchi (Darnley et al., 2012). This suggests the RG-nova rate in the Galaxy is probably higher than previously believed and there has been no study systematic enough to produce a reliable population estimate.
Eight of the eleven candidate progenitor systems identified by this survey have quiescent photometry in at least two bands. As such, the positions of these systems are plotted in the color–magnitude diagrams shown in Figure 15. Inspection of this figure shows that the majority of progenitor candidates (six of eight) lie on or near the red giant branch. Of course, it should be noted that if we had simply chosen a random sample of resolved stars in HST data of M31 then this would still be the case. The other two candidate progenitor systems (M31N 2007-12a and 2010-09b) both have . The color–magnitude diagram position of these two quiescent systems is consistent with high mass, luminous main-sequence stars. However, as is also indicated in Figure 15, this position is similar to a pair of Galactic RG-novae. These Galactic novae are the suspected recurrent KT Eri, which is also likely to harbor a red giant secondary (Jurdana-Šepić et al., 2012; Darnley et al., 2012) and the recurrent V2487 Oph (Darnley et al., 2012). The particularly blue color of KT Eri and V2487 Oph is likely due to a bright accretion disk inclined towards the observer. This pair of M31 quiescent systems is also coincident with the color–magnitude position of a number of SG-novae or suspected SG-novae. So if we are indeed observing M31N 2007-12a and 2009-11d in quiescence they may be RG-novae with colors affected by a strong accretion disk or they may be luminous quiescent SG-novae similar to the recurrent SG-nova U Scorpii.
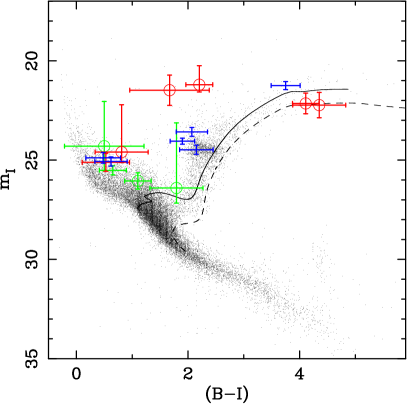
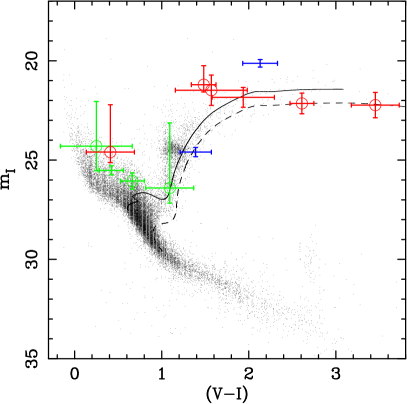
In Figure 16, we show the spatial distribution of the novae in our survey as in Figure 1, but also indicate the eleven systems with candidate progenitor systems. This shows that a much higher proportion of novae in the disk appear to have a recovered progenitor when compared to the systems in the central bulge. Although increased crowding near the center of M31 (rendering any detection less significant) may have some influence on this, it does not seem to be the main factor. Indeed, the relationship between the distance of the nearest source from the nova and the probability of a chance alignment is largely uniform for the regions of M31 studied in this work. This indicates that there may be a higher proportion of RG-novae in younger stellar populations. Although of course the background light is brighter near the center of M31 and this may obscure some faint sources that would have been visible in the outer regions of the galaxy.
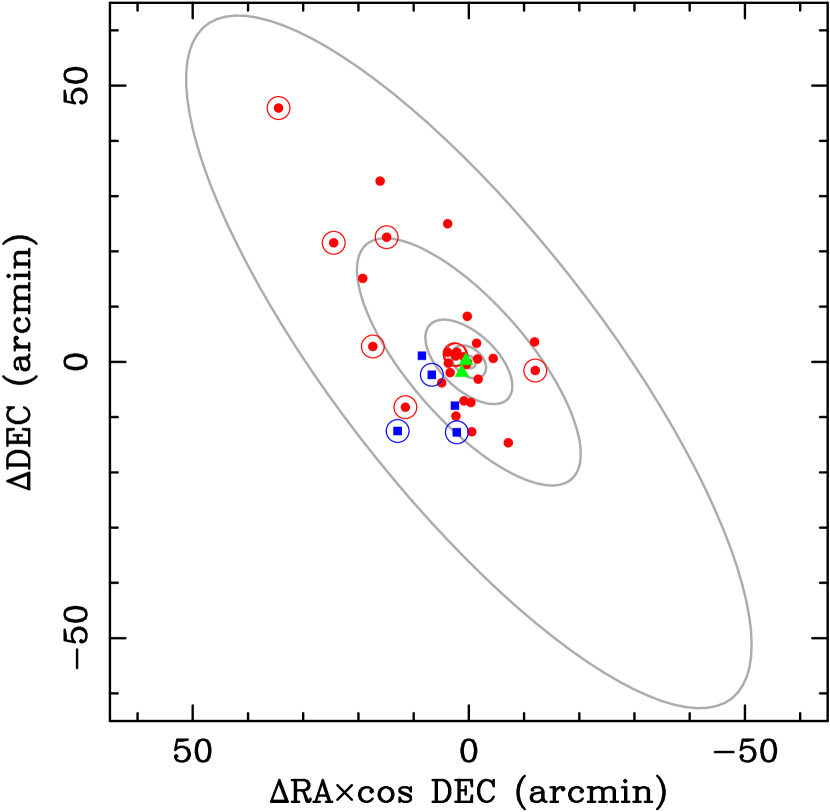
As is noted in Section 5, there are problems with using the WFPC2 data. For example, as can be seen in Section 5, M31N 2011-12a had a progenitor candidate detected that only had 3.6% probability of such an alignment occurring by chance. However, due to the relatively bright limiting magnitude of the WFPC2 data, the same detection in a typical ACS/WFC image would be relatively insignificant. It could also be the case that, for a system where no candidate was detected in WFPC2, if the same region was imaged with ACS/WFC, it may reveal a coincident source.
The most direct method to identify RNe is to find coincident eruptions. However, due to the large population of M31 nova candidates found over the last 100 years (over 900; see Pietsch, 2010, and their online catalog666http://www.mpe.mpg.de/m31novae/opt/m31/index.php) many coincident sources will simply be chance alignments (see Shafter et al., 2013; Shafter et al., in preparation). Therefore the positions we publish here may help eliminate some of the recurrent candidates that are different systems aligned by chance.
There are three RN candidates in our catalog: M31N 2009-11b, 2010-10e and 2012-09a (see also Section 5). It might be expected that these novae would have a higher chance of harboring red giant secondaries, as in our Galaxy half of the ten RNe are RG-novae (see e.g. Darnley et al., 2012). It can be seen in Figure 8 (top right) that there is no resolvable source within of the position of M31N 2009-11b, although the limiting magnitude of the data is 23.8, meaning that we can exclude a luminous red giant system (such as one similar to RS Oph) as the progenitor, but it is possible that the system may contain a fainter red giant or sub-giant secondary. Although M31N 2010-10e does not have a progenitor that we can locate with a high confidence, it can be seen from Figure 11 (top left) that a red giant companion is not completely ruled out for this system. Indeed there is a faint candidate within and a relatively bright source just outside . M31N 2012-09a does not have any sources within of the calculated position, although the limiting magnitudes indicate a lower-luminosity red giant or sub-giant companion may not be resolvable in the data.
We can, however, all but rule out M31N 2006-11a, 2008-10b, 2009-08b, -11a, -11c, -11e and 2010-10b as RG-novae. These seven novae either had no resolved sources within of the eruption position or had post-eruption HST data yielding extremely precise positions. Additionally, the entirety of the red giant branch was resolvable in the HST images associated with these novae.
It is well worth looking in more detail at the possibility or effects of coincidental alignment. As we have already stated, the resolved stellar population in M31 that is available to HST is dominated by red giant stars, the same type of objects that we are looking for. So there is a huge potential background of “false positives”. However, we believe that the Monte Carlo technique employed to compute the probability of each alignment (between eruption position and candidate progenitor) occurring through chance is robust (down to the magnitude limit stated for each nova). Indeed the criterion of probability of chance alignment that we employ is fairly conservative. The purpose of this paper is to present the entire catalog of progenitor systems, whilst we intend to fully explore the statistics of this survey and the uncovered population in a follow-up paper (Williams et al. in preparation). However, it is worth exploring the coincidence probabilities of the population of eleven objects here in more detail. Given our sample of eleven progenitor systems we can simply compute the probability that all eleven are just chance alignments. The probability that all eleven systems align as well as they do by pure chance is . Extending this approach, the probability that exactly ten of these systems are chance alignments, but one is genuine, is . At the other end of the spectrum, the probability that all eleven are genuine and there are no coincidental alignments is 0.76. If we are concerned with results, then we can be confident at beyond the level that, at most, two of the eleven systems are chance alignments, with nine being genuine. At the level, we can still be confident that, at most, five are chance alignments, with the majority, six, being genuine.
There is a vast array of selection effects that influenced the original input catalog, such as the luminosity of each nova, the speed class, the position in M31, the time of year, the availability of ground-based telescopes, the availability of archival HST data, to name just a few. The full effect of these selection effects on this catalog and the significance of this result will be explored in a follow-up paper (Williams et al. in preparation). However, should these 38 nova turn out to be a fairly representative sample, then this result is extremely significant. Just of Galactic novae are known recurrent novae with red giant secondaries, another are RNe with sub-giant secondaries. If we include all Galactic novae with known evolved (non-main-sequence) secondaries then they account for only of Galactic nova population. In M31 we have found that 29% of our original catalog have evolved (most likely red giant) secondaries, or at least 24% and 16% at the 3 and levels respectively. Such a large population of novae with evolved secondaries would have considerable impact, particularly with regards to their potential as a significant SN Ia progenitor channel.
8. Conclusions
In this paper we have presented the results of a survey for the progenitor system of each of a catalog of 38 spectroscopically confirmed novae in M31. The eruption position of each nova was determined using LT data and archival HST data were used to search for the progenitors. Here we summarise the main conclusions.
-
•
We have recovered a resolved, quiescent, progenitor system for eleven of the original 38 novae. For each of these systems the probability of a chance alignment is .
-
•
These systems are M31N 2007-02b, -10a, -11b, -11d, -11e, -12a, -12b, 2009-08a, -11d, 2010-01a and -09b. Photometry of each of these progenitors is consistent with quiescent Galactic RG-novae.
-
•
The archival data also allow us to all but rule out red giant secondaries for seven novae, M31N 2006-11a, 2008-10b, 2009-08b, -11a, -11c, -11e and 2010-10b.
-
•
Although misidentification due to chance alignments is possible, we can be confident at the level that at least nine of the candidate progenitor systems are genuine. At the level this reduces to at least six.
-
•
If the input catalog is representative of the M31 nova population then up to 29%, 24% or 16% of M31 novae contain evolved (most likely red giant) secondaries at the 1, 3, and limits respectively. This is much higher than that found so far in the Milky Way.
Additionally, we have produced several uniquely deep light curves for M31 novae using archival HST data points.
In a follow up to this paper, Williams et al. (in preparation) will examine the statistics of the catalog and of the underlying nova population of M31 as a whole. We will produce an estimate of the RG-nova rate within M31 and explore the effect it has on the case for them being a major channel for producing SNe Ia.
References
- Ansari et al. (2004) Ansari, R., Aurière, M., Baillon, P., et al. 2004, A&A, 421, 509
- Anupama (2008) Anupama, G. C. 2008, in Astronomical Society of the Pacific Conference Series, Vol. 401, RS Ophiuchi (2006) and the Recurrent Nova Phenomenon, ed. A. Evans, M. F. Bode, T. J. O’Brien, & M. J. Darnley (San Francisco, CA:ASP), 31
- Anupama & Mikołajewska (1999) Anupama, G. C., & Mikołajewska, J. 1999, A&A, 344, 177
- Aurière et al. (2001) Aurière, M., Baillon, P., Bouquet, A., et al. 2001, ApJ, 553, L137
- Barsukova et al. (2009) Barsukova, E., Afanasiev, V., Fabrika, S., et al. 2009, The Astronomer’s Telegram (ATel), 2251
- Bode (2010) Bode, M. F. 2010, Astronomische Nachrichten, 331, 160
- Bode et al. (2009) Bode, M. F., Darnley, M. J., Shafter, A. W., et al. 2009, ApJ, 705, 1056
- Burwitz et al. (2010) Burwitz, V., Pietsch, W., Henze, M., et al. 2010, Central Bureau Electronic Telegrams (CBET), 2124, 1
- Cao (2011) Cao, Y. 2011, ATel, 3702
- Cao et al. (2011) Cao, Y., Kasliwal, M. M., & Yaron, O. 2011, ATel, 3701
- Cao et al. (2012) Cao, Y., Kasliwal, M. M., Neill, J. D., et al. 2012, ApJ, 752, 133
- Cardelli et al. (1989) Cardelli, J. A., Clayton, G. C., & Mathis, J. S. 1989, ApJ, 345, 245
- Ciroi et al. (2007) Ciroi, S., Di Mille, F., Rafanelli, P., & Temporin, S. 2007, ATel, 1292
- Darnley (2005) Darnley, M. J. 2005, PhD thesis, Liverpool John Moores University, UK
- Darnley et al. (2012) Darnley, M. J., Ribeiro, V. A. R. M., Bode, M. F., Hounsell, R. A., & Williams, R. P. 2012, ApJ, 746, 61
- Darnley et al. (2011) Darnley, M. J., Ribeiro, V. A. R. M., Bode, M. F., & Munari, U. 2011, A&A, 530, A70
- Darnley et al. (2014) Darnley, M. J., Williams, S. C., Bode, M. F., et al. 2014, A&A, 563, L9
- Darnley et al. (2004) Darnley, M. J., Bode, M. F., Kerins, E., et al. 2004, MNRAS, 353, 571
- Darnley et al. (2006) —. 2006, MNRAS, 369, 257
- Darnley et al. (2008) Darnley, M. J., Hounsell, R. A., & Bode, M. F. 2008, in Astronomical Society of the Pacific Conference Series, Vol. 401, RS Ophiuchi (2006) and the Recurrent Nova Phenomenon, ed. A. Evans, M. F. Bode, T. J. O’Brien, & M. J. Darnley (San Francisco, CA:ASP), 203
- Darnley et al. (2013) Darnley, M. J., Bode, M. F., Harman, D. J., et al. 2013, to appear in Stella Novae: Future and Past Decades, P. A. Woudt & V. A. R. M. Ribeiro (eds), ASPCS, ArXiv e-prints, arXiv:1303.2711
- della Valle & Livio (1996) della Valle, M., & Livio, M. 1996, ApJ, 473, 240
- Di Mille et al. (2009) Di Mille, F., Ciroi, S., Navasardyan, H., et al. 2009, ATel, 2171
- Di Mille et al. (2007) Di Mille, F., Ciroi, S., Rafanelli, P., Navasardyan, H., & Bufano, F. 2007, ATel, 1325
- Di Mille et al. (2010) Di Mille, F., Orio, M., Ciroi, S., et al. 2010, Astronomische Nachrichten, 331, 197
- Dilday et al. (2012) Dilday, B., Howell, D. A., Cenko, S. B., et al. 2012, Science, 337, 942
- Dolphin (2000) Dolphin, A. E. 2000, PASP, 112, 1383
- Dolphin (2009) —. 2009, PASP, 121, 655
- Fabrika et al. (2009) Fabrika, S., Sholukhova, O., Valeev, A., Hornoch, K., & Pietsch, W. 2009, ATel, 2240
- Freedman & Madore (1990) Freedman, W. L., & Madore, B. F. 1990, ApJ, 365, 186
- Gal-Yam & Quimby (2007) Gal-Yam, A., & Quimby, R. 2007, ATel, 1236
- Gaposchkin (1957) Gaposchkin, C. H. P. 1957, The Galactic Novae, ed. C. H. P. Gaposchkin (Amsterdam: North-Holland)
- Hachisu et al. (2000) Hachisu, I., Kato, M., Kato, T., & Matsumoto, K. 2000, ApJ, 528, L97
- Hachisu et al. (2007) Hachisu, I., Kato, M., & Luna, G. J. M. 2007, ApJ, 659, L153
- Haiman et al. (1994) Haiman, Z., Magnier, E., Lewin, W. H. G., et al. 1994, A&A, 286, 725
- Harrison et al. (1993) Harrison, T. E., Johnson, J. J., & Spyromilio, J. 1993, AJ, 105, 320
- Henze et al. (2008) Henze, M., Meusinger, H., & Pietsch, W. 2008, A&A, 477, 67
- Henze et al. (2014) Henze, M., Ness, J.-U., Darnley, M. J., et al. 2014, A&A, 563, L8
- Hornoch et al. (2010a) Hornoch, K., Khan, R., Bird, J., et al. 2010a, CBET, 2319, 1
- Hornoch & Pejcha (2009) Hornoch, K., & Pejcha, O. 2009, CBET, 2061, 5
- Hornoch et al. (2009a) Hornoch, K., Pejcha, O., & Kusnirak, P. 2009a, CBET, 2058, 3
- Hornoch et al. (2009b) Hornoch, K., Pejcha, O., & Wolf, M. 2009b, CBET, 2062, 1
- Hornoch et al. (2009c) Hornoch, K., Pejcha, O., Zasche, P., & Kusnirak, P. 2009c, CBET, 2057, 3
- Hornoch et al. (2010b) Hornoch, K., Prieto, J., Khan, R., & Hornochova, P. 2010b, CBET, 2610, 1
- Hornoch et al. (2010c) Hornoch, K., Prieto, J., Khan, R., et al. 2010c, CBET, 2127, 1
- Hornoch et al. (2010d) Hornoch, K., Wolf, M., Hornochova, P., et al. 2010d, CBET, 2305, 1
- Hornoch et al. (2010e) Hornoch, K., Zasche, P., Hornoch, K., et al. 2010e, CBET, 2341, 2
- Jurdana-Šepić et al. (2012) Jurdana-Šepić, R., Ribeiro, V. A. R. M., Darnley, M. J., Munari, U., & Bode, M. F. 2012, A&A, 537, A34
- Kasliwal (2009) Kasliwal, M. M. 2009, CBET, 2015, 3
- Kasliwal et al. (2011) Kasliwal, M. M., Cenko, S. B., Kulkarni, S. R., et al. 2011, ApJ, 735, 94
- Kasliwal et al. (2009) Kasliwal, M. M., Rau, A., Salvato, M., et al. 2009, ATel, 1886
- Kent (1987) Kent, S. M. 1987, AJ, 94, 306
- Kenyon & Fernandez-Castro (1987) Kenyon, S. J., & Fernandez-Castro, T. 1987, AJ, 93, 938
- Lee et al. (2012) Lee, C.-H., Riffeser, A., Seitz, S., et al. 2012, A&A, 537, A43
- Li et al. (2011) Li, W., Bloom, J. S., Podsiadlowski, P., et al. 2011, Nature, 480, 348
- Magnier et al. (1992) Magnier, E. A., Lewin, W. H. G., van Paradijs, J., et al. 1992, A&AS, 96, 379
- Massey et al. (2006) Massey, P., Olsen, K. A. G., Hodge, P. W., et al. 2006, AJ, 131, 2478
- Newsham et al. (2013) Newsham, G., Starrfield, S., & Timmes, F. 2013, ArXiv e-prints, arXiv:1303.3642
- Nishiyama & Kabashima (2010) Nishiyama, K., & Kabashima, F. 2010, CBET, 2305, 2
- Nishiyama et al. (2010) Nishiyama, K., Kabashima, F., & Yusa, T. 2010, CBET, 2483, 1
- Nugent et al. (2011) Nugent, P. E., Sullivan, M., Cenko, S. B., et al. 2011, Nature, 480, 344
- Osborne et al. (2011) Osborne, J. P., Page, K. L., Beardmore, A. P., et al. 2011, ApJ, 727, 124
- Page et al. (2010) Page, K. L., Osborne, J. P., Evans, P. A., et al. 2010, MNRAS, 401, 121
- Perryman & ESA (1997) Perryman, M. A. C., & ESA, eds. 1997, The HIPPARCOS and TYCHO catalogues. Astrometric and photometric star catalogues derived from the ESA HIPPARCOS Space Astrometry Mission (ESA Special Publication, Vol. 1200; Noordwijk: ESA)
- Pietsch (2010) Pietsch, W. 2010, Astronomische Nachrichten, 331, 187
- Pietsch et al. (2010a) Pietsch, W., Henze, M., Burwitz, V., et al. 2010a, ATel, 3001
- Pietsch et al. (2007a) Pietsch, W., Burwitz, V., Greiner, J., et al. 2007a, ATel, 1009
- Pietsch et al. (2007b) Pietsch, W., Haberl, F., Sala, G., et al. 2007b, A&A, 465, 375
- Pietsch et al. (2010b) Pietsch, W., Lloyd, J., Henze, M., et al. 2010b, ATel, 2896
- Rau (2007) Rau, A. 2007, ATel, 1276
- Rau et al. (2007) Rau, A., Burwitz, V., Cenko, S. B., et al. 2007, ATel, 1242
- Rodríguez-Gil et al. (2009) Rodríguez-Gil, P., Ferrando, R., Rodríguez, D., et al. 2009, ATel, 2166
- Rosino (1973) Rosino, L. 1973, A&AS, 9, 347
- Schaefer (2010) Schaefer, B. E. 2010, ApJS, 187, 275
- Schaefer & Pagnotta (2012) Schaefer, B. E., & Pagnotta, A. 2012, Nature, 481, 164
- Shafter (1997) Shafter, A. W. 1997, ApJ, 487, 226
- Shafter et al. (2011a) Shafter, A. W., Bode, M. F., Darnley, M. J., et al. 2011a, ATel, 3825
- Shafter et al. (2010a) Shafter, A. W., Bode, M. F., Darnley, M. J., Ciardullo, R., & Misselt, K. A. 2010a, ATel, 3006
- Shafter et al. (2011b) Shafter, A. W., Bode, M. F., Darnley, M. J., et al. 2011b, ApJ, 727, 50
- Shafter et al. (2011c) Shafter, A. W., Ciardullo, R., Bode, M. F., & Darnley, M. J. 2011c, ATel, 3699
- Shafter et al. (2010b) Shafter, A. W., Ciardullo, R., Bode, M. F., Darnley, M. J., & Misselt, K. A. 2010b, ATel, 2987
- Shafter et al. (2008a) Shafter, A. W., Ciardullo, R., Bode, M. F., et al. 2008a, ATel, 1834
- Shafter et al. (2011d) Shafter, A. W., Ciardullo, R., Darnley, M. J., & Bode, M. F. 2011d, ATel, 3727
- Shafter et al. (2010c) Shafter, A. W., Ciardullo, R., Darnley, M. J., Bode, M. F., & Misselt, K. A. 2010c, ATel, 2898
- Shafter et al. (2010d) —. 2010d, ATel, 2949
- Shafter et al. (2010e) —. 2010e, ATel, 2909
- Shafter et al. (2013) Shafter, A. W., Curtin, C., Pritchet, C. J., Bode, M. F., & Darnley, M. J. 2013, to appear in Stella Novae: Future and Past Decades, P. A. Woudt & V. A. R. M. Ribeiro (eds), ASPCS, ArXiv e-prints, arXiv:1307.2296
- Shafter et al. (2012a) Shafter, A. W., Darnley, M. J., Bode, M. F., Ciardullo, R., & Hornoch, K. 2012a, ATel, 3850
- Shafter et al. (2012b) Shafter, A. W., Hornoch, K., Ciardullo, J. V. R., Darnley, M. J., & Bode, M. F. 2012b, ATel, 4503
- Shafter et al. (2012c) Shafter, A. W., Hornoch, K., Ciardullo, R., Darnley, M. J., & Bode, M. F. 2012c, ATel, 4368
- Shafter et al. (2012d) —. 2012d, ATel, 4658
- Shafter et al. (2012e) —. 2012e, ATel, 4391
- Shafter et al. (2010f) Shafter, A. W., Hornoch, K., Darnley, M. J., et al. 2010f, ATel, 3039
- Shafter et al. (2009) Shafter, A. W., Rau, A., Quimby, R. M., et al. 2009, ApJ, 690, 1148
- Shafter et al. (2008b) Shafter, A. W., Ciardullo, R., Burwitz, V., et al. 2008b, ATel, 1851
- Shafter et al. (2011e) Shafter, A. W., Darnley, M. J., Hornoch, K., et al. 2011e, ApJ, 734, 12
- Sirianni et al. (2005) Sirianni, M., Jee, M. J., Benítez, N., et al. 2005, PASP, 117, 1049
- Skrutskie et al. (2006) Skrutskie, M. F., Cutri, R. M., Stiening, R., et al. 2006, AJ, 131, 1163
- Stark et al. (1992) Stark, A. A., Gammie, C. F., Wilson, R. W., et al. 1992, ApJS, 79, 77
- Starrfield et al. (2012) Starrfield, S., Timmes, F. X., Iliadis, C., et al. 2012, Baltic Astronomy, 21, 76
- Steele et al. (2004) Steele, I. A., Smith, R. J., Rees, P. C., et al. 2004, in Society of Photo-Optical Instrumentation Engineers (SPIE) Conference Series, Vol. 5489, Society of Photo-Optical Instrumentation Engineers (SPIE) Conference Series, ed. J. M. Oschmann, Jr., 679
- Tang et al. (2013) Tang, S., Cao, Y., & Kasliwal. 2013, ATel, 5607
- Tang et al. (2014) Tang, S., Bildsten, L., Wolf, W. M., et al. 2014, ApJ, 786, 61
- Tody (1986) Tody, D. 1986, Proc. SPIE, 627, 733
- Tody (1993) Tody, D. 1993, Astronomical Data Analysis Software and Systems II, 52, 173
- Truran & Livio (1986) Truran, J. W., & Livio, M. 1986, ApJ, 308, 721
- Valeev et al. (2009) Valeev, A., Barsukova, E., Sholukhova, O., et al. 2009, ATel, 2208
- Whelan & Iben (1973) Whelan, J., & Iben, Jr., I. 1973, ApJ, 186, 1007
- White et al. (1995) White, N. E., Giommi, P., Heise, J., Angelini, L., & Fantasia, S. 1995, ApJ, 445, L125
- Williams et al. (2004) Williams, B. F., Garcia, M. R., Kong, A. K. H., et al. 2004, ApJ, 609, 735
- Williams (1992) Williams, R. E. 1992, AJ, 104, 725
- Williams et al. (2013a) Williams, S. C., Darnley, M. J., Bode, M. F., & Shafter, A. W. 2013a, ATel, 5611
- Williams et al. (2013b) —. 2013b, to appear in Stella Novae: Future and Past Decades, P. A. Woudt & V. A. R. M. Ribeiro (eds), ASPCS, ArXiv e-prints, arXiv:1303.1980