3D Hydrodynamic & Radiative Transfer Models of
X-ray Emission from Colliding Wind Binaries
1. Smoothed Particle Hydrodynamics
The wind-wind interaction of CWBs is modeled with an SPH code (Okazaki et al. 2008) that launches SPH particles from two point masses; these wind particles are accelerated according to a =1 velocity law. The calculation includes radiative cooling, which is implemented via the exact integration scheme (Townsend 2009), and uses a cooling function from Cloudy (Smith et al. 2008). Solar abundances are assumed throughout.
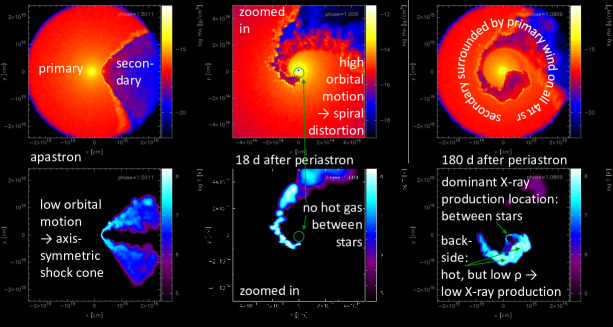
Figure 1 shows the density (top row) and temperature (bottom row) structure in the orbital plane of a 3D SPH simulation of Carinae (period yr, eccentricity ). The left panels show the axis-symmetric shock cone at apastron, which stems from the low orbital motion. Near periastron, however, significant spiral distortion occurs, which necessitates the use of 3D. Interestingly the hot gas between the stars, which is normally the site of the maximum X-ray emission since the collision is head on and the densities are highest, disappears around periastron. Two effects cause this; the primary wind encroaches into the acceleration region of the secondary wind, so the shock velocity is not as high, and the shock switches from adiabatically cooling to radiatively cooling. The steep dependence of the shock velocity on whether a shock in a CWB is adiabatic or radiative (, Stevens et al. 1992) means this transition happens quickly. After periastron the secondary wind collides with primary wind over all solid angles, but the dominant X-ray emission comes from between the stars.
WR 140 ( yr, ) shows similar behavior to Carinae, except that the spiral distortion around periastron recovers much quicker since the terminal speeds of the two winds are more similar. Also the stellar radii are smaller, so the winds always collide at or near terminal speed, and thus there is always hot gas between the stars. See Russell (2013) for more details on the SPH calculations and the full parameters for each CWB.
2. X-ray Radiative Transfer
The model X-ray flux is computed directly from the SPH simulations by solving the formal solution of radiative transfer, which we do by modifying the SPH visualization program Splash (Price 2007). The emissivity (solar composition is assumed except for the WC wind in WR 140) is from APEC (Smith et al. 2001), which is obtained via XSpec (Arnaud 1996), the circumstellar absorption is from windtabs (Leutenegger et al. 2010), and the ISM absorption is from TBabs (Wilms et al. 2000). The radiative transfer is performed along a series of 1D rays through the SPH simulation; this creates a pixel map that is then summed to determine the flux at a particular energy. The radiative transfer calculation is looped over energy to compute a spectrum, and this is finally folded through the response function of an X-ray instrument to directly compare the model spectra with the data in absolute units.
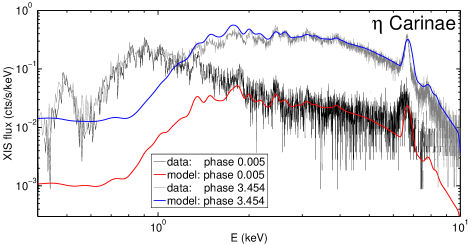
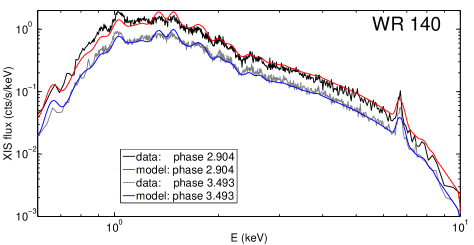
Figures 2 & 3 compare the model X-ray spectra of Carinae and WR 140, folded through the Suzaku XIS response function, with the data. The agreement is good for all four observations shown, providing more evidence that the mass loss rate of Carinae’s primary is yr-1 (Hillier et al. 2001). The model does not match the WR 140 observations at periastron (not shown); the spectral shape is good, but the model flux level gets 3 too high at its worst disagreement, requiring further work to resolve this discrepancy.
References
Arnaud, K. A. 1996, in ASP Conference Series, Vol. 101, ed. G. H. Jacoby & J. Barnes, 17
Hillier, D. J., Davidson, K., Ishibashi, K., & Gull, T. 2001, ApJ, 553, 837
Leutenegger, M. A., Cohen, D. H., & Zsargó, J., et al. 2010, ApJ, 719, 1767
Okazaki, A. T., Owocki, S. P., Russell, C. M. P., & Corcoran, M. F. 2008, MNRAS, 388, L39
Price, D. J. 2007, PASA, 24, 159
Russell, C. M. P. 2013, PhD thesis, Univ. of Delaware
Smith, R. K., Brickhouse, N. S., Liedahl, D. A., & Raymond, J. C. 2001, ApJLett, 556, L91
Smith, B., Sigurdsson, S., & Abel, T. 2008, MNRAS, 385, 1443
Stevens, I. R., Blondin, J. M., & Pollock, A. M. T. 1992, ApJ, 386, 265
Sugawara, Y., Maeda, Y., et al. 2011, Bulletin de la Societe Royale des Sciences de Liege, 80, 724
Townsend R. H. D. 2009 ApJS., 181, 391
Wilms, J., Allen, A., & McCray, R. 2000, ApJ, 542, 914