Black hole mass determination in the X-ray binary 4U 1630–47: Scaling of spectral and variability characteristics
Abstract
We present the results of a comprehensive investigation on the evolution of spectral and timing properties of the Galactic black hole candidate 4U 1630–47 during its spectral transitions. In particular, we show how a scaling of the correlation of the photon index of the Comptonized spectral component with low frequency of quasi-periodic oscillations (QPO), and mass accretion rate, can be applied to the black hole mass and the inclination angle estimates. We analyze the transition episodes observed with the Rossi X-ray Timing Explorer (RXTE) and BeppoSAX satellites. We find that the broadband X-ray energy spectra of 4U 1630–47 during all spectral states can be modeled by a combination of a thermal component, a Comptonized component and a red-skewed iron line component. We also establish that monotonically increases during transition from the low-hard state to the high-soft state and then saturates for high mass accretion rates. The index saturation levels vary for different transition episodes. Correlations of versus also shows saturation at . and correlations with their index saturation revealed in 4U 1630–47 are similar to those established in a number of other BHCs and can be considered as an observational evidence for the presence of a black hole in these sources. The scaling technique, which relies on XTE J1550–564, GRO 1655-40 and H 1743-322 as reference sources, allows us to evaluate a black hole mass in 4U 1630–47 yielding solar masses, and to constrain the inclination angle of .
1 Introduction
The problem of the dynamical mass determination of black holes (BHs) in binary systems is closely related to mass function and mass ratio estimates (using optical counterpart data) and also to the orbital inclination angle (see Orosz, 2003, and references therein). This mass determination requires a knowledge of the period and radial velocity measurement. The absence of X-ray eclipses and the rotational broadening of absorption lines (radial velocity shifts) in the optical star spectrum also facilitate BH mass evaluation. However, there are relatively a few of low-mass binary sources, for which optical emission is accessible, as a result of Galactic extinction. On the other hand, it is possible to evaluate the mass of the central object (for example, a BH mass) based on X-ray data and timing characteristics (even when conventional dynamical methods cannot be used). Furthermore, only in transient systems where accretion shuts down and the system reverts to a quiescent state can the Keplerian photospheric line shifts be measured.
A new method of the BH mass determination was developed by Shaposhnikov & Titarchuk (2009), hereafter ST09, using correlation scaling between X-ray spectral and timing properties observed from many Galactic BH binaries during their hard-soft state transitions. ST09 consider the Transition layer (TL) model proposed by Titarchuk, Lapidus & Muslimov (1998), hereafter TLM98 (see also Titarchuk & Osherovich 1999, hereafter TO99) in which the TL size is proportional to BH mass. The Comptonization parameter , which is a product of the average number of scatterings and the efficiency of up-scattering, is inversely proportional to the energy spectral index (ST09). TLM98 suggest that such a configuration is a result of an adjustment of a Keplerian flow (disk) to a turbulent, innermost sub-Keplerian flow (TL). The TL formation is probably related to the shock formation near the adjustment radius (see TLM98). Thus, the accretion flow releases its gravitational energy in the TL where its temperature is regulated by this gravitational energy release, Compton cooling and illumination of the TL by external soft photon flux from the disk (see TLM98 and TO99). The emergent spectrum is formed as a result of upscattering of these soft (disk) photons in the relatively hot plasma of TL. In the low-hard state, when the flux of the disk photons is relatively weak, the TL plasma temperature is keV and the resulting photon index is . On the other hand, in the high-soft state, when the flux of the disk soft photon dominates the gravitational energy release in TL, the plasma temperature significantly decreases to 5-10 keV and the photon index becomes greater than 2 as a result of disk photon cooling and General Relativity (GR) effects [see Titarchuk & Zannias (1998) and Laurent & Titarchuk (1999)].
It is well known that different BHCs show different spectral-timing correlation patterns, vs quasi-periodic oscillation (QPO) frequency and vs mass accretion rate, depending on mass of the compact object, the distance from the Earth observer and the binary inclination. The correlation of versus in black binaries was discovered by Vignarca et al. (2003) using RXTE data in terms of a phenomenological model, a high-energy cutoff power law, corrected for interstellar absorption, plus a Gaussian emission line to take into account an excess at 6.4 keV. Recently Stiele et al. (2013), hereafter SBKM13, confirmed the correlations between the spectral index and QPO frequency in a sample of Galactic black hole candidate (BHC) binaries (GX 339-4, H 1743-322, and XTE J1650-500) using RXTE data. For the spectral fitting they applied a sum of the disk emission approximated by the model (Mitsuda et al. 1984) with the model (Steiner et al. 2009) for Compton scattering as well as a reflection component. However Vignarca et al. and Stiele et al. did not apply these induced correlations for BH mass determination.
In the studies of Shaposhnikov & Titarchuk (2007, 2009), Titarchuk & Seifina (2009) [TS09 hereafter] and Shrader et al. (2010) the authors demonstrate that these correlation tracks provide a wide scaling range for a source with unknown BH mass. Recently, application of this method was also extended to a study of another class of X-ray sources, the ultra-luminous X-ray source or ULXs , NGC 5408 X-1 in Strohmayer & Mushotzky (2009).
The observed variability and spectral properties vary in a well defined manner throughout different spectral states. Furthermore these correlations are seen in many sources, which vary widely in luminosity. The universality of these correlations suggests that the basic physical processes are very similar for each of these sources and their observational manifestations are determined by a common set of basic physical parameters.
It this work we take an opportunity to determine the mass of the putative BH in the X-ray binary 4U 1630–47, for which the compact oject mass has not been evaluated using any traditional method (see above). 4U 1630–47 is an X-ray transient discovered by Uhuru [see Jones et al. (1976)], although its first recorded outburst was apparently detected in 1969 by Vela 5B (Priedhorsky 1986). 4U 1630–47 is a well-studied black hole candidate [Tanaka & Lewin (1997); Parmar et al. (1995, 1997); Kuulkers et al. (1997), and Oosterbroek et al. (1998)]. 4U 1630–47 is an ultra-soft X-ray transient, which shows various multiple outbursts. 4U 1630–47 has also been observed by Ginga [Kuulkers et al. (1997)], BeppoSAX (Oosterbroek et al., 1998), INTEGRAL [Tomsick et al. (2005), T05 hereafter] and Suzaku (Kubota et al., 2007). The 1984 outburst, and its following decay, were studied by EXOSAT (Parmar et al. 1986). 4U 1630–47 is a part of the to the group of the X-ray transients known as X-ray novae (Tanaka & Shibazaki 1996; Sunyaev et al. 1994). All sources of this type are assumed to be recurrent. However the recurrence time scales seem to range from years to decades so in some cases only a single event have been recorded (e.g. Chen, Shrader & Livio, 1997 and Grindlay et al. 2014). A typical recurrence time for outbursts of such sources is usually years. In this respect, the fact that 4U 1630–47 and also GX 339-4 exhibit relatively frequent outbursts is uncommon. The source 4U 1630–47 lies in the direction towards the Galactic center. Observations show that the source is heavily absorbed in soft X-rays, indicating a large source distance ( kpc). No optical counterpart has yet been identified, probably due to the large extinction amount of optical ( mag) and reddening. Therefore, the dynamical evidence for the presence of a black hole in this binary system is still missing.
For the reasons mentioned above the binary orbital period of 4U 1630–47 is not known. The spread in estimates of the column density toward 4U 1630 is quite broad. Specifically, values as derived from spectral fits of X-ray data are in the range from 5 cm-2 (Parmar et al. 1986, 1997; ) to 1.5 cm-2 (Kuulkers et al. 1998; T05; Oosterbroek et al. 1998; Cui et al. 2000; Dieters et al. 2000; Tomsick & Kaaret 2000; Trudolyubov et al. 2001). These measurements vary with X-ray brightness of the system and clearly include a contribution intrinsic to the system. The column density estimate derived from HI radio surveys (Kerr et al. 1986) yields a value of 2 cm-2. Some difficulties of the infrared counterpart detection of this X-ray source are related to the requirement of continuous and deep IR monitoring during both outburst and quiescence (Callanan et al., 2000). Augusteijn et al. (2001) were able to detect a variable source at K=16.1 mag located inside the radio error circle which they identify as the infrared counterpart to the X-ray source. They conclude that 4U 1630–47 is most likely a black hole candidate X-ray binary similar to GRO J1655-40 or 4U 1543-47, containing a relatively early-type secondary. It should be noted that among multiple X-ray outbursts registered from 4U 1630–47, only the 1998 outburst was accompanied by radio jet emission (Hjellming et al., 1999) detected by NRAO VLA and Australia Telescope Compact Array (ATCA). Based on its similarities to the X-ray properties of sources in which a black hole has been identified using the dynamical methods, 4U 1630–47 is also suggested to be a BHC [see e.g. Parmar et al., (1986)].
The emission properties of accreting black holes are generally classified in terms of canonical “spectral states” (see Remillard & McClintock 2006; Belloni 2005; Klein-Wolt & van der Klis 2008). We use a general BH state classification which includes five basic BH states: quiescent, low-hard, intermediate, high-soft, and very high states (LHS, IS, HSS and VHS respectively). When a BH goes into outburst it starts from its quiescent state and enters the LHS, where the energy spectrum is characterized by a hard Comptonization component and a relatively weak thermal component. This spectrum is a result of Comptonization of soft photons by electrons of the hot ambient media [the Compton cloud, herein CC] (see, e.g., Sunyaev & Titarchuk 1980). Throughout this work we use terminology where the CC is associated with a transition layer (TL). In general, the LHS is characterized by strong variability, which can been seen as a flat-top broken power-law (WRN) in its power density spectrum (PDS), along with QPOs in the range of 0.01 – 25 Hz.
In the HSS, the photon spectrum is well represented by the sum of a strong thermal component, which is probably originated in the inner accretion disk, and an extended power law component. It is worth noting that in the HSS the PDS flat-top component is absent and all QPOs disappear. Overall variability in the HSS is either absent or very low and presented by a weak power law in the power spectrum. The intermediate state (IS) is a transitional state from the LHS to the HSS and vice versa. Note that in addition to the LHS, IS and HSS we can also observe sometimes a very high state (VHS) in which a both blackbody and non-thermal components are present. Flat-top noise and low frequency QPOs may be seen in their power-density spectra (PDS). Also, this state is generally associated with with high frequency QPOs above 100 Hz.
Three main types of LFQPOs, so called Type A, B and C were originally identified in the light curve of XTE J1550-564 (Wijnands et al. 1999; Remillard et al. 2002), and further found in several sources (see Casella et al. 2005 and references therein). In the context of the state classification outlined above, it is possible to attribute these three QPO types to different spectral conditions (see Homan et al. 2001, Homan & Belloni 2005, Belloni et al. 2005). The type-C QPO is associated with the (radio loud) hard intermediate state and the low/hard (LS) state (Soleri et al., 2008). It is commonly seen in almost all BHCs in which a QPO is correlated with the count rate and this QPO is characterized by a high fractional variability. In turn, C-type QPOs demonstrate a clear correlation with the spectral index and provide an opportunity for a BH mass scaling (ST07, ST09). Casella et al. (2005) showed that the QPO type and frequency in BHCs change systematically as a function of the inverse of the source rms fractional variation. This behavior is seen over different BHCs and presents fair similarities with the LFQPOs observed in neutron star low-mass X-ray binaries. Thus Casella et al. (2005) suggested that C, B, and A type LFQPOs in BHCs correspond to HBOs , NBOs, and FBOs (horizontal, normal and flaring branch oscillations respectively) of high-luminosity neutron star systems of the Z class.
Based on the analysis of RXTE data T05 concluded that 4U 1630–47 exhibits many properties which are not completely encompassed by Remillard & McClintock (2006) state definitions. In particular, T05 reported on so-called flaring state observed on timescales of 10 – 100 s during 2002 – 2004 observations. Similar high amplitude flaring behavior was previously detected only in BHC GRS 1915+105 (Belloni et al., 2005). However, in contrast to GRS 1915+105 case, the X-ray light curves of 4U 1630–47 do not show repeating patterns seen in GRS 1915+105.
In this work we study in detail the behavior of the energy and power spectra observed by RXTE and BeppoSAX from the galactic BHC 4U 1630–47 during 1996 – 2004 outburst activity. Specifically, we concentrate on the phenomenology of the photon index and the QPO frequency. Based on the results of our data analysis we estimate the BH mass in 4U 1630–47. In §2 we present the list of observations used in the data analysis while in §3 we provide the details of X-ray spectral analysis. We discuss the evolution of X-ray spectral and timing properties during the state transition in §4-§6. We also discuss our results and make our final conclusions in §7§8.
2 Data Selection
Broad band energy spectra of 4U 1630–47 were obtained combining data from three BeppoSAX Narrow Field Instruments (NFIs): the Low Energy Concentrator Spectrometer [LECS; Parmar et al. (1997)] for the 0.3 – 4 keV range, the Medium Energy Concentrator Spectrometer [MECS; Boella et al. (1997)] for the 1.8 – 10 keV range and the Phoswich Detection System [PDS; Frontera et al. (1997)] for the 15 – 200 keV range. The SAXDAS data analysis package is used for the data processing. We performed spectral analysis for each instrument in a corresponding energy range with a well known response matrix. The LECS data have been renormalized to match the MECS data. Relative normalizations of the NFIs were treated as free parameters in the model fits, except for the MECS normalization that was fixed at unity. The cross-calibration factor obtained in this way is found to be in a standard range for each instrument111http://heasarc.nasa.gov/docs/sax/abc/saxabc/saxabc.html. Additionally, spectra have been rebinned in accordance with the energy resolution of the instruments using rebinning template files in GRPPHA to obtain better signal to noise ratio. Systematic uncertainties of 1% have been applied to all spectra. In Table 1 we listed the BeppoSAX observations used in the present analysis.
We also analyzed 425 RXTE observations taken between February 1996 and May 2004. Standard tasks of the LHEASOFT/FTOOLS 5.3 software package were used for data processing. For spectral analysis we used PCA Standard 2 mode data, collected in the 3 – 23 keV energy range, applying PCA response calibration (pcarmf v11.7). The fitting was carried out using the standard XSPEC v 12.6.0 fitting package 222http://heasarc.gsfc.nasa.gov/FTP/sax/cal/responses/grouping. The standard dead time correction procedure has been applied to the data. In order to construct broad-band spectra the data from HEXTE detectors have been also utilized. We subtracted a background corrected in off-source observations. The data are available through the GSFC public archive (http://heasarc.gsfc.nasa.gov). Systematic error of 0.5% has been applied to all analyzed RXTE spectra. In Table 2 we listed the groups of RXTE observations tracing thorough the source evolution during different states.
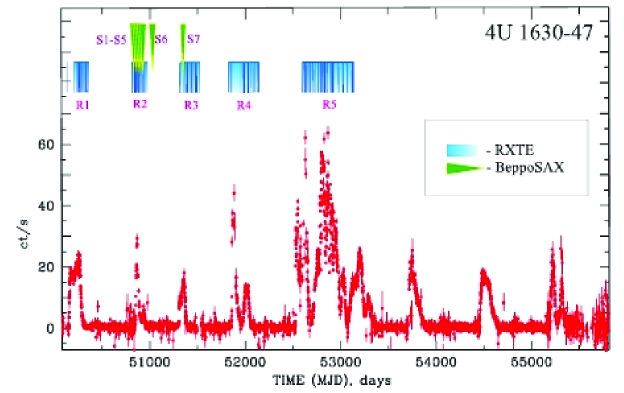
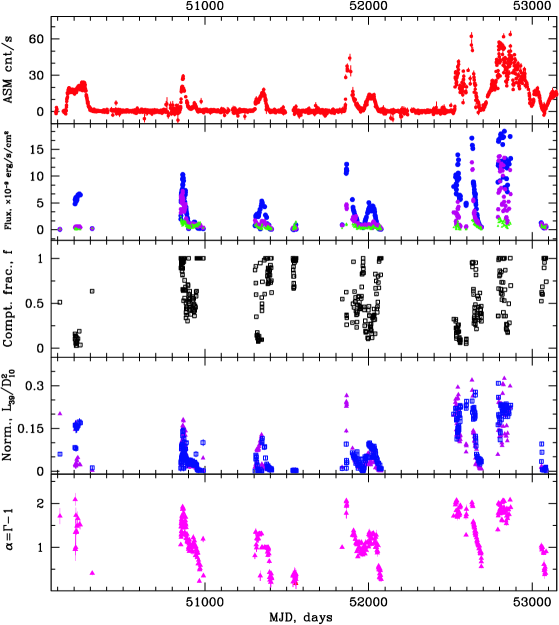
We have performed an analysis of RXTE observations of 4U 1630–47 spanning eight years made at seven intervals indicated by blue rectangles in Figure 1 (). The RXTE energy spectra were modeled using XSPEC astrophysical fitting software. We have also used public 4U 1630–47 data from the All-Sky Monitor (ASM) on-board RXTE, which demonstrate long-term variability of the 212 keV flux during all observation scans.
According to ASM monitoring 4U 1630–47 shows complex long-term variations. Specifically, during eight years (1996 – 2004) the RXTE have detected five outbursts from 4U 1630–47 (see Fig. 1). These outbursts follow the recurrence interval of about 600 days (Parmar et al. 1995) and differ significantly in shape.
Possible resemblance between individual outbursts from 4U 1630–47 and from other known BHCs should be emphasized. For example, the outbursts of 1996 and 1999 resemble the state transitions in the persistent BHC Cyg X-1 [Cui et al. (1998)] and GX 339-4 [Belloni et al. (1999)], while the 1998 outburst showed a fast rise and exponential decay (FRED) profile which is typical for many X-ray novae [Chen et al. (1997)].
Data from the PCA and HEXTE detectors as well as BeppoSAX detectors have been used to constrain spectral fits, while ASM data provided long-term intensity state monitoring. Results of our long-term study of 4U 1630–47 are presented in detail in the next sections and compared with results for XTE J1550–564 in order to estimate a BH mass in 4U 1630–47.
In general, the broadband spectral sensitivities of two X-ray orbital observatories, RXTE (Bradt et al., 1993) and BeppoSAX (Boella et al. 1997), combined with the high timing resolution of RXTE provide a means to study both the detailed broadband spectra and long-term spectral and timing evolution of BH hosting X-ray binaries.
3 Spectral Analysis
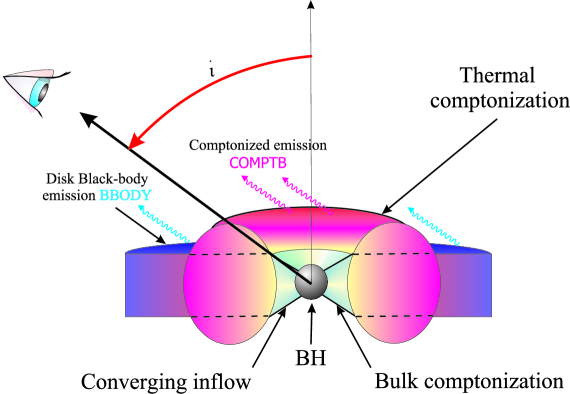
Our spectral model is based on the following physical paradigm of the accretion process. We assume that accretion onto a black hole takes place when the material passing through three main regions: a geometrically thin accretion disk [standard Shakura-Sunyaev disk, see Shakura & Sunyaev (1973)], the transition layer (TL) (Titarchuk et al., 1998) and the converging flow (Titarchuk & Zannias, 1998). The disk photons are upscattered off energetic electrons of the transition layer and the converging flow (see also Fig. 2). Some fraction of these seed photons can be also seen directly by the Earth observer. Pink and blue waved arrows shown in Fig. 2 correspond to and blackbody components, respectively.
According to the physical picture described above, for our spectral analysis we use a model which consists of sum of a Comptonization () component, [COMPTB is the XSPEC Contributed model333http://heasarc.gsfc.nasa.gov/docs/software/lheasoft/xanadu/xspec/models/comptb.html, see Farinelli et al. (2008)], a soft component and the iron line component. The spectral component has the following parameters: temperature of the seed photons , the energy index of the Comptonization spectrum (), the electron temperature , the Comptonization fraction [] and the normalization of the seed photon spectrum .
Some observations show significant excess of emission in the 6 – 8 keV region occurs which one can attribute to the iron emission complex. The presence of the iron line features provides the evidence for an additional reprocessed component in the spectrum. It should be noted that a subset of observations can be fit without adding the iron line (30%), while the remaining observations require the line component including: either two narrow iron emission lines () or one redskewed iron emission line (modeled by the XSPEC model). Model fits for several spectra show that the -line component is more suitable than the sum of two . For these reasons, an iron Kα-line () component (Laor 1991) was included in our model spectrum and applied to all spectra. The Laor model parameters are the line energy, , the emissivity index, a dimensionless inner disk radius, (with ), inclination, , and the normalization of the line, (in units of photons cm-2 s-1). Note is the gravitational radius of a black hole, with and as the common physical constants and as a BH mass. For the Laor component we fixed the outer disk radius to the default value of 400 while we vary all the parameters allowed to be free. We also fixed the emissivity index to 3. The inclination is constrained to a value , which is estimated using scaling technique (see §7.3).
In turn, to fit the data in the 1 – 4 keV range, we use a blackbody component for which parameters are the normalization and color temperature . In the model we also include interstellar absorption with a column density .
During the fitting procedure we fix certain parameters of the component. First, we put . Note the low energy index of the seed blackbody spectrum is . We also fixed the value of the parameter to 2 when the best-fit values of a Comptonization fraction equals approximately to 1 and the model fit becomes insensitive to the parameter. We use a value of the hydrogen column density cm-2, which was found by Dieters et al. (2000). As a result we obtain a satisfactory agreement with this model for both RXTE and BeppoSAX for all available observations.
We show examples of fits of X-ray spectra using our spectral model in Figs. 3–4 (for SAX data) and in Figs. 5– 6 (for RXTE data). Spectral analysis of BeppoSAX and RXTE observations indicates that X-ray spectra of 4U 1630–47 can be satisfactory fit by the model where its Comptonization component is present by the Comptb model. Moreover, for the broad-band BeppoSAX observations this spectral model component allows to describe the photoelectric absorption at low energies ( keV) and the structure of Fe K band over 6 – 7 keV energy band in detail.
3.1 BeppoSAX data analysis
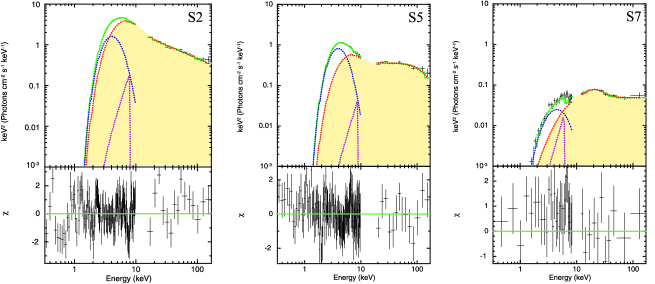
In Figure 3 we demonstrate three representative spectral diagrams (green lines) for different states of 4U 1630–47. Data are taken from SAX observations 20114002 ( panel, “S2” data set, HSS), 20114005 ( panel, “S5” data set, IS), and 70821005 ( panel, “S7” data set, LHS). The data are shown by black crosses and the spectral model components are displayed by dashed red, blue and purple lines for the , and respectively. Yellow shaded areas demonstrate an evolution of component during the state transition between the HSS () and LHS () when the normalization parameter of the Comptonization component monotonically decreases from 13 to 2 erg/s/kpc2. In the bottom panels we show the corresponding vs photon energy (in keV).
The best-fit model parameters for the HSS state ( panel, ) are =2.620.05, 230 keV and =6.420.04 keV [=1.16 for 127 d.o.f], while the best-fit model parameters for IS state ( panel, ) are =2.030.03, =581 keV and =7.080.06 keV [=1.18 for 127 d.o.f]; and, finally, the best-fit model parameters for LHS state ( panel, ) are =2.010.02, =16050 keV and =5.380.05 keV [=0.92 for 127 d.o.f].
The blackbody temperature , weakly depends on the source state and is consistent with 0.7 keV (at a 2- level of confidence). Adding this low temperature component significantly improves the fit quality for the BeppoSAX spectra. For example, the best-fit for the LHS events (id=70821005) is characterized by reduced of 3.7 (129 d.o.f.) for the model without this low temperature blackbody component, while is 0.92 (127 d.o.f.) for the model with the low temperature blackbody component. We also find that the seed temperatures of the component varies only slightly around 1.6 keV. A systematic uncertainty of 1% has been applied to all analyzed BeppoSAX spectra (see more details in Table 3).
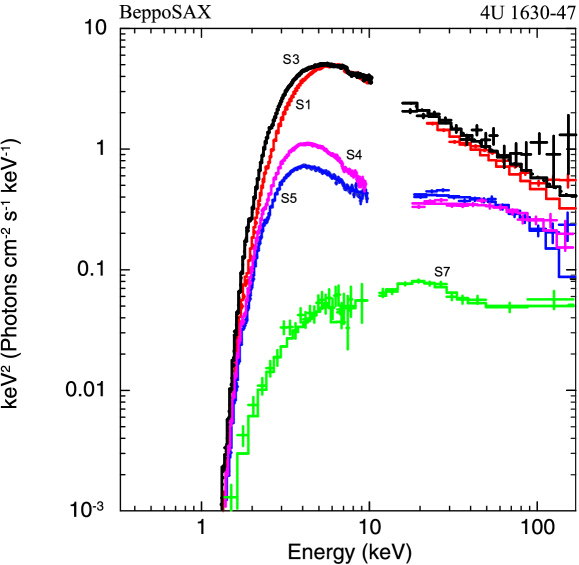
The general picture of the LHS-IS-HSS transition is illustrated in Figure 4 where we put together spectra of the LHS, IS and HSS, to demonstrate the source spectral evolution from the high-soft to low-hard states based on the SAX observations. We should point out the fact that the HSS and IS spectra are characterized by a strong soft blackbody component and a power law extending up to 200 keV, while in the LHS spectrum, the Comptonization component is dominant and the blackbody component is barely seen.
For the BeppoSAX data (see Tables 1, 3) we find that the spectral index monotonically increases from 1 to 1.7 (or the photon index from 2 to 2.7), when the normalization of component (or mass accretion rate) changes by factor of 8.
3.2 RXTE data analysis
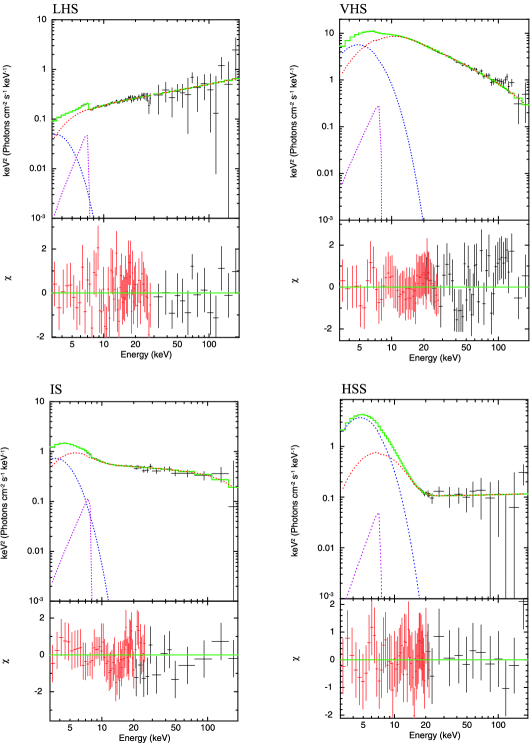
For the RXTE data analysis we use the information which we obtain using the SAX best-fit spectra. Specifically, because of RXTE/PCA detectors cover energies above 3 keV, for our analysis of RXTE spectra we fix a key parameter of the blackbody component (0.7 keV) obtained as a mean value of for the BeppoSAX spectra. In Figure 5 we show representative spectra of 4U 1630–47 for the LHS, IS, HSS, and VSS. Data are taken from RXTE observations 30172-01-18-12 (, LHS), 30172-01-04-00 (, IS), 80117-01-05-00 (, VHS), and 10411-01-03-00 (, HSS). Here data are denoted by black points with error bars. The spectral model is presented by blackbody, Comptb, and Laor components shown by blue, red, and purple lines respectively.
The best-fit model parameters for the LHS state ( panel) are =1.620.03, =496 keV and =5.860.06 keV [=1.00 for 93 d.o.f]; while the best-fit model parameters for the IS state ( panel) are =2.150.02, =415 keV and =6.400.02 keV [=1.35 for 93 d.o.f]; in turn, the best-fit model parameters for the VHS state ( panel) are =2.980.01, 200 keV and =6.440.07 keV [=0.97 for 93 d.o.f]; and, finally, the best-fit model parameters for the HSS state (bottom-right panel) are =1.90.8, =591 keV and =6.410.05 keV [=0.65 for 93 d.o.f].
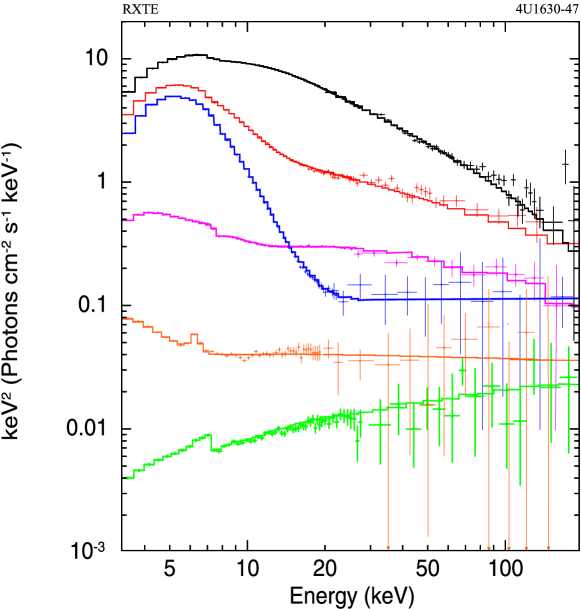
Thus RXTE observations cover 4U 1630–47 in four spectral states and reveal its spectral evolution from the low-hard to high-soft states. In Figure 6 we illustrate the spectral evolution for LHS-IS-VSS-VHS transition using six representative spectral diagrams which are related to these spectral states in 4U 1630–47. Similarly to our BeppoSax spectral analysis, we use as the best-fit model for the RXTE spectral modeling. The data are taken from RXTE observations 30172-01-18-12 (, LHS), 10411-01-18-00 (, LHS), 30172-01-07-00 (, IS), 70417-01-03-00 (, IS), 10411-01-03-00 (, HSS), 80117-01-03-00G (, VHS). For clarity of the presentation we use the normalization factors of 0.5 and 0.1 for 10411-01-18-00 and 30172-01-18-12 spectra ( and curves respectively). An example of the best-fit parameters of the source spectrum and values of including the number of degrees of freedom for RXTE spectra is presented in Table 4 for 1998 ( set). In particular, we find that the illumination fraction of the component varies in a wide range between 0 and 1, and that it undergoes sudden changes during an outburst phase for all observations.
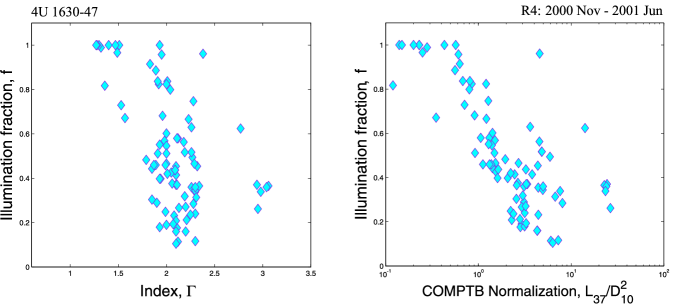
In general, for the VHS events (see line in Fig. 6) are characterized by a dominant soft blackbody component and relatively weak power law component with respect to that in the IS and VSS. In the IS and VSS spectra the contribution of the blackbody component is less than that for the VHS. In the LHS spectrum, the Comptonization component is dominant and the blackbody component is weak in agreement with our the BeppoSax analysis. An evolution between the low state and high state is accompanied by a monotonic increase of the normalization parameter of the Compton component from 0.1 to 30 erg/s/kpc2 and by an increase of the photon index from 1.5 to 3, (see Figure 7). We should point out a clear anti-correlation between the illumination fraction and the photon index, identified by Stiele et al. (2013) (combine their Figures 4, middle panels) for XTE J1650-500. Our results show that for 4U 1630-47 the illumination fraction and the index also anti-correlate in a similar manner [compare Fig. 7 and Fig. 4 in Stiele et al. (2013)].
T05 reported a strong bump at 20 keV in some RXTE spectra of 4U 1630–47, which cannot be satisfactory fit with their adopted model [wabs*(diskbb+cutoffpl+Gaussian)*smedge]. In our investigation we find small positive excess at 20 keV for only one particular RXTE observation (id=50135-02-03-00) studied by T05.
Previous analyses of other X-ray binaries occasionally show, a clear bump at 20 keV in their IS spectra. We suggest that it is difficult to explain this feature purely in terms of Compton reflection because the photon index and thus there is a lack of photons in the incident spectrum to effectively form this 20 keV reflection bump. In fact, this feature can be more naturally attributed to the reprocessing of high energy photons into lower energies due to down-scattering off relatively cold electrons in the surrounding disk or cold outflow if is less than 2 (see Basko et al. 1974 and Laurent & Titarchuk 2007). Laurent & Titarchuk (2007) demonstrate using a Monte Carlo simulation and theoretical arguments that the reflection bump never appears in the emergent spectra if the photon index of the spectrum is higher than 2. The resulting spectrum becomes steeper and spectrum is deformed.
An additional thermal component with a relatively high color temperature of about 4 – 5 keV (so called a high-temperature blackbody component, see e.g., TS09; Seifina & Titarchuk 2010, ST10 hereafter; Koljonen et al., 2013; Mineo et al., 2012) is a component of the spectral model which fits the data. TS09 find that eight IS and VHS spectra of GRS 1915+105 that require this high-temperature blackbody component. These cases are rather related to epochs of radio loud events. Recently, Mineo et al. (2012) find that spectra in the “heartbeat” state of GRS 1915+105 can be fit with models including a high-temperature blackbody component of the color temperature 3 – 6 keV. Furthermore, ST10 reveal 24 IS spectra from SS 433 during radio outburst decay events that had also a strong high-temperature blackbody component with color temperature of 4 – 5 keV. One can suggest that this high-temperature thermal component is indicative of the neutron star. However it is well-known that a NS color temperature is in the range keV [see e.g. Lewin et al. (1997)]. TS09 argue that this high-temperature blackbody bump could be a result of the gravitationally redshifted annihilation line which is initially formed in the close vicinity of a BH horizon.
We should note that a low excess at 10 – 20 keV in the spectrum residuals for 4U 1630–47 can be excluded (in terms of criterion) if we increase and temperatures from 0.6 keV and 1.2 keV correspondingly to 0.7 keV and 1.4 keV changing the normalization parameters. Thus we do not find any significant difference in with or without a high-temperature blackbody component. Both models show acceptable values of . As a result we decide to apply an additive model which uses fewer spectral components.
3.3 Discussion of the data analysis and X-ray spectral modeling
Our spectral model applied to the data from BeppoSAX and RXTE shows robust performance throughout all data sets. Namely, a value of the reduced is less or around 1.0 for most observations. For a small fraction (less than 3%) of the analyzed spectra with high counting statistics reaches 1.5. Note that the energy range for the cases, in which we obtain the poor fit statistic (two among 425 spectra with =1.55 for 93 d.o.f), are related to the iron line region.
We remind the reader that the iron emission feature at 6 – 8 keV is clearly detected in (luminosity) states and barely seen in (luminosity) states of 4U 1630–47. Some previous studies [Oosterbroek et al. (1998), Trudolyubov et al. (2001)] did not utilize any iron emission line component. Furthermore, Tomsick et al. (1998) pointed out absorption lines from highly ionized H-like and He-like iron lines, which possibly indicate on the presence of a highly ionized disc or a wind (see also Kubota et al, 2007). Generally, for sources at a higher inclination, the obscuration of the continuum from the central source by the disk rim allows the detection of wind or the photo-ionized atmosphere due to observations of narrow emission lines, which are not visible at lower inclinations due to the stronger continuum emission. Recently, Trigo at el. (2013) detected highly-ionized absorption lines from Fe XXV and Fe XXVI in XMM- observation of 4U 1630-47. They discussed a possible origin of these lines in terms of accretion disc wind. In turn, Ponti et al. (2012) suggested that such winds can significantly affect on resulting X-ray emission of BHs particularly for high-inclined BHC binary systems. In addition, Cui et al. (2000) detected a double structure of emission feature fit by two lines centered around 5.7 and 7.7 keV using the additive continuum model consisting of multicolor disk (“diskbb”) and powerlaw utilizing RXTE data. However, we do not find any evidence of double line structure in X-ray spectrum of 4U 1630–47 in the framework of our model [].
It is important to point out that we find similar best-fit model parameters with those presented in the literature for the same SAX observations. In particular, the photon index , estimated by Oosterbroek et al. (1998) for observations , is about 2 – 2.7 (both for two additive models: a model and for a model). This similarity of the index values to our results using these different models is indicative of a correct approach for X-ray spectrum modeling and spectral state evolution scenario.
Thus, our model shows a good performance when we apply it to the the observed spectra from 4U 1630-47. In particular, LT99 argue that Generic Comptonization spectra (GCS) can be formed as a result of the combined and Comptonization effects. The difference between and GCS is in the way they explain of the exponential cutoff of the spectrum, which is determined by electron energy in the case and by the plasma energy (thermal plus bulk) in the GCS case. Thus the model is applicable to GCS spectra profile with the warning that the meaning of as the electron temperature can be generalized to include possible effects of bulk-inflow (dynamical) Comptonization. In other words, the cutoff energy can be dictated by the combined effect of thermal and dynamical Comptonization and the best-value value of , in the framework of Comptb component, indeed gives the mean value of the thermal and bulk energy. On the other hand the energy spectral index (or the photon index ) is a measure of Comptonization efficiency. Indeed, TS09 show that the index is an inverse of the Comptonization parameter which is a product of average energy change per scattering, and the number of scattering in the medium (Compton region).
We identify, using the BeppoSAX observations of 4U 1630–47, the model of the spectrum which covers the broad energy band from 0.3 to 200 keV. On the other hand, the RXTE extensive observations give us an opportunity to investigate the overall evolution pattern of the source behavior during all spectral transitions in the 3 – 200 keV energy range.
4 Overall pattern of X-ray properties
Observations of 4U 1630–47 show a variety of different states, which are associated with the changes of X-ray energy and power spectra. Previous investigations of 4U 1630–47 (e.g., Tomsik et al., 2005, Dieters et al., 1999) highlighted various outburst behavior and also pointed out differences in spectral and timing properties as well as light curve patterns during individual outbursts. However, Tomsik et al. and Dieters et al. analyzed individual outbursts applying different spectral models, which can introduce corresponding differences in the inferred spectral properties of 4U 1630–47. Therefore, because we are interested in the general character of the spectral evolution of 4U 1630–47, we perform a uniform analysis applying the same spectral model to all observations of 4U 1630–47. As a first step, we construct a hardness-intensity diagram of 4U 1630–47, which helps us to understand how 4U 1630–47 evolves between different spectral states. Note, that the hardness (observable flux ratio) is a measurable quantity, and directly related to the index of the spectrum (see below).
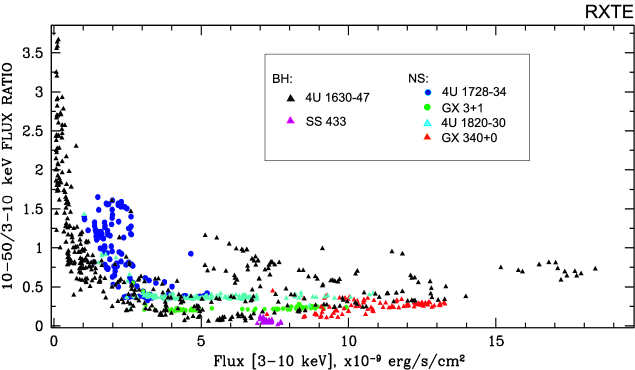
To study the properties of 4U 1630–47 during the spectral transitions, associated with significant changes in source luminosity, we investigate the direct observational dependence of hard color [10-50 keV/3-50 keV] (HC) on the 3-10 keV flux measured in units of erg s-1cm-2 [hardness-intensity diagram (HID)]. In Figure 8 we present the flux ratio HC versus the 3-10 keV flux measured in units of erg s-1cm-2 based on the RXTE data (black triangle points for 4U 1630–47 there). As we see from this Figure the hardness of the spectra monotonically decreases when this energy flux in the 3-10 keV band increases. In other words the spectrum becomes essentially softer for higher fluxes. The hardness ratio saturates at high flux values, an observational fact is indicative of the spectral evolution of the source from the LHS through the IS towards the HSS.
As the source moves from the LHS towards the IS the hard color (HC) drastically drops from 3.7 to 0.1 while the 3-10 keV flux only slightly increases. When the source further moves from the IS towards the soft states (VHS and HSS) the HC saturates while the 3-10 keV flux increases factor by 10, i.e. from 2 to 20 erg s-1cm-2. In Figure 8 we compare this HC behavior versus the flux for 4U 1630–47 with that observed in other BHCs and NSs
We use the HC [10-50 keV/3-10 keV] versus flux in the 3 – 10 keV range in the form of HID for six sources: 4U 1630–473 (BHC, ), SS 433 (BHC, ), 4U 1820-30 ( NS, bright blue), GX 3+1 ( NS, ) and 4U 1728-34 ( NS, ) and GX 340+0 ( type NS, ). As one can see from this Figure, HID for 4U 1630–47 exhibits two separate branches related to the spectral states (vertical branch) and to the states (horizontal branch), whereas all NS sources (except 4U 1728-34) show only the soft horizontal branch elongated close to the soft branch of 4U 1630–47. A unique stability (or quasi-constancy) of the hardness ratio for NSs versus the keV flux is an observational demonstration for the stability of the photon index established for a number of NS sources (see Farinelli & Titarchuk 2011, Seifina & Titarchuk 2011, 2012 and Seifina et al. 2013). This hardness ratio vs the keV flux provides a unique diagnostics for the nature of a given compact object.
As evident from this Figure, 4U 1630–47 shows both wider luminosity range and a wider hardness ratio range than any NS source. This observational features can be related to different rates of mass transfer in NS and BH systems. Thus, the comparison of HIDs, in principle allows one to probe physical properties of compact objects, in particular, their possible nature, directly related to a shape and localization of HID tracks.
5 Evolution of X-ray spectral properties during spectral state transition
A number of X-ray spectral transitions of 4U 1630–47 have been detected by RXTE during 1996 – 2004 ( – sets). We have searched for common spectral and timing features which can be revealed during these spectral transition events.
The X-ray light curve of 4U 1630–47 shows complex behavior in a wide range of time scales: from seconds to years (e.g., Belloni et al., 1999; T05). Here we discuss the source variability on the time scales of hours. In Figure 9 we demonstrate the source and model parameter evolution for all analyzed outburst spectral transitions. As one can see from the flux panel (second from the top), all outbursts of 4U 1630–47 are characterized by a significant increase of the 310 keV flux. Some events also demonstrate an increase of flux in the 1050 keV energy band (see particular events at MJD 50860 and 52260-52290). For such outbursts with a good rise-decay coverage, the predominance of the 10 – 50 keV flux over the 3 – 10 keV flux can be related to a moderate mass accretion rate regime. In fact, the spectral index is less in these dates (at MJD 50860 and 52260-52290) than that for 2002-2004 (MJD 52520-53080) events (see Fig. 9). The pivoting effect in 3-10 keV/10-50 keV flux relation corresponds to the spectral state change. Namely, in the framework of our spectral model (see §3) these spectral transitions are clearly seen as a decrease of the normalization and a spectral index decrease (see Fig. 9, two bottom panels at MJD 50860 and 52260).
The spectral index ) is well traced by soft X-ray flux (compare the and two upper panels of Fig. 9). Moreover, we do not find any difference in the correlations between and soft X-ray flux for different outbursts which was previously pointed out by a number of authors [e.g., T05, Trudolyubov et al., (1998)]. We can also suggest that the 4U 1630–47 spectral state evolution can be traced by the illumination fraction . For example, an excess of the 1050 keV flux over that for the 3 – 10 keV energy band (at the low/hard and intermediate states) mostly occurs for high values of ().
The actual difference between outbursts is related to the peak flux reached during an outburst which probably depends on the value of . The outbursts can be mainly distinguished by saturation levels achieved at the maximum of individual outbursts (see low panels of Fig. 10). Higher saturation levels of the index correspond to higher mass accretion rates. However the observed index saturation level of never exceeds 3 as predicted by the theoretical calculations of Titarchuk & Zannias (1998). All superimposed index-normalization correlations can be seen in a joint diagram in Fig. 11 which provides a generic picture of spectral (index) evolution vs through all outburst activity of 4U 1630–47. We should notice that all outbursts of 4U 1630–47 are associated with low radio activity except of the 1998 outburst which is accompanied by a strong radio emission [see a possible explanation of the radio activity by Fender (2006) and Corbel et al. (2013)]. We can suggest that during the 1998 outburst the total mass accretion rate from the companion was so high that some part of this mass flux went to the outflow leading to a strong radio emission [due to high radiation pressure, see an explanation of this effect in Titarchuk et al. (2007)] and another one accretes through the disk into the black hole.
Using SAX data and our model, we identify a blackbody component which has the temperature 0.6 – 0.7 keV and the seed blackbody temperature 1.2 keV. RXTE data show that varies in the 1.0 2.0 keV interval while is fixed at 0.7 keV. These best-fit values of are different from those obtained by T05 using the same RXTE data (herein the set). Namely, T05 find that changes in the 2.7 – 3.8 keV interval for about half of VHS spectra of 4U 1630–47, while the other half have these temperatures less than 1.8 keV for the model . Using the same spectral model Trudolyubov et al. (2001) obtain in the range of 1.2 – 1.8 keV for set. This difference of the seed photon temperature values found by T05 and Trudolyubov et al. can be explained by particular properties of the spectra for and outbursts. However, we show, using our spectral model, that values are similar for all outbursts and change between 1 and 2 keV. We can suggest that this difference between T05 and our results is possibly due the different spectral models used.
6 Correlations between spectral and timing properties during spectral state transitions
The RXTE light curves have been analyzed using the FTOOLS powspec task. The timing analysis RXTE/PCA data was performed in the whole PCA energy range by combining the high time resolution event and binned data modes. We have generated power density spectra (PDS) in 0.1 – 512 Hz frequency range with milisecond time resolution. We subtracted the noise contribution due to Poissonian statistics. To investigate the evolution of the source timing properties, we modeled the PDSs using analytic models and the minimization technique in the framework of QDP/PLT plotting package444http://heasarc.gsfc.nasa.gov/ftools/others/qdp/qdp.html.
The broad-band power density spectrum of the source is commonly presented by the noise component, which shape in the LHS and IS usually has a band-limited noise (BLN) profile approximated by an empirical model [the model in QDP/PLT]. The parameter is related to the break frequency and is a slope of the PDS continuum after the break frequency . In addition to the flat-top continuum in the LHS and the IS PDS often shows quasi-periodic oscillations (QPOs), modeled by Lorentzians. In the HSS and VHS an additional power-law component (very low frequency noise, VLFN) is needed to fit the data at the lowest frequencies.
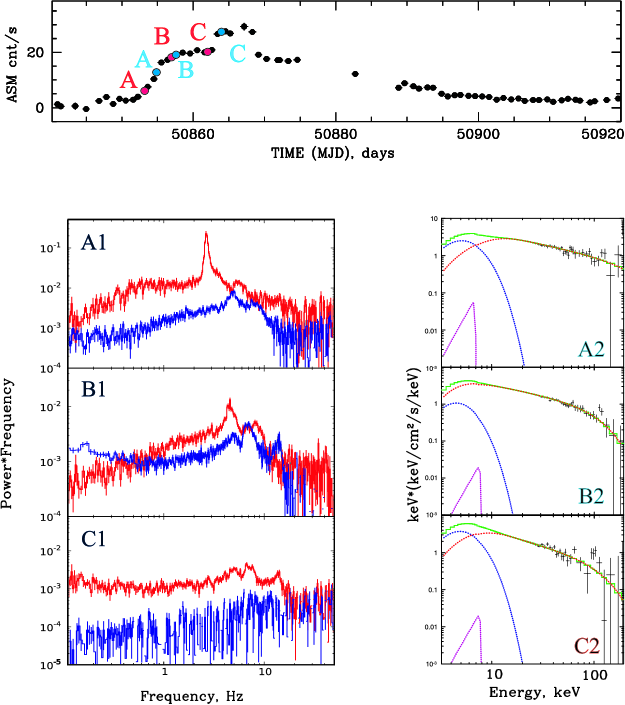
In Figure 12 we show details of the evolution of X-ray timing and spectral characteristics for the 1998 rise transition (). At the of this Figure we show an evolution of the 1.3 – 12 keV ASM flux during this outburst. We choose representative observations designated by / colors and letters A, B and C to demonstrate the PDS for six characteristic epochs at MJD = 50853.1/50855.8, 50856.1/50857.8 and 50862.6/50864.2, respectively, as shown on the ASM flux diagram at the top of Fig. 12.
On the panel of Fig. 12 we plot PDSs for three observations indicated as A, B, C moments, while the corresponding energy spectra in the form of diagram are shown on the panel. In the energy spectral diagrams the data points are shown by black while the spectral model components are presented by red, blue and pink dashed lines for , and components respectively.
Points A [red (30178-01-01-00) and blue (30178-01-03-00)] correspond to the IS, whereas points B and C [B red (30188-02-02-00), B blue (30178-02-02-00), C red (30178-01-10-00), C blue (30188-02-14-00)] are related to the VHS. All of these observations, except 30188-02-14-00 (C ), exhibit power spectra with strong BLN accompanied by QPO peaks. Evolution of the temporal properties of the source during the rise phase of the 1998 outburst is characterized by a monotonic decrease of the total rms amplitude (from 28% to 10%) and an increase of the BLN break and QPO centroid frequencies (from 2 Hz to 13 Hz). Note that during X-ray flux plateau intervals the source emission is also characterized by the stable spectral and timing parameters. The 1.312 keV flux rise is accompanied by a systematic shift of the frequency of maximum power in PDS towards higher frequencies (see corresponding PDSfrequency diagrams for A and B points).
The energy spectra shown in the right column (panels A2, B2, C2) are related to the corresponding power spectrum diagrams, for panels: A1 (point A blue), B1 (point B blue), C1 (point C red). diagrams demonstrate an evolution of the spectral properties of 4U 1630–47 during the outburst rise phase, which is characterized by a monotonic steepening of the photon index from 1.5 to 3, (see red points in Fig. 13). Note that similar correlations were revealed in many X-ray BH binaries (e.g., ST09, TS09, TSA07 and SBKM13). This simultaneous spectral and timing analysis shows that state transitions in 4U 1630–47 are in agreement with the canonical BH spectral state evolution (see e.g. ST09). Namely, the correlation of the photon index with the QPO frequencies (see e.g. ST09, SBKM13 and presented work) ) can be considered as observational evidence for the presence of the transition layer (TL). In the framework of this scenario these QPOs are caused by oscillations in this bounded TL with frequencies equal to eigenfrequencies of the configuration. Any boundary configuration, in our case the TL or Compton cloud, is characterized by its own eigen-frequency. In order to observe this frequency there should be enough power in excitation of this frequency. It is not by chance we see these low frequency QPOs situated very close to the break frequency in the power spectrum [for more details on the theory of oscillations of a bounded medium, see Landau & Lifshitz (1976) and also Titarchuk, Shaposhnikov & Arefiev (2007) (TSA07)]
Consequently, this evolution of the QPO frequency can be interpreted as a change of the TL size, or the inner boundary of the Keplerian accretion disc where the disk starts to adjust to sub-Keplerian motion in the TL. Thus, the X-ray spectrum is formed in the relatively hot TL and evolves as a result of thermal and dynamical Compotonization of soft (disk) photons and QPOs are seen as intrinsic oscillations of the TL zone.
While the exact nature of QPOs is under debate the prediction of the TL oscillation interpretation that the QPO frequency increase with the flux is confirmed by the observations. Moreover, the spectral index vs QPO correlation established for many BHC sources allows us to estimate the compact object masses in these sources which we find to be consistent with mass function estimates (see ST09). We argue that that the observable correlations between spectral and timing characteristics seen in 4U 1630–47 are consistent with that obtained in other BHCs (see e.g. ST09 and SBKM13).
7 Discussion
7.1 Saturation of the index is a possible signature of a BH
In our analysis of the evolution of the photon index in 4U 1630–47 using RXTE and BeppoSAX observations we have firmly established that the index saturates with the low-QPO frequency and probably with the -normalization which is proportional to the (disk) mass accretion rate, (see Fig. 11). ST09 give strong arguments that this index saturation is a signature of converging flow onto a BH. In fact, the Comptonization spectral index is an inverse of a product of the number of scatterings and the efficiency of upscattering . In the converging flow is proportional to the mass accretion rate and is inversely proportional to for and thus one can expect the index saturation when . In addition, we reveal that the index correlates and saturates when QPO frequency increases. The index-QPO relation now established in many BHs, strongly suggests that low-frequency QPOs are a result of an oscillatory process in the Compton cloud (TL).
Titarchuk et al. (1998) predicted that the TL should become more compact when mass accretion rate, increases. For a BH case Laurent & Titarchuk (1999), (2011), hereafter LT99 and LT11, find, using Monte Carlo simulations, that the index should saturate when increases. The photon index increase and subsequent saturation versus was firmly established by ST09, TS09 and ST10 and we confirm this effect in the current work. In particular, as one can see in Figure 11 the values of monotonically increase from 1.2 and finally saturate at a value about 3.
Thus, we argue that the X-ray observations of 4U 1630–47 reveal the index saturation vs mass accretion rate which can be a signature of the converging flow (or a BH presence) in this source. The indexComptb normalization (or ) and the indexQPO the correlations allow us to estimate a BH mass in 4U 1630–47 (see Fig. 11 and § 7.3 below) even without an observation of the optical counterpart of 4U 1630-47.
As an additional argument in favor of a BH (or event horizon) presence is the observational fact that the cutoff energy of the spectra, have values about 200 keV [see the upper panel of Fig. 10 and also Grove et al. (1998)]. It is interesting that a similar result was obtained by LT99 and LT11 using Monte Carlo simulations. They argue that for high mass accretion rates (exceeding the Eddington limit, ) the cutoff energy is of the order of the electron rest mass, , where . Thus the case of keV indicates a significant effect of the bulk motion inflow, which, in turn, points to the presence of a BH event horizon.
We also find different spectral index saturation levels for different outbursts (see panel of Figure 10). Furthermore, complex flaring events during the longest activity period, 2003 – 2004 exhibit a number of close but clearly separated levels. The 2003 outburst (MJD=52681.8 – 52689.1) is characterized by a low saturation level of ( stars in Figure 10). The index saturation value is probably related to a value of of the converging inflow electron temperature . Namely, increases when decreases (see LT99 and LT11). The same behavior was found by ST09 in XTE 1550-564 for multiple state transitions during 1998 outburt.
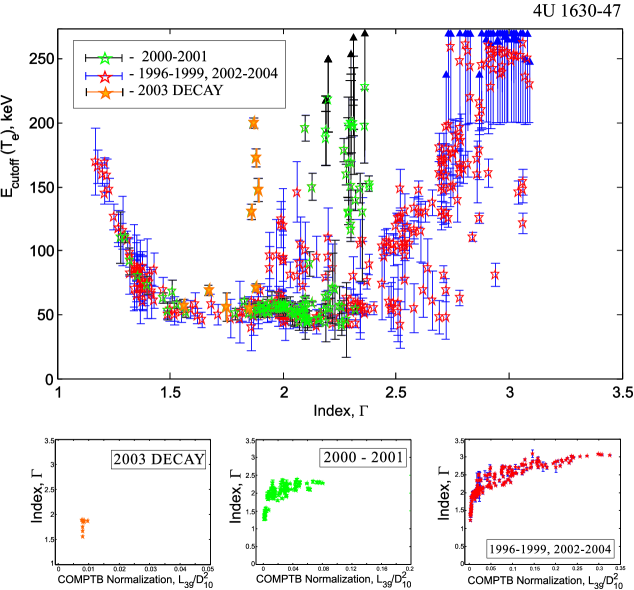
7.2 On the non-monotonic behavior of the cutoff energy versus index
Our spectral analysis reveals a non-monotonic behavior of the cutoff energy versus index (see Fig. 10). In the upper panel of this Figure we demonstrate how changes with . At low values of the index, () the cutoff energy decreases and reaches its minimum in the 50 – 80 keV range. Then for the energy starts to increase again. Similar behavior of vs was predicted by LT11 based on Monte-Carlo simulations.
The track during the 2000 – 2002 outbursts, at the 2003 decay and during the 1996 – 1999 & 2002 – 2004 outbursts were different from each other (see Fig. 10). Namely, the saturation levels for 2000 – 2001 and 2003 (decay) spectra were lower ( and , respectively) than that for other spectra for which . It is interesting to note that the 2000 – 2001 data ( points) lie close to the 1996 – 1999 and 2002 – 2004 outburst data for LHS-IS transitions ( points). This indicates that during rise episodes similar accretion regimes are operating for all outbursts. Then, starts to increase and the index saturates at different values of for each of the outbursts: ( stars for 2000 – 2001 outbursts), [ stars for 2003 (decay) outburst] and ( stars) for the remaining 1996 – 1999 and 2002 – 2004 outbursts (see Fig. 10). According to the LT11 Monte Carlo simulations different index saturation levels are caused by different values of the electron temperature , where higher correspond to the lower values of . In other words at higher mass accretion rate the plasma temperature and consequently an efficiency of thermal Comptonization substantially decreases. In this case the bulk motion Comptonization dominates over the thermal one forcing to be shifted to higher values.
The dependence shown by 4U 1630–47 is strikingly similar to those discovered in GX 334-9 by Motta et al. (2009) and subsequently reported in XTE J1550-564 by Titarchuk & Shaposhnikov (2010). Especially remarkable is the resemblance of the track shown in Fig. 10 for 4U 1630–47 to that for XTE J1550-564 (see Fig. 4 in Titarchuk & Shaposhnikov, 2010). Therefore, the presented correlations between cutoff energy and index for 4U 1630–47 add yet another aspect of similarity of this source with other BHC sources.
7.3 Determination of BH mass in 4U 1630–47
In this Section we apply the scaling technique developed in ST07 and ST09 to make a BH mass estimate for 4U 1630-47 based on X-ray data. Note that BH mass evaluation for this object is impossible by any traditional dynamical methods based on optical data because of large visual extinction towards the source.
We carry out a scaling analysis of 4U 1630-47 with a number of sources such as XTE J1550-564, H 1743-322 as well as GRO J1655-40 to give cross-check results. It is worth noting that we can proceed with this scaling technique if the correlations between these particular sources are self-similar. In other words, we implement this scaling technique when the given correlations have: i) the saturation part at high -level of corresponding track, ii) the same index saturation levels and iii) the same slopes as an index function of QPO frequency.
7.3.1 Scaling of 4U 1630-47 with XTE J1550-564
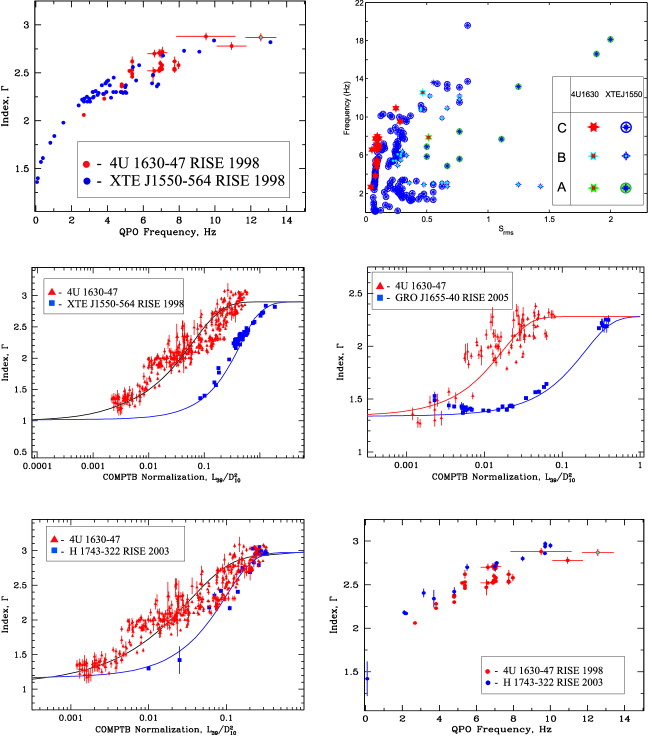
The X-ray nova XTE J1550-564 is a well-studied BHC XRB with one of the best measured mass and distance among known stellar mass BH sources (see Table 5). Note that the scaling between 4U 1630-47 and XTE J1550-564 can be implemented using 1998 rise outburst data of XTE J1550-564 observed with RXTE. This 1998 rise outburst was previously discussed in detail by many authors [see, for example, Remillard et al. (2002), hereafter R02, and ST09]. R02 and ST09 implemented a deep timing and spectral analysis for RXTE data collected during the rise outburst (time) interval from 08/09/98 to 16/10/98 (MJD 51069 - 51105). Remillard et al. found the type-C LFQPOs in the power spectra and investigated the behavior of QPO frequency as a function of the total rms amplitude. Casella et al. (2005) noted that all these type A, B and C QPOs, in particular, for XTE J1550-564 forms the corresponding tracks at proper areas in the diagram of QPO frequency versus the inverse of the (hereafter , see panel on the column of Fig. 11).
ST09 revealed a change of the photon index from 1.4 to 2.9 in the X-ray spectra of XTE J1550-564. increases when the type C LFQPO increases forming a characteristic correlation having the saturation part at high value (8 – 13 Hz) of LFQPO (ST09, see also a top panel on the left column of Fig. 11) with . It is interesting that the spectral index also shows a positive correlation with the normalization parameter (proportional to mass accretion rate) along with the saturation plateau at the same level at high values of the normalization parameter. This behavior of XTE J1550-564 during outburst rise is similar to the evolution of spectral and timing parameters of 4U 1630-47 in terms of -Norm and -LFQPO diagrams. The saturation levels and the slopes of corresponding correlation tracks as a function of QPO frequency and the spectral normalization are the same (see top and panels of the column in Fig. 11).
In order to proceed with the scaling procedure we parametrize the correlation pattern -Norm/-QPO frequency for a reference transition in terms of the analytical function
| (1) |
By fitting this functional expression to the correlation pattern, we find a set of parameters A, B, D, , and that represent a best-fit form of the function for a particular correlation curve. For , the correlation function F(x) converges to a constant value A. Consequently, A is the value of the index saturation level, is the power-law index of the inclined part of the curve and is the value at which the index transitions, i.e. levels offset. Parameter D determines how smoothly the fitted function saturates to A. We scale the data to a template by applying a transform until the best fit is found.
XTE J1550-564, has a reliable dynamical mass determination of 9.51.1 M⊙, (Orosz et al., 2002), which corroborates our scaling method which gives the value of 10.71.5 M⊙ (see ST09). We use the Norm correlation and the scaling BH mass as a reference data in our subsequent analysis. The reference data set is well represented by the function defined in Eq. (1). We fit to best represent the XTE J1550-564 Norm track varying the parameters A, , . To test for self consistency we have used the chi-squared statistical minimization method to determine the best fit parameter values. Parameters D and B are not well constrained by the data. Therefore, we fix those parameters at 1.0 and 0.6 respectively based on our previous experience with correlation parameterization (Table 4 of ST09). The best-fit approximations by the analytical function (Eq. 1) are presented in Fig. 11 along with observational data. As a result, for free parameters we obtain the following best-fit values: A=2.940.08 (saturation level), , . We then obtain the scale factor .
The second scaling factor is followed from the scaling law
| (2) |
which based on the inverse dependence of the QPO frequencies on BH mass in terms of the Transition layer model (see details in TLM98; TF04; Appendix A of ST09) using the scaling of the photon index vs QPO frequency correlation. Here is BH mass of the reference source (XTE J1550-564), is BH mass of the target source (4U 1630–47). Subscripts and of frequency denote the reference and target sources, respectively.
As it is seen from Figure 11 (top left panel) the index-QPO frequency diagram for 4U 1630–47 (blue points) follows that for XTE J1550-564 (red points). Thus, the index-QPO frequency diagrams for both sources are nearly equivalent. In this way, one obtains that the scaling factor and the mass of target source (4U 1630–47) using Eq. (2) is . Assuming the mass estimate of 9.51.1 M⊙ (Orosz et al. 2002) we estimate a BH mass for 4U 1630-47 (see Table 5).
Note that -QPO correlation is independent of the distances and the geometrical factors such as an inclination angle (see Eg. 2), while -Norm correlation is closely related to these parameters. Thus using the mass estimate 9.51.1 M⊙ for 4U 1630–47 we have an opportunity to evaluate the inclination angle for this source 4U 1630-47 using the -Norm scaling.
According to the scaling laws (see Eqs. 8-9 in ST09), the expression for geometrical factor in 4U 1630-47 is:
| (3) |
where geometric factor, by definition (ST09), , inclination angles , and , are distances to the reference and target sources. Furthermore, if we know mass (see Eq. 2) and the scaling index we can find an inclination angle for the target source, 4U 1630–47 using a formula for and values of parameters ( and ) for XTE J1550-564
| (4) |
We show the estimated values of BH mass and the inclination angle with the proper error bars for the target source (4U1630–47) along with parameters for the reference source (XTE J1550-564) in Table 5.
It is interesting that there are many indications obtained by other methods in a favor of high inclination value for the binary 4U 1630-47 . Recently, Muoz-Darias et al. (2013) give clear indications on a high inclination of 4U 1630 based on the RXTE observations during outburst transitions. They find significant difference in the shape of the tracks that high inclination systems display in the color/luminosity diagrams from that of low inclination systems.
Note that the derived estimate of the inclination angle in 4U 1630–47 predicts that deep orbital eclipses should be absent. In fact, X-ray observations of the source do not show any strictly recurrent dip events. However, this does not exclude a possibility of partial orbital eclipses. Furthermore, the presence of a wind from the accretion disk can result in an absorption of the X-ray emergent radiation due to a high optical depth in a wind envelope. This picture is consistent with an absorption line detection in X-ray high-resolution spectra of 4U 1630–47 with [Kubota et al. (2007)] who find that these X-ray spectra reveal strong absorption lines from highly ionized (H-like and He-like) iron Kα at 7.0 keV and 6.7 keV. A possible origin of these lines can be associated with an outer part of the accretion disk.
A number of X-ray binaries have been found to show absorption lines originated from highly ionized elements (Boirin et al. 2004). These types of sources ranges from microquasars, e.g. GRO J1655-40 (e.g., Miller et al. 2006; Yamaoka et al. 2001; Ueda et al. 1998) to LMXB, e.g. GX 13+1 (Sidoli et al. 2002; Ueda et al. 2004). All of them are viewed at high inclination angles.
In addition, the detection of a dip in the X-ray light curve of 4U 1630–47 during the 1996 outburst (see Kuulkers et al. 1998) indicates that the inclination of the system is fairly high, which is similar to GRO J1655-40. This single dip (140 seconds of time duration) during 1996 outburst (Kuulkers, 1998) could be caused by inner conditions such as the attenuation (screening) of X-ray region by inner structures of the accretion disk, a sporadic (irregular) absorption the clumping in the wind, by high current inclination due to disk precession and so on. However, after the 1996 outburst no more similar dips were detected.
One can conclude that the detection of a single isolated dip (possibly partial orbital eclipse) in the 1996 outburst can indicate a high orbital inclination angle (). On the other hand, the inclination angle is not sufficiently high because the regular eclipses are not observed. This imposes constraint on the inclination angle .
7.3.2 Scaling of 4U 1630-47 with H 1743-322
For an additional cross-check of the mass evaluation of for BH mass in 4U 1630 we use another object, H 1743-322. Note that the -QPO and -normalization correlation curves for the 2003 rise data of H 1743-322 (taken from ST09) are self-similar with correlations that we derive for 4U 1630-47 (see Fig. 11). The 2003 outburst in H 1743-322 was detected on March 21 in hard X-rays (15 – 200 keV) by INTEGRAL (IGRJ17464-3213; Revnivtsev et al. 2003). Follow-up observations with RXTE led to the recognition that this source is a recurrent X-ray Nova which was first observed with the Ariel V All-Sky Monitor by Kaluzienski & Holt (1977). Further, the X-ray spectral and temporal properties of X-ray data as well as radio detection of large-scale relativistic X-ray jets (Corbel et al. 2005) allow to classify H 1743-322 as a BHC (Fender 2006). A transient X-ray system H 1743-322 is a source of X-ray, radio, optical and near-infrared emissions, which enable one to evaluate its parameters such as the distance, orbital inclination and BH mass (McClintock et al., 2007).
As it is seen from Table 5, H 1743-322 is characterized by almost the same BH mass as that for 4U 1630-47 (based on the mass determination by the scaling with XTE J1550-564, see the previous section). Indeed H 1743-322 and 4U 1630-47 demonstrate a similar index saturation level and -QPO correlations. (see Fig. 11). Considering that a BH mass for H 1743-322 () we can also confirm our BH mass estimate for 4U 1630-47.
Moreover, these two sources have the same geometrical parameters (distances and inclination angles). In this case their -Norm tracks should also resemble each other. As seen from Figure 11, the correlation tracks for both objects are similar, showing the same saturation levels. However, -Norm correlation for H 1743-322 is located to the right from that for 4U 1630-47. We apply Eq. (2) to -QPO correlations for 4U 1630-47 and H1743-322 (bottom right panel of Fig. 11) to obtain . We thus estimate that . We can also estimate in 4U 1630-47 using -Norm correlations (bottom left panel of Fig. 11) if we use (, McClintock et al. 2007) for the reference source in Eq. (3) assuming (namely, inclinations for both objects are the same, degrees), , kpc, kpc .
Note that spectral and temporal evolution of H 1743-322 is similar to that observed in XTE J1550-564 during 1998-1999 (Sobczak et al. 2000b; RM06) and in GRO J1655-40 during 1996-1997 (Sobczak et al. 1999; Remillard et al. 2002b; RM06).
7.3.3 Scaling of 4U 1630-47 with GRO J1655-40
The photon index for 4U 1630-47 during 2000 – 2001 period demonstrates a lower saturation level as a function of the normalization parameter (which is proportional to mass accretion rate in the disk), namely, . We can also make a BH mass estimate for 4U 1630-47 in the case of . We choose scaling of the index-normalization previously found in GRO J1655-40 (see ST09) with that in 4U 1630-47 (see Fig. 11, middle right panel).
The soft X-ray transient GRO J1655-40 (Nova Sco 1994) is a well-studied BHC XRB with the best measured mass and distance (Hjellming & Rupen et al. (1995), Greene et al. (2001), see Table 5). Note that the correlations between 4U 1630-47 and GRO J1655-40 are self-similar for the 2000 – 2001 and rise 2005 periods respectively.
Thus, using Eq. (3), we obtain that () if (inclinations for both objects are the same, namely degrees), , kpc, kpc, ().
We want to empasize that scaling of the correlations in 4U 1630-47 with that in XTE J1550-564, H 1743-322 and GRO J1655-40 sources gives the similar values of BH mass, about 10 solar masses for 4U 1630-47.
7.4 Comparison between 4U 1630–47 and GRS 1915-105
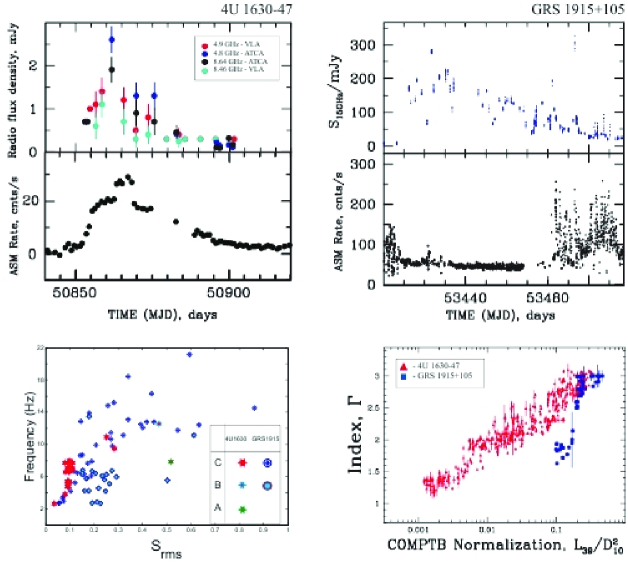
BHC binaries 4U 1630–47 and GRS 1915-105 demonstrate a number of similar spectral and timing properties, however we also would like to point out some significant differences between these objects. As a main similar signature in these objects, one can consider the same index saturation levels () and the presence of LFQPOs in the power spectra for both objects, which are classified as the type B and C QPOs. Furthermore, the properties of these QPOs are the same in terms of frequency- (the inverse of ) diagram with a very similar tracks for both objects (see bottom left panel of Fig. 13). Despite showing the same saturation levels of the index correlation with the normalization in GRS 1915+105 and 4U 1630-47 these correlations are not self-similar, (see the right bottom panel in Fig. 13) and we cannot estimate BH mass in 4U 1630-47 using scaling with GRS 1915+105. Specifically, the index-normalization diagrams have a different shapes: GRS 1915+105 are characterized by a stepper gradient of the index vs the normalization parameter than that for 4U 1630-47. In fact, 4U 1630-47 shows a lower level of the index range () than that in GRS 1915+105 where the index never reaches the canonical LHS value, , see e.g. Fender & Belloni (2004).
Also we should also point to different patterns in the radio/X-ray behavior for these objects. Namely, when we compare radio loud phases [at MJD=50855 – 50865 for 4U 1630–47, see Fig. 13 (top left panel) and MJD=50910 – 51000 for GRS 1915+105, see top right panel there with the almost constant X-ray flux (so called “” states). The peak of radio emission in GRS 1915 at 15 GHz, occurs at relatively low X-ray count rate [Soleri et al., 2008]) while the peak of radio emission (4-9 GHz), in 4U 1630-47 is directly related to maximal X-ray count rate (Hjellming et al., 1999).
Note also that these objects sometimes demonstrate properties which are difficult to classify in terms of the canonical spectral states (McClintock & Remillard, 2003). Some anomalous properties are similar for both objects. In particular, during the 1998 outburst rise 4U 1630-47 demonstrated an interesting phase which could be considered as a transition between the LHS and the VHS. On the other hand, the energy spectrum of the source was typically hard, with a well determined exponential high energy cut-off, similar to that in the low state. But the source power spectrum was a typical for the very high state. Previously, Tomsick et al. (2005) also revealed a similar anomalous state in 4U 1630-47 which also revealed a disagreement between spectral and timing properties. Specifically, in the LHS during 2003 – 2004 RXTE observations 4U 1630-47 showed spectra typical for the LHS, while the corresponding power spectra contain strong band limited noise which is rather typical to the HSS. Note also that no radio detections during the 2002 – 2004 period were reported for 4U 1630-47. All these cases are not consistent with the canonical spectral state sequence and indicate the modified spectral state transition track for 4U 1630-47. It should be also noted that similar energy spectra related to the aforementioned timing behavior were observed at the low-luminosity state of GRS 1915+105 (Trudolyubov et al. 1999a), during the rise phase in X-ray novae KS 1730-312 (Trudolyubov et al. 1996) and in GS/GRS 1124268 (Ebisawa et al. 1994).
There is also a striking resemblance between the X-ray properties of 4U 1630–47 during the rise of the 1998 outburst, and GRS 1915+105 in the LHS (see Trudolyubov, Churazov & Gilfanov 1999 and TS09) and the flaring stage in the VHS [Tomsick et al. (2005)]. Moreover, radio observations of 4U 1630–47 with the ATCA in 1998 during the brightest phase provide a detection of 28% and 26% linear polarization at 4.80 and 8.64 GHz, respectively (Hjellming et al., 1999). The large linear polarization can indicate to optically thin jet ejections in 4U 1630–47. The above similarity of X-ray spectra of 4U 1630–47 and GRS 1915 supports an idea that 4U 1630–47 is also a relativistic jet source.
8 Conclusions
We present analysis of the X-ray spectral and timing properties observed from BHC X-ray binary 4U 1630–47 during transitions between the hard and soft states. We analyze several outbursts from this source observed with BeppoSAX and RXTE satellites. We apply the scaling technique to correlations of the photon index of the Comptonized component versus a low frequency QPO and versus the mass accretion rate. We interpret the changes of the spectral states in 4U 1630–47 in terms of a dynamical evolution of the Compton cloud.
We show that the X-ray broadband energy spectra of 4U 1630–47 during all spectral states can be modeled by a combination of a thermal component, a Comptonized component, and a redskewed iron-line component. For our analysis we utilized the broad spectral coverage and resolution of detectors from 0.3 to 200 keV along with frequent monitoring and outstanding time resolution of observations in the energy range from 3 to 200 keV.
In this work we present arguments for the presence of a black hole in 4U 1630–47 based on the detailed analysis of X-ray spectral evolution in this source. We establish that the index monotonically increases during spectral transition from the low-hard state to the high-soft state and then finally saturates with the spectral normalization ).
Moreover, the photon index saturates with at several different levels for different outbursts. In the case when the photon index saturates with at the value of 3 we also find a correlations between and the centroid of low frequency QPO. ST09 give strong arguments that this index saturation is a signature of converging flow into a BH. It is important to note that the index monotonic growth and saturation at high mass accretion rates during transition from the low-hard to high-soft states has been recently demonstrated for many other BH candidates sources, GX 339-4, GRO J1655-40, XTE J1650-500, 4U 1543-47, XTE J1550-564, H 1743-322, XTE J1859+226 (ST09), GRS 1915+105 (TS09), SS 433 (ST10)]. In view of these results thus we suggest the presence of BH in 4U 1630–47.
We also find that the Comptonized fraction spans a wide range from 0.05 to 1, which points to variable X-ray illumination of the Compton cloud in 4U 1630–47 during state transitions. Furthermore, we argue that the changes of are related to state transitions, which are presumably governed by mass accretion regime.
Correlations between spectral and timing properties allow us to estimate a BH mass in 4U 1630–47 which is around 10 solar masses and the inclination angle applying the scaling method and using BHC XTE J 1550-564 as the reference source.
We acknowledge valuable comments by Chris Shrader during the revision of this Paper. We also appreciate the detailed discussion with the referee on the manuscript content.
References
- Belloni et al. (2005) Belloni, T., et al. 2005, A&A, 440, 207
- Basko et al. (1974) Basko, M. M., Sunyaev, R.A. & Titarchuk, L. G. 1974. A&A, 31, 249
- Belloni et al. (1999) Belloni T., Mendez M., van der Klis M., Lewin W. H. G., Dieters S., 1999, ApJ, 519, L159
- Boella et al. (1997) Boella, G. et al. 1997, A&AS, 122, 327
- Bradt et al. (1993) Bradt, H.V., Rothschild, R.E. & Swank, J.H. 1993, A&AS, 97, 355
- Callanan et al. (2000) Callanan, P.J., McCarthy, J.F. and Garcia, M.R. 2000, Astron. Astrophys. 355, 1049
- Chakrabarti & Titarchuk (1995) Chakrabarti, S. K., Titarchuk, L. G., 1995, ApJ, 452, 226
- Chen et al. (1997) Chen W., Shrader C. R., Livio M., 1997, ApJ, 491, 312
- Corbel et al. (2013) Corbel S. et al. 2013, MNRAS, 431, L107
- Corbel et al. (2005) Corbel, S., Kaaret, P., Fender, R. P., Tzioumis, A. K., Tomsick, J. A., & Orosz, J. A. 2005, ApJ, 632, 504
- Cui et al. (2000) Cui, W. Chen, W. & Zhang, S. 2000, ApJ, 529, 952
- Cui et al. (1998) Cui W., Ebisawa K., Dotani T., Kubota A., 1998, ApJ, 493, L75
- Dieters et al. (2000) Dieters, S. W. et al., 2000, ApJ, 538, 307
- Fender (2006) Fender, R.P. 2006, Jets from X-ray binaries. In Compact stellar X-ray sources, Eds. W. Lewin & M. van der Klis, Cambridge Astrophysics Series No. 39 Cambridge University Press, p. 381-419
- Daz Trigo et al. (2013) Daz Trigo, M., Miller-Jones, J. C. A., Migliari, S., Broderick, J. W. & Tzioumis, T. 2013, Nature, published online on 13/11/13; doi:10.1038/nature12672 (astro-ph/arXiv1311.5080)
- Greene et al. (2001) Greene, J., Bailyn, C. D., & Orosz, J. A. 2001, ApJ, 554, 2, 1290
- Grove et al. (1998) Grove, J. E., Johnson, W. N., Kroeger, R. A., McNaron-Brown, K., Skibo, J. G., & Phlips, B. F. 1998, ApJ, 500, 899
- Hjellming et al. (1999) Hjellming R.M., Rupen M.P., Mioduszewski A.J., et al., 1999, ApJ, 514, 383
- Hjellming & Rupen et al. (1995) Hjellming, R.M., & Rupen, M.P. 1995, Nature, 375,464
- Homan & Wijnands (2002) Homan, J., & Wijnands, R. 2002, Astron. Telegram, 109
- Hynes et al. (2004) Hynes, R. I., Steeghs, D., Casares, J., Charles, P. A., & O’Brien, K. 2004, ApJ, 609, 317
- Jones et al. (1976) Jones, C., Forman, W., & Tananbaum, H. 1976, ApJ, 210, L9
- Farinelli et al. (2008) Farinelli, R., Titarchuk, L., Paizis, A. & Frontera, F. 2008, ApJ, 680, 602, (F08)
- Farinelli & Titarchuk (2011) Farinelli, R., & Titarchuk, L. 2011, A&A, 525, A102
- Fender et al., (2004) Fender, R.P., Belloni, T. M. & E. Gallo, E. 2004, MNRAS, 355, 1105
- Frontera et al. (1997) Frontera, F. et al. 1997, SPIE, 3114, 206
- Grindlay et al. (2014) Grindlay, J., Miller, G.F. & Tang, S. 2014, AAS meeting 223, 406.06
- Kaluzienski & Holt (1977) Kaluzienski, L. J., & Holt, S. S. 1977, IAUC 3099
- Klein-Wolt & van der Klis (2008) Klein-Wolt, M., & van der Klis, M. 2008, ApJ, 675, 1407
- Koljonen et al. (2013) Koljonen, K. I. I., McCollough, M. L., Hannikainen, D. C., Droulans, R. 2013, MNRAS, 429, 1173
- Kubota et al. (2007) Kubota, A. et al, 2007, PASJ, 59, 185
- Kuulkers (1998) Kuulkers, E. 1998, NewA Rev., 42, 1
- Kuulkers et al. (1998a) Kuulkers, E., Wijnands, R., Belloni, T., Mndez, M., van der Klis, M. & van Paradijs, J. 1998a, ApJ, 494, 753
- Kuulkers et al., (1997) Kuulkers E., Parmar A. N., Kitamoto S., Cominsky L. R., Sood R. K., 1997, MNRAS, 291, 81
- Laor (1991) Laor, A. 1991, ApJ, 376, 90
- Landau & Lifshitz (1976) Landau, L.D. & Lifshitz, E. M. 1976, Mechanics, Third Edition; Volume 1 (Course of Theoretical Physics), Elsevier Butterworth-Heinemann
- Laurent & Titarchuk (2011) Laurent, P., & Titarchuk, L. 2011, ApJ, 727, 34L
- Laurent & Titarchuk (2007) Laurent, P., & Titarchuk, L. 2007, ApJ, 656, 1056 (LT07)
- Laurent & Titarchuk (1999) Laurent, P., & Titarchuk, L. 1999, ApJ, 511, 289 (LT99)
- Levine et al. (1996b) Levine, A.H., Bradt, H., Chakrabarty, D. et al. 1996, IAU Circ., 6390
- Lewin et al. (1997) Lewin, W. H. G., van Paradijs, J. & Taam, R.E. 1997, in X-ray Binaries, eds. W. H. G. Lewin, J. van Paradijs, and E. P. J. van den Heuvel, Cambridge: Cambridge University Press. p 175
- Marshall (1996) Marshall, F.E., 1996, IAU Circ., 6389
- McClintock et al. (2007) McClintock, J. E., Remillard, R. A., Rupen, M. P., Torres, M. A. P., Steeghs, D., Levine, A. M., & Orosz, J. A. 2007, ArXiv e-prints, 705, arXiv:0705.1034
- Mineo et al. (2012) Mineo, T., Massaro, E., D’Ai, A. et al., 2012, A&A, 537, 18
- Motta et al. (2009) Motta, S., Belloni, T., & Homan, J. 2009, MNRAS, 400, 1603
- Muoz-Darias et al. (2013) Muoz-Darias, T., Coriat, M., Plant, D. S., Ponti, G., Fender, G. R. P. and Dunn, R. J. H., 2013, MNRAS, in press [arXiv:1304.2072]
- Muoz-Darias et al., (2008) Muoz-Darias, T., Casares, J., & Martnez-Pais, I. G. 2008, MNRAS, 385, 2205
- Mitsuda K. et al. (1984) 1984, PASJ, 36, 741
- Oosterbroek et al. (1998) Oosterbroek, T., Parmar, A. N., Kuulkers, E., Belloni, T., van der Klis, M., Frontera, F., & Santangelo, A. 1998, A&A, 340, 431
- Orosz (2003) Orosz, J. A. 2003, A Massive Star Odyssey: From Main Sequence to Supernova, 212, 365
- Orosz et al. (2002) Orosz, J. A. et al. 2002, ApJ, 568, 84
- Parmar et al. (1997) Parmar, A.N., Williams, O.R., Kuulkers, E., Angelini, L., White, N.E., 1997, A&A, 319, 855
- Parmar et al. (1995) Parmar A. N., Angelini L., White N. E., 1995, ApJ, 452, L129
- Parmar et al. (1986) Parmar, A. N., Stella, L., & White, N. E. 1986, ApJ, 304, 664
- Ponti et al. (2012) Ponti, G., Fender, R. P., Begelman, M. C., Dunn, R. J. H., Neilsen, J. & Coriat, M. 2012, MNRAS, 422L, 11
- Priedhorsky (1986) Priedhorsky, W., 1986, A&SS, 126, 89
- Remillard & McClintock (2006) Remillard, R. A., & McClintock, J. E. 2006, ARAA, 44, 49 (RM06)
- Remillard et al. (2002) Remillard, R. A., Sobczak, G. J., Muno, M. P., & McClintock, J. E. 2002b, ApJ, 564, 962
- Revnivtsev et al. (2003) Revnivtsev, M., Chernyakova, M., Westergaard, N. J., Shoenfelder, V., Gehrels, N., & Winkler, C. 2003, Astron. Telegram, 132
- Seifina, Titarchuk & Frontera (2013) Seifina, E. & Titarchuk, L. & Frontera 2013, ApJ, 766,
- Seifina & Titarchuk (2012) Seifina, E. & Titarchuk, L. 2012, ApJ, 747, 99
- Seifina & Titarchuk (2011) Seifina, E. & Titarchuk, L. 2011, ApJ, 737, 128
- Seifina & Titarchuk (2010) Seifina, E. & Titarchuk, L. 2010, ApJ, 722, 586 (ST10)
- Shakura & Sunyaev (1973) Shakura, N. I., & Sunyaev, R. A. 1973, A&A, 24, 337
- Shaposhnikov & Titarchuk (2009) Shaposhnikov, N., & Titarchuk, L. 2009, ApJ, 699, 453 (ST09)
- Shaposhnikov & Titarchuk (2007) Shaposhnikov, N., & Titarchuk, L. 2007, ApJ, 663, 449
- Shrader et al. (2010) Shrader, C.R., Titarchuk, L. and Shaposhnikov, N. 2010, ApJ, 718, 488
- Sobczak et al. (1999) Sobczak, G. J., McClintock, J. E., Remillard, R. A., & Bailyn, C. D. 1999, ApJ, 520, 776
- Sobczak et al. (1999) Sobczak, G. J., McClintock, J. E., Remillard, R. A., Cui, W., Levine, A. M., Morgan, E. H., Orosz, J. A., & Bailyn, C. D. 2000, ApJ, 544, 993
- Strohmayer & Mushotzky (2009) Strohmayer, T.E., & Mushotzky, R.F., 2009, ApJ, 703, 1386
- Stiele et al. (2013) Stiele, H., Belloni, T.M., Kalemci, E. & Motta, S. 2013, Motta, S. 2013, MNRAS, 429, 2655 (SBKM13)
- Stiener et al. (2009) Steiner J. F., Narayan R., McClintock J. E., Ebisawa K., 2009, PASP, 121, 1279
- Sunyaev, R. A., & Titarchuk (1980) Sunyaev, R. A., & Titarchuk, L. G. 1980, A&A, 86, 121
- Sunyaev et al. (1994) Sunyaev R. A. et al., 1994, Astron. Lett., 20, 777
- Tanaka & Lewin (1997) Tanaka, Y., & Lewin, W. H. G. 1995, in X-ray Binaries, eds. W. H. G. Lewin, J. van Paradijs, and E. P. J. van den Heuvel, Cambridge: Cambridge University Press, p. 126
- Tanaka & Shibazaki (1996) Tanaka Y., Shibazaki N., 1996, ARA&A, 34, 607
- Titarchuk & Osherovich (1999) Titarchuk, L., & Osherovich, V. 1999, ApJ, 518, L95
- Titarchuk & Seifina (2009) Titarchuk, L. & Seifina, E. 2009, ApJ, 706, 1463 (TS09)
- Titarchuk & Shaposhnikov (2010) Titarchuk, L., & Shaposhnikov, N. 2010, ApJ, 724, 1147
- Titarchuk et al. (2007) Titarchuk, L., Shaposhnikov, N., & Arefiev, V. 2007, ApJ, 660, 556 (TSA07)
- Titarchuk et al. (1998) Titarchuk, L., Lapidus, I.I. & Muslimov, A. 1998, ApJ, 499, 315 (TLM98)
- Titarchuk & Zannias (1998) Titarchuk, L. & Zannias, T. 1998, ApJ, 493, 863
- Tomsick et al. (2005) Tomsick, J.A. Corbel, S., Goldwurm, A. & Kaaret, Ph., 2005, ApJ, 630, 413 (T05)
- Tomsick & Kaaret (2000) Tomsick, J.A. & Kaaret, Ph., 2000, ApJ, 537, 448
- Trudolyubov et al. (2001) Trudolyubov, S.P., Borozdin, K.N & Priedhorsky, W.C, 2001, Mon. Not. R. Astron. Soc. 322, 309
- Trudolyubov et al. (1999) Trudolyubov S., Churazov E., Gilfanov M., 1999, A&A, 351, L15
- Trudolyubov et al. (1999) Trudolyubov S., Churazov E., Gilfanov M., 1999, Astron. Lett., 25, 718
- Vignarca et al. (2003) Vignarca, F., Migliari, S., Belloni, T., Psaltis, D., & van der Klis, M. 2003, A&A, 397, 729
- Zycki et al. (2001) Zycki P. T., Done C. & Smith D. A. 2001, MNRAS, 326, 1367
| N | Obs. ID | Start time (UT) | End time (UT) | MJD interval |
|---|---|---|---|---|
| S1 | 20114001 | 1998 Feb 20 04:30:02 | 1998 Feb 20 16:55:45 | 50864.2-50864.71 |
| S2 | 20114002 | 1998 Feb 24 05:32:00 | 1998 Feb 24 15:00:40 | 50868.2-50868.61 |
| S3 | 20114003 | 1998 Mar 7 12:23:21 | 1998 Mar 8 03:52:21 | 50879.5-50880.11 |
| S4 | 20114004 | 1998 Mar 19 14:52:11 | 1998 Mar 20 04:18:08 | 50891.6-50892.31 |
| S5 | 20114005 | 1998 Mar 26 17:16:48 | 1998 Mar 27 09:59:27 | 50898.7-50899.41 |
| S6 | 70566001 | 1998 Aug 6 18:10:26 | 1998 Aug 7 17:59:20 | 51031.7-51031.32 |
| S7 | 70821005 | 1999 Aug 8 19:26:53 | 1998 Aug 10 17:33:02 | 51398.8-51400.12 |
| Number of set | Dates, MJD | RXTE Proposal ID | Dates UT | Rem. | Ref. |
|---|---|---|---|---|---|
| R1 | 50114 | 00033 | 1996 Feb. 1 | ||
| 50206-50311 | 10411 | 1996 May 3 – Aug 16 | 1, 2, 3 | ||
| R2 | 50876-50972 | 30172 | 1998 Mar 4 – Jun 8 | SAX | 4, 5 |
| 50853-50903 | 30178 | 1998 Mar 9 – Mar 31 | SAX | 4, 6 | |
| 50855-50873 | 30188 | 1998 Feb 11 – Mar 1 | SAX | 4, 6 | |
| 50988-50990 | 30410 | 1998 Jun 24 – Jun 26 | |||
| R3 | 51537-51557 | 40112 | 1999 Dec 25 – 2000 Jan 14 | ||
| 51306-51405 | 40418 | 1999 May 8 – Sep 15 | SAX | ||
| R4 | 51864-51914 | 50120 | 2000 Nov 16 – 2001 Jan 5 | ||
| 51917-51978 | 50135 | 2001 Jan 8 – March 10 | |||
| 51980-52077 | 60118 | 2001 March 12 – Jun 17 | |||
| R5 | 52519-52654 | 70417 | 2002 Sep 12 – 2003 Jan 16 | 7, 8 | |
| 52658-52689 | 70113 | 2003 Jan 19 – Feb 19 | 7 | ||
| 52790-53081 | 80117 | 2003 May 31 – 2004 May 17 | 7 |
| Observational | MJD, | N | , | , | , | Eline, | , | (d.o.f.) | ||||
|---|---|---|---|---|---|---|---|---|---|---|---|---|
| ID | day | keV | keV | keV | keV | cm-2 | ||||||
| 20114001 | 50864.238 | 1.68(2) | 0.02(1) | 12.86(4) | 1.49(4) | 200 | 0.75(2) | 8.24(7) | 6.51(4) | 0.82(7) | 7.5(1) | 1.05(127) |
| 20114002 | 50868.254 | 1.62(5) | -0.18(3) | 11.83(3) | 1.48(3) | 200 | 0.74(2) | 8.76(6) | 6.42(4) | 0.81(8) | 7.8(1) | 1.16(127) |
| 20114003 | 50879.516 | 1.57(6) | -0.15(5) | 11.03(4) | 1.64(5) | 200 | 0.74(2) | 13.64(5) | 5.77(8) | 0.65(4) | 7.2(3) | 1.08(127) |
| 20114004 | 50891.620 | 1.00(1) | -0.04(2) | 1.80(2) | 1.46(6) | 50(2) | 0.75(3) | 3.98(4) | 7.19(3) | 0.16(2) | 6.6(2) | 1.10(127) |
| 20114005 | 50898.720 | 1.03(3) | 0.20(5) | 1.44(2) | 1.01(7) | 58(1) | 0.62(4) | 1.96(4) | 7.08(6) | 0.16(7) | 6.6(2) | 1.18(127) |
| 70566001 | 51031.516 | 0.97(5) | 2.0††† | 0.59(3) | 1.6(1) | 140(20) | 0.75(5) | 0.49(4) | 5.26(4) | 0.10(1) | 6.9(3) | 1.15(128) |
| 70821005 | 51398.857 | 1.01(2) | 0.02(1) | 2.20(3) | 1.6(2) | 160(50) | 0.72(9) | 0.07(2) | 5.38(5) | 0.10(2) | 6.9(1) | 0.92(127) |
† The spectral model is , †† normalization parameters of and components are in units of , where is the source luminosity in units of 1037 erg/s, is the distance to the source in units of 10 kpc and component is in units of in line, ††† when parameter , it is fixed to a value 2.0 (see comments in the text).
| Observational | MJD, | †† | N | , | Eline, | (d.o.f.) | F1/F | |||||
|---|---|---|---|---|---|---|---|---|---|---|---|---|
| ID | day | keV | keV | keV | ||||||||
| 30178-01-01-00 | 50853.057 | 1.06(1) | 48(8) | 0.92(8) | 2.18(6) | 1.00(6) | 1.06(9) | 6.10(9) | 0.63(9) | 1.41(93) | 1.97/3.17 | |
| 30178-01-02-00 | 50853.655 | 1.47(9) | 6010 | 2.00†† | 4.2(1) | 1.9(2) | 3.0(1) | 5.9(1) | 0.19(7) | 0.73(94) | 2.61/3.82 | |
| 30178-02-01-00 | 50855.046 | 1.23(1) | 5010 | 2.00†† | 8.08(9) | 1.03(9) | 1.14(5) | 6.40(6) | 0.13(6) | 1.43(94) | 5.14/5.96 | |
| 30188-02-01-00 | 50855.428 | 1.28(2) | 43(3) | 2.00†† | 8.04(5) | 1.13(8) | 3.56(9) | 6.41(3) | 0.16(6) | 1.25(94) | 5.53/6.22 | |
| 30178-01-03-00 | 50855.841 | 1.54(4) | 7020 | 1.01(9) | 7.5(1) | 1.9(1) | 7.89(9) | 5.61(5) | 0.03(8) | 0.90(93) | 6.19/6.10 | |
| 30188-02-02-00 | 50856.115 | 1.30(2) | 52(3) | 2.00†† | 8.5(1) | 1.13(9) | 4.2(1) | 6.40(6) | 0.18(6) | 0.86(94) | 5.95/6.24 | |
| 30188-02-04-00 | 50856.502 | 1.36(2) | 51(7) | 2.00†† | 9.2(1) | 1.13(8) | 4.6(1) | 6.39(2) | 0.19(4) | 1.32(94) | 6.55/6.39 | |
| 30178-01-04-00 | 50856.627 | 1.58(4) | 5010 | 1.62(9) | 7.5(1) | 1.9(2) | 7.98(9) | 5.67(3) | 0.06(9) | 1.27(93) | 6.42/6.16 | |
| 30188-02-03-00 | 50856.651 | 1.37(2) | 54(4) | 2.00†† | 8.9(1) | 1.13(9) | 4.6(1) | 6.42(6) | 0.21(9) | 1.18(94) | 6.38/6.25 | |
| 30178-02-01-01 | 50856.869 | 1.48(2) | 54(3) | 2.00†† | 10.0(1) | 1.02(9) | 3.29(5) | 6.41(7) | 0.19(6) | 1.26(94) | 6.54/6.38 | |
| 30178-01-05-00 | 50857.116 | 1.64(6) | 9020 | 2.00†† | 7.5(1) | 1.9(1) | 8.64(1) | 5.70(2) | 0.08(2) | 1.24(94) | 6.84/6.04 | |
| 30188-02-05-00 | 50857.709 | 1.58(2) | 134(7) | 0.92(1) | 9.16(9) | 1.12(9) | 4.99(8) | 6.42(3) | 0.19(6) | 0.89(93) | 6.57/5.04 | |
| 30178-02-02-00 | 50857.793 | 1.54(3) | 105(5) | 2.00†† | 10.1(1) | 1.03(8) | 4.03(8) | 6.41(5) | 0.14(7) | 0.81(94) | 6.85/5.35 | |
| 30188-02-06-00 | 50858.045 | 1.46(2) | 102(6) | 2.00†† | 9.57(9) | 1.13(9) | 4.69(9) | 6.40(6) | 0.12(7) | 0.73(94) | 6.72/5.76 | |
| 30178-01-06-00 | 50858.694 | 1.62(5) | 7020 | 2.00†† | 7.6(1) | 1.9(1) | 8.49(1) | 5.73(3) | 0.11(9) | 0.71(94) | 6.92/5.78 | |
| 30188-02-07-00 | 50858.715 | 1.49(2) | 105(8) | 2.00†† | 9.83(9) | 1.14(8) | 4.86(9) | 6.44(8) | 0.16(6) | 0.80(94) | 6.93/5.77 | |
| 30178-02-02-01 | 50858.771 | 1.53(1) | 113(6) | 2.00†† | 9.97(7) | 1.03(9) | 4.07(4) | 6.40(5) | 0.18(5) | 1.39(94) | 6.79/5.65 | |
| 30178-01-07-00 | 50859.836 | 1.72(5) | 5020 | 2.00†† | 7.6(1) | 1.85(8) | 9.19(8) | 5.89(6) | 0.08(9) | 0.73(94) | 7.28/5.35 | |
| 30188-02-08-00 | 50860.117 | 1.55(3) | 118(3) | 0.79(9) | 10.7(1) | 1.13(9) | 4.51(9) | 6.40(2) | 0.19(6) | 0.80(93) | 7.16/5.13 | |
| 30188-02-09-00 | 50860.562 | 1.60(4) | 148(7) | 2.00†† | 9.9(1) | 1.12(7) | 5.6(1) | 6.40(5) | 0.19(8) | 0.92(94) | 7.30/5.69 | |
| 30178-01-08-00 | 50860.722 | 1.70(4) | 16020 | 2.00†† | 7.7(2) | 1.9(1) | 9.46(9) | 5.50(6) | 0.11(7) | 0.82(94) | 7.40/5.97 | |
| 30178-01-09-00 | 50861.693 | 1.70(4) | 130(8) | 2.00†† | 9.26(2) | 1.67(4) | 9.26(2) | 6.41(3) | 0.19(4) | 0.94(94) | 7.37/6.02 | |
| 30188-02-10-00 | 50861.723 | 1.52(2) | 125(2) | 2.00†† | 9.98(9) | 1.13(8) | 5.5(1) | 6.40(2) | 0.19(6) | 0.93(94) | 7.36/5.98 | |
| 30178-01-10-00 | 50862.653 | 1.71(4) | 165(5) | 2.00†† | 7.85(2) | 2.0(2) | 9.52(2) | 6.41(6) | 0.14(6) | 0.95(94) | 7.50/5.88 | |
| 30188-02-11-00 | 50862.704 | 1.51(2) | 125(3) | 2.00†† | 10.1(1) | 1.12(8) | 5.7(1) | 6.41(4) | 0.11(5) | 0.94(94) | 7.41/6.04 | |
| 30178-02-03-00 | 50862.765 | 1.54(1) | 96(4) | 2.00†† | 10.95(9) | 1.07(9) | 5.05(9) | 6.40(5) | 0.13(3) | 1.09(94) | 7.65/6.22 | |
| 30178-01-11-00 | 50863.695 | 1.71(4) | 127(7) | 0.64(9) | 9.50(1) | 1.7(2) | 12.38(1) | 6.43(4) | 0.18(5) | 0.93(93) | 9.40/5.44 | |
| 30188-02-12-00 | 50863.712 | 1.87(3) | 18020 | 0.66(8) | 14.7(1) | 1.12(8) | 5.5(1) | 6.41(4) | 0.21(8) | 0.90(93) | 9.46/5.51 | |
| 30188-02-13-00 | 50864.185 | 1.87(4) | 125(4) | 0.91(9) | 15.97(1) | 1.13(9) | 5.8(1) | 6.47(3) | 0.19(5) | 0.87(93) | 10.30/7.24 | |
| 30188-02-14-00 | 50864.320 | 1.92(3) | 200 | 1.3(1) | 12.9(1) | 1.14(7) | 5.91(8) | 6.45(5) | 0.15(6) | 1.06(93) | 8.46/6.00 | |
| 30178-01-12-00 | 50864.630 | 1.70(2) | 130(4) | 0.28(3) | 9.22(6) | 1.93(8) | 13.99(9) | 6.46(2) | 0.17(8) | 1.09(93) | 9.54/5.43 | |
| 30188-02-15-00 | 50865.046 | 1.73(4) | 125(7) | 0.9(1) | 15.98(7) | 1.13(9) | 5.7(1) | 6.40(6) | 0.19(6) | 0.72(93) | 10.24/6.82 | |
| 30188-02-16-00 | 50865.320 | 1.69(3) | 161(9) | 1.7(1) | 11.48(9) | 1.12(6) | 6.1(1) | 6.44(4) | 0.13(3) | 0.94(93) | 8.32/5.90 | |
| 30188-02-17-00 | 50866.639 | 1.70(4) | 172(3) | 0.25(4) | 18.0(1) | 1.12(7) | 6.0(1) | 6.48(5) | 0.19(6) | 1.21(93) | 9.70/5.76 | |
| 30178-01-13-00 | 50867.497 | 1.72(3) | 20040 | 0.27(7) | 8.34(9) | 1.92(9) | 14.36(9) | 6.41(4) | 0.14(9) | 0.86(93) | 9.64/5.44 | |
| 30188-02-18-00 | 50868.568 | 1.88(2) | 200 | 0.28(4) | 15.6(1) | 1.14(2) | 3.0(1) | 6.40(2) | 0.19(6) | 1.15(93) | 9.11/4.66 | |
| 30188-02-19-00 | 50869.650 | 1.78(4) | 20020 | 0.05(2) | 17.7(1) | 1.12(7) | 6.04(9) | 6.42(3) | 0.17(1) | 1.23(93) | 9.13/4.79 | |
| 30188-02-20-00 | 50870.181 | 1.44(1) | 7020 | 2.00†† | 5.7(1) | 1.13(5) | 7.7(1) | 6.40(4) | 0.19(6) | 1.13(94) | 5.43/3.97 | |
| 30178-01-14-00 | 50870.978 | 1.70(2) | 15030 | 2.00†† | 4.93(9) | 1.98(3) | 11.57(9) | 6.41(5) | 0.18(7) | 0.76(94) | 6.15/3.77 | |
| 30188-02-21-00 | 50871.257 | 1.53(1) | 10030 | 2.00†† | 5.9(1) | 1.13(9) | 8.5(1) | 6.43(4) | 0.19(6) | 0.93(94) | 6.22/3.64 | |
| 30188-02-21-01 | 50871.410 | 1.49(2) | 10010 | 2.00†† | 5.97(9) | 1.11(7) | 7.9(1) | 6.40(4) | 0.12(5) | 0.91(94) | 6.13/3.96 | |
| 30188-02-22-00 | 50872.841 | 1.51(3) | 103(7) | 2.00†† | 4.87(4) | 1.99(7) | 8.9(1) | 9.47(1) | 0.19(6) | 0.94(94) | 5.84/4.10 | |
| 30188-02-23-00 | 50873.138 | 1.52(2) | 126(5) | 2.00†† | 4.61(4) | 1.47(9) | 10.0(1) | 8.46(7) | 0.11(5) | 0.74(94) | 6.15/3.35 | |
| 30178-01-15-00 | 50874.516 | 1.54(8) | 10020 | 0.3(1) | 8.92(1) | 1.40(3) | 7.77(9) | 6.40(4) | 0.08(6) | 1.19(93) | 6.97/4.19 | |
| 30172-01-01-01 | 50876.184 | 1.34(4) | 56(5) | 0.49(9) | 7.0(1) | 0.99(6) | 4.1(2) | 6.41(1) | 0.06(2) | 0.63(94) | 5.22/3.68 | |
| 30172-01-01-02 | 50877.186 | 1.29(2) | 43(2) | 0.10(2) | 9.59(3) | 1.05(4) | 6.74(9) | 6.43(2) | 0.03(1) | 0.82(94) | 5.13/3.98 | |
| 30172-01-01-03 | 50880.378 | 1.61(3) | 12020 | 0.27(7) | 12.6(2) | 1.11(6) | 5.51(8) | 6.40(1) | 0.04(8) | 0.66(94) | 6.58/4.72 | |
| 30172-01-01-04 | 50881.378 | 1.69(2) | 5010 | 0.33(8) | 14.1(2) | 1.05(8) | 1.8(1) | 6.49(4) | 0.03(4) | 1.12(93) | 7.33/4.78 | |
| 30178-01-16-00 | 50881.580 | 1.54(8) | 13010 | 0.3(1) | 8.92(1) | 1.4(1) | 7.77(9) | 6.40(6) | 0.19(6) | 1.11(93) | 6.96/4.19 | |
| 30172-01-01-00 | 50883.847 | 1.51(7) | 6030 | 0.01(1) | 4.8(1) | 1.01(6) | 5.0(1) | 6.44(1) | 0.02(1) | 1.01(94) | 4.24/1.70 | |
| 30178-01-17-00 | 50884.981 | 1.45(3) | 10020 | -0.29(8) | 7.89(5) | 1.00(3) | 3.81(9) | 6.40(9) | 0.19(6) | 0.95(93) | 3.88/1.76 | |
| 30172-01-02-01 | 50885.146 | 1.20(1) | 60(8) | -0.18(2) | 6.14(4) | 1.10(8) | 9.84(5) | 6.41(1) | 0.04(1) | 0.86(93) | 3.55/2.14 | |
| 30172-01-02-00 | 50885.805 | 1.27(2) | 55(3) | -0.10(2) | 5.79(7) | 1.10(7) | 10.0(1) | 6.40(3) | 0.02(4) | 0.98(93) | 3.44/2.06 | |
| 30172-01-03-00 | 50887.714 | 1.22(1) | 43(4) | -0.07(3) | 4.6(1) | 1.07(5) | 4.41(9) | 6.43(2) | 0.03(2) | 1.04(93) | 3.08/1.75 | |
| 30178-01-18-00 | 50889.714 | 1.30(3) | 55(4) | -0.23(5) | 4.74(6) | 1.00(3) | 3.48(7) | 6.44(6) | 0.19(6) | 1.07(93) | 2.90/1.34 | |
| 30172-01-05-00 | 50891.646 | 1.13(1) | 43(2) | -0.07(4) | 3.21(8) | 1.07(5) | 4.02(8) | 6.41(1) | 0.03(1) | 1.35(93) | 2.27/1.35 | |
| 30172-01-04-00 | 50892.584 | 1.15(2) | 41(5) | -0.11(4) | 3.15(8) | 1.07(6) | 4.01(8) | 6.40(2) | 0.04(3) | 1.35(93) | 2.22/1.28 | |
| 30172-01-06-00 | 50893.719 | 1.17(3) | 50(7) | -0.36(9) | 4.04(5) | 0.99(4) | 2.91(7) | 6.45(6) | 0.02(1) | 0.89(93) | 2.09/1.09 | |
| 30172-01-07-00 | 50895.651 | 1.11(2) | 45(2) | 0.39(6) | 1.86(8) | 1.23(9) | 2.67(9) | 6.50(1) | 0.07(2) | 1.14(93) | 1.62/1.35 | |
| 30178-01-19-00 | 50897.802 | 1.15(2) | 48(6) | 0.36(4) | 2.44(5) | 1.00(3) | 2.70(8) | 6.42(3) | 0.19(6) | 1.05(93) | 1.40/1.15 | |
| 30172-01-08-00 | 50899.001 | 0.96(5) | 56(6) | 0.03(2) | 1.82(9) | 1.30(9) | 3.38(9) | 6.50(1) | 0.06(1) | 1.22(93) | 1.36/1.10 | |
| 30172-01-08-02 | 50900.675 | 1.01(3) | 50(7) | 0.18(6) | 1.6(1) | 1.31(8) | 2.9(1) | 5.74(6) | 0.07(2) | 0.85(93) | 1.15/1.04 | |
| 30410-02-06-00 | 50900.747 | 1.00(4) | 9020 | 2.00†† | 3.14(1) | 1.27(9) | 3.0(1) | 5.9(1) | 0.01(9) | 1.17(94) | 0.18/0.34 | |
| 30178-01-20-00 | 50903.139 | 1.08(3) | 51(5) | -0.01(1) | 1.90(5) | 1.00(3) | 2.38(9) | 6.40(5) | 0.19(6) | 1.29(93) | 1.08/0.93 | |
| 30172-01-08-03 | 50904.209 | 1.17(4) | 50(8) | -0.12(4) | 1.87(2) | 1.01(8) | 3.1(1) | 6.34(6) | 0.07(5) | 1.01(93) | 1.02/0.85 | |
| 30172-01-09-00 | 50904.525 | 0.91(3) | 51(1) | 0.08(2) | 1.5(1) | 1.29(5) | 3.58(2) | 6.36(7) | 0.04(6) | 1.05(93) | 1.00/0.96 | |
| 30172-01-10-00 | 50906.513 | 0.99(1) | 50(3) | 0.2(1) | 1.6(1) | 1.20(4) | 3.67(9) | 6.56(6) | 0.08(3) | 1.39(93) | 0.92/1.08 | |
| 30172-01-11-00 | 50907.511 | 1.00(1) | 49(5) | 0.17(8) | 1.57(9) | 1.24(3) | 3.76(5) | 6.57(3) | 0.11(6) | 1.20(93) | 0.89/1.04 | |
| 30172-01-12-00 | 50909.410 | 1.00(2) | 50(3) | 0.11(4) | 1.59(7) | 1.00(5) | 3.88(2) | 5.9(2) | 0.07(5) | 0.91(93) | 0.89/0.98 | |
| 30172-01-13-00 | 50911.309 | 1.06(3) | 44(4) | -0.07(8) | 1.6(1) | 1.09(3) | 3.91(9) | 6.5(1) | 0.09(6) | 0.73(93) | 0.91/0.73 | |
| 30172-01-14-00 | 50913.311 | 1.00(1) | 51(2) | -0.22(5) | 1.54(9) | 1.11(2) | 3.6(1) | 5.98(9) | 0.03(7) | 0.69(93) | 0.88/0.61 | |
| 30172-01-08-04 | 50921.580 | 0.93(7) | 50(6) | 0.10(8) | 1.74(5) | 1.01(9) | 3.49(9) | 6.34(6) | 0.05(6) | 1.14(93) | 0.96/1.15 | |
| 30172-01-15-00 | 50923.598 | 1.05(2) | 55(3) | -0.13(4) | 1.91(9) | 1.08(2) | 3.61(6) | 7.6(2) | 0.01(3) | 0.73(93) | 0.96/0.82 | |
| 30172-01-16-00 | 50924.744 | 1.03(2) | 47(2) | -0.09(4) | 2.1(1) | 1.09(3) | 3.24(6) | 6.8(1) | 0.06(8) | 1.00(93) | 1.01/0.97 | |
| 30172-01-17-00 | 50925.857 | 1.03(4) | 5010 | 0.13(7) | 1.7(1) | 1.06(8) | 2.38(9) | 6.82(8) | 0.02(6) | 1.03(93) | 1.05/1.03 | |
| 30172-01-17-01 | 50926.653 | 0.89(3) | 6010 | 0.06(3) | 1.9(1) | 1.07(7) | 2.4(1) | 6.79(3) | 0.01(5) | 1.00(93) | 1.10/1.19 | |
| 30172-01-17-02 | 50927.722 | 1.1(1) | 7220 | 0.03(3) | 1.82(9) | 1.05(9) | 2.6(1) | 6.80(4) | 0.06(3) | 0.99(93) | 1.17/0.95 | |
| 30172-01-17-03 | 50928.591 | 1.22(6) | 9020 | 0.05(4) | 1.98(9) | 1.01(7) | 2.48(9) | 6.83(8) | 0.04(6) | 1.10(93) | 1.19/0.90 | |
| 30172-01-17-04 | 50929.657 | 1.10(6) | 10020 | -0.04(2) | 2.0(1) | 1.07(6) | 2.64(7) | 6.84(5) | 0.05(5) | 0.90(93) | 1.22/0.93 | |
| 30172-01-17-05 | 50930.657 | 1.07(6) | 9020 | -0.13(7) | 2.2(1) | 1.05(7) | 2.82(9) | 6.80(8) | 0.03(6) | 0.89(93) | 1.28/0.92 | |
| 30172-01-17-06 | 50931.859 | 1.09(7) | 5010 | 0.09(7) | 1.7(1) | 1.05(7) | 2.05(8) | 6.81(8) | 0.07(8) | 1.03(93) | 1.13/0.94 | |
| 30172-01-17-07 | 50932.793 | 1.10(5) | 9010 | -0.02(9) | 2.34(9) | 1.02(8) | 2.64(9) | 6.82(3) | 0.08(7) | 1.05(93) | 1.35/1.11 | |
| 30172-01-18-00 | 50935.127 | 1.08(3) | 11020 | -0.16(8) | 2.6(1) | 0.99(5) | 2.69(7) | 6.80(2) | 0.11(6) | 0.78(93) | 1.42/1.04 | |
| 30172-01-18-01 | 50936.194 | 1.15(5) | 9010 | -0.25(9) | 2.6(1) | 0.97(6) | 2.65(6) | 6.80(8) | 0.09(9) | 0.84(93) | 1.39/0.85 | |
| 30172-01-18-02 | 50937.622 | 1.06(7) | 8010 | -0.14(8) | 2.25(8) | 1.08(7) | 3.16(9) | 6.82(6) | 0.04(6) | 0.88(93) | 1.41/0.96 | |
| 30172-01-18-03 | 50939.061 | 1.00(4) | 9010 | -0.05(6) | 2.0(1) | 1.14(6) | 3.05(9) | 6.85(8) | 0.07(2) | 0.84(93) | 1.32/1.01 | |
| 30172-01-18-04 | 50942.015 | 0.81(7) | 5020 | -0.08(7) | 1.38(9) | 1.2(1) | 2.6(1) | 6.86(7) | 0.03(6) | 1.05(93) | 1.09/0.81 | |
| 30172-01-18-05 | 50945.860 | 0.9(1) | 9010 | 0.14(9) | 1.2(1) | 1.3(1) | 5.98(8) | 6.60(9) | 0.02(5) | 1.33(93) | 0.93/0.76 | |
| 30172-01-18-06 | 50945.861 | 1.01(5) | 4010 | 0.2(1) | 0.99(2) | 1.21(6) | 2.46(9) | 6.84(8) | 0.03(6) | 1.32(93) | 0.71/0.67 | |
| 30172-01-18-07 | 50949.732 | 0.89(7) | 5010 | 0.24(7) | 0.92(2) | 1.39(5) | 2.24(6) | 5.99(9) | 0.06(6) | 1.01(93) | 0.64/0.69 | |
| 30172-01-18-08 | 50951.661 | 0.93(2) | 6010 | 2.00†† | 0.91(4) | 1.00(6) | 0.91(6) | 6.21(7) | 0.03(4) | 0.87(94) | 0.59/1.05 | |
| 30172-01-18-09 | 50952.482 | 0.86(3) | 4010 | 2.00†† | 0.83(3) | 1.00(7) | 0.78(5) | 6.18(7) | 0.33(6) | 1.46(94) | 0.52/1.03 | |
| 30172-01-18-10 | 50953.983 | 0.77(2) | 5010 | 2.00†† | 0.62(2) | 1.00(3) | 0.62(4) | 6.03(6) | 0.21(5) | 1.12(94) | 0.42/0.91 | |
| 30172-01-18-11 | 50956.949 | 0.87(4) | 5010 | 2.00†† | 0.45(3) | 1.00(6) | 0.35(5) | 6.1(1) | 0.20(6) | 1.43(94) | 0.28/0.55 | |
| 30172-01-18-12 | 50958.950 | 0.62(3) | 49(6) | 2.00†† | 0.47(4) | 1.00(7) | 0.41(5) | 5.86(6) | 0.27(9) | 1.00(94) | 0.28/0.72 | |
| 30172-01-18-13 | 50961.087 | 0.71(6) | 50(8) | 2.00†† | 0.45(5) | 1.00(1) | 0.33(9) | 6.2(1) | 0.18(2) | 0.82(94) | 0.27/0.65 | |
| 30172-01-18-14 | 50962.949 | 0.64(3) | 46(6) | 2.00†† | 0.59(3) | 1.00(8) | 0.24(6) | 5.9(1) | 0.18(6) | 1.42(94) | 0.32/0.89 | |
| 30172-01-18-15 | 50965.948 | 0.23(3) | 148(9) | 2.00†† | 0.31(4) | 1.00(6) | 0.31(5) | 5.84(9) | 0.11(5) | 0.83(94) | 0.28/0.69 | |
| 30172-01-18-16 | 50968.261 | 0.49(3) | 50(3) | 2.00†† | 0.47(3) | 1.00(7) | 0.30(5) | 5.84(9) | 0.18(7) | 1.21(94) | 0.27/0.68 | |
| 30172-01-18-17 | 50970.387 | 0.52(4) | 50(5) | 2.00†† | 0.42(4) | 1.00(4) | 0.28(6) | 5.9(1) | 0.17(5) | 1.17(94) | 0.24/0.65 | |
| 30172-01-18-18 | 50972.126 | 0.59(2) | 54(7) | 2.00†† | 0.52(2) | 1.00(6) | 0.19(5) | 6.04(8) | 0.18(4) | 1.39(94) | 0.28/0.82 | |
| 30410-02-05-00 | 50988.772 | 1.19(5) | 79(2) | 2.00†† | 4.61(4) | 1.47(9) | 10.0(1) | 8.46(9) | 0.01(9) | 0.18(94) | 0.18/0.34 | |
| 30410-02-07-00 | 50990.885 | 0.35(3) | 85(8) | 2.00†† | 0.26(9) | 0.82(9) | 0.18(9) | 7.14(8) | 0.19(6) | 0.86(94) | 0.18/0.41 |
† The spectral model is , where is fixed at a value 7.7 cm-2 (Dieters et al., 2000); are fixed at 0.7 keV (see comments in the text); †† when parameter , this parameter is fixed at 2.0 (see comments in the text), ††† normalization parameters of and components are in units of , where is the source luminosity in units of 1037 erg/s, is the distance to the source in units of 10 kpc and component is in units of in line, ††††spectral fluxes (F1/F2) in units of ergs/s/cm2 for (3 – 10) and (10 – 50) keV energy ranges respectively.
| Source | M (M | i (deg) | da (kpc) | i (deg) | Mscal (M⊙) | Refs |
|---|---|---|---|---|---|---|
| XTE J1550-564 | 9.51.1 | 725 | 6 | … | 10.71.5c | 1, 2, 3 |
| GRO J1655-40 | 6.30.3 | 701 | 3.20.2 | … | … | 4, 5 |
| H 1743-322 | 11 | 70 | 10 | … | 13.33.2c | 6 |
| GRS 1915+105 | 144 | 60 | 12.10.8 | … | 15.61.5d | 4, 7 |
| 4U 1630–47 | … | … | 10 | 70 | 9.51.1 | this work |
a Dynamically determined BH mass and system inclination angle, b Source distance found in literature,
c Scaling value found by ST09,
d Scaling value found by ST07.
References:
(1) Orosz et al. 2002;
(2) Snchez-Fernndez et al. 1999;
(3) Sobczak et al. 1999;
(4) Green et al. 2001; (5) Hjellming & Rupen 1995
(6) McClintock et al. 2007;
(7) ST09.