Studying the universality of field induced tunnel ionization times via high-order harmonic spectroscopy
Abstract
High-harmonics generation spectroscopy is a promising tool for resolving electron dynamics and structure in atomic and molecular systems. This scheme, commonly described by the strong field approximation, requires a deep insight into the basic mechanism that leads to the harmonics generation. Recently, we have demonstrated the ability to resolve the first stage of the process – field induced tunnel ionization – by adding a weak perturbation to the strong fundamental field. Here we generalize this approach and show that the assumptions behind the strong field approximation are valid over a wide range of tunnel ionization conditions. Performing a systematic study – modifying the fundamental wavelength, intensity and atomic system – we observed a good agreement with quantum path analysis over a range of Keldysh parameters. The generality of this scheme opens new perspectives in high harmonics spectroscopy, holding the potential of probing large, complex molecular systems.
I Introduction
Strong field light matter interactions open new horizons in ultrafast physics, in the generation of coherent XUV or x-ray radiation and energetic electrons. Understanding their basic mechanism is an essential step in establishing these new directions of research. In this framework an extensively studied phenomenon is high harmonic generation (HHG). In the strong field regime the mechanism that leads to the emission of high harmonics can be described in semiclassical terms. Near the peak of the optical cycle the Coulomb barrier is lowered by the strong laser field leading to tunnel ionization. Once the electron is free, it interacts with the laser field and accumulates high kinetic energy before it recollides with the parent ion and emits a high-energy photon Corkum93 . This semiclassical picture provides us with two important assumptions. It defines three separate steps which can be treated independently. In addition, it provides a simple link between them: there is a direct mapping between the time of ionization of the electron, its time of return and the corresponding emitted photon energy where is the harmonic order and is the fundamental frequency of the driving laser. These two important components of the semiclassical picture are at the heart of HHG spectroscopy. In this picture the tunneling serves as a ’pump’, initiating a hole wavefunction, while the recollision serves as a ’probe’, mapping the evolved wavefunction onto the HHG spectrum Ita04 ; Smirnov09 ; bucksbaum08 ; Bak06 .
Recently we have demonstrated the ability to decouple the two important steps in the process – the ionization and recollision Shafir2012 . By adding a weak second harmonic field, orthogonally polarized with respect to the strong driving field, we induce a subcycle amplitude gate. Manipulating the two color delay shifts the gate within the optical cycle, probing a narrow range of electron trajectories according to their ionization time. A perturbative analysis enabled us to map each harmonic number to its time of ionization and time of recollision . Our results, measured in helium atoms, demonstrated a deviation from the semi-classical picture, in agreement with quantum path analysis Lewen94 . Additionally, we have demonstrated the reconstruction of ionization times in both short and long trajectories in argon Soifer2013 . The extension of our approach to more complex electronic systems raises the following question: what are the limitations of the strong field assumptions? Specifically, can we generalize our results to a wider range of fundamental parameters such as the laser frequency, intensity or atomic ionization potential?
The semiclassical picture provides a simple answer: there is a unique mapping between , and , where is the pondermotive potential and is the field amplitude (atomic units are used throughout the paper). Such mapping provides a universal scaling law, in which the cutoff photon energy scales linearly with . A more accurate picture is provided by the quantum mechanical description Lewen94 . Quantum mechanically, the induced dipole moment is dictated by all quantum trajectories that contribute to this process. These trajectories are coherently integrated with a relative phase known as the semi-classical action , given by:
| (1) |
where is the canonical momentum of the electron, is the vector potential of the driving electric field and is the ionization potential of the target atom.
In the strong field regime the main contribution to the integral comes from the stationary points – the points for which , and . The stationary solutions , and provide us with a direct mapping between time and energy. These solutions differ from their semiclassical counterparts: the tunneling step, dictated by the ionization potential and the field’s intensity , couples the three main steps of the recollision process. As a direct consequence, an imaginary component appears in the stationary solutions – , and . Furthermore, the mapping between time and energy cannot be directly scaled since it is dictated by all parameters of the interaction.
We can characterize the interaction by the well known Keldysh parameter defined as Keldysh . This parametrization compares the two fundamental time scales in the process: the tunneling time and the fundamental period of the laser field . Figure 1 describes the mapping between the normalized photon energy () and for a range of Keldysh parameters. In the limit of () the stationary solution (solid black line) approaches the classical one with the exception of the cutoff region, where the quantum nature of the process allows solutions which are not classically reproducible. Increasing increases the difference between and the classical solution leading to a substantial narrowing of the ionization window.
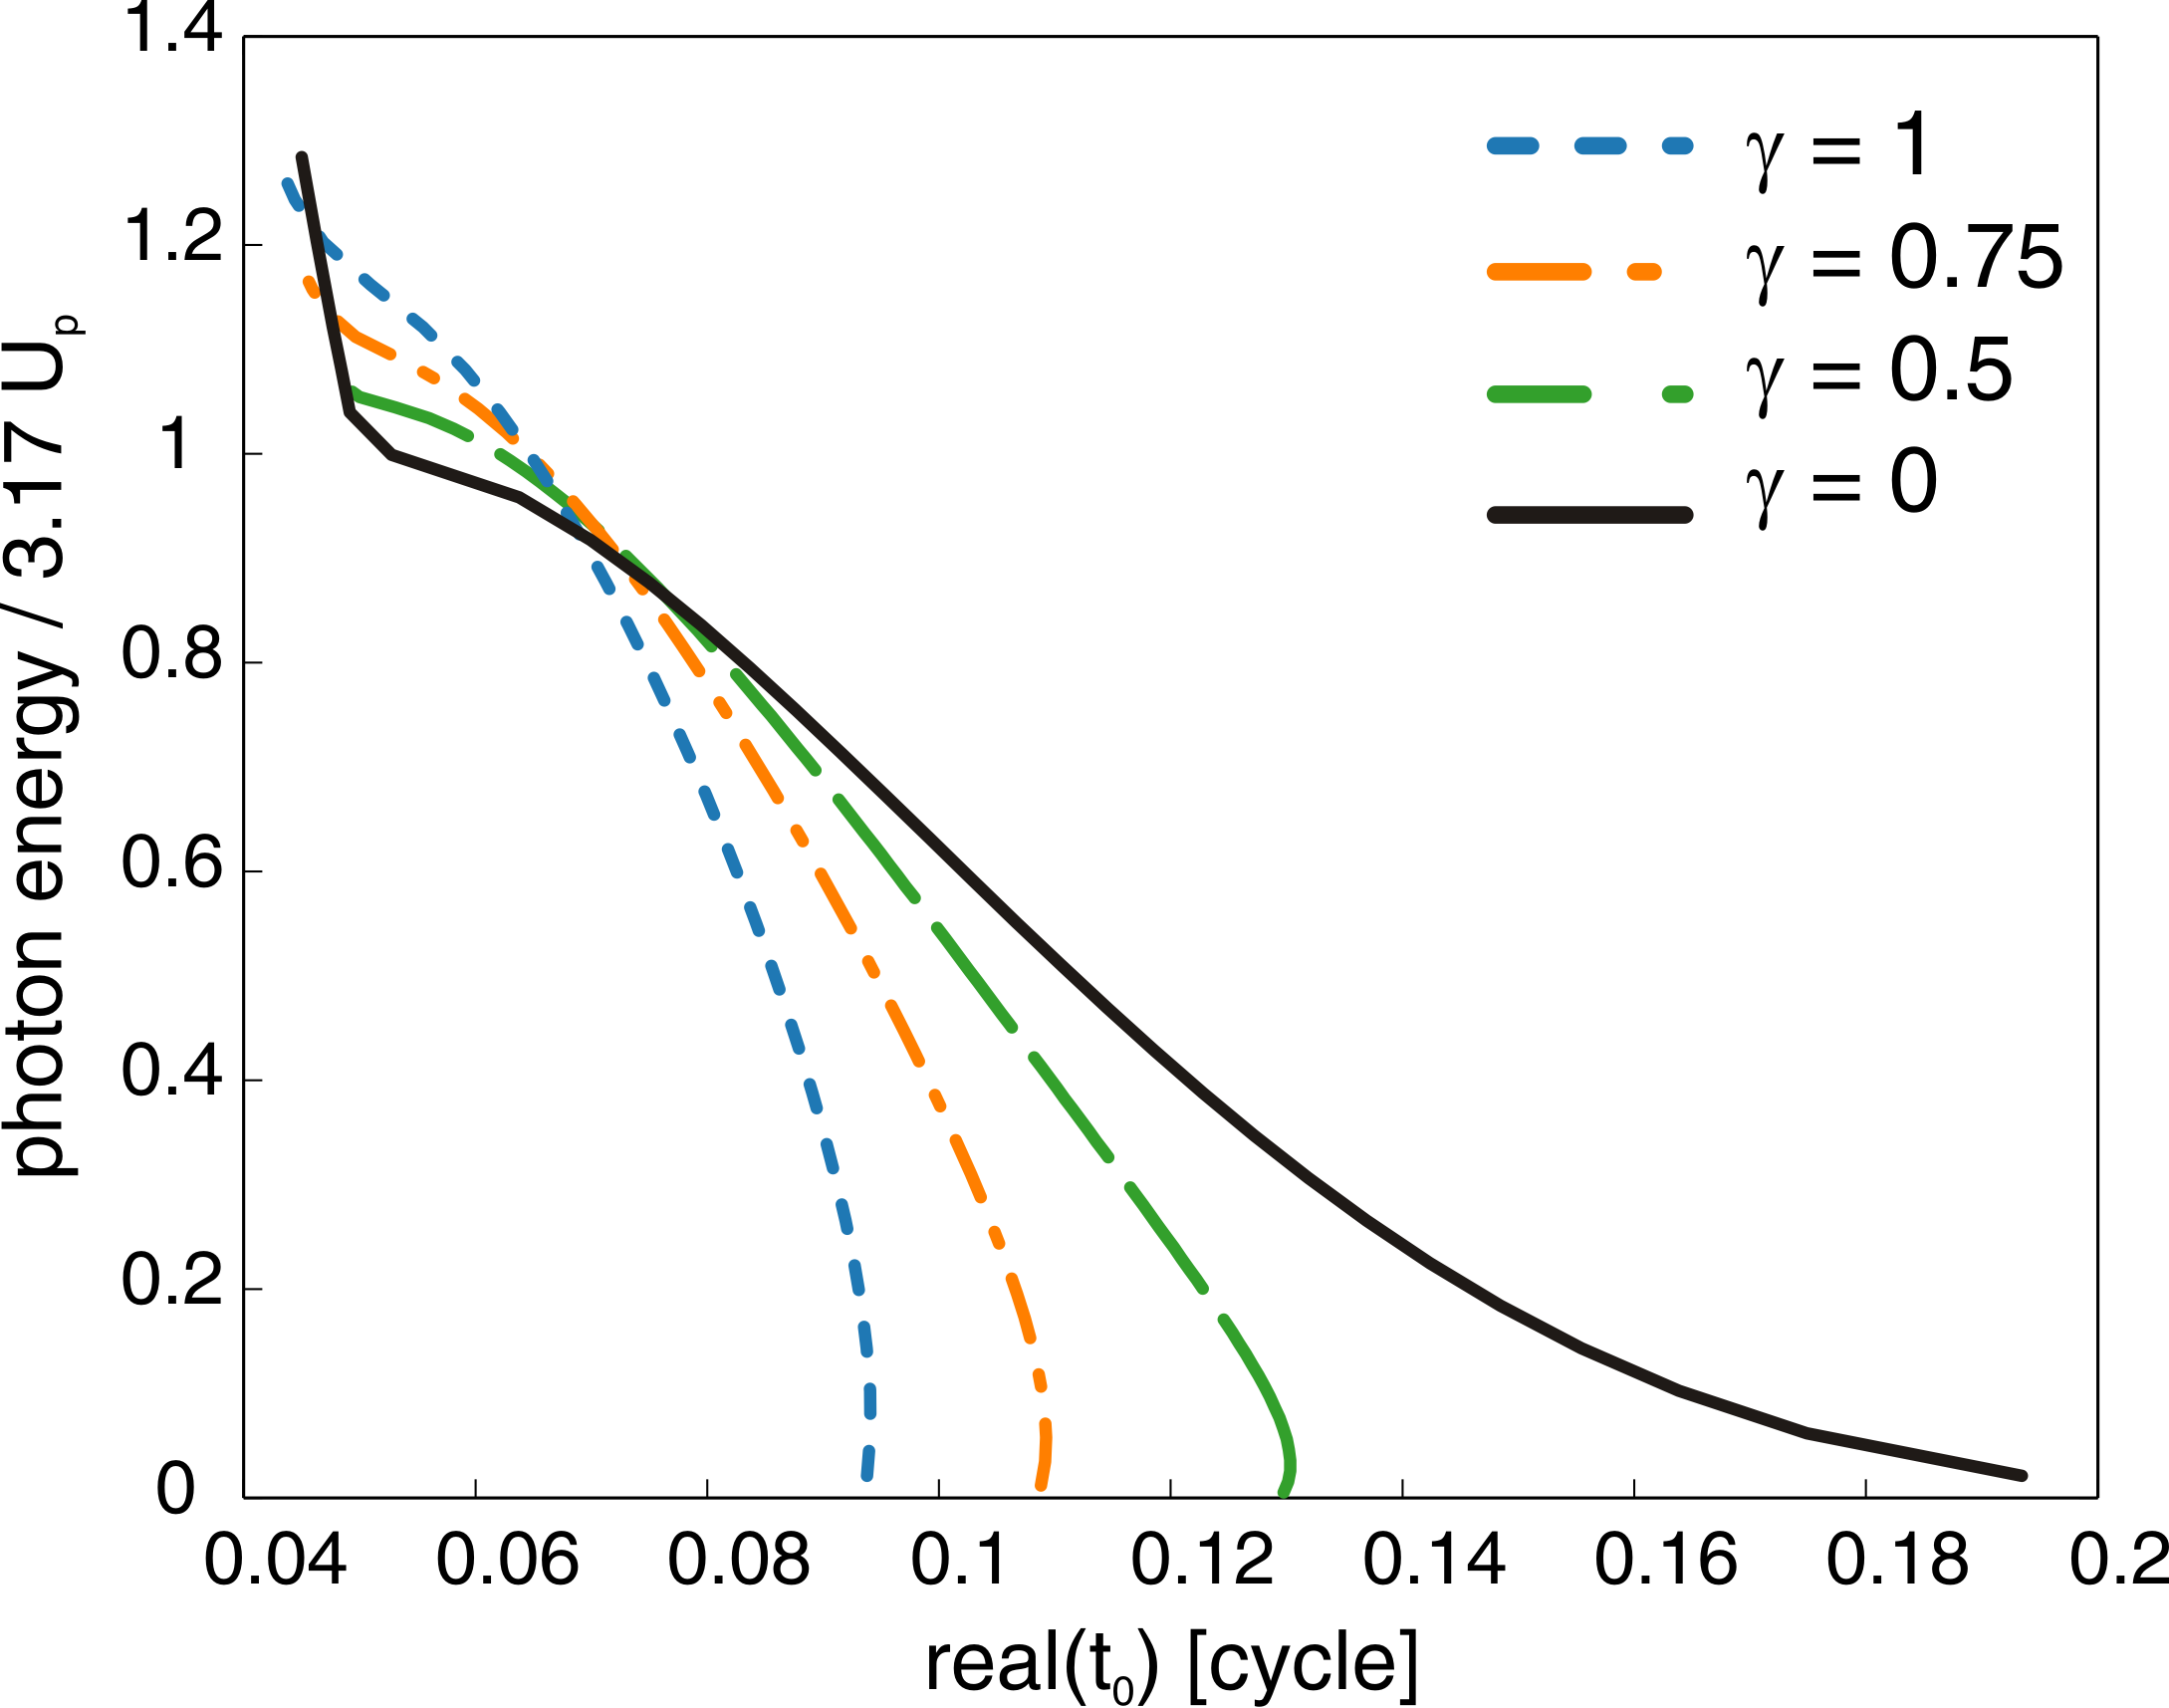
In this paper we study the link between the ionization time and emitted photon energy for a range of Keldysh parameters between 0.64 and 1.23. Current laser technology enables us to achieve this range by scanning the fundamental wavelength Dimauro08 . In addition, we also modify the field intensity and vary the atomic systems, thus changing the ionization potential. To avoid contributions of multi-electron dynamics we focus the study to small, rare-gas, atomic systems. Our systematic study demonstrates the generality of the gating approach. Importantly, we confirm the validity of quantum path analysis in a regime were the basic assumptions that underly the strong field model (i.e. ), reach their limit.
II methods
In the following we summarize the basic mechanism of the gating measurement. Consider a two color field in orthogonal configuration: , where is the amplitude of the fundamental field, is the amplitude ratio between the two colors and is the two colors delay. In the limit of the second harmonic field acts as a weak perturbation inducing a small lateral shift of the recolliding electron. This shift reduces the recollision probability, suppressing the emitted signal. The lateral shift accumulated between and can be classicaly described as Shafir2012 :
| (2) |
Here is the lateral electron velocity at the moment of ionization. The recollision condition which requires at defines the initial velocity that compensates for the field induced shift. The probability of an electron to tunnel with an initial velocity is centered around , having a width dictated by the tunneling process. Controlling the two colors delay, , modulates the lateral shift and therefore . Its optimal value, , for which the signal maximizes, is set at , encoding the main parameters of the interaction: and .
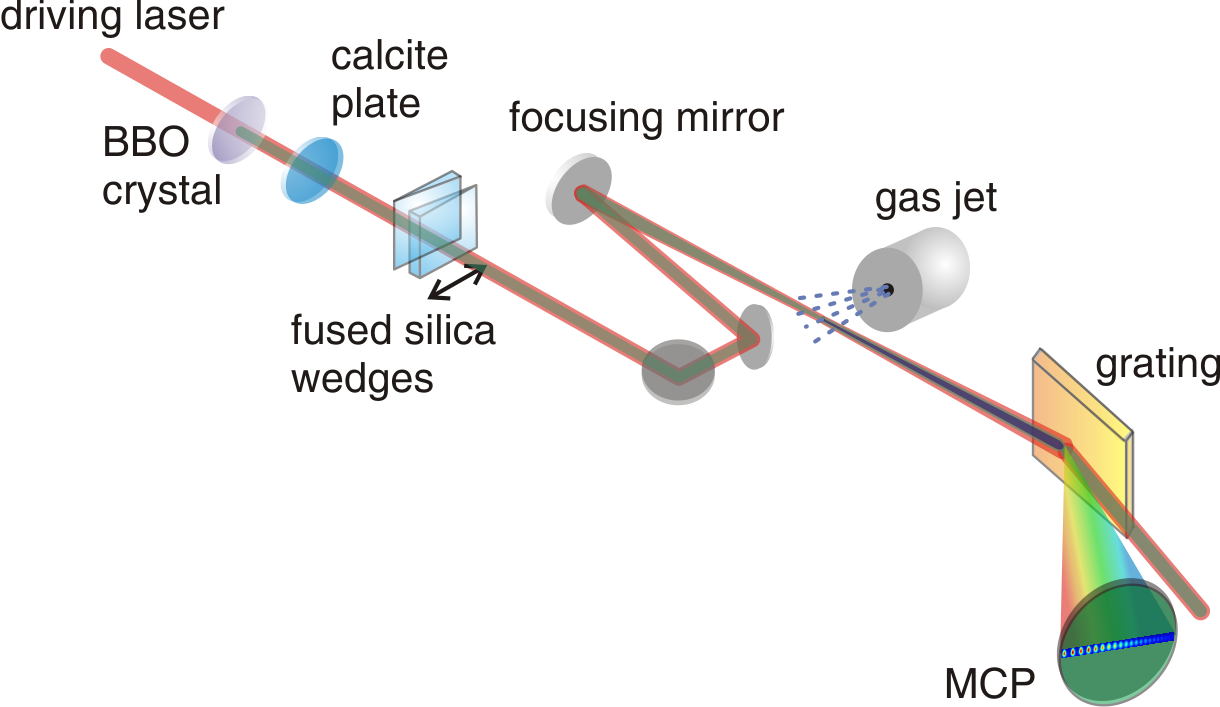
Our systematic study was performed both in the 800 nm and the mid-IR regime. Figure 2 shows a schematic description of the experimental setup. We used a BBO crystal followed by a calcite window for generating the two color driving field, consisting of a strong HHG-generating field with perpendicular polarization relative to the weak second harmonic field. The relative phase of the two fields was controlled with a pair of glass wedges. High order harmonics were generated by focusing the two-color driving field on a pulsed gas jet. Harmonics were detected by means of an XUV spectrometer coupled to an MCP and a CCD detector. The 800 nm experiments were driven by 30 fs pulses generated by an amplified Ti:sapphire laser system. The experiment driven by mid-IR pulses (20 fs, tunable between 1300 and 1800 nm) were performed exploiting an optical parametric amplifier (OPA) pumped by an amplified Ti:sapphire laser system (60 fs, 20 mJ, 800 nm) Vozzi2007 .
III results
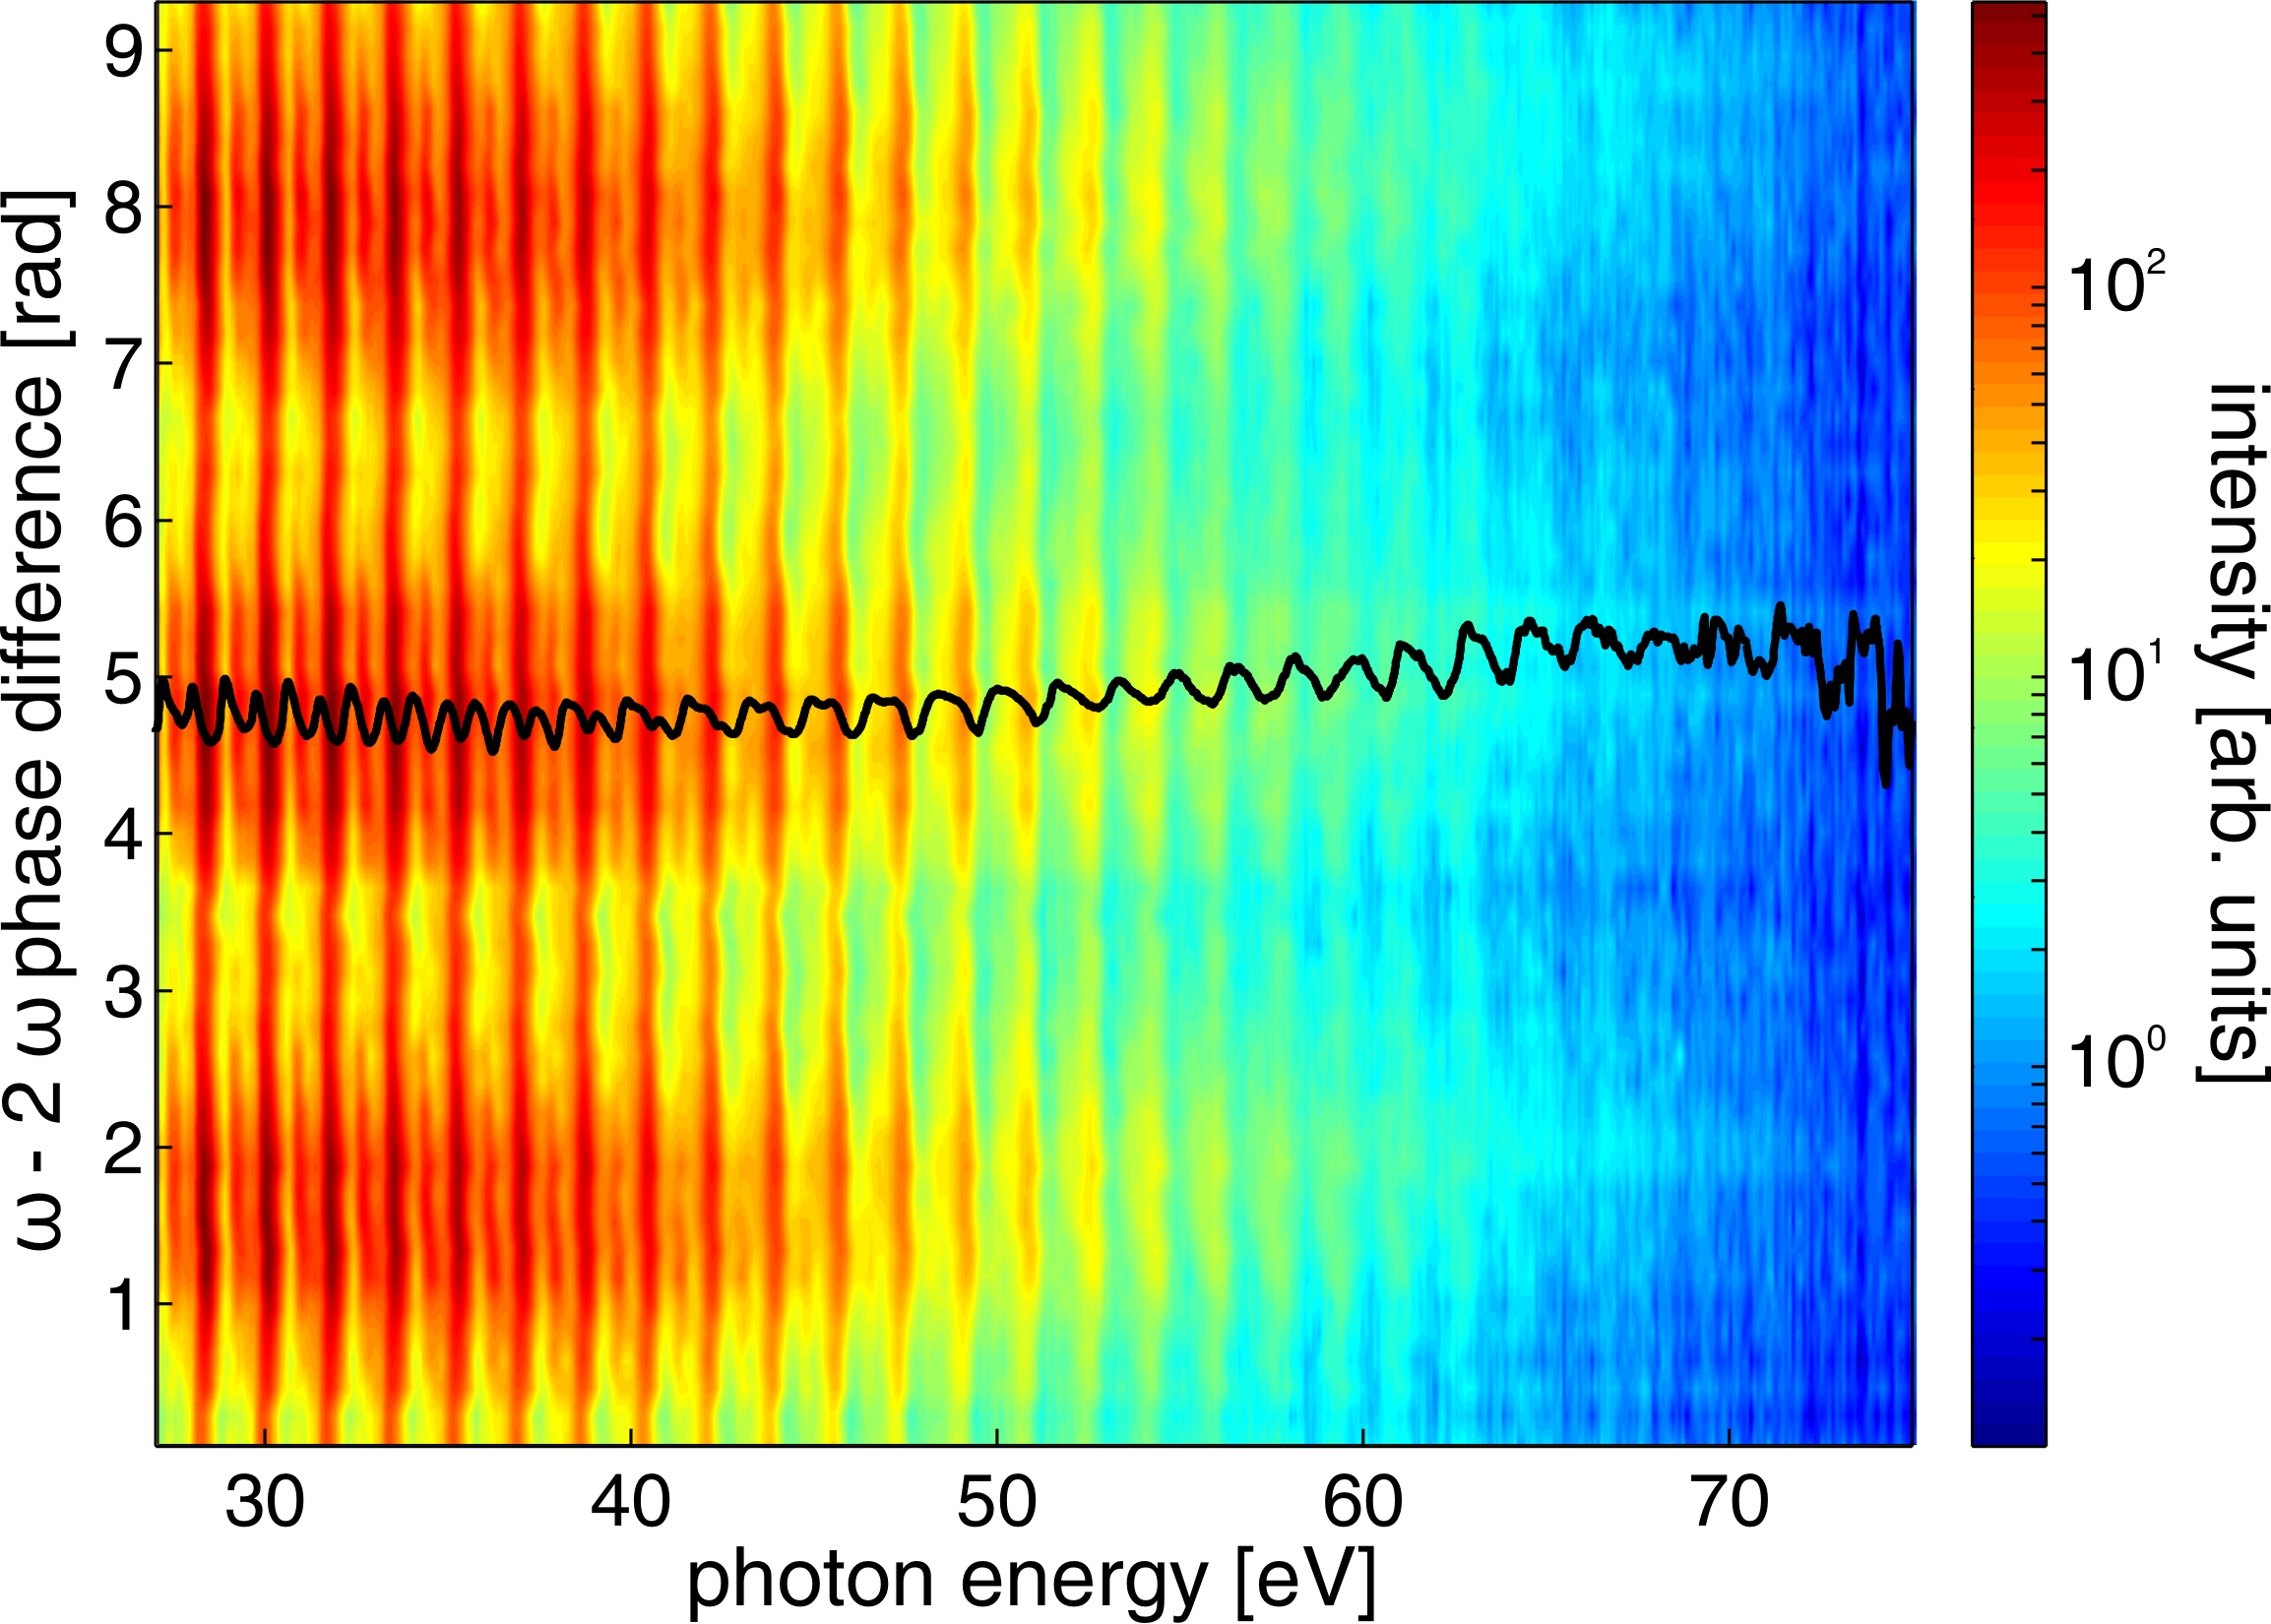
Figure 3 shows an example of the experimental results: normalized harmonic spectra driven in krypton by 1450-nm pulses are shown as a function of the two colors delay, . The solid curve follows as a function of the harmonic order. As can be clearly observed changes with the harmonic order reflecting the subcycle nature of the gating measurement. Indeed, as in previous studies, in the IR regime a good agreement with quantum path analysis is obtained. Analogous experimental results were obtained with 800-nm driving pulses.
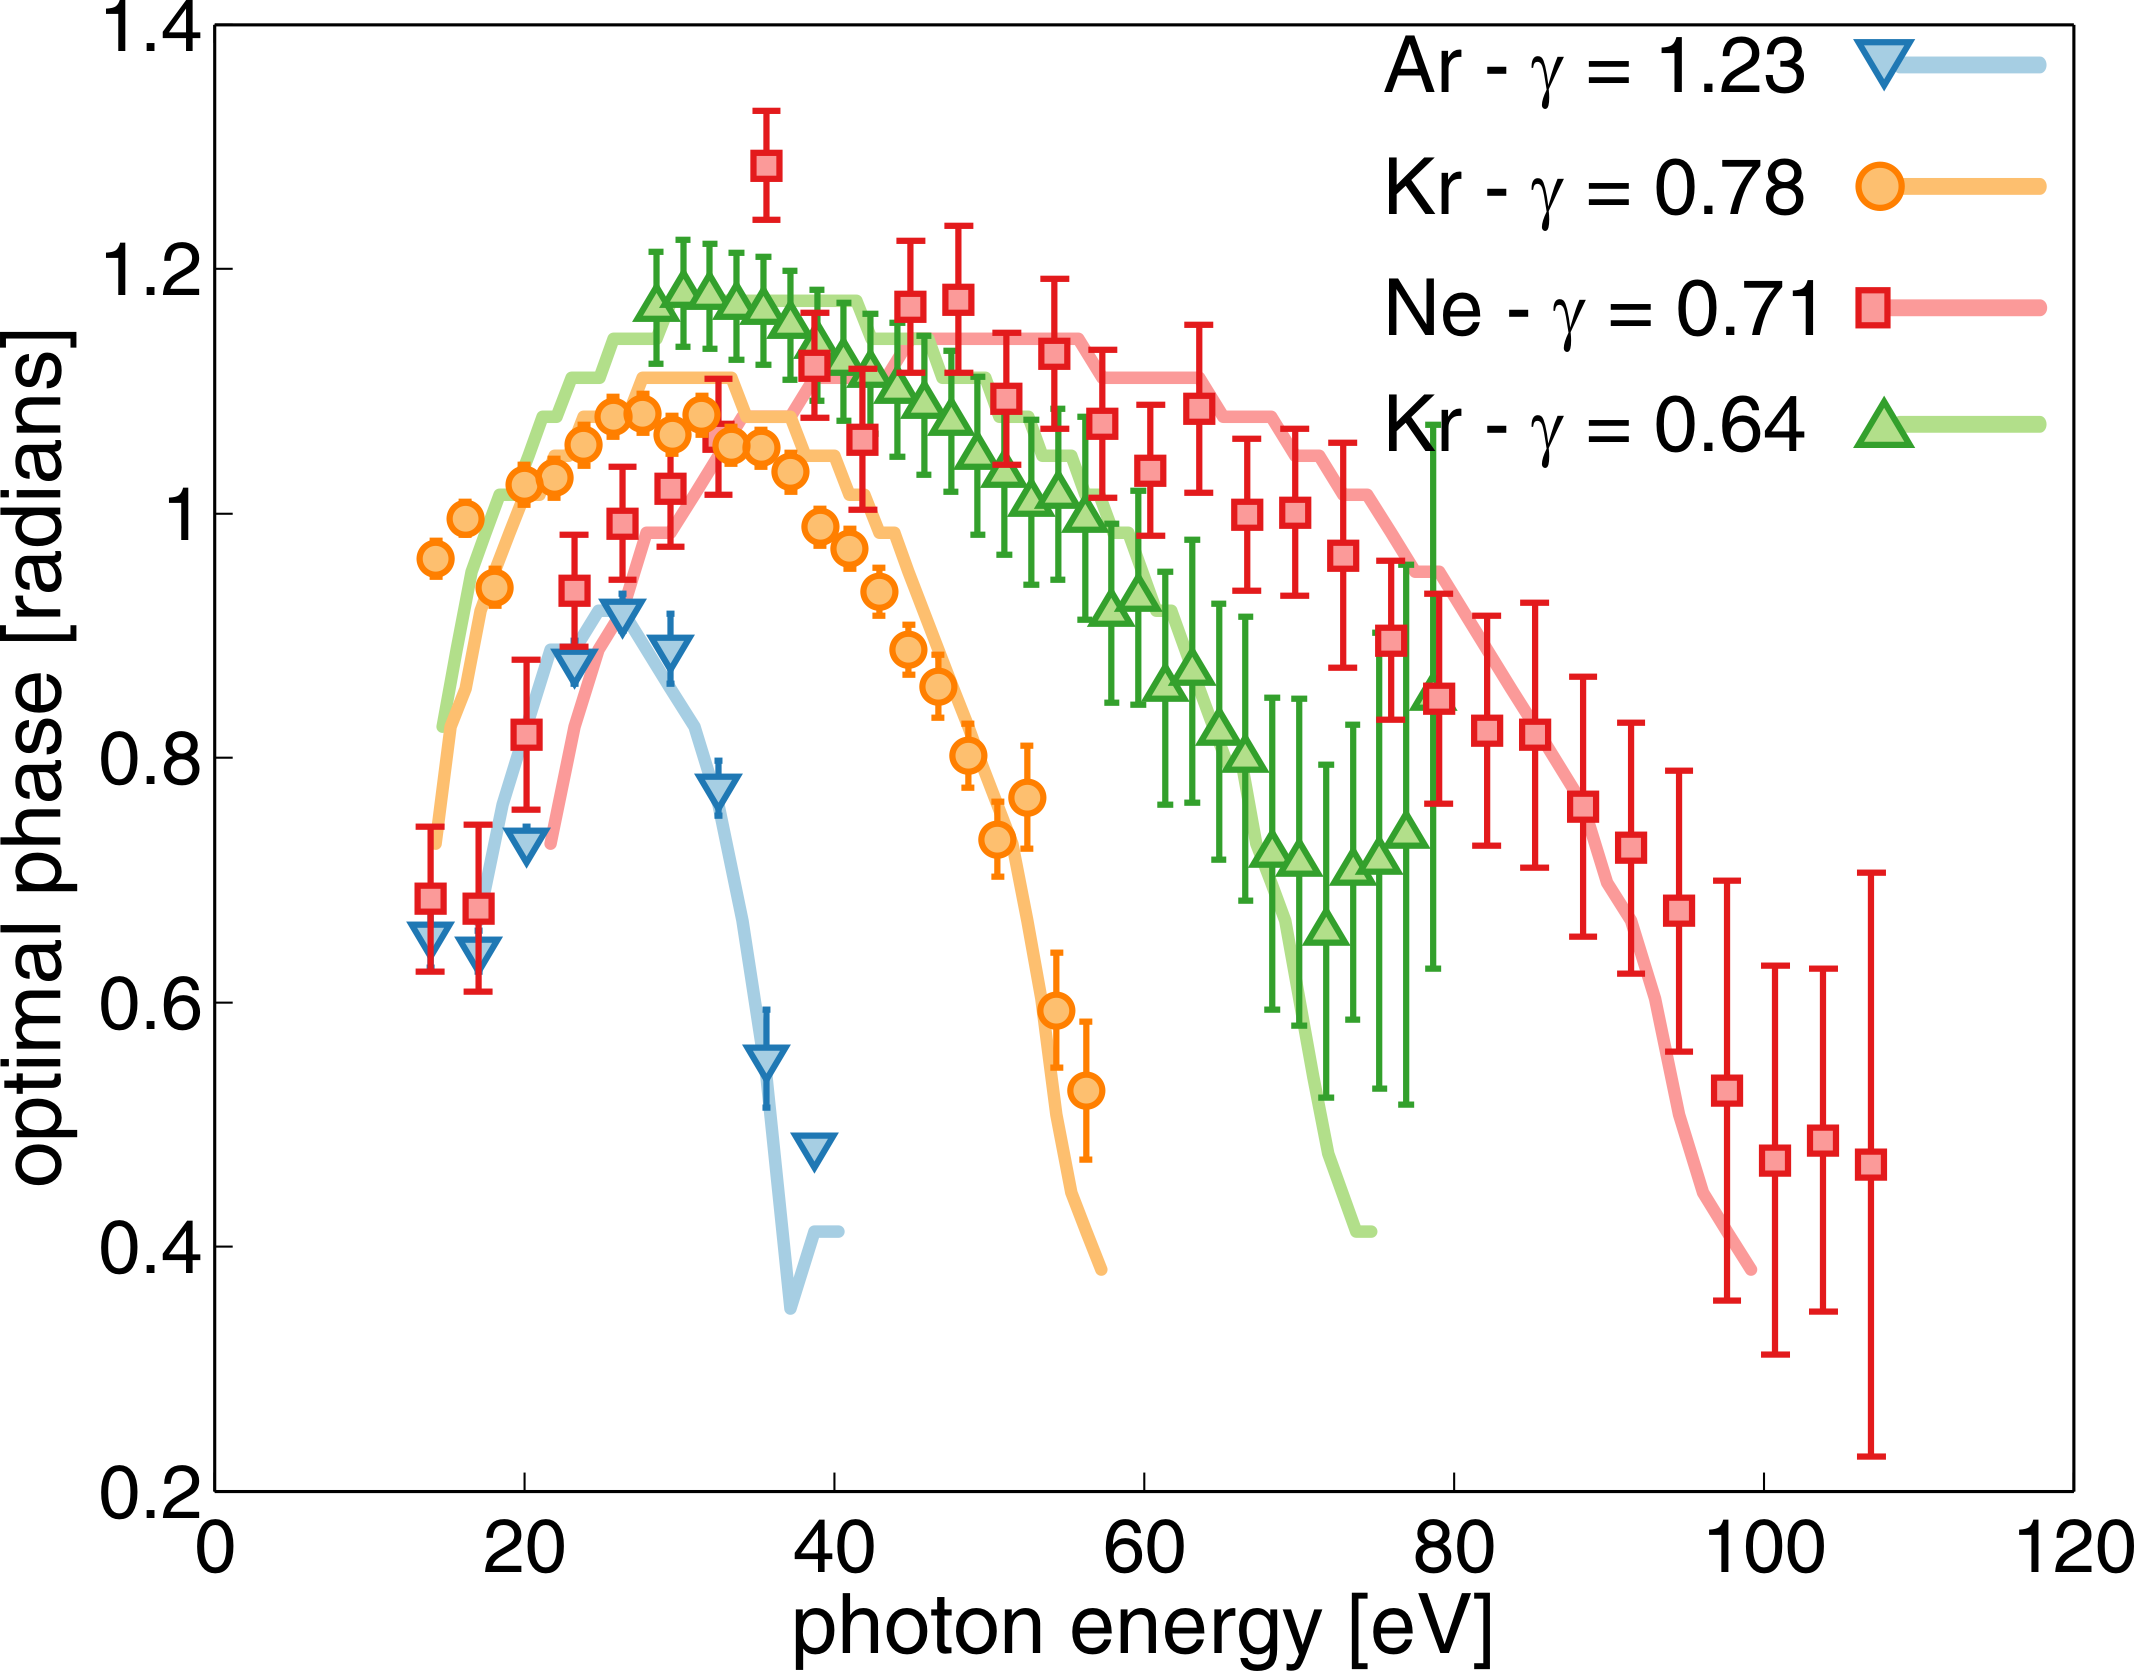
We performed a systematic study of the gating experiment over a range of Keldysh parameters. Figure 4 summarizes the results, displaying the two-color optimal delay vs photon energy for four values of Keldysh parameter. These data were obtained from three different atoms, and with three wavelengths, as follows: (1) Argon, 800nm, . (2) Krypton, 1300nm, (3) Neon, 800nm, , and (4) Krypton, 1430nm, . The two-color phase is only known experimentally up to a global shift. Therefore, the four curves were shifted in the vertical direction to best fit the theoretical prediction. The theoretical curves (solid lines) were calculated by solving the gating equation (eq. 2) for , setting , , based on the ionization times obtained from the quantum path analysis Lewen94 ; Zhao2013 . Since the peak intensity of the laser was not accurately known, was an additional fitting parameter in calculating the theoretical curves. Our study demonstrates a good agreement with quantum path analysis within this range of Keldysh parameters.
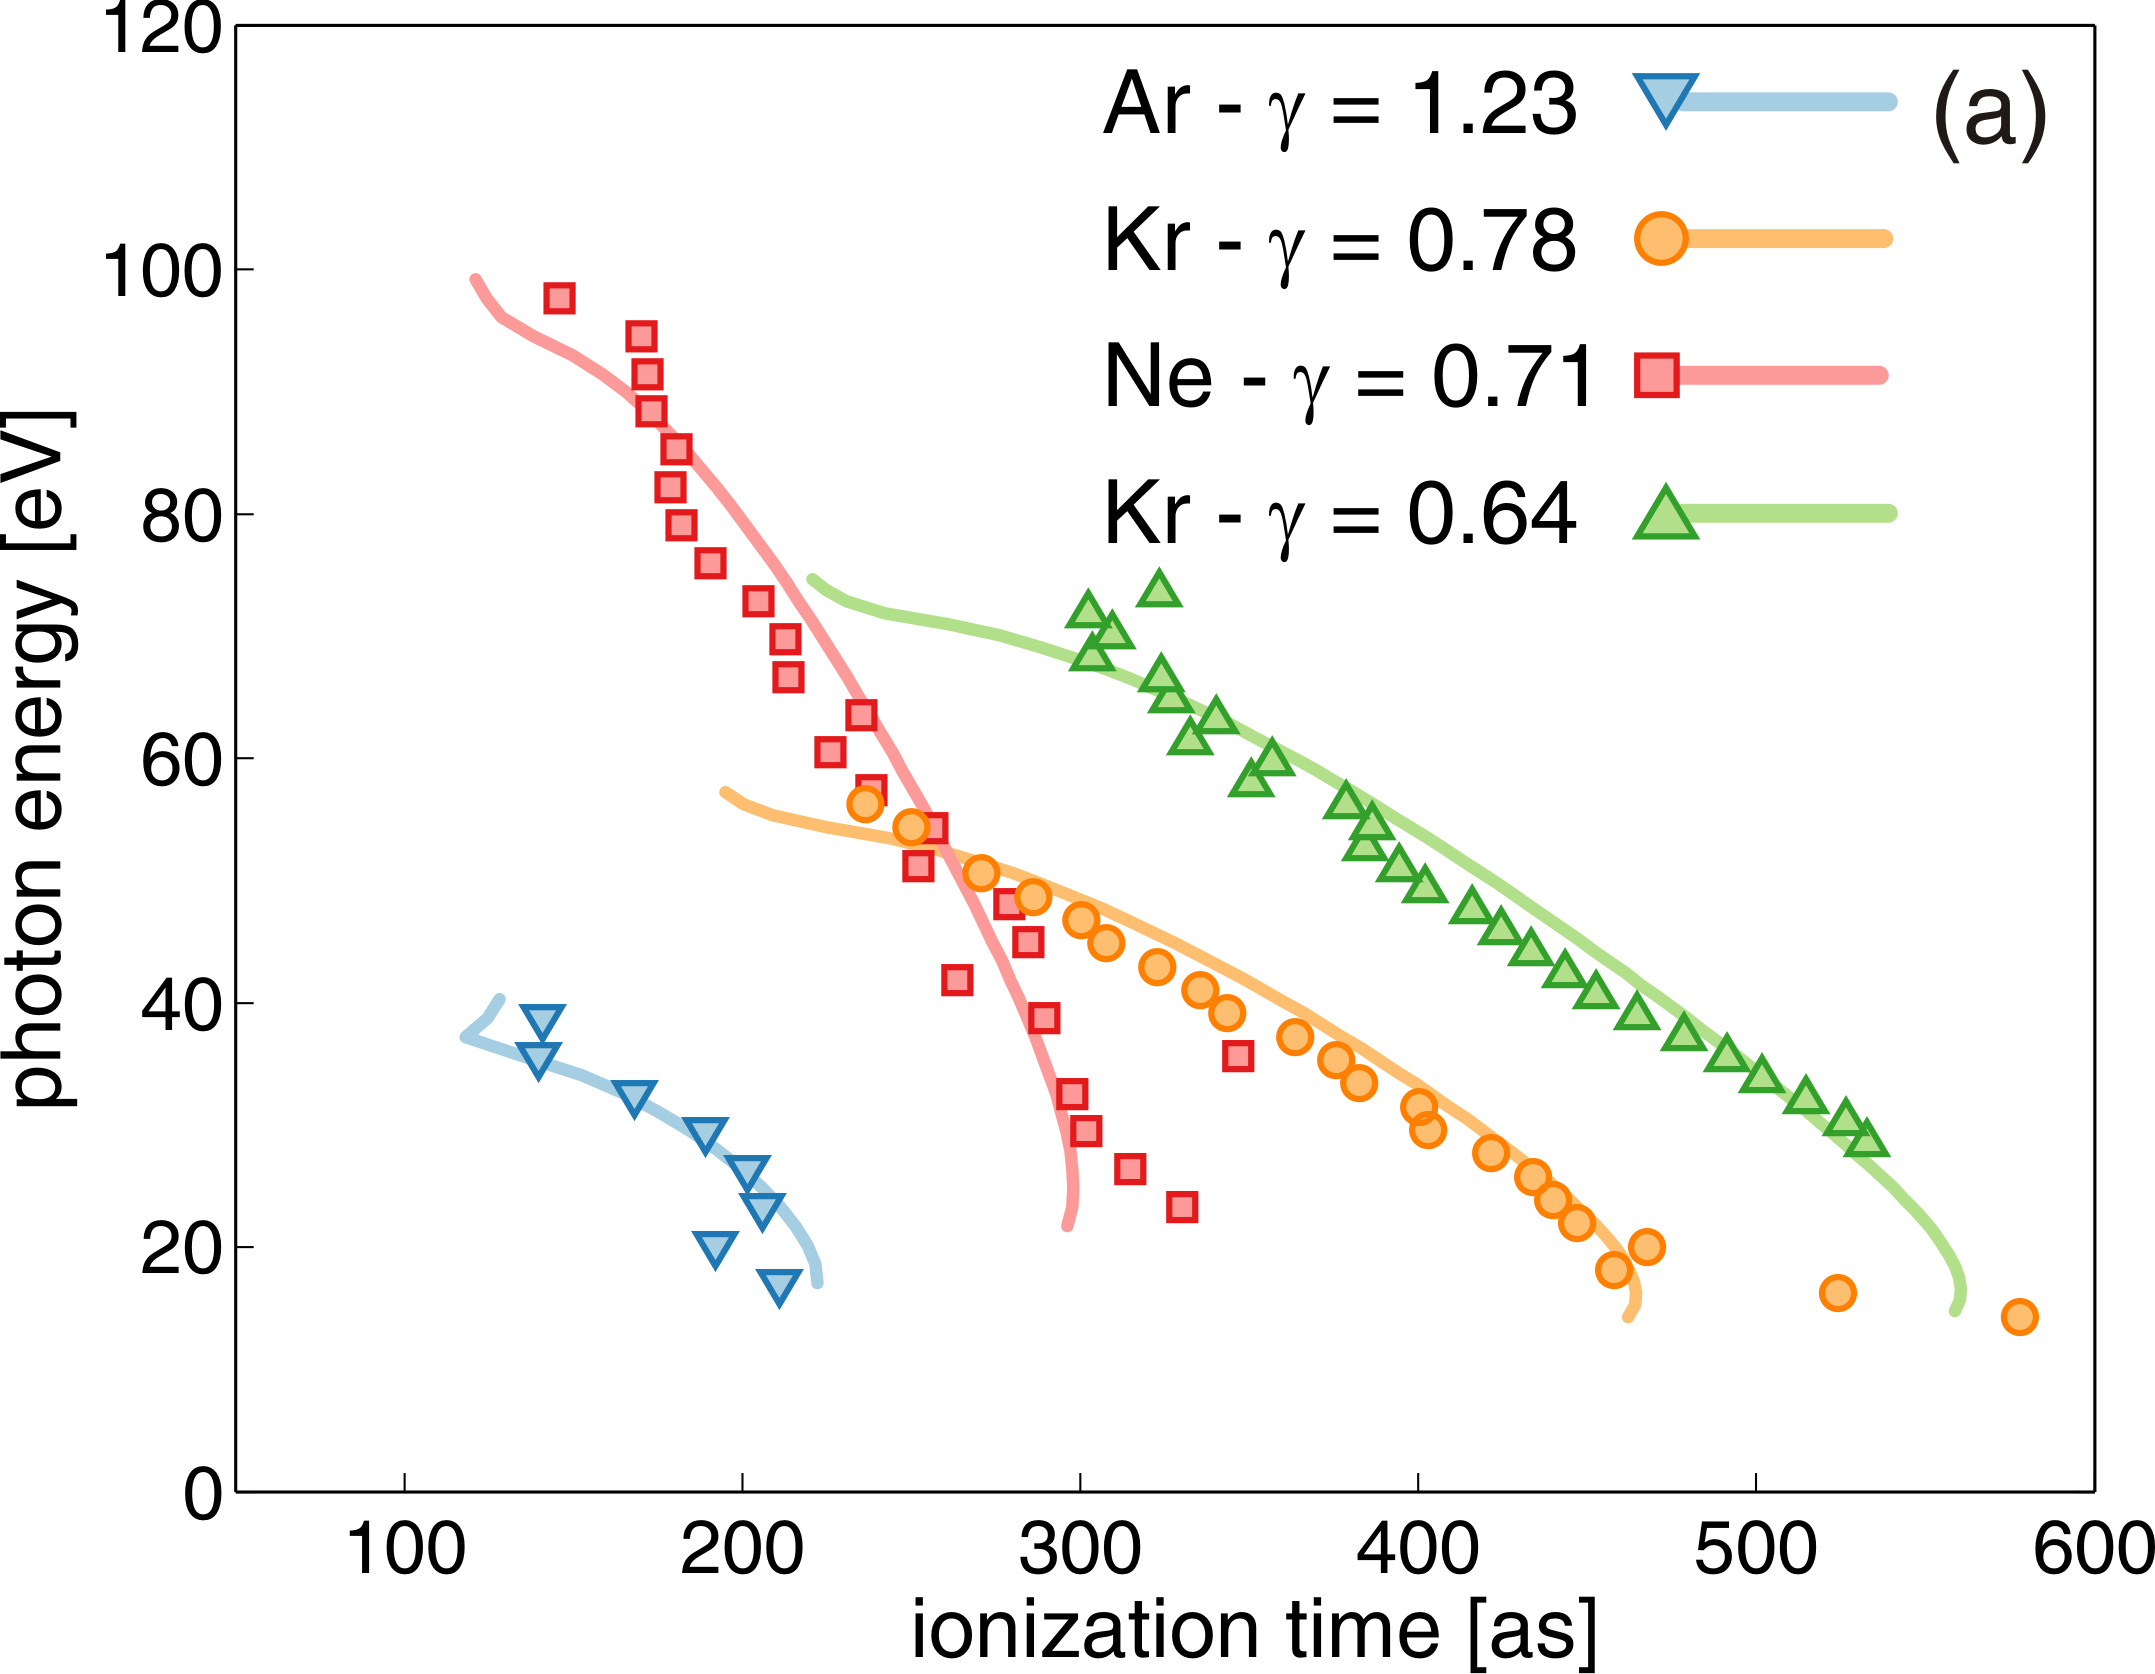
In the next stage, we map the information from the spectral domain to the temporal domain and reconstruct the ionization times. The reconstruction procedure is described in detail in Soifer2013 . Specifically, our experiment resolves as a function of the harmonic number for each value of Keldysh parameter. Relying on the perturbative approach we calculate the lateral gate and extract the theoretical . Comparing to and relying on the theoretical values of (which have been independently measured before atto_Misha ; Doumy2009 ) we extract . Figure 5 (a) shows the results of this reconstruction, as well as the calculated ionization times . As expected, the reconstructed curves are spread both in energy and in time due to the large range of , and wavelength.
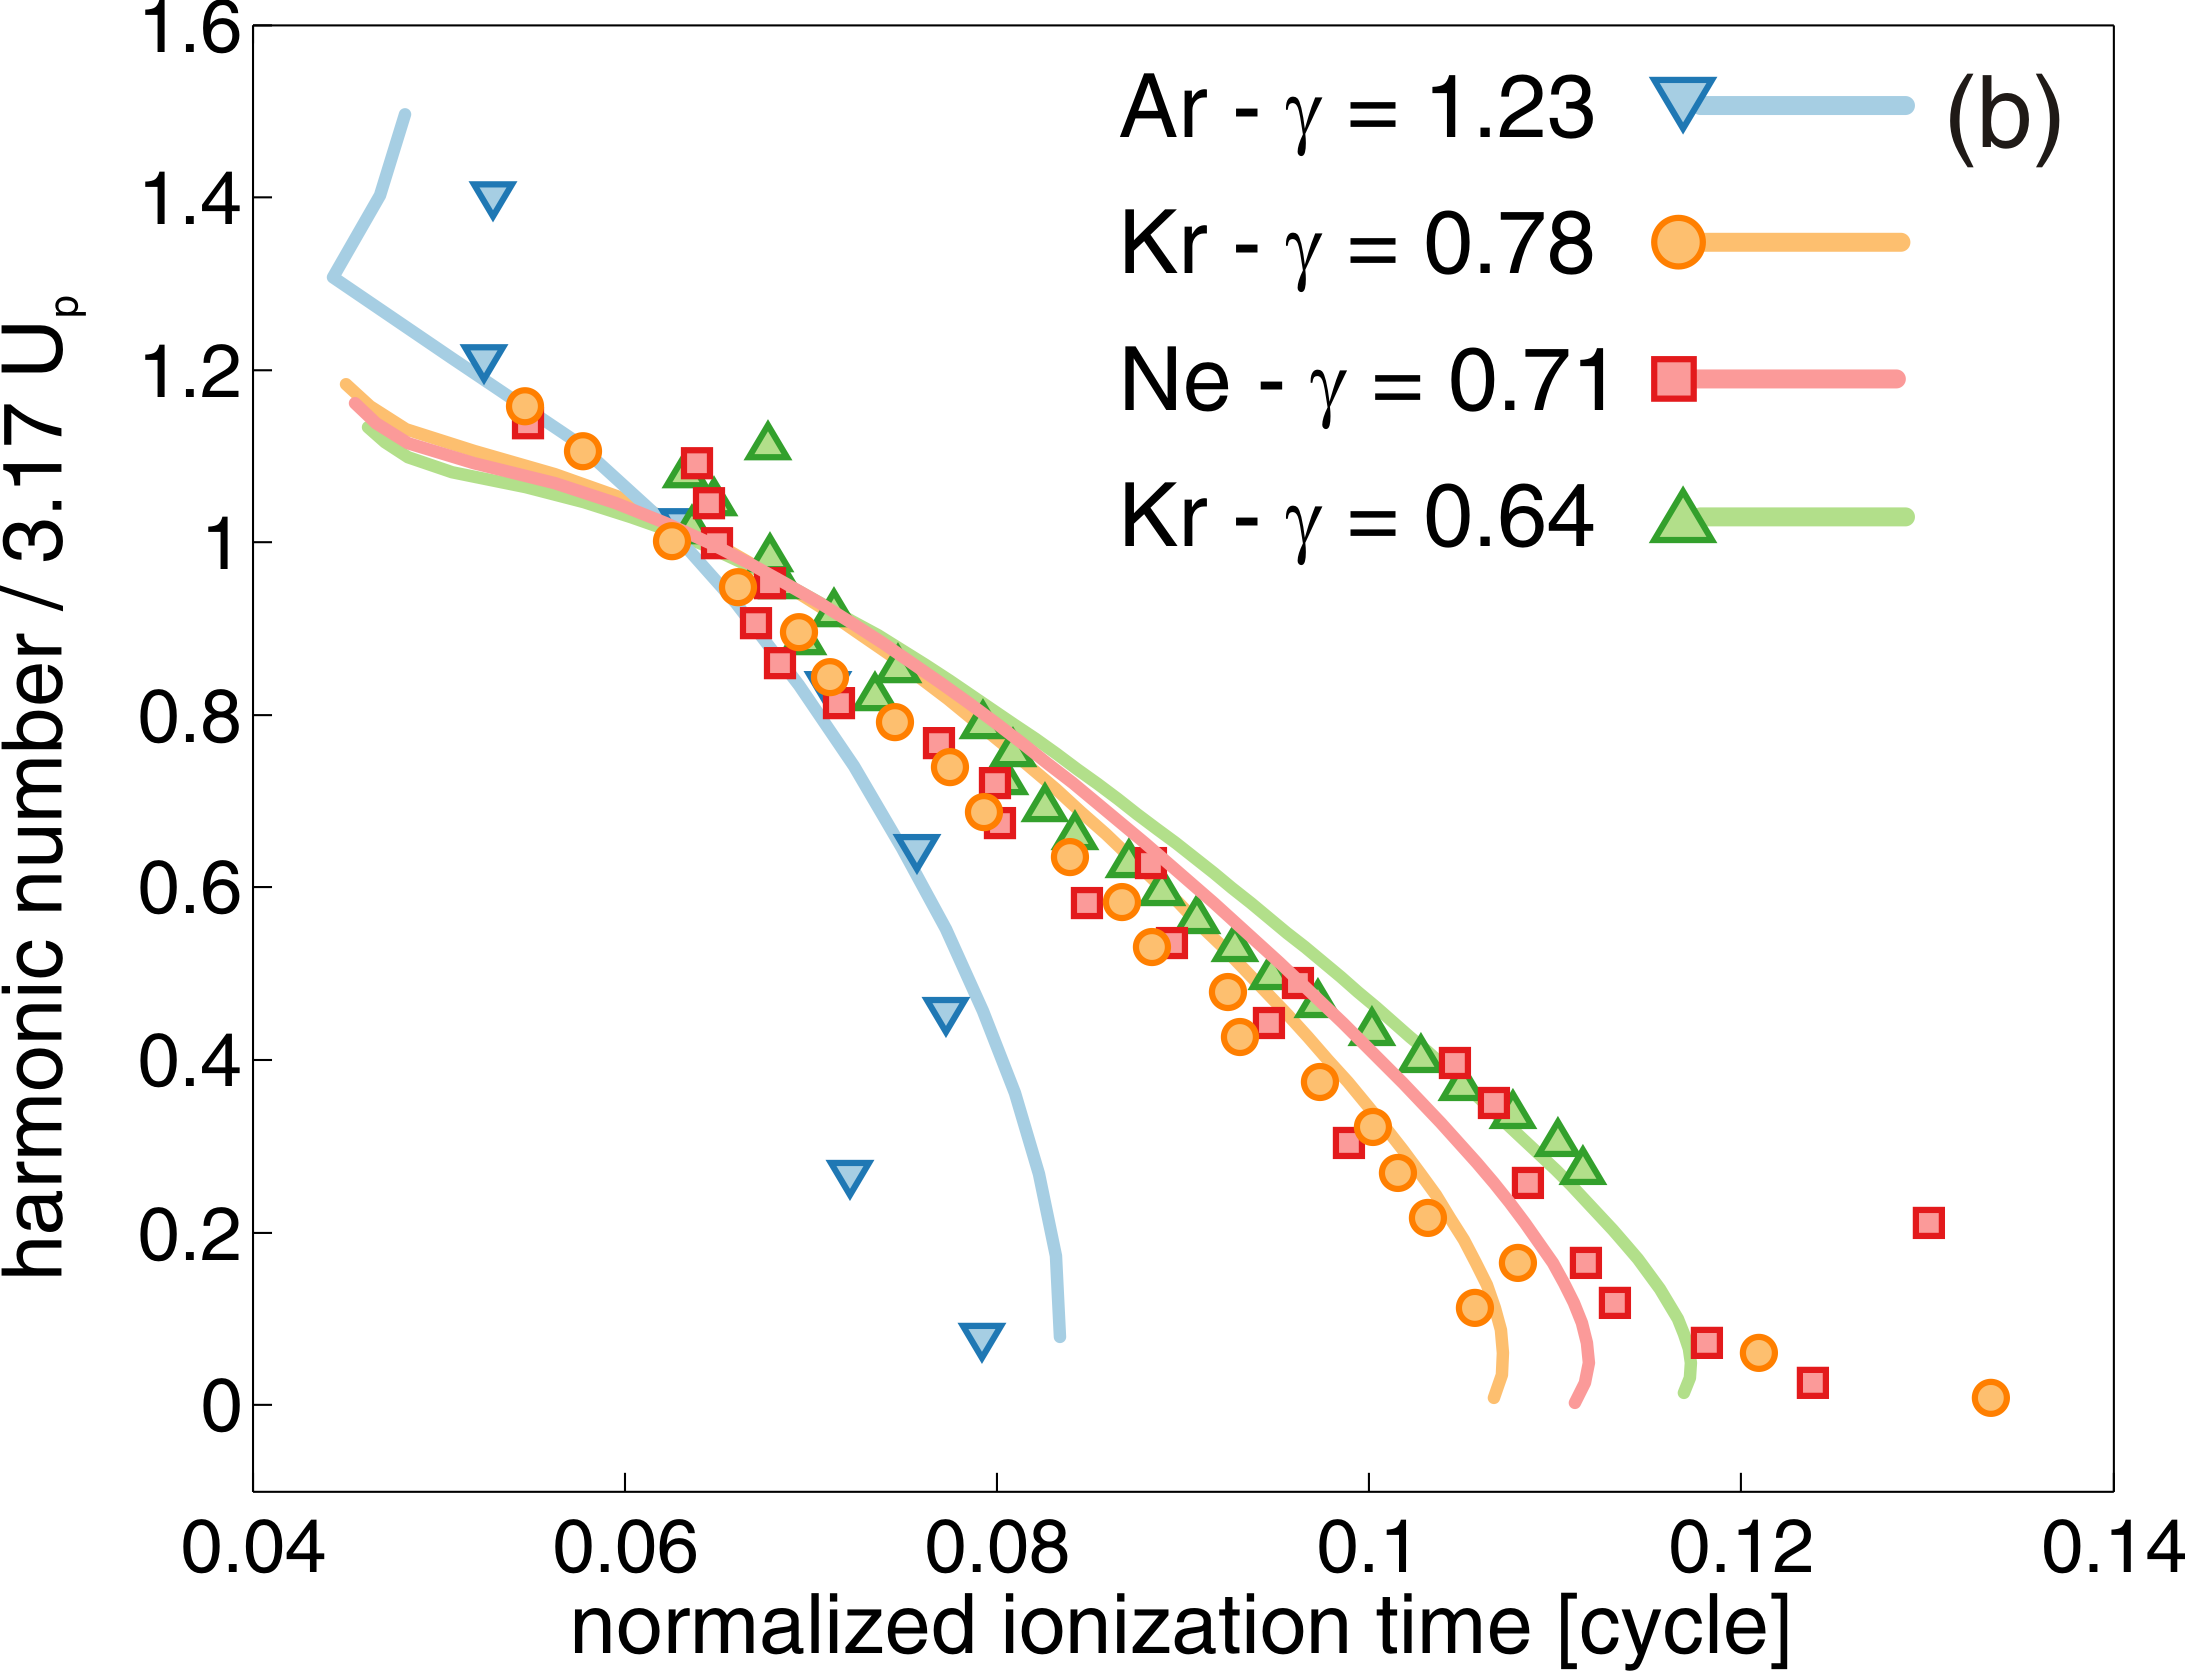
In order to compare these different experiments, we show in Fig. 5 (b) the same data as a function of normalized time and energy axes. The ionization time is normalized according to the duration of the optical cycle, such that measurements performed with different driving wavelengths are on the same scale. In addition, the photon energy scale is normalized for each measurement in the following way: photon energy (such that the classical cutoff is 1). With this normalization, the curves of depend only on the Keldysh parameter, whereas the classical times are independent of , or wavelength, as shown theoretically in fig. 1. All experimental curves deviate significantly from the classical curve. It can be observed that the normalized ionization times for measurements with close Keldysh numbers () are very similar, whereas the measurement with significantly larger Keldysh parameter () has a narrower ionization window.
These results display a striking universality. Although obtained with a large range of experimental parameters - varying , peak intensity and wavelength - they can all be described by a curve which depends only on the Keldysh parameter. Importantly, we obtained a very good fit even for a measurement with . This observation demonstrates the validity of quantum path analysis of HHG in a regime where the adiabatic assumption of fails Lai2013 .
Previous experiments have measured the attochirp in HHG generated by mid-IR lasers Doumy2009 . In this work we report the first measurement of ionization times at wavelengths longer than 800 nm. Combined with our previous resultsShafir2012 ; Soifer2013 , we confirm the validity of the strong field approximation and the single-electron picture for a variety of atomic systems and a wide range of laser parameters. This is an important step for extending HHG spectroscopy to mid-IR wavelengths, a regime which holds great promise Vozzi2012 ; Dichiara2013 .
Generalizing the two-color gating scheme to longer wavelengths enables extending our scheme to resolve tunneling dynamics in more complex molecular systems. In these systems structural and dynamical effect are often coupled Worner10 , adding a major obstacle to HHG molecular spectroscopy Smirnov09 ; Vozzi2011 . In addition, the tunneling process may involve nontrivial multielectron dynamics. Extending the dimensionality of the measurement by combining two-color schemes with tuneable mid-IR sources will enable us to disentangle the main degrees of freedoms, resolving attosecond scale processes, so far hidden in many HHG experiments.
Acknowledgements
The research leading to these results has received funding from LASERLAB-EUROPE (grant agreement n° 284464, EC Seventh Framework Programme),from ERC Starting Research Grant UDYNI (grant agreement n° 307964, EC Seventh Framework Programme) and from the Italian Ministry of Research and Education (ELI project - ESFRI Roadmap). N.D. acknowledges the Minerva Foundation, the Israeli Science Foundation, the German-Israeli Foundation, the European Research Council foundation, the Crown Center of Photonics and the European Research Council for financial support. H. S. is supported by the Adams Fellowship Program of the Israel Academy of Sciences and Humanities.
References
- (1) Corkum, P. B. Plasma perspective on strong field multiphoton ionization. Phys. Rev. Lett. 71, 1994–1997 (1993).
- (2) Itatani, J. et al. Tomographic imaging of molecular orbitals. Nature 432 (2004).
- (3) Smirnova, O. et al. High harmonic interferometry of multi-electron dynamics in molecules. Nature 460 (2009).
- (4) McFarland, B. K., Farrell, J. P., Bucksbaum, P. H. & Guhr, M. High Harmonic Generation from Multiple Orbitals in N2. Science 322, 1232–1235 (2008).
- (5) Baker, S. et al. Probing Proton Dynamics in Molecules on an Attosecond Time Scale. Science 312, 424–427 (2006).
- (6) Shafir, D. et al. Resolving the time when an electron exits a tunnelling barrier. Nature 485, 343–346 (2012).
- (7) Lewenstein, M., Balcou, P., Ivanov, M. Y., L’Huillier, A. & Corkum, P. B. Theory of high-harmonic generation by low-frequency laser fields. Phys. Rev. A 49, 2117–2132 (1994).
- (8) Soifer, H. et al. Spatio-spectral analysis of ionization times in high-harmonic generation. Chem. Phys. 414, 176–183 (2013).
- (9) Keldysh, L. V. Ionization in the field of a strong electromagnetic wave. Soviet Physics - JETP 20, 1307 1314 (1965).
- (10) Colosimo, P. et al. Scaling strong-field interactions towards the classical limit. Nat Phys 4, 386–389 (2008).
- (11) Vozzi, C. et al. Millijoule-level phase-stabilized few-optical-cycle infrared parametric source. Opt. Lett. 32, 2957–2959 (2007).
- (12) Zhao, J. & Lein, M. Determination of Ionization and Tunneling Times in High-Order Harmonic Generation. Phys. Rev. Lett. 111, 043901 (2013).
- (13) Krausz, F. & Ivanov, M. Attosecond physics. Reviews of Modern Physics 81, 163 (2009).
- (14) Doumy, G. et al. Attosecond Synchronization of High-Order Harmonics from Midinfrared Drivers. Phys. Rev. Lett. 102, 093002 (2009).
- (15) Lai, C.-J. et al. Wavelength Scaling of High Harmonic Generation Close to the Multiphoton Ionization Regime. Phys. Rev. Lett. 111, 073901 (2013).
- (16) Vozzi, C., Negro, M. & Stagira, S. Strong-field phenomena driven by mid-infrared ultrafast sources. J. Mod. Opt. 59, 1283–1302 (2012).
- (17) DiChiara, A. D., Ghmire, S., Reis, D. A., Dimauro, L. F. & Agostini, P. Attosecond Physics, vol. 177 of Springer Series in Optical Sciences (Springer Berlin Heidelberg, 2013).
- (18) Wörner, H., Bertrand, J., Kartashov, D., Corkum, P. & Villeneuve, D. Following a chemical reaction using high-harmonic interferometry. Nature 466, 604–607 (2010).
- (19) Vozzi, C. et al. Generalized molecular orbital tomography. Nat. Phys. 7, 1–5 (2011).