Energy emanating from the molecular nanomagnet Fe8 revisited
Abstract
In the molecular nanomagnet Fe8 tunneling can occur from a metastable state to an excited state followed by a transition to the ground state. This transition is accompanied by an energy release of GHz. We constructed an experimental setup to measure whether this energy is released in the form of thermal or electromagnetic energy. Contrary to a previous publication we find no evidence for release of electromagnetic radiation. Our results for transitions between the first and second excited states to the ground state are consistent with a release of only thermal energy. This energy release extends for a longer time for the second excited state than for the first excited state.
While investigating the Fe8 mononuclear magnet Shafir and Keren Oren made a serendipitous observation; tunneling events where accompanied by a jump in the temperature of a thermometer placed far from the sample and attached directly to the mixing chamber of a dilution refrigerator (DR). When the line of site between the thermometer and sample was blocked, the tunneling signal remained, but the temperature jumps disappeared. This led to the conclusion that energy bursts accompany the tunneling event and arrive at the thermometer in the form of electromagnetic radiation. In order to block the line of site the DR had to warm up and cool down again. Therefore, the test experiment was not done simultaneously with main experiment. Here we revisit the same phenomena, but with an experimental setup designed to detect photons in the microwave range, and with a test experiment done simultaneously with the photon detection.
At low temperature, the molecules are described by the Hamiltonian
where is the spin, is the anisotropy parameter, is the applied magnetic field, is the Bohr magneton, is the gyromagnetic factor, and does not commute with and is responsible for tunneling between spin projection states barra1996 ; Caciuffo1998 . When the field is strong ( T) only the are populated. When the field is swept across zero and changes sign, the state becomes metastable. At matching fields, which are separated by T Wernsdorfer2000 ; Caneschi1999 , quantum tunneling of magnetization (QTM) can take place from to an state, where is an excited state index. For , the excited state decays spontaneously to the ground state and energy is emitted. For this energy corresponds to a frequency of GHz or wavelength of mm and for it corresponds to a frequency of GHz. Interestingly, we found (see below) that the heat is released for a longer time from the second excited () state than from the first one ().
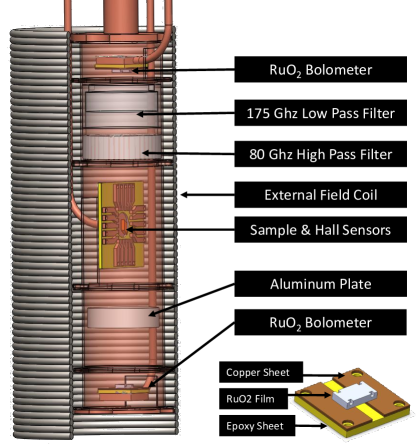
The experiment is preformed below K in order to have temperature independent quantum tunneling Wernsdorfer2000 ; Caneschi1999 . Fig. 1 depicts the experimental setup, which is located inside the inner vacuum chamber of the DR. The cooling of the sample and all detectors is provided via copper cold fingers attached to the mixing chamber (MC) of the DR. The magnetization is measured using a Hall sensor array placed at the center of a magnet. The array is made of Hall bars of dimensions 100100 m2 with 100 m interval; the active layer in these sensors is a two-dimensional electron gas formed at the interface of GaAs/AlGaAs heterostructure. The surface of the Hall sensor is parallel to the applied field. Consequently, the effect of the applied field on the sensor is minimal and determined only by the ability to align the array surface and field. The sample with the Hall sensor is located in the middle of a copper cylinder, which acts as a wave guide and is also thermally linked to the MC.
Two bolometers are located at both ends of the cylinder. The bolometer configuration is also shown in Fig.1. The bolometers are made of a RuO2 thermistor attached to absorbing sheets. The thermistor is a standard LakeShore RX-202A with typical temperature dependent resistance. The thermistor is soldered from both sides to the copper sheets and copper GE-varnish coated wires are soldered to the sheets. The thermistors are biased by AC current of nA and their voltage is measured with a lock-in amplifier.
The absorbing sheets consisted of two copper plates mmmmm in size, with a gap between them. The RuO2 thermistor is bridging the gap. A thermally isolating layer of Glass Epoxy FR-4 is placed under the absorbing sheets. The bolometers are mounted on a printed circuit board and have a weak thermal link to the MC.
Between one of the bolometers and the sample there is a combination of two filters making a 80-180 Ghz band pass. The high pass is a ‘thick grill filter’ based on waveguide cut-off Timusk1981 and the low pass is based on a mesh grid Ulrich1967 . We will refer to this bolometer and filter combination as the “open” side. The other bolometer is totally blocked from radiation by a thick aluminum plate. The blocked side serves as the test experiment; the radiation is to be detected by the open bolometer only. The band-pass filter was tested at room temperature, using Spacek Labs GW-110-10 Gunn oscillator source operating at 110 GHz and DW-2P broad band detector.
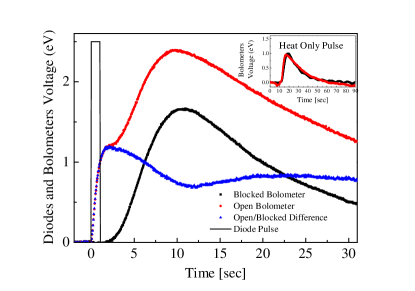
We test the response of the bolometers to a pulse of radiation in-situ by replacing the Fe8 sample with two Fairchild LED56 diodes that are pointing in both directions of the cylinder. The diodes are thermally connected directly to the K pot of the DR for better cooling power. The diodes’ bias power is selected so as to give a similar energy pulse to the bolometers as a tunneling event with the Fe8 sample (see below). In Fig. 2 we plot the open and blocked bolometers voltage as a function of time after energizing the diodes. The solid line indicates the voltage across the diodes as a function of time. The bolometer voltage is proportional to the temperature of the thermistor. The temperature of the bolometer which is open to radiation increases more and earlier than the blocked one. A few seconds later, the thermal energy from the diodes reaches both bolometers simultaneously. We also test the ability of the two bolometers to detect thermal energy. The inset of Fig. 2 shows the case when the sample area is heated by a resistor. The power and duration of this heat pulse are again similar to that produced by the Fe8 sample (see below). In this case the temperature of both bolometers increases simultaneously to equal temperature. Therefore, by subtracting the voltage of the bolometers, and focusing on the early time before thermal energy arrives to the bolometers, we obtain the signal of electromagnetic radiation only. This signal is also depicted in Fig. 2 and demonstrates that we can clearly detect electromagnetic radiation emitted from the diodes using our experimental setup.
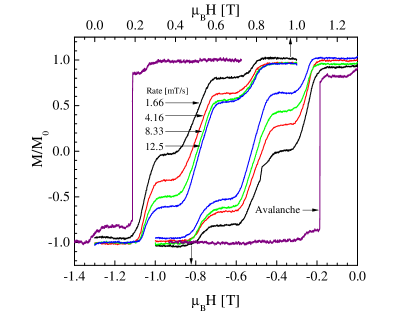
In the experiment with Fe8, the molecules are polarized by applying a magnetic field of T in the direction. Afterwards, the magnetic field is swept to T. The sweep is done at different sweep rates. During the sweep we record the Hall voltages, the external field, and the bolometers’ voltage. The normalized magnetization is given by the Hall voltage divided by the voltage at T. We found that depending on the sweep rate, magnetization reversal can occur in two different ways: a continuous reversal with multiple steps at matching fields, or fast abrupt reversal, in avalanche form, as shown in Fig. 3. We look for electromagnetic radiation in both cases. In the avalanche process, a large amount of heat is released and a clear tunneling front is present Leviant1 . Without avalanche, the temperature of the sample remains low compared to the energy barrier. In this case, a unique quanta of energy should be emitted in the tunneling process.
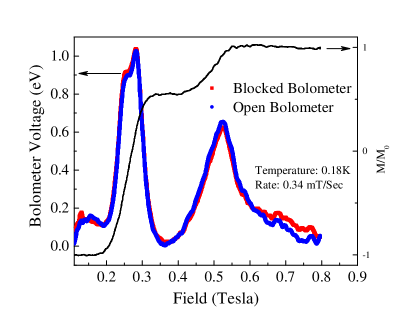
The results of our experiment in the case of multiple magnetization steps are shown in Fig. 4. The left ordinate is the bolometers voltage. The right ordinate is the normalized magnetization . Both are plotted as a function of applied magnetic field. The external field is swept at a rate of mT/sec from positive to negative. When the external field is at matching value a QTM occurs followed by rise of the bolometers voltage/temperature. However, there is no difference between the opened and the blocked bolometer for neither of the transitions. The same results are obtained at higher sweep rates with avalanches. Therefore, we can not find indication of electromagnetic radiation emanating from Fe8 regardless of the sweep rate or transition index . This is the main finding of this work.
However, it is interesting to notice that at the second transition it takes the bolometers more time (longer field interval) to cool down than at the first transition. This could have two possible explanations: (I) The lifetime of the excited state is longer than the state. This possibility stands in contrast to lifetime measurements by Bahr et al. Bahr2008 , although they where done at higher temperatures. (II) As we sweep the field there are more transitions from the metastable state to excited states. As increases the magnetization change becomes smaller but the energy released becomes larger. It is conceivable that we are unable to detect magnetically the higher transitions but can detect their energy release. More experiments are required to distinguish between the two possibilities.
To summarize, we re-examine the possibility that Fe8 emits electromagnetic radiation after tunneling events using a specially designed experimental setup. With this experiment we can not detect photon emission and can not reproduce the results that were reported previously Oren . We conclude that energy is released after tunneling in Fe8 only in the form of thermal energy. This is important for understanding the role of phonons in the tunneling process.
The study was partially supported by the Norman and Helen Asher foundation for space research and by the Russell Berrie Nanotechnology Institute, Technion, Israel Institute of Technology
References
- (1) Oren Shafir and Amit Keren. Phys. Rev. B, 79,180404 (2009).
- (2) A.-L. Barra, P. Debrunner, D. Gatteschi, Ch. E. Schulz, and R. Sessoli, Europhys. Lett. 35, 133 (1996).
- (3) R. Caciuffo, G. Amoretti, A. Murani, R. Sessoli, A. Caneschi, and D. Gatteschi, Phys. Rev. Lett. 81, 4744 (1998).
- (4) W. Wernsdorfer, R. Sessoli, A. Caneschi, D. Gatteschi, A. Cornia, and D. Mailly, J. Appl. Phys. 87, 5481 (2000).
- (5) A Caneschi, D Gatteschi, C Sangregorio, R Sessoli, L Sorace, A Cornia, M.A Novak, C Paulsen, W Wernsdorfer, J. Magn. Magn. Mater. 200,182 (1999).
- (6) T. Timusk and P. L. Richards. Appl. Opt. 20, 1355-1360 (1981).
- (7) Ulrich, R. Infrared Phys. 7, 37-55 (1967).
- (8) T. Leviant. Quantum avalanche in the Fe8 Nano-Magnet, in preperation.
- (9) S. Bahr, K. Petukhov, V. Mosser, W. Wernsdorfer, Phys. Rev. B. 77, 064404 (2008)