Finite-temperature phase transitions in the ionic Hubbard model
Abstract
We investigate paramagnetic metal-insulator transitions in the infinite-dimensional ionic Hubbard model at finite temperatures. By means of the dynamical mean-field theory with an impurity solver of the continuous-time quantum Monte Carlo method, we show that an increase in the interaction strength brings about a crossover from a band insulating phase to a metallic one, followed by a first-order transition to a Mott insulating phase. The first-order transition turns into a crossover above a certain critical temperature, which becomes higher as the staggered lattice potential is increased. Further, analysis of the temperature dependence of the energy density discloses that the intermediate metallic phase is a Fermi liquid. It is also found that the metallic phase is stable against strong staggered potentials even at very low temperatures.
pacs:
71.10.Fd, 71.30.+hI Introduction
The effects of correlations between electrons have been one of the most fascinating topics in modern condensed matter physics. A variety of remarkable phenomena such as superconductors with high critical temperatures Dagotto (1994) and interaction-driven metal-insulator transitions Imada et al. (1998) is well known to arise from electron correlations. In describing such electron correlations, the Hubbard model (HM) opened a new paradigm. It has proved to be successful in capturing the essential physics of correlation-induced phenomena by incorporating just a few simple ingredients: tight-binding electrons with the local Coulomb interaction. Interesting variants of the HM have been proposed to investigate correlation effects in the band insulator (BI). One of the popular examples is the ionic Hubbard model (IHM), where tight-binding electrons interact via the local Coulomb interaction under a staggered lattice potential. Hubbard and Torrance (1981); Torrance et al. (1981a, b) It was first applied to the study of the neutral-ionic transition in a charge-transfer organic chain Nagaosa and Takimoto (1986); Avignon et al. (1986); Luty and Kuchta (1987); Yonemitsu (2002); Wilkens and Martin (2001); Lemée-Cailleau et al. (1997); Caprara et al. (2000); Caprara (2000); Horiuchi et al. (2000); Anusooya-Pati and Soos (2001) and also suggested as a model for the polarization phenomena of ferroelectric perovskite materials Egami et al. (1993); Ishihara et al. (1994); Resta and Sorella (1995); Ortiz et al. (1996); Gidopoulos et al. (2000); Torio et al. (2001) and Kondo insulators such as FeSi and FeSb2. Kuneš and Anisimov (2008)
On a bipartite lattice, the staggered lattice potential of the IHM doubles the periodicity of the system, giving rise to a gap at the zone boundary. Accordingly, in the noninteracting limit the system prefers a band insulating phase where most electrons stay on a sublattice with lower potential. The resulting BI competes with a Mott insulator (MI) with one electron per lattice site, which is driven by local interactions. This competition is expected to enrich the physics in the transition between the two phases, which has been studied theoretically for decades.
The emergence of an intermediate phase has been studied in one dimension Luty and Kuchta (1987); Fabrizio et al. (1999); Wilkens and Martin (2001); Zhang et al. (2003); Manmana et al. (2004); Kampf et al. (2003); Go and Jeon (2008, 2011); Yonemitsu (2002); Požgajčić and Gros (2003); Aligia and Batista (2005); Aligia (2004); Fabrizio et al. (1999, 2000); Japaridze et al. (2007); Batista and Aligia (2004); Torio et al. (2006); Manmana et al. (2004); Kampf et al. (2003); Lou et al. (2003); Tincani et al. (2009); Otsuka and Nakamura (2005); Zhang et al. (2003) and in two dimensions. Paris et al. (2007); Bouadim et al. (2007); Kancharla and Dagotto (2007); Chen et al. (2010) In one dimension, it was revealed by the bosonization method that a spontaneously dimerized insulating phase shows up between the BI and the MI, Fabrizio et al. (1999, 2000); Japaridze et al. (2007); Batista and Aligia (2004); Torio et al. (2006) which was confirmed subsequently in numerical studies. Manmana et al. (2004); Kampf et al. (2003); Lou et al. (2003); Tincani et al. (2009); Otsuka and Nakamura (2005); Zhang et al. (2003) Some peculiar spectral properties such as spin-charge separation were als studied by the cellular dynamical mean-field theory (DMFT). Go and Jeon (2008, 2011) Extensive investigations have also been made into the effects of additional degrees of freedom on the one-dimensional IHM, including electron-lattice coupling, Avignon et al. (1986); Luty and Kuchta (1987); Caprara et al. (2000) spin-density wave, Tugushev et al. (1996); Caprara (2000); Požgajčić and Gros (2003); Caprara et al. (2000) next-nearest-neighbor interaction, Avignon et al. (1986); Luty and Kuchta (1987); Caprara (2000); Yonemitsu (2002); Aligia and Batista (2005); Torio et al. (2001) asymmetry in electron hopping, Yonemitsu (2002); Wilkens and Martin (2001) alternating Hubbard interaction, Požgajčić and Gros (2003) periodicity of the lattice, Torio et al. (2006) coupling with conducting leads, Aligia et al. (2004) and next-nearest neighbor hopping. Japaridze et al. (2007) As to the nature of the intermediate phase in two dimensions, there is some controversy: The determinant quantum Monte Carlo study Paris et al. (2007); Bouadim et al. (2007) predicted a metallic phase, while an insulating phase was observed via the cellular DMFT or the variational cluster approach. Kancharla and Dagotto (2007); Chen et al. (2010)
In infinite dimensions, on the other hand, the single-site DMFT has revealed two successive metal-insulator transitions at zero temperature. Garg et al. (2006); Craco et al. (2008); Byczuk et al. (2009); Lombardo et al. (2006) Weak interactions tend to reduce the single-particle gap, driving the system into a metallic phase. The system eventually becomes an MI, caused by the further increase in the interaction strength. Here it is remarkable that a metallic phase emerges due to correlation effects of Coulomb interactions; this is in sharp contrast with the intermediate insulating phase, which is confirmed in the one-dimensional IHM. The effects of antiferromagnetic ordering induced by local interactions have also been studied in the IHM. Byczuk et al. (2009); Wang et al. (2014)
In this paper, we focus on the finite-temperature properties of the transitions between paramagnetic phases in the infinite-dimensional IHM at half-filling. We adopt the DMFT combined with the continuous-time quantum Monte Carlo (CTQMC) method. Rubtsov et al. (2005); Werner et al. (2006); Gull et al. (2008, 2011) First, the spectral properties of the IHM are examined at finite temperatures. The Fermi-level spectral weight, which can be estimated from the imaginary-time Green function, demonstrates that with an increase in the local interaction the system exhibits a crossover from BI to metal, which is followed by a discontinuous transition to an MI. The spectral function as well as local quantities such as double occupancy and staggered charge also supports the above description of the transition behaviors. The energy density, which can be measured directly from the CTQMC method, shows that the metallic phase always has a lower energy than the Mott insulating phase within the coexistence region as in the standard HM. The resulting finite-temperature phase diagram illustrates that the crossover interaction strength between metal and MI decreases with the temperature. It is also found that the metal-MI transition is similar to that in the HM while the critical temperature tends to increase as the staggered lattice potential becomes stronger. The dependence of the total energy density on the temperature indicates that the correlation-driven metallic phase is a Fermi liquid. The phase diagram at very low temperatures shows that the metallic phase persists for very strong staggered lattice potentials.
This paper is organized as follows: In Sec. II we introduce the IHM and describe how to deal with the model by the single-site DMFT with the CTQMC as an impurity solver. Section III presents the results of our numerical calculations. We examine spectral properties, local quantities, and several components of energy densities, based on which the phase diagram is constructed. We also investigate the nature of the intermediate metallic phase and the dependence of the transition on the strength of the staggered lattice potential. Finally, we conclude the paper by summarizing the results in Sec. IV.
II MODEL AND METHODS
We consider the IHM on a bipartite lattice, the Hamiltonian of which is given by
| (1) | |||||
where / is the annihilation/creation operator of an electron with spin at the th lattice site. The corresponding number operator is defined to be . The parameters and represent the nearest-neighbor hopping amplitude and the Hubbard interaction, respectively. The lattice is a bipartite one composed of two sublattices, and , and the local lattice potential energy is given by
| (2) |
In this work we adopt the single-site DMFT, which is exact in infinite dimensions. Georges et al. (1996) Within the DMFT, the original lattice model is mapped onto a single-impurity Anderson model, which is described by the Hamiltonian
| (3) | |||||
Here / is the annihilation/creation operator of an electron at the impurity corresponding to sublattice , and / is the annihilation/creation operator of an electron at the th bath site which has on-site energy and is coupled with the impurity via the hybridization matrix element .
The structure of a bipartite lattice leads to an impurity Green function of the form
| (4) |
for and , where is the bare density of states (DOS) of the lattice and with the self-energy and Matsubara frequency . The calculation is performed on the Bethe lattice, where the DOS is given in the semicircular form: . Through this paper we use the half-band width as the unit of energy.
The DOS of a semicircular form allows analytic integration of Eq. (4), which yields
| (5) |
With the help of the particle-hole symmetry, we have the following relations:
| (6) |
Then the Dyson’s equation, , reduces to
| (7) |
which imposes the self-consistency relation on the impurity problem.
We solve the impurity problem only in sublattice to obtain from by means of the CTQMC method based on the hybridization expansion, which has proven to be efficient particularly in the strong-interaction regime. We typically use Monte Carlo steps for each DMFT iteration, which turns out to be sufficient to achieve the required accuracy of the Green function at the lowest temperature, . The self-consistency loop is iterated 50 times for the convergence of the solution within the DMFT.
III Results
III.1 Spectral properties

To probe the metal-insulator transitions, we consider the Fermi-level spectral weight:
| (8) | |||||
where is the spectral function of sublattice . At very low temperatures is approximately the same as the Fermi-level spectral function . Since the imaginary-time Green function can be measured directly from Monte Carlo sampling, it is frequently used to examine the metal-insulator transition. Trivedi and Randeria (1995); Gull et al. (2008, 2010)
In Fig. 1, we present the Fermi-level spectral weight as a function of the temperature and the interaction strength . The colored plot on the plane of and clearly demonstrates that two insulating phases (dark regions) are separated by an intermediate metallic phase (bright region). As clarified in the existing zero-temperature studies, Garg et al. (2006); Craco et al. (2008); Byczuk et al. (2009) the insulating phase for weak interactions correspond to a BI, while that at strong interactions represents an MI.
The BI connects smoothly with the metallic phase via a finite-width crossover region at finite temperatures. As the temperature is lowered, the onset value of becomes steeper and the size of the crossover region decreases appreciably; this is consistent with the continuous transition observed at zero temperature.
For strong interactions, on the other hand, we observe a rather steeper transition between the metal and the MI at finite temperatures. Below a certain critical temperature, the Mott transition turns out to be of first order, which is evidenced by the presence of the hysteretic behavior displayed at in Fig. 1(b). Accordingly, we have lower and upper transition interaction strengths, and , at which MI and metallic phases become unstable, respectively. Thermodynamic phase transitions occur between and at finite temperatures; the determination of the phase transition line is discussed later. Above the critical temperature, the boundary between the metal and the MI also appears as a crossover, and the crossover region expands as the temperature is increased.
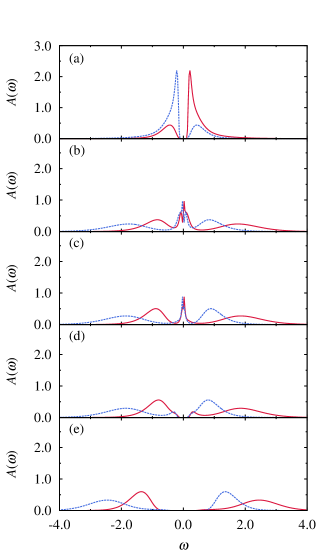
We use the maximum entropy method (MEM) for analytic continuation of the Matsubara Green function to the real frequency domain and obtain the spectral function . The resulting spectral function is presented in Fig. 2. In the region of weak interactions, the single-particle gap is formed around the Fermi level with singular behavior at the band edge, which is reminiscent of the noninteracting DOS with a van Hove singularity. We also observe that in the occupation of each sublattice there is a significant imbalance between and sublattices, which is a characteristic feature of the BI.
On the other hand, the Mott gap emerges with a prominent four-peak structure for strong interactions. For a given sublattice, two peaks correspond to the upper and the lower Hubbard bands, respectively. The upper or lower Hubbard bands on different sublattices are separated by the staggered lattice potential . Both Hubbard bands on sublattice , having the lower lattice potential, are located at a lower energy compared with those on sublattice .
In the intermediate-interaction region, we observe a metallic phase with a finite spectral weight at the Fermi level. In this phase a quasiparticle peak near the Fermi level is surrounded by four Hubbard bands, and the disappearance of the quasiparticle peak signifies the onset of a Mott phase. The quasiparticle peak also shows pseudogap-like behavior around the Fermi level, which is discussed in the zero-temperature study. Craco et al. (2008) At temperature , there exists a coexistence region where both metal and MI are locally stable. Figures 2(c) and 2(d) correspond to metallic and insulating solutions, respectively. The overall features of the spectral functions are in good agreement with the previous zero-temperature results obtained via NRG. Byczuk et al. (2009)
Before going on to the next section, we make some comments on the stability of our MEM procedure. The stability investigation shows that our MEM procedure is reliable enough to characterize the fine structures of spectral function. For example, the pseudogap-like behavior around the Fermi level in Fig. 2(b) is robust against the statistical fluctuations of the imaginary-time Green function. In our calculations the statistical error of the imaginary-time Green function is around order . We have also checked the stability of the MEM procedure by examining the dependence on the model function and the scaling parameter selection, which turns out to have negligible effects on the resulting spectral function.
III.2 Local quantities
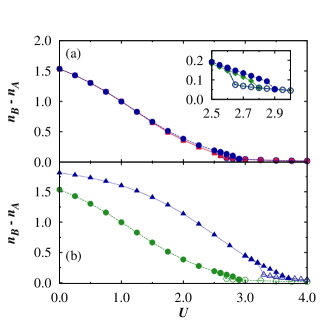
The staggered charge density is given by the difference between the number densities at two sublattices, , with the sublattice number density defined to be for and . We also compute the double occupancy given by
| (9) |
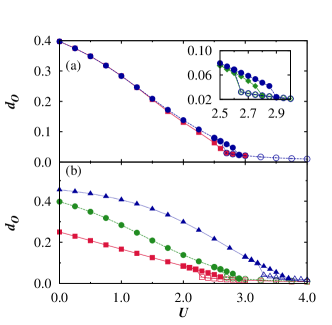
The results for the double occupancy and the staggered charge density are shown in Figs. 3 and 4. In the IHM, the interaction strength competes with the staggered lattice potential due to different favorable electron configurations. While the staggered lattice potential forces electrons to stay at the lower potential sites on sublattice , the interaction, giving rise to energy cost, tends to prevent two electrons from occupying the same site. In the weak-interaction region, electrons prefer to gather on sublattice and the system experiences an imbalance between the two sublattices, resulting in a higher double occupancy, compared with the HM, corresponding to , and a nonzero staggered charge density. Such tendencies become stronger as grows.
As the interaction strength is increased, both the double-occupancy and the staggered charge density decrease monotonically with the imbalance between the two sublattices becoming weaker. In the MI phase, the staggered charge density is close to . However, the sublattice symmetry is broken in the Hamiltonian of the IHM and the staggered charge density does not exactly vanish for any finite .
In the coexistence region, the metallic phase always exhibits higher values of the staggered charge density and double-occupancy than those in the MI phase. The data at two temperatures, and , are compared in the insets in Figs. 3 and 4. It is observed that the coexisting region widens as the temperature is lowered. Further, the critical interaction strength is shown to increase with the staggered lattice potential.
III.3 Energy density
Here we attempt to analyze the competition of the phases in terms of energy densities. At finite temperatures the free energy will also have the contribution of the entropy. We expect that the energy analysis given below is still valid for explaining the qualitative behaviors at low temperatures considered. The DMFT solution gives the total, kinetic, lattice potential, and interaction energies per site in the forms:
| (10) |
where is the average perturbation order of the spin electron at the impurity of sublattice . This can be directly measured from CTQMC simulations. Werner et al. (2006); Haule (2007); Kim et al. (2014)
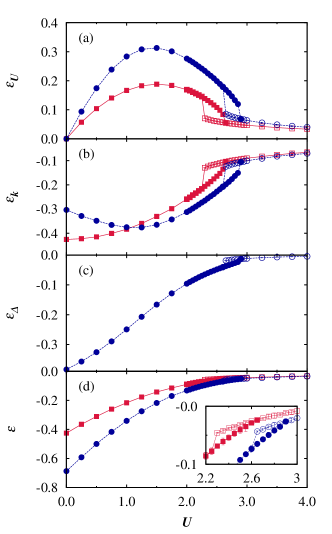
In Fig. 5 we plot all four energy densities for , together with those in the HM. Comparison between HM and IHM results indicates that for weak interactions, the gain in the staggered lattice potential energy exceeds the sum of the loss of both interaction and kinetic energies. In consequence, the total energy of the IHM is lower than that of the HM, which agrees with the characteristic behavior of the BI.
In the metallic region, the kinetic and interaction energies of the IHM behave qualitatively the same as those of the HM. Quantitatively, the kinetic energy of the IHM is, in general, lower than that of the HM with the same interaction strength. We also observe that the kinetic energy increases with the interaction strength , which is in sharp contrast to the generally decreasing behavior in the BI. Such different behaviors of the metal and the BI give rise to a minimum of the kinetic energy at the interaction strength which generally coincides with the boundary between the BI and the metal.
In the MI phase, the staggered lattice potential energy becomes negligible; as a result, the total energy difference between the HM and the IHM decreases significantly and monotonically as the interaction strength is increased. At the boundary between the MI and the metal, a first-order Mott transition is also present in the IHM. The critical interaction strength increases when the staggered lattice potential is introduced. In the coexistence region, the total energy density in the metallic phase is always lower than that in the MI phase, which also holds in the case of the HM. Georges et al. (1996) We expect that at zero temperature the IHM also undergoes a continuous phase transition between the MI and the metal at the critical strength .
III.4 Finite-temperature phase transition

Based on the spectral properties as well as the local quantities, we may now construct the phase diagram of the IHM. Figure 6 exhibits the phase diagram for on the plane of the temperature and the interaction strength . There exist three phases: metal, BI, and MI. The BI and metal are connected through a crossover region while a first-order Mott transition separates the metal from the MI.
As shown in Fig. 1(b), the onset of becomes steeper as the temperature is lowered. Accordingly, at zero temperature, the transition between the BI and the metal is expected to be continuous with a kink in . In order to estimate the crossover interaction strength at low temperatures, we obtain a best linear fit of the area in which grows rather linearly in the metallic region. We then estimate by the intersection point of the fitting line and . The half-width of the crossover region is also identified as the distance from to the linear region. As the temperature is raised, the resulting tends to decrease and the width of the crossover-region increases. It is also notable that estimated via CTQMC-DMFT in this work gradually approaches the zero-temperature value obtained via NRG-DMFT. Byczuk et al. (2009)
At low temperatures we observe the coexistence region of the BI and metal between and , which can be identified by spectral functions and local quantities such as double-occupancy and staggered charge densities. With an increase in the temperature, and become closer, and the coexistence region ceases to exist at a certain critical temperature, above which the transition between the MI and the metal also appears as a crossover. These general features are rather similar to those of the Mott transition in the HM. Further, the extrapolation of and to zero temperature is quite consistent with that of NRG-DMFT results. Byczuk et al. (2009)
By solving the differential equations constructed from the free-energy analysis, we can obtain the first-order phase transition line, which is denoted by the solid line in Fig. 6. Using the thermodynamic relation
| (11) |
we construct the differential equation of the interaction strength of the first-order transition as a function of ,
| (12) |
with being fixed. Here is the free-energy density and and are the differences in the energy and the double-occupancy between metal and MI in the coexistence region, respectively. The numerical integration of Eq. (12) gives the first-order transition line. The CTQMC procedure has the advantage that one can obtain the quantities necessary for the differential equations directly from Monte Carlo sampling without any further approximation. The details of the method can be found in Ref. Kim et al., 2014, where the HM is investigated by the same method. The resulting transition line is plotted by the solid line in Fig. 6. The phase transition point at zero temperature is very close to obtained from NRG-DMFT, implying that the transition is continuous at zero temperature; this is also the case in the HM without a staggered lattice potential.
III.5 Nature of the intermediate metallic phase
One interesting issue is the nature of the metallic phase present in the region of intermediate interaction strengths. The metallic phase, which is driven by correlations from the BI, displays a peculiar pseudo-gap-like structure in the spectral function near the Fermi level, as demonstrated in Fig. 2. Such features raise the question whether the phase exhibits Fermi-liquid behavior.
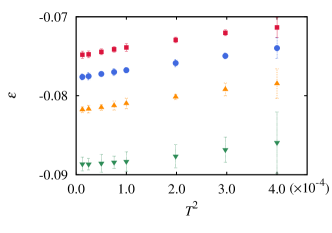
According to the Fermi-liquid theory, the total energy density is proportional to at low temperatures. As a relevant check, we calculate the total energy density at various temperatures and show the results in Fig. 7 for various values of . Indeed appears to be proportional to within statistical errors for all values of examined and we presume that the metallic phase appearing in the IHM is a Fermi liquid. In addition, we have also computed the imaginary part of the self-energy, to find that the quasiparticle has an infinite lifetime at the Fermi level; this is also consistent with the Fermi-liquid picture.
III.6 Critical point of the Mott transition
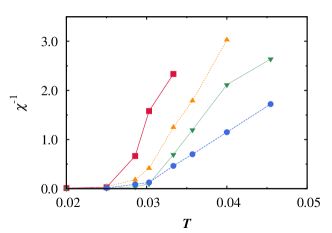
In this subsection, we consider how the phase diagram depends on the staggered lattice potential . Specifically, we compute the critical temperature of the Mott-Hubbard transition for various values of . One way of obtaining is to utilize the divergence of the susceptibility at the critical point. By analogy with a fluid system, Rozenberg et al. (1999) we define the susceptibility as
| (13) |
at given temperature . In view of the divergence at the critical point, one can identify the critical temperature as the temperature where the inverse susceptibility vanishes. In Fig. 8 we plot the inverse susceptibility versus temperature for several values of . For given , as the temperature is lowered, the inverse susceptibility decreases and eventually vanishes, from which the critical temperature can be estimated. Figure 8 illustrates that the critical temperature generally increases with the strength of the staggered lattice potential.
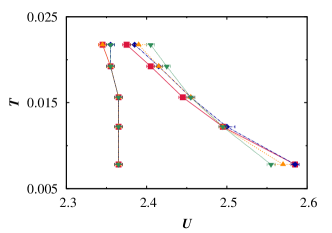
We can reach a similar conclusion when we consider the critical interaction strengths and directly. As demonstrated in Fig. 9, variations in with temperature are rather insensitive to the value of , while the increase in suppresses the change in with the temperature. This implies that the critical point is located at higher temperatures for larger values of .
III.7 Phase diagram at low temperatures
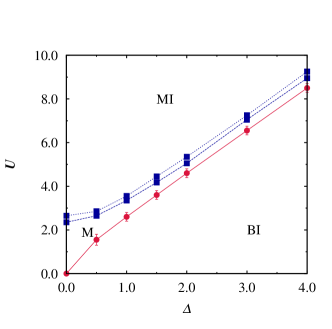
Figure 10 depicts three regions, corresponding to the BI, metal, and MI phases on the plane of and at temperature , which is the lowest temperature examined. We can observe two prominent differences between the resulting phase diagram and the two zero-temperature phase diagrams obtained in IPT-DMFT studies Garg et al. (2006); Craco et al. (2008).
First, in our phase diagram the crossover interaction strength increases gradually from as is turned on. This is quite in contrast with the rather drastic increase for small in Ref. Garg et al., 2006. Further, here the width of the metallic region apparently remains constant above , which suggests that the metallic phase should extend to high values of . We have indeed confirmed its existence even for . This qualitatively contradicts the existing prediction that the metallic phase would cease to exist around , beyond which a coexistence region between the BI and the MI develops. Craco et al. (2008) At this stage the origin of the discrepancy is not clear and its resolution may require further study.
IV summary
We have studied the IHM in infinite dimensions by means of the DMFT combined with the CTQMC method. The dependence of the double-occupancy and the staggered charge density on the interaction strength as well as the Fermi-level spectral weight exhibits crossover behavior from a BI to a metal and, subsequently, a transition to an MI. The transition to an MI is of the first order, and the critical temperature has been found to be higher for stronger staggered lattice potentials. Analyzing the temperature dependence of the energy density, we have shown that the intermediate metallic phase is a Fermi liquid. Finally, when the staggered lattice potential is strong, this metallic phase has been found to persist even at very low temperatures.
Acknowledgements.
We thank Prof. P. Werner and Dr. H. Lee for helpful discussions on the CTQMC method and MEM. This work was supported by the National Research Foundation of Korea through Grants Nos. 2008-0061893 and 2013R1A1A2007959 (A.J.K and G.S.J.), and Grant No. 2012R1A2A4A01004419 (M.Y.C.).References
- Dagotto (1994) E. Dagotto, Rev. Mod. Phys. 66, 763 (1994).
- Imada et al. (1998) M. Imada, A. Fujimori, and Y. Tokura, Rev. Mod. Phys. 70, 1039 (1998).
- Hubbard and Torrance (1981) J. Hubbard and J. B. Torrance, Phys. Rev. Lett. 47, 1750 (1981).
- Torrance et al. (1981a) J. B. Torrance, J. E. Vazquez, J. J. Mayerle, and V. Y. Lee, Phys. Rev. Lett. 46, 253 (1981a).
- Torrance et al. (1981b) J. B. Torrance, A. Girlando, J. J. Mayerle, J. I. Crowley, V. Y. Lee, P. Batail, and S. J. LaPlaca, Phys. Rev. Lett. 47, 1747 (1981b).
- Nagaosa and Takimoto (1986) N. Nagaosa and J. Takimoto, J. Phys. Soc. Jpn. 55, 2735 (1986).
- Avignon et al. (1986) M. Avignon, C. A. Balseiro, C. R. Proetto, and B. Alascio, Phys. Rev. B 33, 205 (1986).
- Luty and Kuchta (1987) T. Luty and B. Kuchta, Phys. Rev. B 35, 8542 (1987).
- Yonemitsu (2002) K. Yonemitsu, Phys. Rev. B 65, 205105 (2002).
- Wilkens and Martin (2001) T. Wilkens and R. M. Martin, Phys. Rev. B 63, 235108 (2001).
- Lemée-Cailleau et al. (1997) M. Lemée-Cailleau, M. Le Cointe, H. Cailleau, T. Luty, F. Moussa, J. Roos, D. Brinkmann, B. Toudic, C. Ayache, and N. Karl, Phys. Rev. Lett. 79, 1690 (1997).
- Caprara et al. (2000) S. Caprara, M. Avignon, and O. Navarro, Phys. Rev. B 61, 15667 (2000).
- Caprara (2000) S. Caprara, Int. J. Mod. Phys. B 14, 3392 (2000).
- Horiuchi et al. (2000) S. Horiuchi, Y. Okimoto, R. Kumai, and Y. Tokura, J. Phys. Soc. Jpn. 69, 1302 (2000).
- Anusooya-Pati and Soos (2001) Y. Anusooya-Pati and Z. G. Soos, Phys. Rev. B 63, 205118 (2001).
- Egami et al. (1993) T. Egami, S. Ishihara, and M. Tachiki, Science 261, 1307 (1993).
- Ishihara et al. (1994) S. Ishihara, T. Egami, and M. Tachiki, Phys. Rev. B 49, 8944 (1994).
- Resta and Sorella (1995) R. Resta and S. Sorella, Phys. Rev. Lett. 74, 4738 (1995).
- Ortiz et al. (1996) G. Ortiz, P. Ordejón, R. M. Martin, and G. Chiappe, Phys. Rev. B 54, 13515 (1996).
- Gidopoulos et al. (2000) N. Gidopoulos, S. Sorella, and E. Tosatti, Eur. Phys. J. B 14, 217 (2000).
- Torio et al. (2001) M. E. Torio, A. A. Aligia, and H. A. Ceccatto, Phys. Rev. B 64, 121105 (2001).
- Kuneš and Anisimov (2008) J. Kuneš and V. I. Anisimov, Phys. Rev. B 78, 033109 (2008).
- Fabrizio et al. (1999) M. Fabrizio, A. O. Gogolin, and A. A. Nersesyan, Phys. Rev. Lett. 83, 2014 (1999).
- Zhang et al. (2003) Y. Z. Zhang, C. Q. Wu, and H. Q. Lin, Phys. Rev. B 67, 205109 (2003).
- Manmana et al. (2004) S. R. Manmana, V. Meden, R. M. Noack, and K. Schönhammer, Phys. Rev. B 70, 155115 (2004).
- Kampf et al. (2003) A. P. Kampf, M. Sekania, G. I. Japaridze, and P. Brune, J. Phys.: Condens. Matter 15, 5895 (2003).
- Go and Jeon (2008) A. Go and G. S. Jeon, J. Korean Phys. Soc. 53, 1006 (2008).
- Go and Jeon (2011) A. Go and G. S. Jeon, Phys. Rev. B 84, 195102 (2011).
- Požgajčić and Gros (2003) K. Požgajčić and C. Gros, Phys. Rev. B 68, 085106 (2003).
- Aligia and Batista (2005) A. A. Aligia and C. D. Batista, Phys. Rev. B 71, 125110 (2005).
- Aligia (2004) A. A. Aligia, Phys. Rev. B 69, 041101 (2004).
- Fabrizio et al. (2000) M. Fabrizio, A. Gogolin, and A. Nersesyan, Nucl. Phys. B 580, 647 (2000).
- Japaridze et al. (2007) G. I. Japaridze, R. Hayn, P. Lombardo, and E. Müller-Hartmann, Phys. Rev. B 75, 245122 (2007).
- Batista and Aligia (2004) C. D. Batista and A. A. Aligia, Phys. Rev. Lett. 92, 246405 (2004).
- Torio et al. (2006) M. E. Torio, A. A. Aligia, G. I. Japaridze, and B. Normand, Phys. Rev. B 73, 115109 (2006).
- Lou et al. (2003) J. Lou, S. Qin, T. Xiang, C. Chen, G.-S. Tian, and Z. Su, Phys. Rev. B 68, 045110 (2003).
- Tincani et al. (2009) L. Tincani, R. M. Noack, and D. Baeriswyl, Phys. Rev. B 79, 165109 (2009).
- Otsuka and Nakamura (2005) H. Otsuka and M. Nakamura, Phys. Rev. B 71, 155105 (2005).
- Paris et al. (2007) N. Paris, K. Bouadim, F. Hebert, G. G. Batrouni, and R. T. Scalettar, Phys. Rev. Lett. 98, 046403 (2007).
- Bouadim et al. (2007) K. Bouadim, N. Paris, F. Hebert, G. G. Batrouni, and R. T. Scalettar, Phys. Rev. B 76, 085112 (2007).
- Kancharla and Dagotto (2007) S. S. Kancharla and E. Dagotto, Phys. Rev. Lett. 98, 016402 (2007).
- Chen et al. (2010) H.-M. Chen, H. Zhao, H.-Q. Lin, and C.-Q. Wu, New J. Phys. 12, 093021 (2010).
- Tugushev et al. (1996) V. Tugushev, S. Caprara, and M. Avignon, Phys. Rev. B 54, 5466 (1996).
- Aligia et al. (2004) A. A. Aligia, K. Hallberg, B. Normand, and A. P. Kampf, Phys. Rev. Lett. 93, 076801 (2004).
- Garg et al. (2006) A. Garg, H. R. Krishnamurthy, and M. Randeria, Phys. Rev. Lett. 97, 046403 (2006).
- Craco et al. (2008) L. Craco, P. Lombardo, R. Hayn, G. I. Japaridze, and E. Müller-Hartmann, Phys. Rev. B 78, 075121 (2008).
- Byczuk et al. (2009) K. Byczuk, M. Sekania, W. Hofstetter, and A. P. Kampf, Phys. Rev. B 79, 121103(R) (2009).
- Lombardo et al. (2006) P. Lombardo, R. Hayn, and G. I. Japaridze, Phys. Rev. B 74, 085116 (2006).
- Wang et al. (2014) X. Wang, R. Sensarma, and S. das Sarma, Phys. Rev. B 89 (2014).
- Rubtsov et al. (2005) A. N. Rubtsov, V. V. Savkin, and A. I. Lichtenstein, Phys. Rev. B 72, 035122 (2005).
- Werner et al. (2006) P. Werner, A. Comanac, L. de’ Medici, M. Troyer, and A. J. Millis, Phys. Rev. Lett. 97, 076405 (2006).
- Gull et al. (2008) E. Gull, P. Werner, X. Wang, M. Troyer, and A. J. Millis, EPL 84, 37009 (2008).
- Gull et al. (2011) E. Gull, A. J. Millis, A. I. Lichtenstein, A. N. Rubtsov, M. Troyer, and P. Werner, Rev. Mod. Phys. 83, 349 (2011).
- Georges et al. (1996) A. Georges, G. Kotliar, W. Krauth, and M. J. Rozenberg, Rev. Mod. Phys. 68, 13 (1996).
- Trivedi and Randeria (1995) N. Trivedi and M. Randeria, Phys. Rev. Lett. 75, 312 (1995).
- Gull et al. (2010) E. Gull, M. Ferrero, O. Parcollet, A. Georges, and A. J. Millis, Phys. Rev. B 82, 155101 (2010).
- Haule (2007) K. Haule, Phys. Rev. B 75, 155113 (2007).
- Kim et al. (2014) A. J. Kim, M. Y. Choi, and G. S. Jeon, J. Korean Phys. Soc. 64, 268 (2014).
- Rozenberg et al. (1999) M. J. Rozenberg, R. Chitra, and G. Kotliar, Phys. Rev. Lett. 83, 3498 (1999).