Core-shell nanostructure in a Ge0.9Mn0.1 film from structural and magnetic measurements
Abstract
We have characterized a film of Ge0.9Mn0.1 forming self-organized nanocolumns perpendicular to the Ge substrate with high resolution scanning transmission electron microscopy combined with electron energy loss spectroscopy, and bulk magnetization and positive muon spin rotation and relaxation (SR) measurements. The Mn-rich nanocolumns form a triangular lattice with no detectable Mn atoms in the matrix. They consist of cores surrounded by shells. The combined analysis of bulk magnetization and SR data enables us to characterize the electronic and magnetic properties of both the cores and shells. The discovered phase separation of the columns between a core and a shell is probably relevant for other transition-metal doped semiconductors.
pacs:
75.75.Cd, 75.75.-c, 76.75.+iSpin-polarized carriers in spintronic applications may be conveyed by conventional metallic ferromagnets or by so-called ferromagnetic semiconductors. Until now semiconductor spintronics has mainly been based on diluted magnetic semiconductors Timm03 . Another route consists in the use of films with a well-defined pattern of transition metal-rich nanostructures with a relatively high-temperature ferromagnetic phase Bougeard06 ; Kuroda07 ; Bonanni08 . Nanocolumns as in Ge1-xMnx films Jamet06 ; Li07 are one of these structures.
The magnetic properties of these films have so far been investigated by x-ray magnetic circular dichroism Tardif10a ; Tardif14 and electron spin resonance Jain10 ; Jain11 , but the most conclusive results stem from superconducting quantum interference device (SQUID) magnetometry Devillers07 ; Yu10 . Here we resolve the structure and characterize the magnetism of the nanocolumns of a Ge0.9Mn0.1 film at the atomic scale using high resolution scanning transmission electron microscopy (STEM) supplemented with electron energy loss spectroscopy (EELS) analysis, and SQUID and muon spin rotation and relaxation (SR) measurements. We find the film to consist of nanocolumns embedded in a Ge matrix with less than 0.05 at. % of Mn. Each nanocolumn is made of a core surrounded by a shell with notable different magnetic properties. We suggest that this three-fold structural and magnetic phase separation is generic to impurity doped semiconductors with spinodal decomposition.
Our 80 nm-thick Ge0.9Mn0.1 film has been grown by molecular beam epitaxy at low temperature. Ge and Mn atoms have been co-evaporated at 100∘C on a Ge(100) substrate using standard Knudsen cells. Due to the very low solubility of Mn in Ge, a spontaneous two-dimensional spinodal decomposition takes place within the film at the early stage of the growth Fukushima06 . The following layer-by-layer growth leads to the formation of Mn-rich nanocolumns spanning the whole film thickness Jamet06 . Their average diameter is nm — see the images in the supplemental material SM . The nanocolumns form a slightly disordered triangular lattice with an average lattice parameter = 10 nm.
The STEM-EELS analysis was performed at room temperature with an ångström-sized electron probe SM . The SR spectra were recorded from 300 down to 5 K at the low energy muon (LEM) spectrometer Morenzoni04 ; Prokscha08 ; SM of the Swiss Muon Source (SS, Paul Scherrer Institute, Switzerland) with a 9 cm2 area sample. The spectra were taken either in zero or in a finite external field applied perpendicular to the film substrate.
Results of STEM-EELS measurements are presented in Fig. 1.
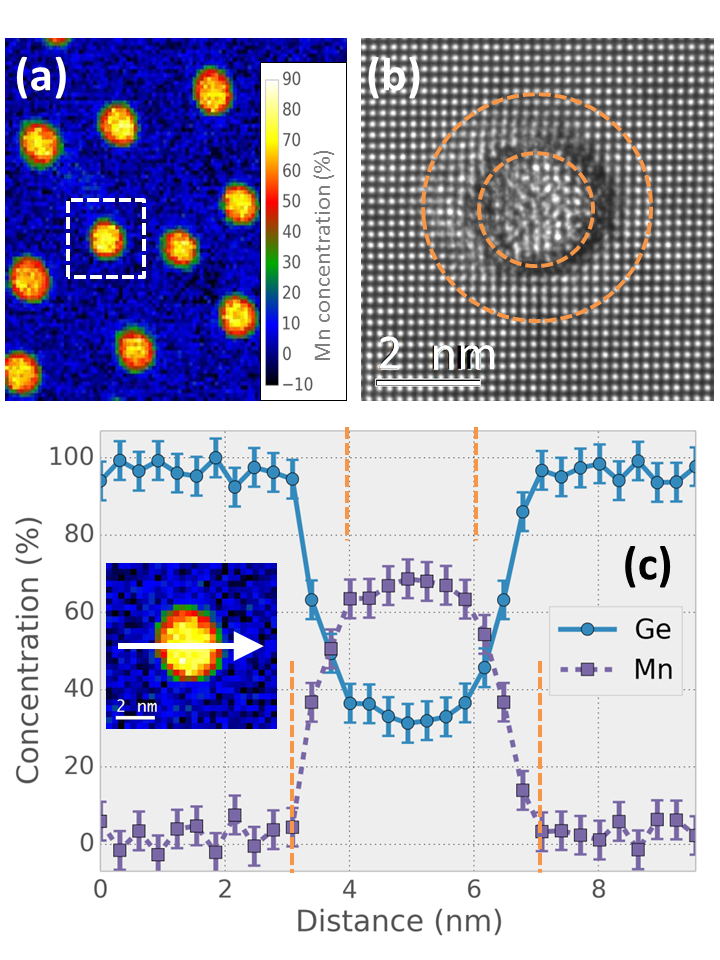
As shown in Fig. 1b, the nanocolumns exhibit a rather complex inner crystal structure and are surrounded by a Ge matrix with huge tensile strain up to %. The Mn content within the nanocolumns is not uniform. As shown in Fig. 1c, they exhibit a core-shell structure with a nm core diameter containing up to 70 at. % of Mn surrounded with a nm thick shell in which the Mn content decreases roughly linearly from 70 to less than 0.05 at. %, i.e. the detection limit, in the matrix. The average Mn content of at. % over the total area agrees with a previous estimate Mouton12 . Note the nanocolumn core high atomic density: atoms/nm3 to be compared to 44 atoms/nm3 in pure Ge. A close packed metallic structure is therefore formed in the nanocolumns. It is tempting to assign it to the most stable Ge-Mn alloy of formula Ge3Mn5 since its Mn atomic fraction of 5/8 is close to the value measured in the nanocolumns core Rovezzi08 . However, x-ray diffraction have definitely excluded the presence of the hexagonal Ge3Mn5 phase within the film Tardif10b . Magnetization measurements discussed later on also support this result since the magnetic moment per Mn in the core is much less than 2.6 /Mn in pure Ge3Mn5. The Mn atomic density varies from atoms/nm3 in the nanocolumns core down to approximately zero in the Ge matrix. Assuming a linear Mn concentration profile in the shell, we find that 3/7 (4/7) of Mn atoms are located in the nanocolumns core (shell).
We now discuss our magnetization measurements. With a Mn content less than 0.05%, any magnetic order within the Ge matrix can be ruled out. From Fig. 2a
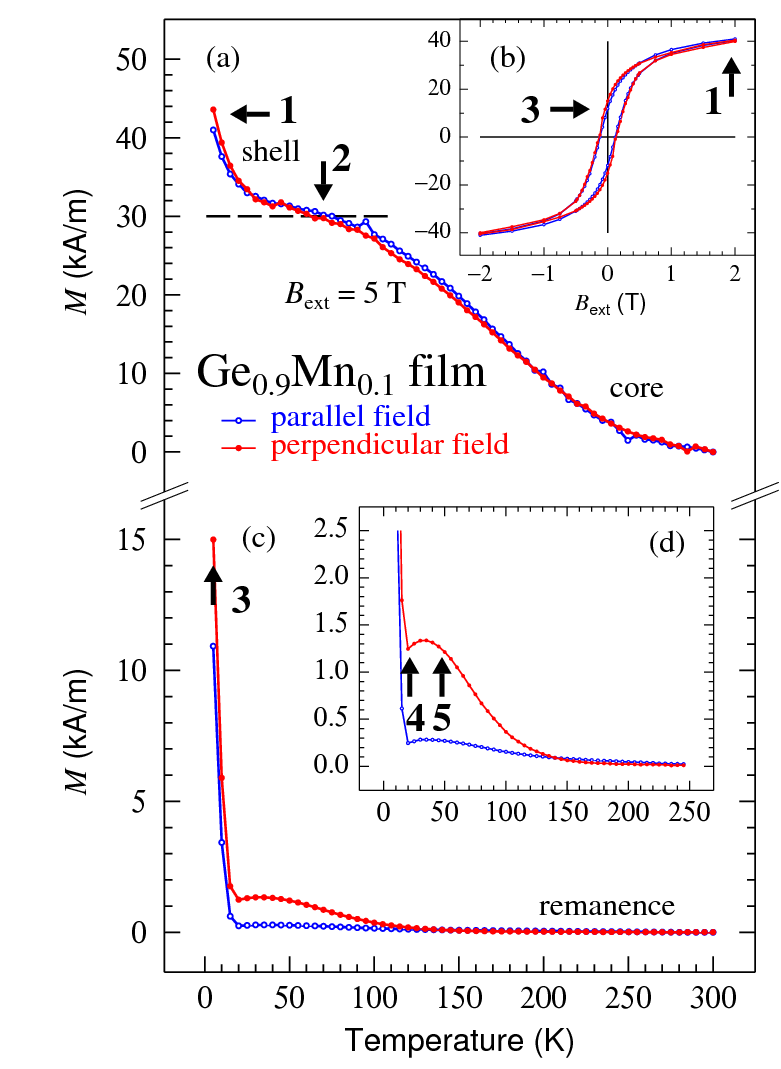
two magnetic transitions are inferred: a first one close to room temperature — to be better defined below by transverse-field (TF)-SR — at which the nanocolumn cores order, and a second one at K corresponding to the onset of magnetization in the shell, probably of the spin-glass type owing to the large Mn content change.
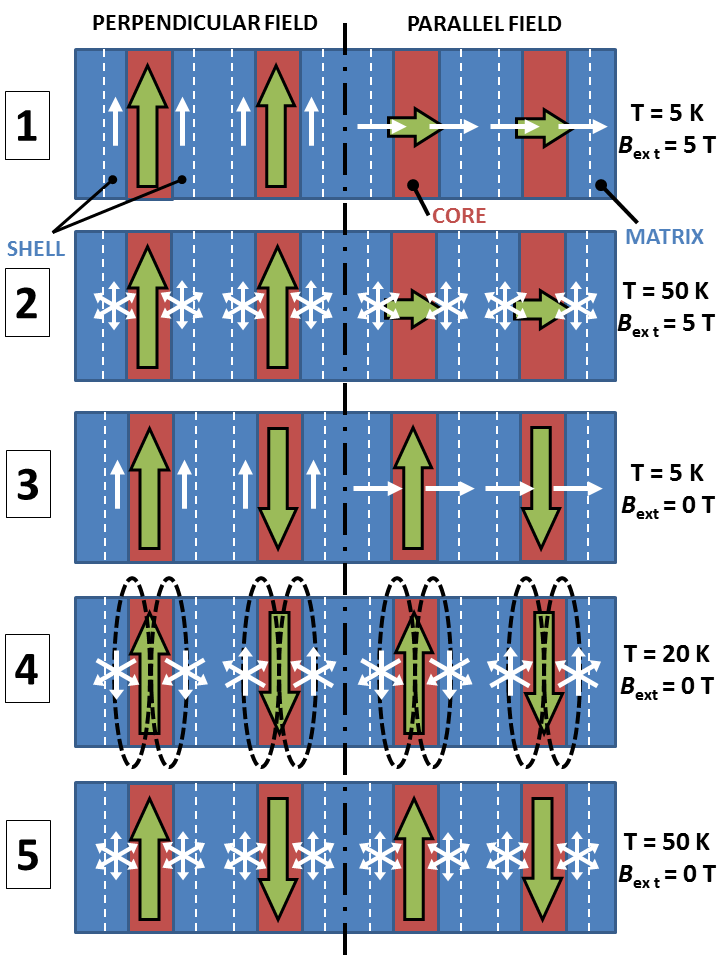
The respective magnetizations yield the magnetic moment per Mn in both phases: = 1.8 /Mn and an average = 0.6 /Mn. These values correspond to 827 kA/m and 124 kA/m saturation magnetizations when normalized to the core and shell volumes. The magnetic configurations denoted as 1 to 5 in Fig. 2 are depicted in Fig. 3. Considering their nanometer size, the nanocolumns behave as superparamagnetic nanostructures in SQUID measurements with a maximum blocking temperature = 150 K given by the vanishing remanence in Fig. 2c and the bifurcation between zero field cooling (ZFC) and field cooling (FC) curves in Fig. 4c.
We now analyze our remanence magnetic data in Figs. 2c and d. Because is very short an antiferromagnetic order of the nanocolumns should occur through the nanocolumn dipolar coupling Jamet06 . We thus expect no magnetic remanence at low temperature from the nanocolumns cores. In fact, at 5 K we observe quite a large remanent magnetic signal: almost 35% of the saturation magnetic moment. Moreover, it is nearly isotropic and almost disappears at 20 K; see Fig. 2d. This is the position of the ZFC peak in Fig. 4. Attributing the remanence to the shells, all the results are consistent with a parallel moment alignment in the shell below a critical temperature of 20 K. With this assignment we implicitely assume that there is no exchange magnetic coupling between the cores and shells. The remanent states denoted as 3, 4, and 5 in Figs. 2c and d are explicitely shown in Fig. 3. For perpendicular to the film substrate, a finite remanent signal is detected above 20 K. We attribute it to disorder within the nanocolumn array which inhibits a perfect cancelation of the core moments. The only coupling between the cores and shells is observed in configuration 4 where the paramagnetic Mn atoms in a given shell are polarized along the stray field from its core leading to a dip in the remanence curve of Fig. 2d.
SR spectroscopy was used to probe the nanocolumn magnetic state at the atomic scale. In Fig. 4a
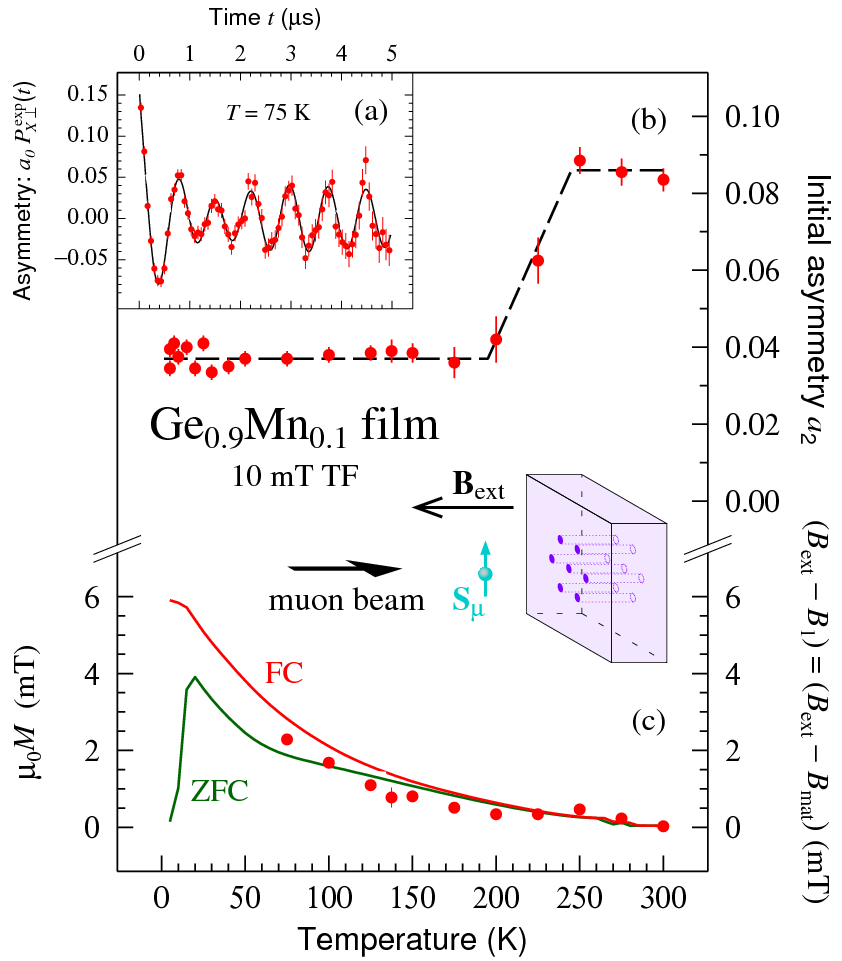
is shown a typical weak TF-SR spectrum recorded after a FC procedure. measures the evolution of the muon polarization in a plane perpendicular to Yaouanc11 . As explained in Ref. SM , for K
| (2) | |||||
where is a phase constant, , and and are free parameters. The stretched exponential accounts for the magnetic inhomogeneity and dynamics of the first component. The exponent has been set in consistency with zero-field (ZF) data SM . The relaxation rate is so large below 40 K that it cannot be determined with confidence. Still the second component can be analyzed after dropping the initial channels and setting in Eq. 2. The temperature dependences of and the field difference are displayed in Fig. 4.
Let us discuss the first component parameters. The matrix between the columns occupying a volume bigger than that of the columns, it is natural to set , where is the amplitude for the muons implanted in the matrix. As a consequence, = . From Fig. 4c the field difference is on the order of . The sign of this field can be understood as follows. In the absence of Mn atoms in the matrix, it is essentially the dipolar field produced by the nanocolumns and is therefore antiparallel to the column moments. We speculate the slight reduction in absolute value of the measured field compared to below 200 K (see Fig. 4c) to arise from Mn moments in the shell which are slightly polarized antiparallel to the cores.
We now deal with . As the film is cooled below 250 K, starts to decrease: the nanocolumns enter a magnetic ordered state. The transition is completed at K at which reaches a plateau. Therefore the transition width is K with an average ordering temperature = 225 K 111One could conceive the transition from the paramagnetic to superparamagnetic state of the column cores to take place above room temperature and that the blocking temperature corresponding to the TF-SR technique is around 225 K where drops — while it is around for the the SQUID measurements. Recalling that the characteristic time scale of TF-SR is 1 s in our case, this interpretation of the data would lead to an unrealistic short attempt time and therefore cannot hold.. In a weak TF-SR experiment the muons probing a magnetically ordered region — here the columns cores — and its vicinity are rapidly depolarized *[Seee.g.][]Luke94 and do not contribute to the signal. Therefore, we attribute the second component below 200 K to muons implanted in the sample surroundings, i.e. the so-called background with , a reasonable value. Above , the amplitude , corresponds to muons in the paramagnetic cores and their surroundings 222The film volume fraction corresponding to the column cores and the region within a distance from them is which is equal to provided that = 1.8 nm. Such a value is in the accepted range; see e.g. Niedermayer98 .
The spin dynamics in our film has been investigated by ZF-SR measurements. A selection of spectra with the initial muon polarization either parallel or perpendicular to the film substrate
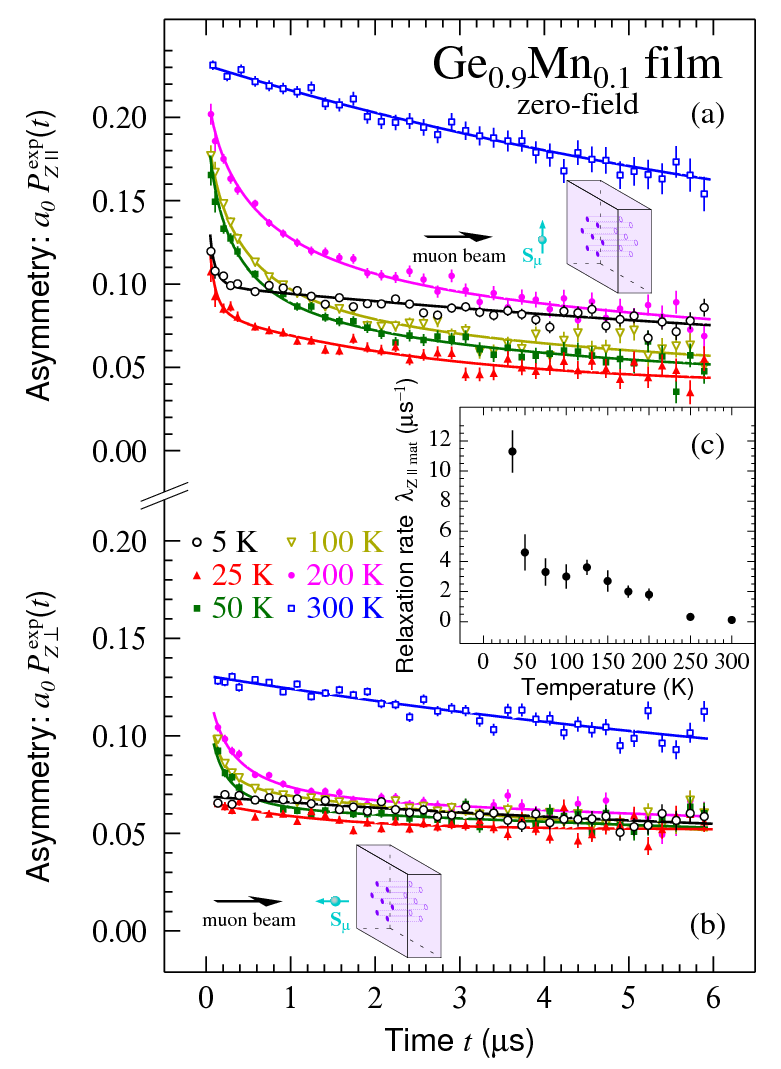
is shown in Fig. 5. denotes the evolution of the projection of the muon polarization along . We note three qualitative characteristics. (i) Given the uniaxial character of the nanocolumns, the similitude of the spectra for the two geometries is striking. Since we probe the dynamics of the Mn spins, we conclude that we are dealing with isotropic spins, consistent with a Mn2+ electronic state. (ii) The transition from the paramagnetic to the superparamagnetic states is fingerprinted by comparing the spectra at 300 and 200 K. (iii) While the spectral shape monotically evolves as the sample is cooled down to 25 K, the relaxation decreases between 25 and 5 K. A quantitative analysis is given in SM . The spin-lattice relaxation rate in the matrix is proportional to the fluctuation time of the Mn spins in the shells. From the time window of the SR technique Yaouanc11 , an upper bound for is in the microsecond range. A sharp increase of is observed below 50 K (Fig. 5). This is consistent with the remanent magnetization which shows the Mn spins to relax on the SQUID time scale, i.e. on the order of a minute at 20 K and to be completely frozen at 5 K.
In conclusion, our Ge0.9Mn0.1 film of self-organized nanocolumns is a complex object. The columns comprise a core of diameter 2 nm with a nearly 70% Mn atomic concentration, and a shell of thickness 1 nm in which the Mn concentration decreases to 0. The Mn concentration in the matrix between the columns is below the detection limit of 0.05%. A transition from a paramagnetic to a superparamagnetic state is observed for the cores around 225 K. Below 150 K they start to freeze on the SQUID time scale. No magnetic order is found for the Mn moments of the shells. Their spin dynamics is rather isotropic, consistently with a Mn2+ state. The shell magnetic moments start to slow down on the microsecond time scale below 50 K and become frozen at 5 K . There is no magnetic coupling between a core and its shell, except for a weak dipolar coupling. Finally we infer that the separation in three distinct structural and magnetic regions observed here is generic to semiconductors doped with a non miscible transition element.
Part of this work has been performed at the Swiss Muon Source (SS), Paul Scherrer Institute, Villigen, Switzerland. We thank J.-F. Jacquot for his help during the SQUID measurements.
References
- (1) C. Timm, J. Phys.: Condens. Matter, 15, R1865 (2003).
- (2) D. Bougeard et al., Phys. Rev. Lett., 97, 237202 (2006).
- (3) S. Kuroda et al., Nature Mater., 6, 440 (2007).
- (4) A. Bonanni et al., Phys. Rev. Lett., 101, 135502 (2008).
- (5) M. Jamet et al., Nature Mater., 5, 653 (2006).
- (6) A. P. Li et al., Phys. Rev. B, 75, 201201 (2007).
- (7) S. Tardif et al., Appl. Phys. Lett., 97, 062501 (2010).
- (8) S. Tardif et al., J. Magn. Magn. Mater., 354, 151 (2014).
- (9) A. Jain et al., Appl. Phys. Lett., 97, 202502 (2010).
- (10) A. Jain et al., J. Appl. Phys., 109, 013911 (2011).
- (11) T. Devillers et al., Phys. Rev. B, 76, 205306 (2007).
- (12) I.-S. Yu et al., Phys. Rev. B, 82, 035308 (2010).
- (13) T. Fukushima et al., Jpn. J. Appl. Phys., Part 2, 45, L416 (2006).
- (14) See Supplemental Material for additional information on the structural of the Ge0.9Mn0.1 film and on the muon spin rotation and relaxation measurements.
- (15) E. Morenzoni et al., J. Phys.: Condens. Matter, 16, S4583 (2004).
- (16) T. Prokscha et al., Nucl. Instr. Meth. A, 595, 317 (2008).
- (17) I. Mouton et al., J. Appl. Phys., 112, 113918 (2012).
- (18) M. Rovezzi et al., Appl. Phys. Lett., 92, 242510 (2008).
- (19) S. Tardif et al., Phys. Rev. B, 82, 104101 (2010).
- (20) A. Yaouanc and P. Dalmas de Réotier, Muon Spin Rotation, Relaxation, and Resonance: Applications to Condensed Matter, International Series of Monographs on Physiscs 147 (Oxford University Press, Oxford, 2011).
- (21) One could conceive the transition from the paramagnetic to superparamagnetic state of the column cores to take place above room temperature and that the blocking temperature corresponding to the TF-SR technique is around 225 K where drops — while it is around for the the SQUID measurements. Recalling that the characteristic time scale of TF-SR is 1 s in our case, this interpretation of the data would lead to an unrealistic short attempt time and therefore cannot hold.
- (22) G. M. Luke et al., Phys. Rev. Lett., 73, 1853 (1994).
- (23) The film volume fraction corresponding to the column cores and the region within a distance from them is which is equal to provided that = 1.8 nm. Such a value is in the accepted range; see e.g. Niedermayer98 .
- (24) C. Niedermayer et al., Phys. Rev. Lett., 80, 3843 (1998).