Extended [C ii] Emission in Local Luminous Infrared Galaxies
Abstract
We present Herschel/PACS observations of extended [C ii]157.7m line emission detected on kpc scales in 60 local luminous infrared galaxies (LIRGs) from the Great Observatories All-sky LIRG Survey (GOALS). We find that most of the extra-nuclear emission show [C ii]/FIR ratios , larger than the mean ratio seen in the nuclei, and similar to those found in the extended disks of normal star-forming galaxies and the diffuse inter-stellar medium (ISM) of our Galaxy. The [C ii] ”deficits” found in the most luminous local LIRGs are therefore restricted to their nuclei. There is a trend for LIRGs with warmer nuclei to show larger differences between their nuclear and extra-nuclear [C ii]/FIR ratios. We find an anti-correlation between [C ii]/FIR and the luminosity surface density, , for the extended emission in the spatially-resolved galaxies. However, there is an offset between this trend and that found for the LIRG nuclei. We use this offset to derive a beam filling-factor for the star-forming regions within the LIRG disks of relative to their nuclei. We confront the observed trend to photo-dissociation region (PDR) models and find that the slope of the correlation is much shallower than the model predictions. Finally, we compare the correlation found between [C ii]/FIR and with measurements of high-redshift starbursting IR-luminous galaxies.
Subject headings:
galaxies: nuclei — galaxies: ism — galaxies: starburst — infrared: galaxies1. Introduction
The far-infrared (FIR) [C ii]157.7m fine-structure emission line is the dominant gas coolant of the neutral inter-stellar medium (ISM) in normal star-forming galaxies (Malhotra et al. 1997). It mostly arises from photo-dissociation regions (PDR) heated by ultraviolet (UV) radiation emitted by young, massive stars, and can account for up to a few percent of the total IR luminosity of a galaxy (Stacey et al. 1991; Helou et al. 2001). However, the efficiency of the ISM cooling through this emission line is greatly reduced in systems with enhanced radiation field intensity and/or hardness caused by very intense nuclear starbursts (Abel et al. 2009; Stacey et al. 2010; Graciá-Carpio et al. 2011; Díaz-Santos et al. 2013) Indeed, compared with normal, quiescently star-forming galaxies, the relative cooling via the [C ii] line with respect to that carried by dust, as measured by the [C ii]/FIR ratio111FIR is the flux emitted within the m wavelength range as originally defined in Helou et al. (1988)., decreases by more than an order of magnitude from in starbursting galaxies with warmer average nuclear dust temperatures and more compact star formation, such as in local luminous infrared galaxies (LIRGs; ) (Díaz-Santos et al. 2013). In addition, in those sources where an active galactic nucleus (AGN) may contribute to the FIR emission of the galaxy, the [C ii]/FIR ratio can drop even further (i.e., there is a larger [C ii] ”deficit”), up to two orders of magnitude (Díaz-Santos et al. 2013; Farrah et al. 2013).
In our Galaxy and the Magellanic Clouds, [C ii] emission arising from star-forming complexes and the diffuse ISM have been studied in great detail (e.g., Wright et al. 1991; Shibai et al. 1991; Stacey et al. 1993; Bennett et al. 1994; Poglitsch et al. 1995; Yasuda et al. 2008; Pineda et al. 2012; Lebouteiller et al. 2012). However, before the launch of the Herschel Space Observatory (Pilbratt et al. 2010), there was only a limited number of extra-galactic sources for which it was possible to disentangle the [C ii] emission arising from spatially-resolved star-forming regions from that originating within their nuclei (e.g., Madden et al. 1993; Nikola et al. 2001; Higdon et al. 2003; Kramer et al. 2005; Rodriguez-Fernandez et al. 2006). Now, the Photodetector Array Camera and Spectrometer (PACS; Poglitsch et al. 2010) instrument on board Herschel has enabled us to obtain measurements of the FIR continuum and emission lines on physical scales of a few hundred pc in a significant number of nearby galaxies (Kennicutt et al. 2011; Croxall et al. 2012; Beirão et al. 2012; Kramer et al. 2013), with which we are able to derive the properties (, ) of the different phases of the ISM in extra-galactic star-forming regions (e.g., Mookerjea et al. 2011; Contursi et al. 2013).
Studying the extra-nuclear [C ii] in nearby LIRGs is critical not only for improving our understanding of the physical properties of the ISM in star-forming galaxies, but also for establishing local benchmarks with which to compare measurements of this key emission line in distant IR-luminous galaxies. In fact, observations with PdBI and ALMA are already starting to find high-redshift galaxies in which [C ii] is detected at distances several kpc away from their nuclei (Gallerani et al. 2012; Swinbank et al. 2012; Riechers et al. 2013).
This letter is a follow-up to our work in Díaz-Santos et al. (2013) (hereafter DS13), where we presented the results for our Herschel/PACS [C ii] survey regarding the nuclear emission of LIRGs. Here we study the extended [C ii] line emission detected for the first time in a large sample of nearby LIRGs. In Section 2 we briefly introduce the sample, observations and analysis of the data. In Section 3 we present our results, and in Section 4 we summarize and discuss them.
2. Sample and Observations
2.1. The GOALS sample
The Great Observatories All-sky LIRG Survey (GOALS; Armus et al. 2009) encompasses the complete luminosity-limited sample of the 202 LIRGs and ULIRGs contained in the IRAS Revised Bright Galaxy Sample (RBGS; Sanders et al. 2003) which, in turn, is a complete flux-limited sample of 629 galaxies having IRAS Jy and Galactic latitudes . There are 180 LIRG and 22 ULIRG systems in GOALS and their median redshift is z = 0.0215 (or Mpc).
2.2. Herschel/PACS Observations
We have obtained Herschel/PACS FIR spectroscopic observations of the [C ii]157.7m emission line for 200 LIRG systems (241 individual galaxies) in the GOALS sample. Details regarding the processing and analysis of the data are described in DS13. Since the goal of this letter is to analyze the [C ii] deficit in the extra-nuclear regions of LIRGs, in addition to the nuclear [C ii] and FIR fluxes calculated in DS13, we have also obtained their spatially-integrated fluxes as extracted from a spaxel box (/spaxel) centered around the nuclear spaxel. The extended emission is thus defined as the integrated flux minus the nuclear measurement, after performing a point-source aperture-correction on the nuclear flux to the central spaxel aperture. The same approach was taken to calculate the extended emission of the 63 dust continuum, which is also used to scale the IRAS FIR flux and down to the apertures used to extract the PACS spectra (see DS13 for more details). Errors in the line and continuum fluxes have been propagated into the analysis of, e.g., [C ii]/FIR. To calculate the IR luminosity surface density () of the extended emission we use the projected physical area covered by the PACS spaxel box centered around the galaxy minus that of the nuclear spaxel. For the starburst nuclei, however, we use the beam-corrected MIR sizes estimated from the Spitzer/IRS spectra and MIPS imaging, (see DS13).
A galaxy is considered as spatially resolved when more than 30% of the [C ii] and FIR continuum flux is extended, as defined above. This threshold is robust against observations of unresolved sources in which mis-pointings of up to would introduce a systematic underestimation of the nuclear flux that would mimic extended emission222 We have used the new task ”specExtendedToPointCorrection” available in HIPEv12 to estimate that a 3″ mis-pointing within the central spaxel would increase artificially the fraction of extended emission only up to 23%.. Because of possible contamination from a nearby companion galaxy, we exclude from this study LIRG systems in which individual galaxies are closer than 23.5 from each other (1/2 of the PACS FoV). A total of 60 galaxies (25% of the sample) show extended [C ii] and FIR emission meeting these constraints. Their average extended [C ii] emission is 52%, with a maximum of 75%. The projected radial distance at which the extended emission is detected ranges from 1 to 12.5 kpc for the closest and farthest resolved galaxy, respectively, with a median of 4.3 kpc. While more luminous GOALS systems tend to be located farther away, a K-S test comparing the distance and luminosity distributions of the GOALS galaxies with and those of galaxies classified as extended in this work, confirms that both sub-samples are indistinguishable in both quantities (D-values of 0.20 and 0.15 and -values of 0.04 and 0.22, respectively).
3. Results
3.1. [C ii] Deficit and FIR colors of Extra-nuclear Star Formation
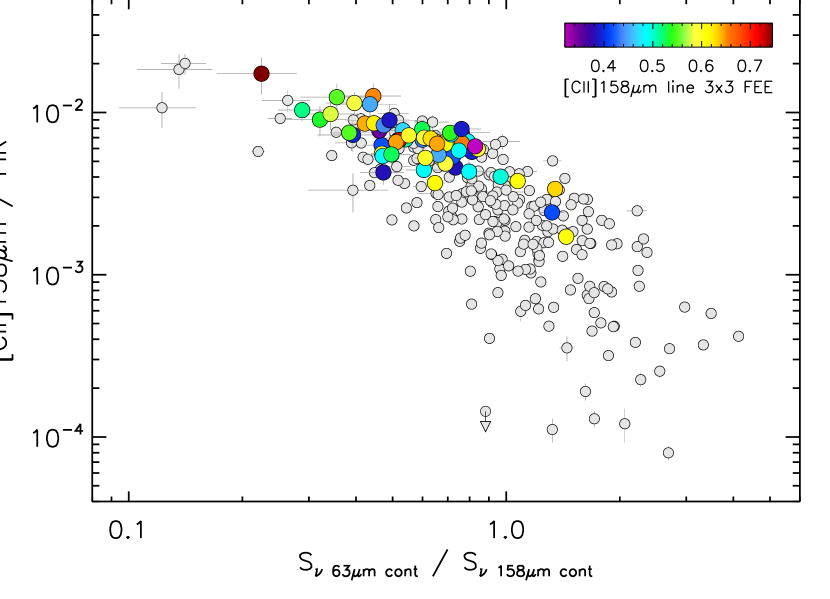
Figure 1 shows the [C ii]/FIR ratio as a function of the 63 m/158 m continuum flux density ratio (63/158 m hereafter)333 For comparisons with IRAS-derived FIR colors, an equation to convert PACS 63/158 m into IRAS 60/100m can be found in the Appendix of DS13. for the extra-nuclear emission observed in spatially resolved LIRGs in the GOALS sample. As expected, the extended emission regions follow the trend found for the LIRG nuclei (DS13) suggesting that the [C ii] deficit is related to the average temperature of the dust (). However, the extended regions show smaller [C ii] deficits (stronger [C ii] to FIR emission) and lower 63/158 m ratios than the majority of the nuclei. The extended emission has a mean and median [C ii]/FIR ratio of and , respectively, which is a factor 2 larger than the LIRG nuclei. Figure 1 also reveals that the fractional extent of the [C ii] emission does not correlate with the FIR color of the extra-nuclear regions suggesting that galaxies with larger extended emission fractions do not have systematically colder or warmer . In the majority of LIRGs the extended emission has 63/158 m1 and [C ii]/FIR , similar to those found in the extended disks of normal star-forming galaxies (Madden et al. 1993; Nikola et al. 2001; Mookerjea et al. 2011; Croxall et al. 2012), as well as in the diffuse component of the ISM in the Galactic plane (Shibai et al. 1991; Bennett et al. 1994; Nakagawa et al. 1998; Yasuda et al. 2008). This is consistent with our previous findings based on Spitzer/IRS spectroscopy showing that the physical properties of the extra-nuclear, kpc-scale star formation in LIRGs are very similar to those of normal star-forming galaxies with lower IR luminosities (), and that the diversity of their integrated MIR spectra is driven by the nuclear, few central kpc starburst (Díaz-Santos et al. 2011).
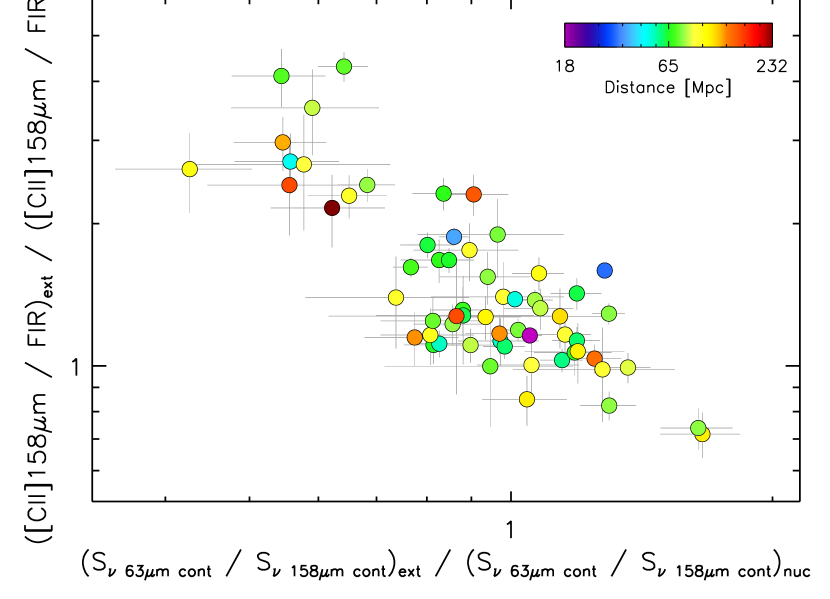
The differences between the nuclear and extended emission are more clearly seen in Figure 2, which shows that the ratio between the FIR color of the extra-nuclear and nuclear regions is clearly correlated with the excess of [C ii] deficit seen in the nuclei with respect to that observed in the disks, regardless of the distance at which the extended emission is measured or on the distance to the galaxy (see color-coding). That is, for a given of the extended emission, LIRGs with warmer nuclei show larger differences between their nuclear and extra-nuclear [C ii] deficits.
3.2. Extended IR Luminosity Surface Densities
As shown in DS13, there is a clear trend for pure star-forming LIRGs having more compact IR emission to display lower [C ii]/FIR ratios. Figure 3 (a) shows that the extended emission regions in spatially-resolved galaxies follow an anti-correlation between [C ii]/FIR and similar to that seen for the LIRG nuclei, with slopes of and respectively, suggesting that these correlations are likely driven by the same physical process. However, the extra-nuclear regions (green filled circles) are offset by more than an order of magnitude towards lower and show higher [C ii]/FIR ratios on average than their nuclei (red open circles).
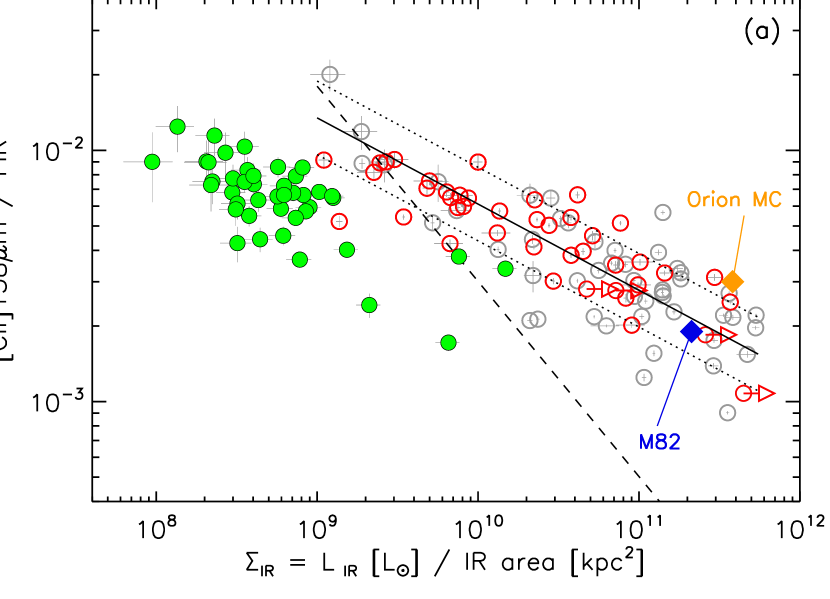
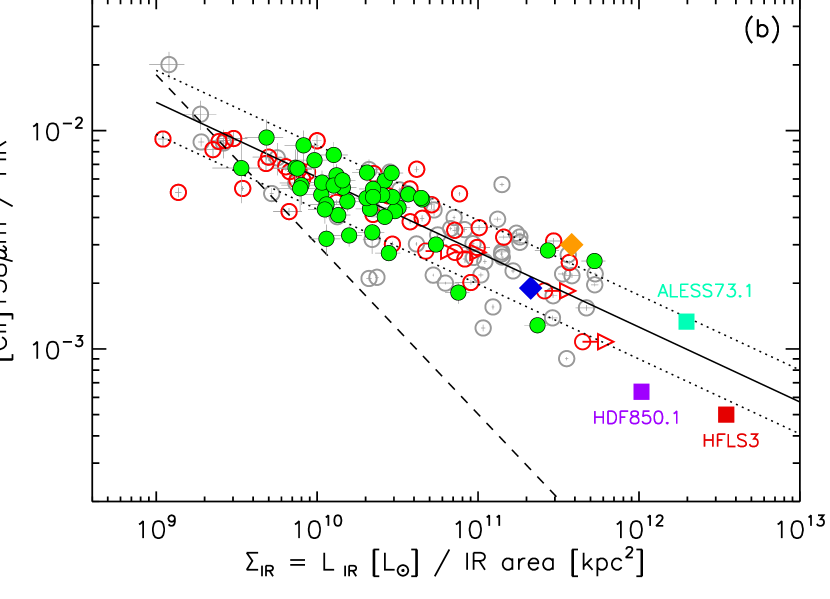
To understand this offset we can decompose it as a simultaneous shift in [C ii]/FIR and along the slope of the observed trend, plus an horizontal shift in . The shift along the correlation is determined by the ratio between the median [C ii]/FIR measured in the extra-nuclear regions and that of the starburst nuclei. The additional horizontal shift in represents the beam filling-factor of the star-forming regions in the LIRG disks with respect to that of the nuclei. We estimate this relative filling-factor to be 0.06 by minimizing the difference between the median of the extended and nuclear emissions (see Figure 3 (b)). The uncertainties in the filling factor account for the dispersion of the [C ii]/FIR vs. correlation in the x-axis as well as for variations in the properties of the ISM that would modify the [C ii]/FIR ratio, such as changes in the fractional contribution of [C ii] emission associated to the diffuse ionized medium.
This methodology has been recently used in combination with the PDR models developed by Wolfire et al. (1990) to argue for the presence of large-scale star-formation in high-redshift galaxies (Hailey-Dunsheath et al. 2010; Stacey et al. 2010; Ferkinhoff et al. 2014). These models relate the radius () and of the starburst region to the strength of the UV inter-stellar radiation field (ISRF), measured in units of the local Galactic value ( = 1.6 erg s-1 cm-2; Habing 1968). We can compare the relative beam filling-factor of the extra-nuclear star-forming regions derived from Figure 3 to that predicted by the models. Wolfire et al. (1990) consider two geometric configurations for the starburst region. One in which the molecular clouds are immerse in a smooth ISRF and another in which a central, ionizing source is surrounded by a geometrically-thick, molecular medium. Each one follows a relation such that , and , respectively, with being the mean free path of a UV photon within the starburst region. If we assume a hydrogen density, , in the range of , we can use Figure 4 of Stacey et al. (2010), which is based on the PDR models from Kaufman et al. (1999), to estimate the [C ii]/FIR ratio as a function of . Although neither model fits our observed trend of [C ii]/FIR with , the model with a compact, nearby ionizing source, i.e., (dashed line in Figure 3), is closest to our data. If we use M82 as our reference starburst (with the following properties: and , Lord et al. 1996; pc, Joy et al. 1987), the beam filling factor predicted by this configuration for the extra-nuclear star-forming regions would be % that of M82. This value is significantly lower than our inferred 6%, when we compare them to the LIRG nuclei using the observed correlation in Figure 3. We explore the reasons for this discrepancy below.
4. Discussion
The difference between the filling factor derived from our data and that estimated using the PDR models is due to the slope of the trend found for the LIRG nuclei, which is still significantly shallower than that implied by the PDR model. Using the relationship between [C ii]/FIR and in (Stacey et al. 2010)444See also the Photo Dissociation Region Toolbox (PDRT) models: http://dustem.astro.umd.edu/pdrt/ (Tielens & Hollenbach 1985; Wolfire et al. 1990; Hollenbach et al. 1991; Kaufman et al. 1999)., a spatial distribution of the star formation of is equivalent to log([C ii]/FIR) log() (see dashed line in Figure 3). This significantly differs from the slope fitted to the data, . The difference in the slopes may arise at least in part from the fact that as the radiation field becomes more intense, not only the gas heating efficiency is reduced due to the increased ionization of small dust particles but dust grains could also be intercepting a larger fraction of the UV radiation before it reaches the PDR (see Abel et al. 2009). Since this dust will be warmer, the natural consequence is also a smaller size for the starburst, as measured in the MIR, and hence a larger . In fact, the [C ii]/FIR ratio is correlated with the depth of the 9.7 silicate absorption feature (DS13), which measures the obscuration towards the warm dust continuum originating from the nuclear star-forming regions. It is therefore a combination of a decreased heating efficiency plus warm dust inside the PDR and likely within the H ii regions, that causes a drop in [C ii]/FIR and a rise in . In these dusty sources, other FIR emission lines arising from the dense ionized gas (e.g., [N ii], [N iii], or [O iii]) also show deficits with respect to the FIR emission (Graciá-Carpio et al. 2011), suggesting that a significant amount of dust may indeed be present inside the H ii regions.
The PDR model presented in Figure 3 not only has a steeper slope than the trends observed for the nuclei and extended regions of local LIRG, but the majority of the nuclear data, mostly above , are located to the right of the model prediction. Since the model assumes a constant filling-factor of unity for the starburst region, this implies a beam filling-factor for the LIRG nuclei increasingly larger than unity. A possible interpretation is that, at a given [C ii]/FIR ratio, we can consider the trend with found for the LIRG nuclei as ”maximal”, i.e., where the nuclear starbursts have the highest –most compact– possible, with multiple star-forming regions overlapping along the line of sight within the beam.
These findings may be useful for studies of IR-luminous galaxies detected in high-redshift surveys for which it is not possible to resolve the [C ii] or IR emission. As an example, in Figure 3 (b) we show HFLS 3 (Riechers et al. 2013), a near-maximal starburst galaxy at , and two sub-millimeter galaxies, HDF 850.1 (Neri et al. 2014) and ALESS 73.1 (De Breuck et al. 2014), at and 4.76, respectively. All galaxies have a [C ii] deficit and broadly consistent with the extrapolation of the correlation derived from the nuclei of local LIRGs (DS13). We note that the of the high- sources may actually be underestimated because their sizes are measured in the rest-frame FIR continuum, which is dominated by the cold dust. But if the reported sizes are correct, the offset of HFLS 3 and HDF 850.1 may imply beam filling-factors for the star-forming complexes times larger than local LIRG disks would have with similar [C ii]/FIR — or, alternatively, these high- sources would be showing properties similar to those of local ULIRG nuclei in GOALS, but extended over larger physical scales.
Acknowledgments
We thank the anonymous referee for her/his useful comments and suggestions. We would also like to thank Mark Wolfire for providing us with very useful insights regarding the PDR models. V.C. would like to acknowledge partial support from the EU FP7 Grant PIRSES-GA-2012-316788. This work is based on observations made with the Herschel Space Observatory, an European Space Agency Cornerstone Mission with science instruments provided by European-led Principal Investigator consortia and significant participation from NASA. The Spitzer Space Telescope is operated by the Jet Propulsion Laboratory, California Institute of Technology, under NASA contract 1407. This research has made use of the NASA/IPAC Extragalactic Database (NED), which is operated by the Jet Propulsion Laboratory, California Institute of Technology, under contract with the National Aeronautics and Space Administration, and of NASA’s Astrophysics Data System (ADS) abstract service.
References
- Abel et al. (2009) Abel, N. P., Dudley, C., Fischer, J., Satyapal, S., & van Hoof, P. A. M. 2009, ApJ, 701, 1147
- Armus et al. (2009) Armus, L., et al. 2009, PASP, 121, 559
- Beirão et al. (2012) Beirão, P., et al. 2012, ApJ, 751, 144
- Bennett et al. (1994) Bennett, C. L., et al. 1994, ApJ, 434, 587
- Contursi et al. (2013) Contursi, A., et al. 2013, A&A, 549, A118
- Croxall et al. (2012) Croxall, K. V., et al. 2012, ApJ, 747, 81
- De Breuck et al. (2014) De Breuck, C., et al. 2014, ArXiv e-prints
- Díaz-Santos et al. (2011) Díaz-Santos, T., et al. 2011, ApJ, 741, 32
- Díaz-Santos et al. (2013) —. 2013, ApJ, 774, 68
- Farrah et al. (2013) Farrah, D., et al. 2013, ApJ, 776, 38
- Ferkinhoff et al. (2014) Ferkinhoff, C., et al. 2014, ApJ, 780, 142
- Gallerani et al. (2012) Gallerani, S., et al. 2012, A&A, 543, A114
- Graciá-Carpio et al. (2011) Graciá-Carpio, J., et al. 2011, ApJ, 728, L7
- Habing (1968) Habing, H. J. 1968, Bull. Astron. Inst. Netherlands, 19, 421
- Hailey-Dunsheath et al. (2010) Hailey-Dunsheath, S., et al. 2010, ApJ, 714, L162
- Helou et al. (1988) Helou, G., Khan, I. R., Malek, L., & Boehmer, L. 1988, ApJS, 68, 151
- Helou et al. (2001) Helou, G., Malhotra, S., Hollenbach, D. J., Dale, D. A., & Contursi, A. 2001, ApJ, 548, L73
- Higdon et al. (2003) Higdon, S. J. U., Higdon, J. L., van der Hulst, J. M., & Stacey, G. J. 2003, ApJ, 592, 161
- Hollenbach et al. (1991) Hollenbach, D. J., Takahashi, T., & Tielens, A. G. G. M. 1991, ApJ, 377, 192
- Joy et al. (1987) Joy, M., Lester, D. F., & Harvey, P. M. 1987, ApJ, 319, 314
- Kaufman et al. (1999) Kaufman, M. J., Wolfire, M. G., Hollenbach, D. J., & Luhman, M. L. 1999, ApJ, 527, 795
- Kennicutt et al. (2011) Kennicutt, R. C., et al. 2011, PASP, 123, 1347
- Kramer et al. (2005) Kramer, C., et al. 2005, A&A, 441, 961
- Kramer et al. (2013) —. 2013, A&A, 553, A114
- Lebouteiller et al. (2012) Lebouteiller, V., et al. 2012, A&A, 548, A91
- Lord et al. (1996) Lord, S. D., et al. 1996, A&A, 315, L117
- Madden et al. (1993) Madden, S. C., et al. 1993, ApJ, 407, 579
- Malhotra et al. (1997) Malhotra, S., et al. 1997, ApJ, 491, L27
- Mookerjea et al. (2011) Mookerjea, B., et al. 2011, A&A, 532, A152
- Nakagawa et al. (1998) Nakagawa, T., et al. 1998, ApJS, 115, 259
- Neri et al. (2014) Neri, R., Downes, D., Cox, P., & Walter, F. 2014, ArXiv e-prints
- Nikola et al. (2001) Nikola, T., et al. 2001, ApJ, 561, 203
- Pilbratt et al. (2010) Pilbratt, G. L., et al. 2010, A&A, 518, L1
- Pineda et al. (2012) Pineda, J. L., et al. 2012, A&A, 544, A84
- Poglitsch et al. (1995) Poglitsch, A., et al. 1995, ApJ, 454, 293
- Poglitsch et al. (2010) —. 2010, A&A, 518, L2
- Riechers et al. (2013) Riechers, D. A., et al. 2013, Nature, 496, 329
- Rodriguez-Fernandez et al. (2006) Rodriguez-Fernandez, N. J., Braine, J., Brouillet, N., & Combes, F. 2006, A&A, 453, 77
- Shibai et al. (1991) Shibai, H., et al. 1991, ApJ, 374, 522
- Stacey et al. (1991) Stacey, G. J., et al. 1991, ApJ, 373, 423
- Stacey et al. (2010) —. 2010, ApJ, 724, 957
- Stacey et al. (1993) —. 1993, ApJ, 404, 219
- Swinbank et al. (2012) Swinbank, A. M., et al. 2012, MNRAS, 427, 1066
- Tielens & Hollenbach (1985) Tielens, A. G. G. M., & Hollenbach, D. 1985, ApJ, 291, 722
- Wolfire et al. (1990) Wolfire, M. G., Tielens, A. G. G. M., & Hollenbach, D. 1990, ApJ, 358, 116
- Wright et al. (1991) Wright, E. L., et al. 1991, ApJ, 381, 200
- Yasuda et al. (2008) Yasuda, A., Nakagawa, T., Spaans, M., Okada, Y., & Kaneda, H. 2008, A&A, 480, 157