11email: ducci@astro.uni-tuebingen.de 22institutetext: ISDC Data Center for Astrophysics, Université de Genève, 16 chemin d’Écogia, 1290 Versoix, Switzerland 33institutetext: Australia Telescope National Facility, CSIRO Astronomy and Space Science, PO Box 76, Epping, NSW 1710, Australia
XMM-Newton observation of the interacting galaxies
NGC 1512 and NGC 1510
††thanks: Based on
observations obtained with XMM-Newton, an ESA science mission with
instruments and contributions directly funded by ESA Member States
and NASA. The radio observations were obtained with
the Australia Telescope Compact Array, which is part of the Australia Telescope National
Facility funded by the Commonwealth of Australia for operation as a
National Facility managed by CSIRO.,††thanks: Tables LABEL:Tab._source_list and LABEL:Tab._source_list_classification
are only available in electronic form
at the CDS via anonymous ftp to cdsarc.u-strasbg.fr (130.79.128.5)
or via http://cdsweb.u-strasbg.fr/cgi-bin/qcat?J/A+A/
Abstract
Context. The galaxy NGC 1512 is interacting with the smaller galaxy NGC 1510 and shows a peculiar morphology, characterised by two extended arms immersed in an HI disc whose size is about four times larger than the optical diameter of NGC 1512.
Aims. For the first time we performed a deep X-ray observation of the galaxies NGC 1512 and NGC 1510 with XMM-Newton to gain information on the population of X-ray sources and diffuse emission in a system of interacting galaxies.
Methods. We identified and classified the sources detected in the XMM-Newton field of view by means of spectral analysis, hardness-ratios calculated with a Bayesian method, X-ray variability, and cross-correlations with catalogues in optical, infrared, and radio wavelengths. We also made use of archival Swift (X-ray) and Australia Telescope Compact Array (radio) data to better constrain the nature of the sources detected with XMM-Newton.
Results. We detected 106 sources in the energy range of 0.212 keV, out of which 15 are located within the regions of NGC 1512 and NGC 1510 and at least six sources coincide with the extended arms. We identified and classified six background objects and six foreground stars. We discussed the nature of a source within the ellipse of NGC 1512, whose properties indicate a quasi-stellar object or an intermediate ultra-luminous X-ray source. Taking into account the contribution of low-mass X-ray binaries and active galactic nuclei, the number of high-mass X-ray binaries detected within the region of NGC 1512 is consistent with the star formation rate obtained in previous works based on radio, infrared optical, and UV wavelengths. We detected diffuse X-ray emission from the interior region of NGC 1512 with a plasma temperature of keV and a 0.3–10 keV X-ray luminosity of erg s-1, after correcting for unresolved discrete sources.
Key Words.:
galaxies: individual; NGC 1512, NGC 1510 X-rays: galaxies1 Introduction
NGC 1512 and NGC 1510 are two interacting galaxies at a distance of 9.5 Mpc (Koribalski et al., 2004). NGC 1512 is a barred spiral galaxy (SB(r)a; de Vaucouleurs et al. 1991) with two star-forming rings and two extended arms immersed in an HI disc about four times larger than the optical diameter, probably caused by an ongoing tidal interaction with the neighbouring galaxy NGC 1510 (Kinman, 1978). NGC 1510 is a blue compact dwarf galaxy separated by only 14 kpc from NGC 1512. Its blue colour and emission line spectrum are probably caused by the star formation activity produced by the interaction with NGC 1512 (Hawarden et al., 1979). Based on the analysis of the distribution and kinematics of the HI gas and the star formation activity in NGC 1512/1510, Koribalski & López-Sánchez (2009) concluded that the star formation activity in the outskirts of the disc as well as the distortion in the HI arms are the consequence of the interaction between the two galaxies that started about 400 Myr ago (Koribalski & López-Sánchez, 2009). These authors used methods based on measurements of lines and continuum emission at different wavelengths (from radio to UV) to estimate the star formation rate (SFR) of both NGC 1512 and NGC 1510. They derived an average SFR of yr-1 for NGC 1512 and yr-1 for NGC 1510.
To our knowledge, there has been no detection of sources at the position of NGC 1512/1510 with X-ray telescopes to date. From ROSAT/PSPC observations, O’Sullivan et al. (2001) derived a luminosity upper limit for NGC 1510 of erg s-1 ( keV). Therefore, the work described in this paper represents the first report of significant X-ray emission in NGC1512/1510. The XMM-Newton observation on which this paper is based (see Sect. 2) allows the detection of the brightest populations of X-ray sources ( erg s-1) typically observed in normal galaxies. The main class of galactic X-ray sources is that of X-ray binaries (XRBs), whose X-ray luminosity, ranging from to erg s-1, is produced by the accretion of matter from the donor star to a compact object (a neutron star or a black hole). XRBs are conventionally divided into two classes according to the nature of the donor star: low-mass X-ray binaries (LMXBs) and high-mass X-ray binaries (HMXBs). LMXBs host late-type stars and have a lifetime of yr because of the nuclear timescale of the donor star. Their number is roughly proportional to the total stellar mass of the galaxy (e.g. Gilfanov 2004). HMXBs host early-type stars and have a lifetime of yr. Therefore, their number is proportional to the recent SFR of a galaxy (e.g. Grimm et al. 2003).
Large-scale diffuse X-ray emission in galaxies can be used to trace outflows and feedback processes on galactic scales. Such emission has been detected with the current generation of X-ray observatories in many nearby galaxies, including M31 (Shirey et al., 2001), M101 (Kuntz et al., 2003), NGC 300 (Carpano et al., 2005), NGC 6946 (Schlegel et al., 2003), NGC 1672 (Jenkins et al., 2011), and NGC 253 (Bauer et al., 2008). As such, the NGC 1512/1510 system may also exhibit diffuse X-ray emission that can be used to investigate these physical processes.
In this paper we report the results obtained from a study of the X-ray sources in the XMM-Newton field of view of NGC 1512/1510. The paper is organised as follows: in Sect. 2 we present the XMM-Newton, Swift, and Australia Telescope Compact Array (ATCA) observations on which our work is based and the analysis of the data. In Sect. 3 we describe the methods adopted to classify the sources based on their X-ray properties and the analysis of X-ray diffuse emission from NGC 1512. In Sect. 4 we cross-correlate the list of sources detected with XMM-Newton with radio, infrared, and optical catalogues and discuss the identifications and classifications obtained for some of these sources. In Sect. 5 the results for point sources and X-ray diffuse emission are discussed.
2 Observations and data reduction
2.1 XMM-Newton: source detection
The galaxy pair NGC 1512/1510 has been observed with XMM-Newton (ID: 0693160101) between 2012 June 16 (20:31 UTC) and 2012 June 17 (16:24 UTC) in a single, 63 ks exposure observation. The data analysis was performed through the XMM-Newton Science Analysis System (SAS) software (version 12.0.1). The observation was largely contaminated by high background due to proton flares. After rejecting time intervals affected by high background, the net good exposure time was reduced to ks for PN, ks for Metal Oxide Semi-conductor 1 (MOS1), and ks for MOS2.
For each instrument, data were divided into five energy bands:
-
•
: 0.2–0.5 keV;
-
•
: 0.5–1 keV;
-
•
: 1–2 keV;
-
•
: 2–4.5 keV;
-
•
: 4.5–12 keV.
For the PN, data were filtered to include only single events (PATTERN=0) in the energy band , and single and double events (PATTERN4) for the other energy bands. We excluded the energy range keV to reduce the background produced by strong fluorescence lines in the outer detector area (Freyberg et al., 2004). For the MOS, single to quadruple events (PATTERN12) were selected.
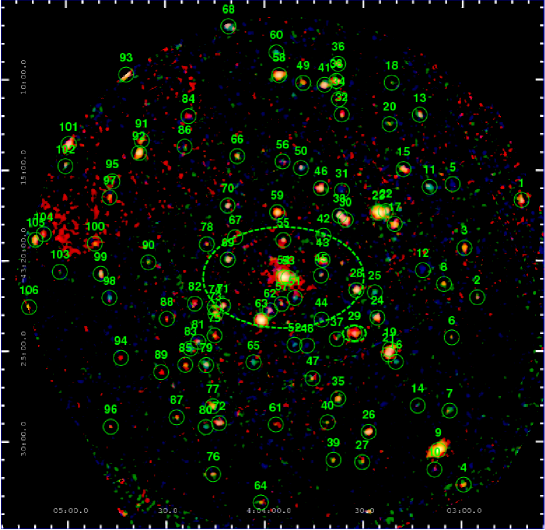
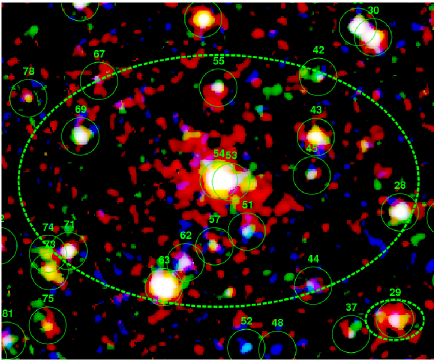
We ran the source detection using the SAS task edetect_chain on the images corresponding to the five energy bands and three instruments (total of 15 images) simultaneously. The source detection procedure can be divided into three steps. The first step creates temporary source lists and background maps for these source lists. Local background maps are then used to detect the sources. We adopted a minimum-detection likelihood of 7 to obtain the list of sources (the detection likelihood is defined by , where is the probability that a Poissonian fluctuation of the background is detected as a spurious source). To create the background maps the sources are removed from the images and a two-dimensional spline with 16 nodes is fitted to the exposure-corrected image. In the second step the background maps are used to improve the detection sensitivity and hence to create a new source list. Here we adopted a minimum-detection likelihood of 4. In the last step, the list of source positions obtained in the previous step is used to perform a maximum-likelihood point-spread function (PSF) fit to the source count distribution simultaneously in all energy bands and each EPIC instrument (a description of this algorithm is given by Cruddace et al. 1988). For this step we adopted a minimum likelihood of . This step provides the final source list. The source detection procedure of the task edetect_chain provides, for each detected source, many parameters such as the position, the positional error, count rate, likelihood of detection, and hardness ratios (see Table LABEL:Tab._source_list). We removed false detections (artefacts on the detectors or diffuse emission structures) by visual inspection. We detected 106 sources in the NGC 1512/1510 field of view.
Figure 1 shows the combined PN, MOS1, and MOS2 three-colour XMM-Newton image. The numbers of the detected sources in Table LABEL:Tab._source_list are overplotted on the image. The thick green ellipses are the ellipses for NGC 1512 and NGC 1510 (de Vaucouleurs et al., 1991) defined by the 25 mag arcsec-2 B-band isophote.
2.2 XMM-Newton: diffuse emission
To search for extended X-ray emission in the NGC 1512/1510 system we used the XMM-Newton Extended Source Analysis Software (XMM-ESAS), packaged in SAS 12.0.1. This program is based on the software used for the background modelling described in Snowden et al. (2004). Essentially, XMM-ESAS consists of a set of tasks to produce images and spectra from observational data and to create quiescent particle background (QPB) images and spectra that can be subtracted from the observational science products (see Kuntz & Snowden, 2008; Snowden et al., 2008). To ensure compatibility of our analysis with the XMM-ESAS framework, we reprocessed the observational data according to the ESAS cookbook111Available at http://heasarc.gsfc.nasa.gov/docs/xmm/xmmhp_xmmesas.html. Standard filtering and calibration were applied to the observational data using the XMM-ESAS tools epchain, emchain, pn-filter, and mos-filter. The CCDs of each of the EPIC instruments were then examined to ensure that none were operating in an anomalous state (where the background at keV is strongly enhanced, see Kuntz & Snowden, 2008). We determined that CCD 4 of the EPIC-MOS1 was in an anomalous state and excluded it from further analysis. The tasks pn-filter and mos-filter clean the data of obvious soft-proton (SP) flares by calling the task espfilt. After filtering with espfilt, 16 ks of EPIC-PN data, and 27 ks and 25 ks of EPIC-MOS1 and EPIC-MOS2 data, respectively, were available for further analysis. Since this observation was highly affected by SP flares, the likelihood of substantial residual SP contamination is high. We estimated the level of this using the diagnostic tool of De Luca & Molendi (2004)222Available at http://xmm2.esac.esa.int/external/xmm_sw_cal/background/epic_scripts.shtml#flare. Unfortunately, the filtered event lists of each of the EPIC instruments were flagged as being ‘extremely’ contaminated by SPs. Therefore, we proceeded very tentatively and cautiously with our search for extended emission in the NGC 1512/1510 system.
We excluded point sources determined in Sect. 2.1 from the observational data using the SAS task region and the XMM-ESAS task make_mask. The contour method of the region task was used to define the exclusion regions. The task calculates the point spread function (PSF) at the source position and normalises for the source brightness. Source counts were then removed down to a PSF threshold of 0.25 times the local background, that is, the point source is excluded down to a level where the surface brightness of the point source is one quarter of the surrounding background. This method has the advantage that the point source exclusion regions follow the brightness of the source, so that brighter sources have larger exclusion regions and shapes corresponding approximately to the source PSF. Hence, the number of diffuse counts is maximised by tailoring the point source exclusion regions to the individual sources. By excluding counts in this manner, contamination from the point sources is reduced to a negligible level.
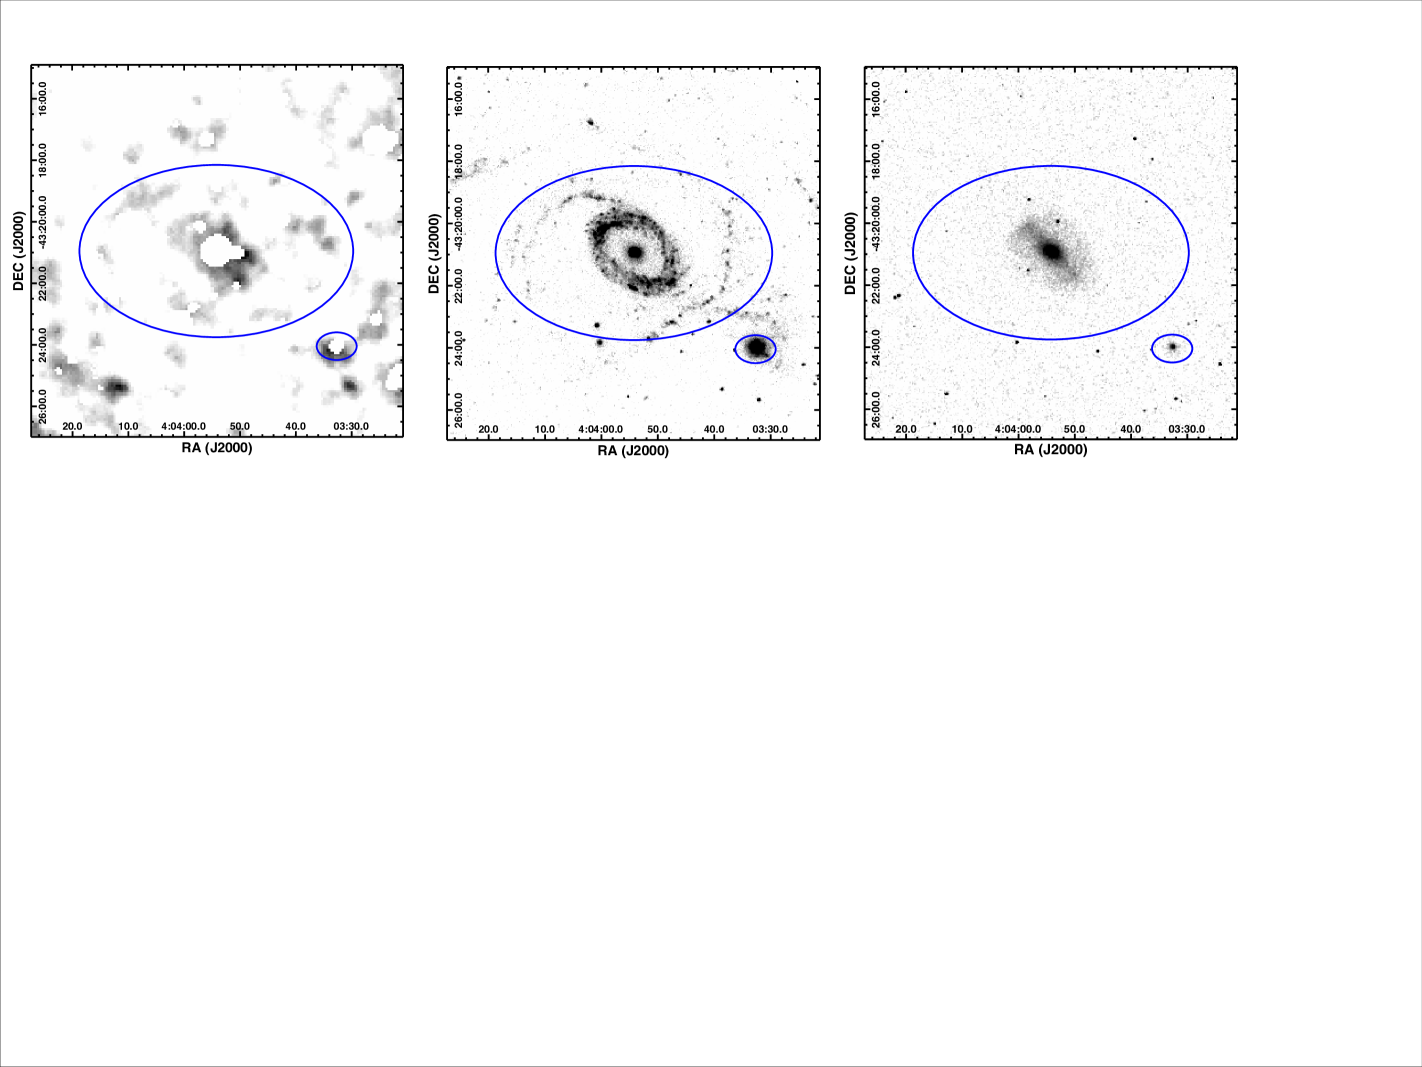
The pn-spectra and mos-spectra were used to produce images with the point sources masked in the 0.3-2 keV and 2-7 keV energy bands. The pn-back and mos-back tasks were then used to produce corresponding QPB images. Using XMM-ESAS, it is also possible to model and retrospectively subtract residual SP contamination from the images. To this end we extracted full-field spectra and QPB backgrounds for the EPIC instruments and fitted the spectra in the 37 keV energy range where the SP contamination is expected to dominate (see Section 3.4.1 for a description of the SP fitting process). The determined spectral parameters were then used to generate model SP contamination images with the XMM-ESAS task proton. The comb task was used to merge the observational QPB images and SP images from all three EPIC instruments into combined EPIC images. Finally, the adapt-900 task was run to subtract the QPB and SP background, and adaptively smooth the resulting images. We note here that solar wind charge-exchange emission (SWCX), which is correlated to enhancements in the solar wind (Snowden et al., 2004), may also affect our observation. This is discussed in more detail in Section 3.4.3, but the effect is expected to be uniform across the FOV and, thus, it is only necessary to adjust the background flux levels. While no extended emission was observed in most of the NGC 1512/1510 field, there was evidence for faint soft emission in the innermost region of NGC 1512, illustrated in Figure 2 (left). Morphologically, the diffuse X-ray emission appears to be associated with the region of the UV ring of NGC 1512 (Koribalski & López-Sánchez, 2009), shown in Figure 2 (middle), which also corresponds to the region of higher stellar density, as evident from the -band image taken from the 2MASS Large Galaxy Atlas333Available at http://irsa.ipac.caltech.edu/applications/2MASS/LGA/ (Jarrett et al., 2003), Figure 2 (right).
2.3 Swift/XRT
NGC 1512 and NGC 1510 have been observed with the X-ray Telescope (XRT; Burrows et al. 2005), one of the three instruments on board the Swift satellite (Gehrels et al., 2004), from July 2011 to January 2013, for a total exposure time of ks.
We used these data to study the long-term X-ray variability of sources detected with both Swift/XRT and XMM-Newton/EPIC (see Sect. 3.3). We collected the XRT observations in two groups: obs1: from 2011/07/26 00:13:25 to 2011/08/05 05:49:01; obs2: from 2012/09/25 01:09:59 to 2012/09/27 04:50:59 (see Table 1). We processed the XRT data obtained in photon-counting mode (PC) with the standard procedures (xrtpipeline v0.12.6; Burrows et al. 2005). For each group of observations, source detection was performed using XIMAGE (v4.5.1). For each source, we obtained the count rate and significance using the source statistics (sosta) tool within XIMAGE. The sources detected by Swift/XRT with a signal-to-noise ratio , not located at the edge of the field of view (where the high background noise can be misinterpreted as real sources by the source detection procedure), and with a unique XMM-Newton counterpart are sources No. 54 (the nuclear region of NGC 1512) and No. 63. Owing to the low angular resolution of Swift/XRT, the pairs of XMM-Newton sources 30/33, 38/41, and 91/92 have been detected by XRT as three sources. Therefore, for the long-term variability study we only considered sources No. 54 and 63 (see Sect. 3.3).
| ObsID | Start date | (ks) |
|---|---|---|
| 00045603001 | 2011-07-26 00:13:25 | 3077.8 |
| 00045603002 | 2011-08-01 07:10:01 | 2880.3 |
| 00045603003 | 2011-08-02 07:21:12 | 1965.2 |
| 00045603004 | 2011-08-04 00:59:00 | 767.2 |
| 00045603005 | 2011-08-05 05:49:01 | 2447.1 |
| 00045603008 | 2012-09-25 01:09:59 | 9497.0 |
| 00045603009 | 2012-09-26 01:09:59 | 3778.5 |
| 00045603010 | 2012-09-27 04:50:59 | 4588.0 |
2.4 ATCA
The system NGC 1512/1510 has been observed in radio (20-cm) with ATCA. The observation consists of four pointings with multiple configurations (see Koribalski & López-Sánchez 2009 for the observing and data reduction details).
We used the 20-cm radio continuum maps with 8 and 15 arcsec resolution to find possible radio counterparts of the X-ray sources we detected with XMM-Newton. We found nine radio counterparts of sources 13, 23, 29 (nuclear region of NGC 1510), 54 (nuclear region of NGC 1512), 67, 71, 83, 94, and 98. We used these associations to classify five background objects (see Sect. 4.2).
3 Analysis
3.1 Astrometrical corrections
We determined the systematic errors in the X-ray positions of the XMM-Newton observation by calculating the offsets in the X-ray positions of the XMM-Newton sources identified and/or classified as foreground stars and background objects (see Sect. 4) with respect to their optical and infrared counterparts (USNO-B1 and 2MASS catalogues of Monet et al. 2003 and Cutri et al. 2003). In particular, we used the sources of Tables 5 and 6, which were clearly identified as foreground or background objects except for source No. 61, which appears to be extended on the DSS maps. The offset between the X-ray positions and the optical positions corrected for proper motion is arcsec, arcsec. Since the offset for is not statistically significant, we used only to correct the positions of all the detected sources. The rms offsets in declination before and after correction are 2.4 and 2.1.
3.2 Spectral analysis and hardness ratios of point sources
We extracted the X-ray spectra of the sources from circular or elliptical regions, which were adjusted by eye for each source on each detector, depending on the presence of nearby sources. Background spectra were extracted from source-free zones and then normalised to the extraction area of the corresponding source. The spectra, instrument responses, and ancillary files were generated using the SAS software. We performed the spectral analyses using XSPEC (ver. 12.7.0, Arnaud 1996a).
For brighter sources (counts 300 in the energy range keV) we used the statistics. The spectral energy channels were grouped to have at least 20 counts per bin for good statistical quality of the spectra.
For sources with a fewer counts we used the Cash statistic (or C-stat; Cash 1979), which allows background subtraction in XSPEC by means of the W-statistic444see appendix 13 of XSPEC manual http://heasarc.nasa.gov/xanadu/xspec/manual/XSappendixStatistics.html. W-statistic requires at least one count per spectral bin. We computed the quality of the fit with the XSPEC command goodness, which performs Monte Carlo simulations of spectra from the best-fit model and provides the percentage of simulated spectra with a C-stat less than that obtained from the real data. If the model represents the data accurately, the goodness should be close to 50%.
We fitted the PN and MOS spectra simultaneously with different models. A good fit with one of these models can be used to classify the sources into one of the following classes:
In total we fitted the spectra of eight sources. With the exception of source No. 9 (see Sects. 4.1 and A.1), the X-ray spectra can be fitted with an absorbed power-law or an absorbed disc-blackbody model, with photon indices and compatible with either XRBs or AGNs (see Sects. 4.2 and 4.3).
For each source, we calculated four hardness ratios, defined as
| (1) |
We calculated the hardness ratios of Eq. (1) with the Bayesian method described in Park et al. (2006) and implemented in the BEHR code555See http://hea-www.harvard.edu/astrostat/behr/ (ver. 08-28-2012). This method is based on the assumption that the detection of X-ray photons is a random process described by Poisson statistics instead of the classically assumed Gaussian statistic. The hardness ratios calculated using the Bayesian method are much more accurate than those calculated using the classical methods, especially for very faint sources, for which the Poisson distribution becomes more asymmetric. Moreover, if the source is not detected in one or more energy bands, the Bayesian method of Park et al. (2006) can produce reliable estimates where classical methods would fail. The required inputs for the Bayesian method of Park et al. (2006) are the source region counts, the background region counts (both corrected for vignetting and out-of-time events), the ratio of the source and background extraction areas, and the exposure time at the source position.
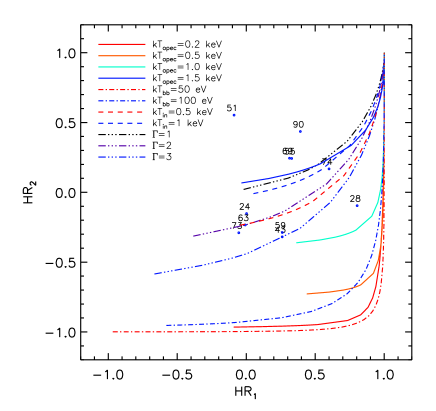
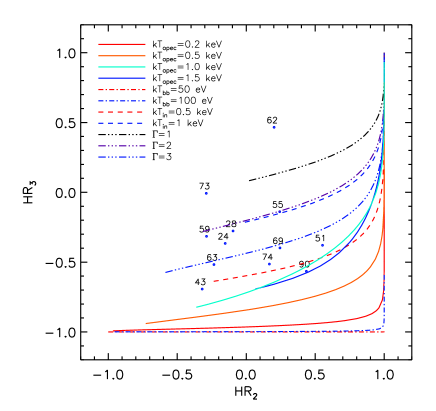
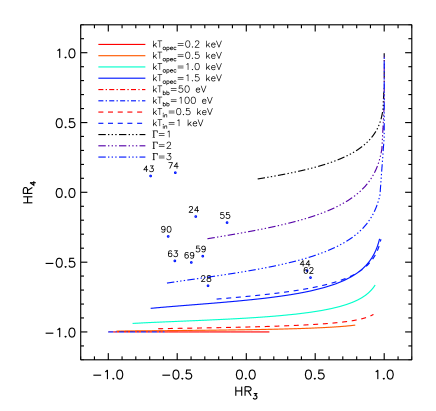
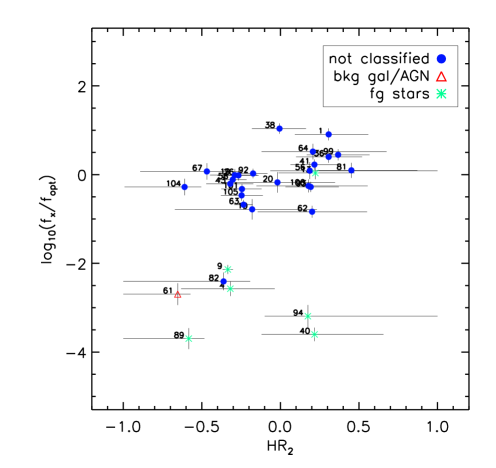
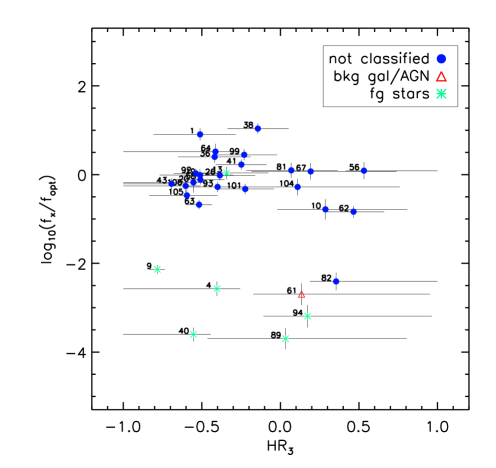
Hardness ratios can provide information about the X-ray properties of faint sources, for which the spectral fitting is not possible (see e.g. Prestwich et al. 2003). The hardness ratios calculated for each source are listed in Table LABEL:Tab._source_list. Figure 3 shows the hardness ratios of the sources detected by XMM-Newton in NGC 1512/1510 (see Sect. 4.3). The grids of hardness ratios calculated for different spectral models, with ranging from cm-2 to cm-2, can help to better separate different classes of sources.
| Detector | Filter | B1 | B2 | B3 | B4 | B5 |
|---|---|---|---|---|---|---|
| EPIC | erg cm-2 ct-1 | |||||
| PN | Medium | 1.070 | 1.106 | 1.725 | 4.969 | 17.47 |
| MOS | Medium | 7.205 | 5.614 | 5.181 | 13.71 | 69.62 |
| No. | obs1 (Jul-Aug 2011) | Jun. 2012 | obs2 (Sept. 2012) | ||
|---|---|---|---|---|---|
| (Swift) | (XMM-Newton) | (Swift) | |||
| 54 | 1.8 | 0.8 | |||
| 63 | 1.6 | 1.4 |
3.3 Variability analysis
For each XMM-Newton observation, we searched for pulsations of the brightest sources (counts ) on time scales between s and the time duration of each observation. After extracting the event files, we applied both a Fourier transform and a analysis (Buccheri et al., 1983) for one to three harmonics. No statistically significant variability from the analysed sources was detected.
We studied the long-term X-ray variability of sources detected with both Swift/XRT and XMM-Newton/EPIC. This was the case only for the two sources No. 54 and 63. We calculated the XMM-Newton fluxes with the energy conversion factors reported in Table 2. Table 3 shows the keV Swift and XMM-Newton fluxes, variability factor (where and are the highest and lowest fluxes) and the significance of the variability , where and are the errors of the highest and lowest flux (Primini et al., 1993). We derived the XRT fluxes from the count rates obtained with the tool sosta and the spectral parameters obtained in the XMM-Newton data analysis, assuming no changes in the spectral shape (see Table 7). Sources No. 54 and 63 do not show a significant () variability.
3.4 Spectral analysis of diffuse emission
The spectral analysis of the region of soft diffuse emission in the centre of NGC 1512 is complicated because of the high residual SP contamination and the possible contribution of fainter, large-scale emission in NGC 1512 and/or SWCX emission. While these may not be so problematic for bright extended emission, the faint nature of the central diffuse emission required us to treat the background with utmost care to extract the purest possible spectral results. Since any additional faint contribution from NGC 1512 most likely varies across the FOV, a straightforward background extraction and subtraction from a nearby region may not be appropriate. In addition, backgrounds selected in this manner from different regions of the detector with different responses may also compromise our results. For these reasons, we decided to use XMM-ESAS techniques for the spectral analysis, that is, we subtracted the modelled QPB spectra and accounted for the remaining X-ray background by including a physically motivated model in the fits.
The XMM-ESAS tasks pn-spectra and mos-spectra were used to extract the spectra and response files from the emission region within the ring of NGC 1512 (see Fig. 2). pn-back and mos-back were used to produce corresponding QPB spectra to be subtracted from the observational spectra. The spectra, associated response files, and QPB spectra were linked using the grppha task in the FTOOLS package666http://heasarc.gsfc.nasa.gov/ftools/. The spectra were grouped to at least 30 counts per bin to allow the use of the -statistic. All fits were performed using XSPEC (Arnaud, 1996b) version 12.7.1 with ATOMDB777http://www.atomdb.org/ version 2.0.1, abundance tables set to those of Wilms et al. (2000), and photoelectric absorption cross-sections set to those of Balucinska-Church & McCammon (1992). We limited our analysis to keV to avoid the to strong low-energy tail due to electronic noise, as recommended in the ESAS cookbook. Following the subtraction of the QBP spectrum, we accounted for the remaining constituents of the X-ray background in XSPEC. These fall into two categories: the particle-induced background and the astrophysical background.
3.4.1 Particle-induced background
After subtracting the QPB, the remaining particle-induced background consists of instrumental fluorescence lines and the residual SP contamination. The instrumental fluorescence lines were modelled with Gaussian components (gauss in XSPEC) at 1.49 keV in the EPIC-PN spectrum, and 1.49 keV and 1.75 keV for the EPIC-MOS spectra. Additional instrumental lines are present at harder energies in the EPIC spectra, but because we limited our analysis to the 0.4-5 keV energy range, these were ignored. The residual SP contamination was modelled with a power-law (powerlaw in XSPEC) component not folded through the instrumental response. This is possible by using the diagonal response matrices supplied in the CALDB of XMM-ESAS. Given the small extraction area of the inner NGC 1512 region, the low number of counts at harder energies prohibit robust constraints on the SP contamination model, most importantly on the slope of the power-law component. This is a problem because uncertainties on this parameter will dramatically affect the derived diffuse emission spectral parameters. To circumvent this we used the full-field EPIC spectra (see Sect. 2.2), excluding point sources, and fitted these spectra in the 3–7 keV energy range. Because the SP contamination component should dominate at these energies, we can constrain the shape of the spectrum, which was then fixed in the fits to the inner NGC 1512 spectrum. We find that the residual SP contamination can be modelled as a power-law of photon index for the EPIC-PN spectrum and for the EPIC-MOS spectra.
3.4.2 Astrophysical background
The astrophysical background (APB) typically comprises four or fewer components (Snowden et al., 2008; Kuntz & Snowden, 2010), namely the unabsorbed thermal emission from the local hot bubble (LHB, 0.1 keV), absorbed cool ( 0.1 keV) and warm ( 0.25 keV) thermal emission from the Galactic halo, and an absorbed power-law representing unresolved background cosmological sources (, Chen et al., 1997). All thermal components were fitted with the vapec (Smith et al., 2001) thermal plasma model in XSPEC. To model the absorption of the Galactic halo and cosmological background sources we used the photoelectric absorption model phabs in XSPEC. The value of the foreground hydrogen absorption column was fixed at cm-2 based on the Leiden/Argentine/Bonn (LAB) Survey of Galactic HI (Kalberla et al., 2005), determined using the HEASARC Tool888http://heasarc.gsfc.nasa.gov/cgi-bin/Tools/w3nh/w3nh.pl. Because of this very low foreground absorption value, the LHB and cool Galactic halo emission are more or less indistinguishable in our spectral analysis energy range, which is why we treated them as a single component in the fits.
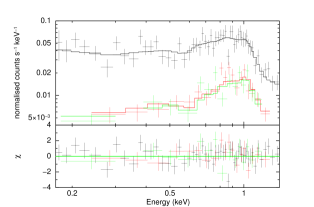
3.4.3 SWCX
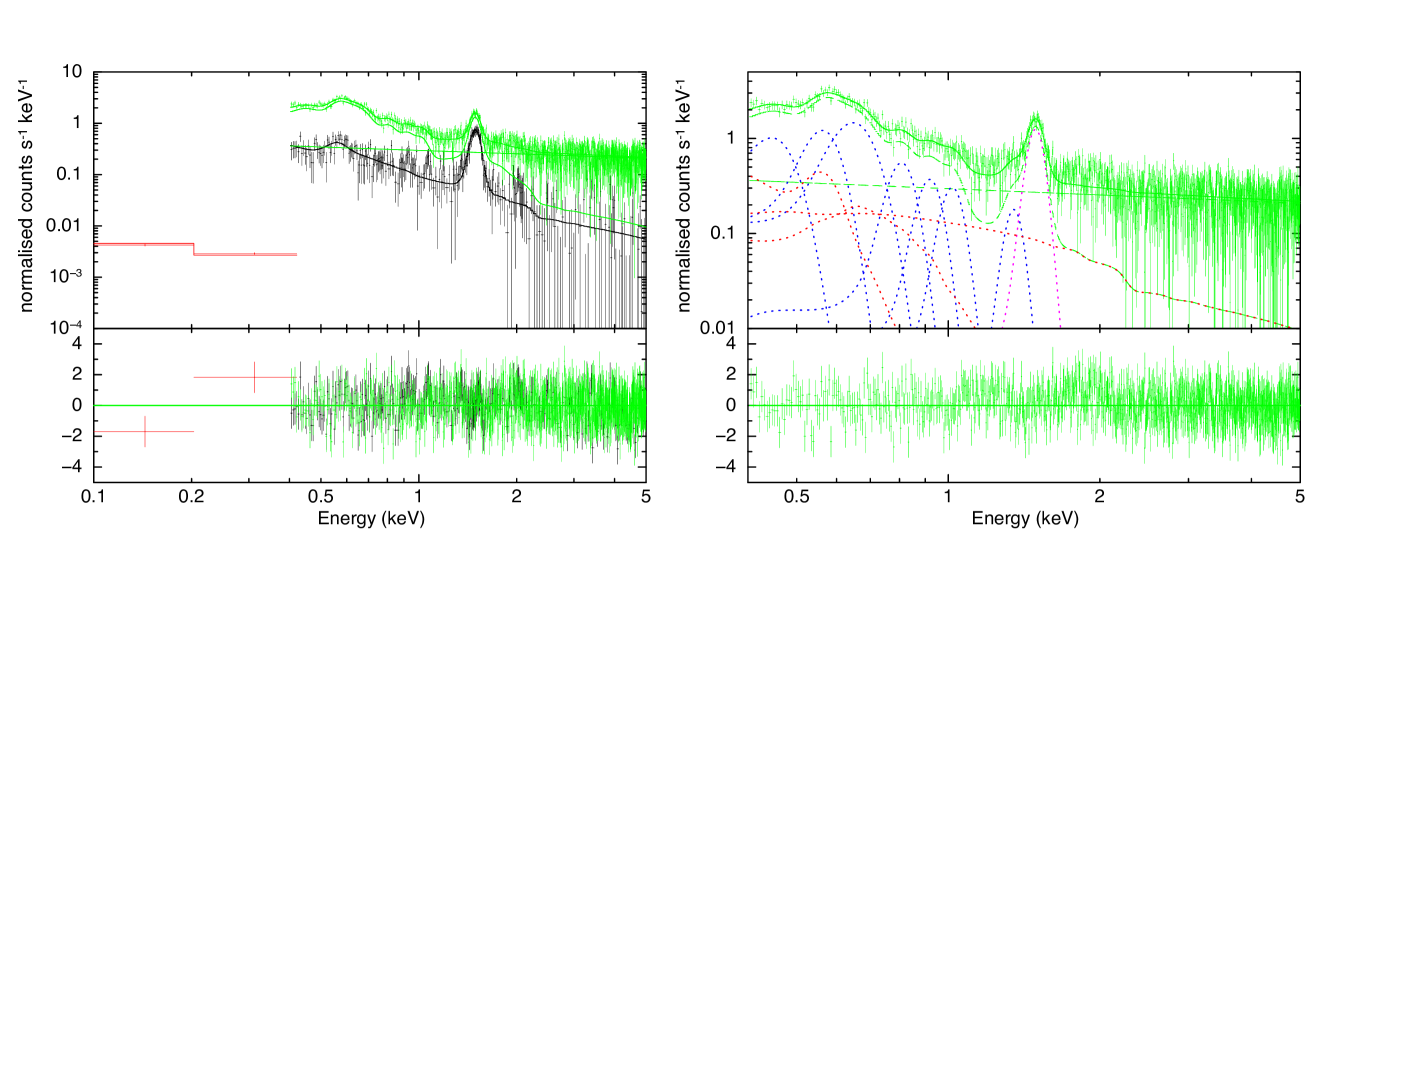
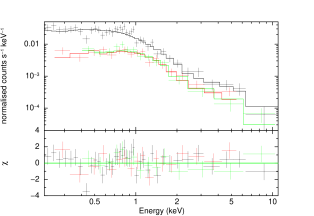
Given the high level of residual SP contamination in our observation, we also considered whether SWCX emission is present in our spectra as well. An SWCX spectrum consists of emission lines corresponding to the ions in the solar wind. Unfortunately, these lines are also of great astrophysical importance and can affect the derived spectral parameters of the astrophysical source at issue. SWCX occurs in several regions of the solar system, but the most important in terms of XMM-Newton observations is caused by solar wind ions that interact with the Earth’s magnetosheath (Robertson & Cravens, 2003). There are two main influences on the level of SWCX contamination of a spectrum. First, because SWCX is generated by highly charged ions in the solar wind, flux enhancements of the solar wind naturally lead to a higher production of SWCX X-rays. Second, the viewing geometry of XMM-Newton with respect to the magnetosheath will affect the level of contamination, meaning that observations made with XMM-Newton through more of the magetosheath are subject to more contamination. Because of the orbit of XMM-Newton around Earth and that of Earth around the Sun, certain periods of the year are more susceptible to SWCX contamination, with the summer months being the worst affected (see Fig. 1 of Carter & Sembay, 2008, for a nice illustration). Our observation of NGC 1512 with strong residual SP contamination was performed on June 16/17 2012 and therefor might be affected. The easiest way to identify SWCX contamination is to have multi-epoch observations of the same region of sky. We searched the XMM-Newton archives for an appropriate observation. Obs ID. 0501210701 (PI: M Ajello) was performed on July 7 2007, has an aimpoint from the nucleus of NGC 1512, and was found to be effectively free of SP contamination. Using XMM-ESAS, we extracted spectra from the central of this ‘background’ field and from all of the NGC 1512/1510 field (point sources and central diffuse emission region excluded) to characterise the APB and search for SWCX. Because we limited our XMM-Newton spectral analysis to keV, we obtained the All-Sky Survey (RASS) spectrum from a 1∘-2∘ annulus around NGC 1512 (using the HEASARC X-ray background tool999http://heasarc.gsfc.nasa.gov/cgi-bin/Tools/xraybg/xraybg.pl) to constrain the soft emission below 0.5 keV. We initially fitted the background field spectra with the RASS spectrum to constrain the local APB (see the black and red spectra in Fig. 4-left). We obtained a good fit to the data (=1.05) with fit parameters in the expected ranges. Next we assumed that this background model represented the background of the NGC 1512/1510 observation and fixed the relevant background components in the model. The resulting fit to the spectra was very poor (2) with high residuals keV, which could be attributed to SWCX. Therefore, we added a series of Gaussian components to the model that represent the emission lines expected from SWCX (listed in the ESAS cookbook), namely C VI (0.46 keV), O VII (0.56 keV), O VIII (0.65 keV), O VIII (0.81 keV), Ne IX (0.92 keV), Ne IX (1.02 keV), and Mg XI (1.35 keV). The addition of these emission lines resulted in a substantially improved fit (=1.11), which is shown in green in Fig. 4 (left) for comparison with the background field and RASS spectra, and alone in Fig. 4 (right) with the additive components of the spectral model highlighted. Based on these results, it is evident that the observation of NGC 1512/1510 is heavily contaminated by SWCX. While there may be some real NGC 1512 emission buried in this contamination, the level of SWCX prohibits any meaningful treatment. Accordingly, we considered only the central diffuse emission region for the subsequent analysis with the background components (APB, SWCX, and SPs) fixed appropriately.
3.4.4 Spectral fitting
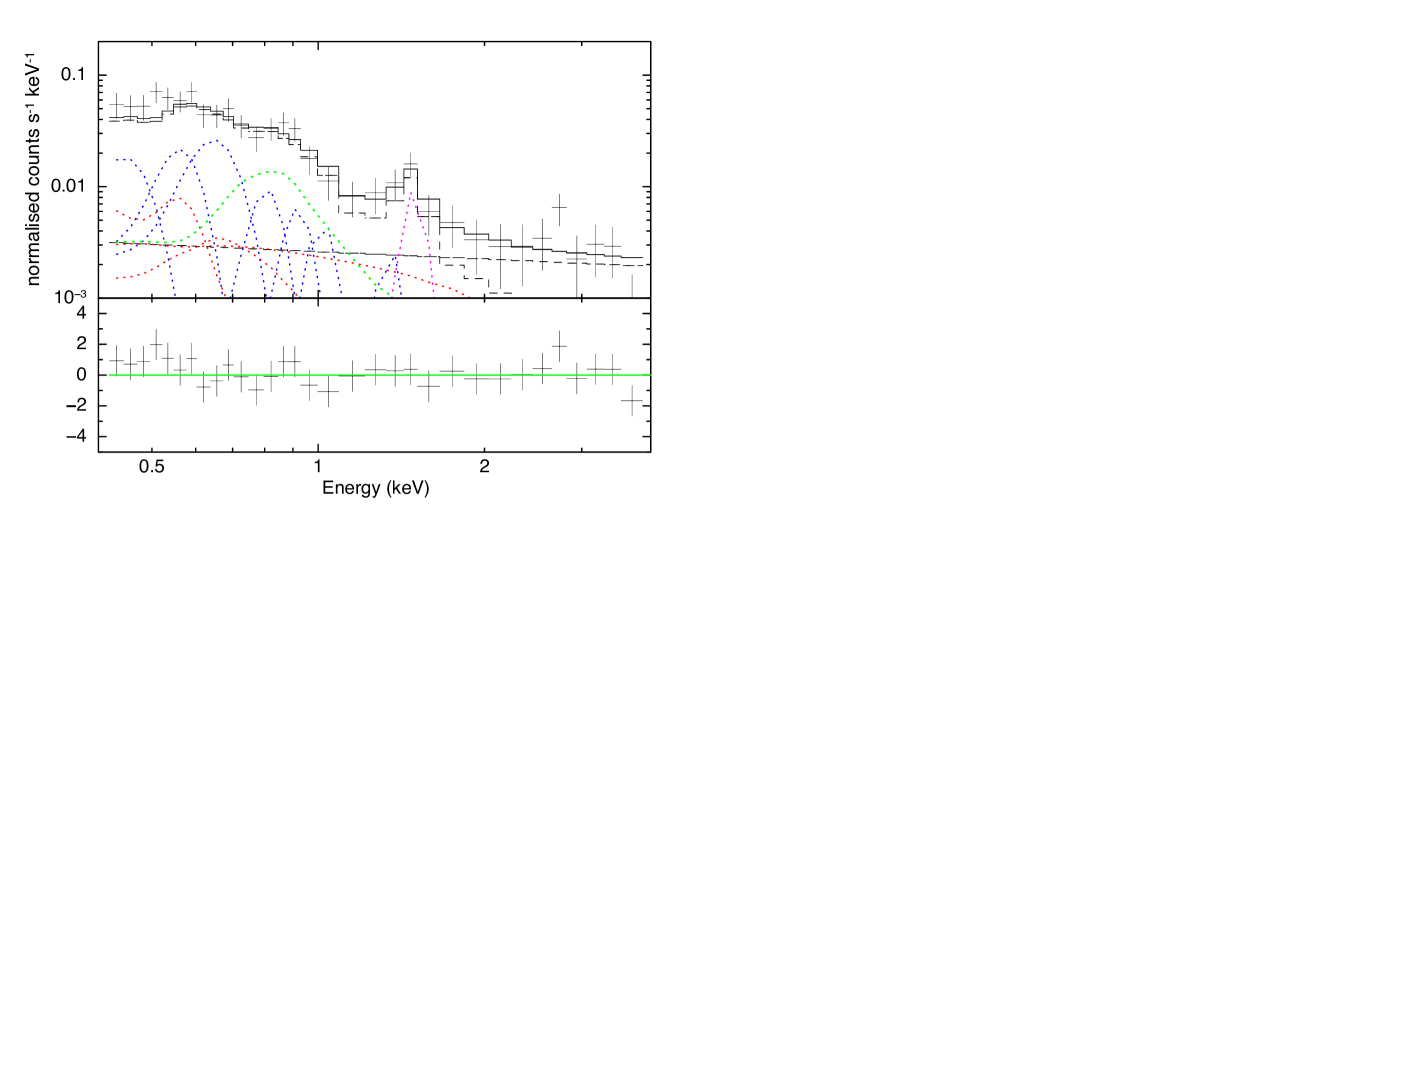
We extracted EPIC-MOS and EPIC-PN spectra from the central region of diffuse emission in NGC 1512. The count statistics for each spectrum are relatively low, with EPIC-MOS spectra 400 counts and EPIC-PN 650 counts. Hence, we decided to fit only the EPIC-PN data because this spectrum is of the best statistical quality. While not completely satisfactory, it at least allowed us to obtain coarse estimates of the diffuse emission parameters, although more complex models (e.g., non-equilibrium ionisation components, metallicity enhancements) are beyond our grasp. We assumed that the soft emission in the central NGC 1512 region is thermal in origin. Therefore, we fitted the EPIC-PN spectrum with the fixed background components and a single thermal plasma model (vapec in XSPEC) with abundances set to those of NGC 1512 (0.65 solar, Koribalski & López-Sánchez, 2009). Absorption components were included to represent the foreground Galactic column density and absorption due to material in NGC 1512. This second component consistently tended to zero and only an upper limit could be determined. However, we caution that the fit is not very sensitive to this parameter since the SWCX lines dominate the softer energies where the constraints on this parameter are determined. Thus, the resulting upper limit may be somewhat misleading. Comparing this upper limit with the determined values of the compact sources in NGC 1512 (see Table 7), we see that the upper limit from the diffuse emission fit is an order of magnitude higher than that of all sources in the ellipse of NGC 1512. The values of the compact sources seem to point to a very low intrinsic absorption in the galaxy. The resulting spectral fit was statistically acceptable (=0.93) with keV and unabsorbed flux of erg cm-2 s-1. Because this flux is derived from diffuse emission regions with point sources masked, we corrected it for the excluded regions. Assuming that the average surface brightness of the detected diffuse emission holds across the point source regions, the resulting X-ray flux is erg cm-2 s-1. This corresponds to an X-ray luminosity erg s-1 at the distance of NGC 1512.
| Comp. | Parameter | Value |
| Foreground Absorption | ||
| phabs | ( cm-2) | 0.01 (fixed)a𝑎aa𝑎aFixed to the Galactic column density from the Leiden/Argentine/Bonn (LAB) Survey of Galactic HI (Kalberla et al., 2005). |
| vphabs | ( cm-2) | 0.00 ())b𝑏bb𝑏bAbundances fixed to those of NGC 1512. Only an upper limit for could be determined. We caution that this upper limit may be misleading as the fit is not very sensitive to the parameter (see text). |
| NGC 1512 components | ||
| vapecc𝑐cc𝑐cAbundances fixed to those of NGC 1512. | (keV) | 0.66 (0.28–0.89) |
| norm () | 1.28 (0.84–1.76) | |
| ( erg cm-2 s-1) | 1.4d𝑑dd𝑑dValues are de-absorbed. | |
| ( erg s-1) | 1.5d𝑑dd𝑑dValues are de-absorbed. | |
| Fit statistic | 0.93 (27 d.o.f.) | |
4 Source classification
We compared the list of X-ray sources detected in the XMM-Newton observation with sources observed in other wavelengths to find the counterparts. To this purpose we used optical (USNO-B1, Monet et al. 2003; Muenster Red Sky Survey (MRSS), Ungruhe et al. 2003; Tycho-2 Catalogue (TYC), Høg et al. 2000), infrared (2MASS, Skrutskie et al. 2006), and radio (Sydney University Molonglo Sky Survey (SUMSS), Mauch et al. 2003) catalogues. We considered sources observed at different wavelengths to be associated if their positions were closer than the three times combined statistical errors. When an X-ray source had many optical counterparts, we only considered the brightest one within the error circle. This comparison allowed us to identify some of the XMM-Newton sources with sources previously classified in other wavelengths. When a previous classification was not available, we tried to classify the X-ray sources using their X-ray, optical, infrared, and radio properties.
For each X-ray source, possible optical, infrared, and radio counterparts are reported in Table LABEL:Tab._source_list_classification.
4.1 Foreground stars
The XMM-Newton field of view of NGC 1512/1510 is contaminated by stars belonging to our Galaxy. The X-ray spectra of foreground stars are somewhat softer than the X-ray spectra of other classes of sources. Moreover, their X-ray emission is usually expected to be (e.g. Krautter et al. 1999), where is the flux in the optical band. A useful tool to classify stars compares the observed X-ray-to-optical and X-ray-to-infrared flux ratios with the expected ones. For each X-ray source with optical or infrared counterparts, we calculated and with the equations of Maccacaro et al. (1988) and Lin et al. (2012):
| (2) | |||||
| (3) |
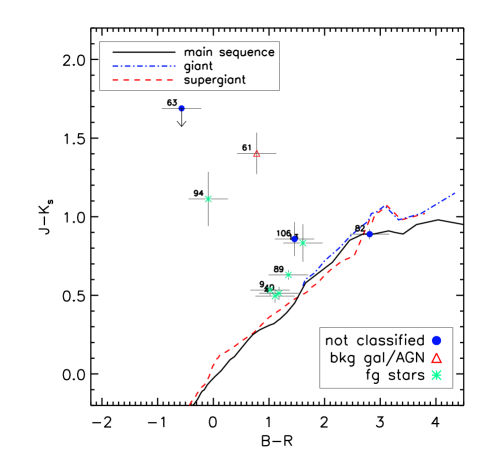
where is the visual magnitude that we obtained from the USNO-B1 red and blue magnitudes, assuming and is the magnitude in the band from the 2MASS catalogue. Figure 6 shows over the hardness ratios and . Foreground stars are expected to be in the regions of Fig. 6 with and, because of their soft X-ray spectra, and (Pietsch et al., 2004). Following the classification scheme derived by Lin et al. (2012), we also required . In addition, we used optical and near-infrared magnitudes to classify foreground stars. They are expected to be brighter in than background objects and with colors and overlapping the intrinsic colours of main sequence, giant and supergiant stars of our Galaxy showed in Fig. 7 with three lines (obtained from Johnson 1966) .
Another method to classify Galactic objects is based on proper motions. We used the proper motion measurements provided by the PPMXL Catalog of positions and proper motions on the ICRS (Roeser et al., 2010) or other catalogues of proper motions (e.g. the Yale/San Juan Southern Proper Motion Catalog 4 (SPM4) Girard et al. 2011 and the Fourth U.S. Naval Observatory CCD Astrograph Catalog (UCAC4) Zacharias et al. 2013).
From previous considerations we classified a source to be a foreground star when all these conditions were met:
-
•
;
-
•
;
-
•
;
-
•
;
-
•
.
or:
-
•
measurement of the proper motion provided by the PPMXL catalogue.
Six sources met these criteria, hence we classified them as foreground stars (Table 5). Four of them (No. 4, 9, 40, 89) show X-ray, optical, and infrared properties typical of normal stars. The remaining No. 13 and 94 have peculiar properties indicating the possible presence of an accreting companion star. In particular, both have a radio (ATCA) counterpart. Source No. 82 lies on the lines of intrinsic colours of stars in Fig. 7, but its HR3 is too hard for a foreground star (see Fig. 6).
A detailed discussion of the classification of the most interesting foreground stars is provided in Sect. A.1.
| No. | RA | Dec | USNO-B1 | B mag. | R mag. | pmRA | pmDec |
|---|---|---|---|---|---|---|---|
| (J2000) | (J2000) | (mas yr-1) | |||||
| 4 | 04 02 59.40 | 43 32 23.6 | 0464-0031137 | 15.13 | 14.02 | ||
| 9†∗ | 04 03 07.15 | 43 30 29.0 | 0464-0031154 | 12.61 | 11.59 | ||
| 13 | 04 03 12.96 | 43 11 57.6 | 0468-0031995 | 21.25 | 19.64 | ||
| 40†∗ | 04 03 40.85 | 43 28 57.1 | 0465-0031108 | 12.28 | 11.1 | ||
| 89 | 04 04 31.49 | 43 26 10.4 | 0465-0031223 | 12.69 | 11.34 | ||
| 94† | 04 04 43.73 | 43 25 22.9 | 0465-0031250 | 14.63 | 14.72 | ||
Notes:
†: this star also has an independent proper motion measurement in the Yale/San Juan Southern Proper Motion Catalog 4 (SPM4) (Girard et al., 2011);
∗: this star also has an independent proper motion measurement in the Fourth U.S. Naval Observatory CCD Astrograph Catalog (UCAC4) (Zacharias et al., 2013).
4.2 Background objects
Another class of sources included in the X-ray observations of nearby galaxies are the background objects: normal galaxies, AGNs, and galaxy clusters.
The identification of a background object in this work is based on SIMBAD and NED correlations. This allowed us to identify source No. 61 with a galaxy (MRSS 250-126782, Ungruhe et al. 2003, and 2MASX J04035631-4329046, 2 Micron All Sky Survey Extended objects, Skrutskie et al. 2006; see Table 6).
The existence of a radio counterpart and a hardness ratio of (Pietsch et al., 2004) are indicative of an AGN. We found radio counterparts for the hard sources No. 23, 67, 71, 83, 98 (see Table 6 and Sect. A.2) and classified them as AGNs for the first time.
| XMM-Newton | Counterpart | |||
| No. | RA | Dec | Name or RA/Dec (J2000) | |
| (J2000) | (J2000) | |||
| Identifications: | ||||
| 61 | 04 03 56.60 | 43 29 05.0 | 2MASS J04035632-4329041 | |
| Classification: | ||||
| 23† | 04 03 25.37 | 43 17 22.0 | 04 03 25.54 | 43 17 23.2 |
| 67† | 04 04 08.90 | 43 18 43.8 | 04 04 08.82 | 43 18 42.3 |
| 71† | 04 04 12.64 | 43 22 30.7 | SUMSS J040412-432235 | |
| 83† | 04 04 22.57 | 43 24 52.3 | 04 04 22.25 | 43 24 52.1 |
| 98† | 04 04 47.14 | 43 22 03.5 | 04 04 46.77 | 43 22 02.2 |
Notes:
† radio sources detected by ATCA
| No. | (diskbb) | (d.o.f.)† | unabs. | ||||
|---|---|---|---|---|---|---|---|
| ( cm-2) | (keV) | c-stat (d.o.f.) | goodness | ( keV) erg cm-2 s-1 | |||
| 23 | 1.25 (31) | ||||||
| 30 | 367.18 (442) | 51.19% | |||||
| 33 | 248.92 (365) | 2.97% | |||||
| 54 | 1.10 (65) | ||||||
| 58 | 453.52 (546) | 13.11% | |||||
| 63 | 0.90 (29) | ||||||
| 92 | 321.24 (413) | 23.16% | |||||
Notes:
† Reduced and d.o.f. or Cash statistic, d.o.f. and percentage of realisations with statistic c-stat
4.3 Sources in NGC 1512/1510
We detected 21 sources inside the ellipses (NGC 1512: arcmin2; NGC 1510: arcmin2; de Vaucouleurs et al. 1991) of NGC 1512 and NGC1510 or overlapping the outer galaxy arms detected by GALEX. These sources, with their positions, hardness ratios, fluxes and luminosities (assuming Mpc) are listed in Table 8. The detection-limiting flux in the keV energy band is erg cm-2 s-1 for sources inside the ellipses. In Table 8 we did not include sources identified and classified as background objects or foreground stars. We included source No. 63, classified as quasi-stellar object (QSO) in the catalogue of Atlee & Gould (2007), whose intermediate ultra-luminous X-ray source (ULX) nature cannot be ruled out (see Sect. 5.3). Sources No. 54 and 29 correspond to the nuclear regions of NGC 1512 and NGC 1510. The properties of source No. 54 are discussed in Sect. 5.1. The remaining 20 sources are discussed in Sects. 5.2 and 5.3.
5 Discussion
5.1 Nuclear source of NGC 1512 (XMMU J040354.2-432056)
Source No. 54 (XMMU J040354.2-432056) is the nuclear source of NGC 1512 and is the brightest source inside the ellipse. Because of the relatively poor spatial resolution of XMM-Newton, we cannot study this region of NGC 1512 in detail, as the X-ray emission is expected to be produced by diffuse emission, unresolved point sources (dominated by XRBs), and a possible active nucleus with a low accretion rate in the galactic centre.
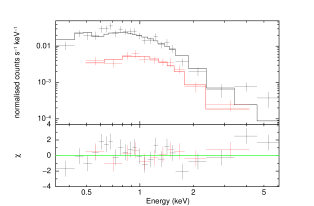
The keV XMM-Newton light curve and the Swift/XRT measurements of the flux (see Table 3) show neither short- nor long-term variability. The source was bright enough to allow spectral analysis. We extracted PN, MOS1, and MOS2 spectra and fitted them simultaneously using different spectral models. The best-fit model (, 66 d.o.f.) is an absorbed power-law plus disc-blackbody, with a photon-index of , a temperature of keV, and a luminosity of erg s-1 in the energy band keV (Table 7; Fig. 8). The spectral parameters and the X-ray luminosity are typical of accreting intermediate-mass black holes (IMBHs; see e.g. Stobbart et al. 2006). We also obtained an acceptable fit (, 65 d.o.f.) with an absorbed power-law plus thermal component, phabs(powerlaw+apec), with and keV. Although this spectral model overfits the data with a , it describes the expected X-ray emission from the unresolved nuclear region of a galaxy better, where a fraction of the X-ray emission is produced by point sources and the remaining emission comes from interstellar gas. The power-law photon index obtained with this fit is compatible with the spectral emission from an active nucleus with a very low accretion rate111111Photon indices in the range of have been measured in different AGNs (Ishibashi & Courvoisier 2010 and references therein)., or with the spectral emission from XRBs.
5.2 Source No. 63 (XMMU J040400.9-432319)
The second-brightest source in the of NGC 1512 is source No. 63. It coincides with the infrared source 2MASS J04040093-4323175 and the optical source USNO-B1 0466-0031610. We extracted the MOS1 and MOS2 spectra (the position of the source was close to a gap in PN) and found that an absorbed power-law provides an acceptable fit (see Table 7 and Fig. 8). No. 63 does not show any significant variability in the XMM-Newton and Swift observations (Table 3). Atlee & Gould (2007) classified the optical counterpart of No. 63 as a QSO candidate according to the selection criteria based on optical (USNO A2.0, Monet 1998) and UV (GALEX Release Two) properties. The catalogue of Atlee & Gould (2007) provides a probability of 36% that this source is a QSO candidate. Therefore we investigated other possible classifications. A comparison between the optical/infrared colours and the optical luminosity from USNO B1 and 2MASS catalogues with the stellar spectral flux library of Pickles (1998) shows that No. 63 cannot be a foreground star. If No. 63 belongs to NGC 1512, its keV luminosity would be erg s-1, exceeding the Eddington limit of an accreting neutron star and compatible with an accreting black hole with an X-ray luminosity lying just below the conventional luminosity threshold of erg s-1 of ULXs.
5.3 Other sources in NGC 1512/1510
The keV fluxes of the remaining 19 sources range from erg cm-2 s-1 to erg cm-2 s-1 ( erg s-1, assuming Mpc). These sources are too faint to perform a spectral analysis. Therefore we used the hardness ratios to outline their X-ray properties. Figure 3 shows the hardness ratios of sources in NGC 1512/1510 with uncertainties less than 0.3 and a grid of hardness ratios calculated for different spectral models (Sect. 3.2). The entire sample of sources plotted in Fig. 3 shows hardness ratios compatible with power-law or disc-blackbody models, indicating that they might either be accreting compact objects in NGC 1512/1510 or background objects.
| No. | RA | Dec | Flux ( keV) | Luminosity ( keV) | ||
|---|---|---|---|---|---|---|
| (J2000) | (J2000) | erg cm-2 s-1 | erg s-1 | |||
| 241 | 04 03 25.76 | 43 23 10.0 | ||||
| 28 | 04 03 32.12 | 43 21 39.2 | ||||
| 292 | 04 03 32.71 | 43 24 01.7 | ||||
| 42 | 04 03 42.10 | 43 18 38.5 | ||||
| 43 | 04 03 42.40 | 43 19 58.9 | ||||
| 44 | 04 03 42.72 | 43 23 17.1 | ||||
| 45 | 04 03 42.90 | 43 20 50.2 | ||||
| 51 | 04 03 50.86 | 43 22 04.9 | ||||
| 53 | 04 03 52.76 | 43 20 59.0 | ||||
| 543 | 04 03 54.26 | 43 20 56.7 | ||||
| 55 | 04 03 54.30 | 43 18 53.0 | ||||
| 57 | 04 03 54.79 | 43 22 24.5 | ||||
| 591 | 04 03 56.14 | 43 17 20.7 | ||||
| 62 | 04 03 58.34 | 43 22 46.0 | ||||
| 634 | 04 04 00.99 | 43 23 19.0 | ||||
| 67 | 04 04 08.90 | 43 18 43.8 | ||||
| 69 | 04 04 11.17 | 43 19 57.7 | ||||
| 731 | 04 04 14.97 | 43 22 57.6 | ||||
| 741 | 04 04 15.17 | 43 22 34.3 | ||||
| 751 | 04 04 15.21 | 43 24 09.8 | ||||
| 901 | 04 04 35.29 | 43 20 06.7 | ||||
Notes: 1 outside of but overlapping outer galaxy arms of GALEX observation; 2 nuclear region of NGC 1510; 3 nuclear region of NGC 1512; 4 QSO or intermediate ULX;
XMM-Newton detected 13 non-nuclear sources inside the ellipse of NGC 1512 in the energy band keV. Based on the spectral emission properties emerging from the hardness ratios, they can be either XRBs or AGNs. Assuming that AGNs are uniformly distributed in the sky, their number within the ellipse of NGC 1512 can be derived statistically using the keV and keV AGN distributions of Cappelluti et al. (2009). The in the energy range keV is almost unaffected by the incompleteness effect produced by the absorption. In contrast, this effect is present in the energy range keV. We accounted for NGC 1512 absorption in the keV by assuming that the total column density through the galactic disc (along the directions perpendicular to the galactic plane) is cm-2, in agreement with the hydrogen distribution in the direction perpendicular to the Galactic plane of the Milky Way (Kalberla & Kerp, 2009). Then, assuming that the spectral emission of AGNs in keV is described by a power-law with photon index (see Cappelluti et al. 2009 and references therein), we found that AGNs beyond NGC 1512 detected with a flux erg cm-2 s-1 would have fluxes erg cm-2 s-1 if they were not absorbed by NGC 1512. We found that AGNs are expected in the ellipse of NGC 1512 in the energy range keV with observed fluxes erg cm-2 s-1 and AGNs in the energy range keV with observed fluxes higher than the keV limiting flux erg cm-2 s-1. The numbers derived above can be compared with the numbers of sources detected by XMM-Newton with a higher detection likelihood than 6 in the energy bands keV and keV, within the ellipse of NGC 1512. To accomplish this, we corrected the number of X-ray sources for the incompleteness effect. It consists of an underestimation of the number of sources detected in the surveyed area caused by the non-uniformity of the sensitivity of the EPIC instruments across the field of view. We corrected the number of X-ray sources in the region as follows: we first created the combined sensitivity maps of the three EPIC instruments in the energy bands of keV and keV with the SAS task esensmap. We excluded a circular region centred on the nuclear region of NGC 1512 with radius 12 arcsec from this analysis, where the relatively poor spatial resolution of EPIC in a crowded region causes source confusion effects. is the area of the sky surveyed by EPIC. We used the resulting sensitivity maps to calculate the fraction of surveyed area , over which sources with a given flux can be detected. Then, we used this factor to correct the total number of detected sources for each of the two energy bands considered for incompleteness with the formula , where is the number of detected sources and is the number of sources corrected for incompleteness. We found seven sources with a flux higher than erg cm-2 s-1 in the energy range of keV and nine sources with a flux higher than erg cm-2 s-1 in the energy range keV. From a simple comparison we find that the number of expected AGNs calculated above agrees; these numbers are slightly lower than the number of X-ray sources observed by XMM-Newton and corrected for incompleteness, which means that they indicate a small population of XRBs in NGC 1512.
Since the number of HMXBs and LMXBs in nearby galaxies depends on the SFR and the stellar mass content, respectively (see e.g. Grimm et al. 2003; Gilfanov 2004), we obtained a rough estimate of the expected number of HMXBs and LMXBs in the ellipse of NGC 1512 above the limiting flux of erg cm-2 s-1 in the energy range of keV. Using the relation of Mineo et al. (2012a) (eq. 18) and M⊙ yr-1 (Koribalski & López-Sánchez, 2009) we found . The number of LMXBs depends on the stellar mass of a galaxy. We obtained M⊙ using the relation between the mass-to-light ratio and the optical colour of Bell & de Jong (2001) (), the extinction-corrected total extrapolated magnitude from the 2MASS redshift catalogue (Huchra et al., 2012), and the extinction-corrected optical colour from de Vaucouleurs et al. (1991) RC3 catalogue. Using the X-ray luminosity function calculated by Gilfanov (2004) (eq. 8), we obtained in NGC 1512. The sum of the number of HMXBs and LMXBs obtained from SFR and measurements and the number of expected AGNs agree with the number of X-ray sources observed by XMM-Newton within the ellipse of NGC 1512.
5.4 Diffuse emission
We have detected a soft X-ray emitting component that is located in the ring of NGC 1512. Assuming a thermal plasma model for the emission yields a temperature of keV. Typically, thermal emission from spiral galaxies exhibits a two-temperature spectrum with cool and hot components of keV and keV. For example, this two temperature model has been observed in M101 (Kuntz et al., 2003), M81 (Page et al., 2003), and in the barred-spirals NGC 6946 (Schlegel et al., 2003) and NGC 1672 (Jenkins et al., 2011). The temperature of our best-fit spectral model to the inner NGC 1512 spectrum agrees with the hotter component expected for spiral galaxies. We suspect that, because of the poor count statistics and significant contamination of our spectra, we simply lack the sensitivity to detect the expected soft component. Accordingly, we considered only the detected hot component but caution that it may not represent the underlying X-ray emission from the centre of NGC 1512. The detected emission may not be truly diffuse in origin. Unresolved discrete sources can contribute to the apparently diffuse source and must therefore be quantified.
5.4.1 Unresolved HMXBs
Typically, one can separate the unresolved discrete sources into contributions from objects associated with the young (HMXBs) and older (LMXBs; cataclysmic variables, CVs; and coronally active binaries, ABs) stellar populations in the region. Koribalski & López-Sánchez (2009) determined the ages of the UV-bright stellar populations in the nuclear region and ring of NGC 1512 and found ages Myr. Therefore, it is unlikely that any HMXBs are located in the central regions because they are associated with younger stellar populations with ages Myr.
5.4.2 Unresolved weak sources
Objects associated with the older stellar population are much more likely to contribute. Revnivtsev et al. (2007, 2008) demonstrated that the X-ray luminosity per unit stellar mass due to the weak X-ray sources (CVs and ABs) associated with the old stellar population in the solar vicinity (Sazonov et al., 2006) is compatible with that observed in other galaxies. Hence, we can determine the expected X-ray luminosity from the unresolved CVs and ABs using the mass or, equivalently, luminosity of the stellar population, which can be estimated using NIR data (see also Sect. 5.3). We determined the combined -band luminosity of the central region of NGC 1512 using the 2MASS Large Galaxy Atlas (Jarrett et al., 2003, see Fig. 2 right). Conveniently, the isophotal -band magnitude in the atlas is representative of the central region with . Converting this into a luminosity gives L☉. We then used the relation erg s-1 (Revnivtsev et al., 2008) and adjusted for the X-ray energy range using their emission model and the WebPIMMS121212Available at https://heasarc.gsfc.nasa.gov/Tools/w3pimms.html tool to determine an expected contribution to the X-ray luminosity of erg s-1.
5.4.3 Unresolved LMXBs
Unresolved LMXBs associated with the old stellar population can also contribute to the apparently diffuse emission.
Since the number of LMXBs in a stellar population is related to the total mass (Gilfanov, 2004),
we estimated the X-ray luminosity of LMXBs below the detection threshold using the total stellar mass in the central region.
Using the method outlined in Sect. 5.3 with the combined -band magnitude of the stellar population,
we estimated the total stellar mass in the central region to be M☉.
We then used Equation 11 of Gilfanov (2004) to estimate the number of LMXBs with
erg s1 and their combined luminosity to be and erg s-1, respectively.
As stated by Gilfanov (2004), this X-ray luminosity is related to the total due to LMXBs
through a correction factor of . Thus, the total LMXB population in the central region contributes
erg s1. In addition to the nuclear source, there are two X-ray sources located
in the interior region (see Fig. 1). The X-ray colours of these sources suggest that they are either
XRBs or AGN, namely No. 51 and No. 53 (see Sect. 5.3). The stellar mass in the central region suggests
that probably about two sources with erg s1 are present. Since our source detection
sensitivity is erg s1, No. 51 and No. 53 might be expected to be LMXBs.
If that is the case, their combined erg s1,
which is similar to the total emission expected from the LMXB population.
This means that if these are indeed LMXBs,
the due to unresolved LMXBs is erg s1,
with the upper limit being about half of the observed in the central region.
5.4.4 Emission from the interstellar gas
With these unresolved source contributions in mind, we re-ran our spectral fits, this time including spectral components representing the unresolved discrete sources, to determine the plasma temperature and luminosity of the diffuse emission. We fixed the normalisations of these additional components so that they represented the upper limits of their luminosity contribution. For the CVs and ABs we used the model of Revnivtsev et al. (2008), a combination of a thermal plasma (mekal in XSPEC) with solar abundance and keV, and a power-law with photon index . For the LMXBs, we used a power-law model with photon index , typical of LMXBs (Soria & Wu, 2003). The resulting plasma temperature for the truly diffuse emission is keV and erg s-1. Mineo et al. (2012b) determined from a sample of nearby star-forming galaxies that the keV luminosity of diffuse X-ray emission from the ISM is linearly correlated with the SFR of that galaxy as . Because the SFR of NGC 1512 is 0.22 M☉ yr-1 (Koribalski & López-Sánchez, 2009), we expect to be erg s-1. The observed was found to be erg s-1, which is largely consistent with the relation of Mineo et al. (2012b). An explanation of the slight discrepancy may be the non-detection of the cooler ISM component, typically observed in star-forming galaxies, because of the sensitivity of our observation (see Sect. 5.4).
In the inner regions of spiral galaxies, there are three possible sources of a hot X-ray emitting gas: stellar winds and supernova remnants associated with the older stellar population, superwinds driven by active star formation, and an AGN (Tyler et al., 2004). Since the youngest stellar population in the inner NGC 1512 region is of intermediate age ( Myr), it is unlikely that a superwind is being driven as the massive stellar population has been exhausted. Similarly, the absence of an AGN in NGC 1512 naturally rules out this possible source. Thus, the hot gas is most likely being produced by supernovae from the older stellar population, that is, the supernovae currently feeding the hot gas are Type Ia remnants because there is no young stellar population ( Myr) capable of producing core-collapse (CC) explosions. However, in the past the contribution from CC remnants most likely dominated the energy input because of the intense star formation in the ring and nuclear region of NGC 1512 caused by the interaction with NGC 1510, very likely around Myr ago (Koribalski & López-Sánchez, 2009). The combined effect of the massive stellar winds and supernovae may even have driven a superwind, that blew hot gas out along the poles of the galaxy into the halo, entrained and shocked cooler gas in the disc and halo, and produced X-rays (e.g., Strickland & Heckman, 2009). If the radiative cooling time were long enough, some contribution from this earlier epoch would be expected. Spectral signatures of a Type Ia origin would be evident as enhanced Fe lines in the spectrum. However, our spectra lack the count statistics to identify such a signature.
We can estimate some constraints on the physical parameters of the hot diffuse gas based on the results from our spectral fits. The normalisation of the thermal plasma model () representing the diffuse component can be related to the emission measure through
| (4) |
For a thermal plasma with 0.65 solar abundance, as is the case for NGC 1512, . , where A is the area of the extraction region in cm and is the height of the emitting region. We scaled the term to units of kpc to allow a direct comparison of our results with other works. We also introduced a volume filling factor to account for the distribution of hot gas in the volume . Equation 4 can now be written
| (5) |
From our elliptical extraction region with semi-major and semi-minor axes of and (corresponding to kpc and kpc at the distance of NGC 1512), we determined to be cm2. Solving Equation 5 with these values gives cm-3. Using this determined electron density and the best-fit plasma temperature, we also calculated the radiative cooling time () of the gas as
| (6) |
with erg cm-3 s-1 (Sutherland & Dopita, 1993). This yields yr. The determined values of and are very low and high, respectively, compared with those determined for the central regions of other galaxies. Tyler et al. (2004) determined to be in the range cm-3 for their sample of spiral galaxies without an AGN. Their higher gas densities naturally lead to lower radiative cooling times yr. A possible explanation is that the bar in NGC 1512 may play some significant role since bars are known to drive gas from the disk to the nuclear regions of a galaxy, fuelling star formation, and feeding an AGN, if present (Shlosman et al., 1990). Therefore, this dynamic system might have disrupted the hot gas content in the inner region of NGC 1512, resulting in the low electron density we observe. For the moment, this is just a suggestion because our data do not allow for a more detailed analysis. Only deeper (and/or less contaminated) X-ray observations with Chandra or XMM-Newton will allow us to properly characterise the diffuse X-ray emission and address this question.
6 Summary
For the first time, we presented a study of the X-ray source populations and diffuse emission in the XMM-Newton field of view of the galaxy pair NGC 1512 and NGC 1510. We performed a source detection and obtained a catalogue containing 106 sources detected in the energy range of keV, 15 within the ellipses of NGC 1512 and NGC 1510, and about six sources in the extended arms of the galaxy pair. Based on the X-ray spectral analysis, Bayesian hardness ratios, X-ray variability (for which we also made use of archival Swift/XRT data), cross-correlations with catalogues in other wavelengths, and the 20-cm radio maps of ATCA, we identified counterparts for 37 sources, six of which were identified or classified as background objects and six as foreground stars. We discussed the nature of source No. 63 (XMMU J040400.9-432319), previously classified as a QSO (Atlee & Gould, 2007). We have shown that its properties are also consistent with an accreting black-hole in the galactic disc of NGC 1512.
We showed that the number of HMXBs and LMXBs obtained from measurement of the star formation rate and total mass of NGC 1512 is consistent with the number of X-ray sources observed within the ellipse of NGC 1512, after taking into account the contribution of background AGNs.
We detected diffuse X-ray emission from the interior region of NGC 1512 with a plasma temperature keV and a 0.3–10 keV X-ray luminosity of erg s-1, after correcting for unresolved discrete sources. While the X-ray emission is most likely due to present and/or past stellar winds and supernovae, the derived electron densities and radiative cooling times seem to low and high, respectively, compared with those of other spiral galaxies.
Acknowledgements.
This research is funded by the BMWi/DLR grant FKZ 50 OR 1209. MS and LD acknowledge support by the Deutsche Forschungsgemeinschaft through the Emmy Noether Research Grant SA 2131/1-1. This work is partially supported by the Bundesministerium für Wirtschaft und Technologie through the Deutsches Zentrum für Luft- und Raumfahrt (Grant FKZ 50 OG 1301). This research has made use of the SIMBAD database, operated at CDS, Strasbourg, France, and of the NASA/IPAC Extragalactic Database (NED), which is operated by the Jet Propulsion Laboratory, California Institute of Technology, under contract with the National Aeronautics and Space Administration. This research has made use of the VizieR catalogue access tool, CDS, Strasbourg, France. The original description of the VizieR service was published in Ochsenbein et al. (2000). This research has made use of data, software and web tools obtained from NASA’s High Energy Astrophysics Science Archive Research Center (HEASARC), a service of Goddard Space Flight Center and the Smithsonian Astrophysical Observatory. This publication has made use of data products from the Two Micron All Sky Survey, which is a joint project of the University of Massachusetts and the Infrared Processing and Analysis Center, funded by the National Aeronautics and Space Administration and the National Science Foundation. This research has made use of SAOImage DS9, developed by Smithsonian Astrophysical Observatory. This work made use of the XMM-Newton Extended Source Analysis Software.References
- Arnaud (1996a) Arnaud, K. A. 1996a, in Astronomical Society of the Pacific Conference Series, Vol. 101, Astronomical Data Analysis Software and Systems V, ed. G. H. Jacoby & J. Barnes, 17
- Arnaud (1996b) Arnaud, K. A. 1996b, in Astronomical Society of the Pacific Conference Series, Vol. 101, Astronomical Data Analysis Software and Systems V, ed. G. H. Jacoby & J. Barnes, 17
- Atlee & Gould (2007) Atlee, D. W. & Gould, A. 2007, ApJ, 664, 53
- Balucinska-Church & McCammon (1992) Balucinska-Church, M. & McCammon, D. 1992, ApJ, 400, 699
- Bauer et al. (2008) Bauer, M., Pietsch, W., Trinchieri, G., et al. 2008, A&A, 489, 1029
- Bell & de Jong (2001) Bell, E. F. & de Jong, R. S. 2001, ApJ, 550, 212
- Buccheri et al. (1983) Buccheri, R., Bennett, K., Bignami, G. F., et al. 1983, A&A, 128, 245
- Burrows et al. (2005) Burrows, D. N., Hill, J. E., Nousek, J. A., et al. 2005, Space Sci. Rev., 120, 165
- Cappelluti et al. (2009) Cappelluti, N., Brusa, M., Hasinger, G., et al. 2009, A&A, 497, 635
- Carkner et al. (1997) Carkner, L., Mamajek, E., Feigelson, E., et al. 1997, ApJ, 490, 735
- Carpano et al. (2005) Carpano, S., Wilms, J., Schirmer, M., & Kendziorra, E. 2005, A&A, 443, 103
- Carter & Sembay (2008) Carter, J. A. & Sembay, S. 2008, A&A, 489, 837
- Cash (1979) Cash, W. 1979, ApJ, 228, 939
- Chen et al. (1997) Chen, L.-W., Fabian, A. C., & Gendreau, K. C. 1997, MNRAS, 285, 449
- Cruddace et al. (1988) Cruddace, R. G., Hasinger, G. R., & Schmitt, J. H. 1988, in European Southern Observatory Conference and Workshop Proceedings, Vol. 28, European Southern Observatory Conference and Workshop Proceedings, ed. F. Murtagh, A. Heck, & P. Benvenuti, 177–182
- Cutri et al. (2003) Cutri, R. M., Skrutskie, M. F., van Dyk, S., et al. 2003, VizieR Online Data Catalog, 2246, 0
- De Luca & Molendi (2004) De Luca, A. & Molendi, S. 2004, A&A, 419, 837
- de Vaucouleurs et al. (1991) de Vaucouleurs, G., de Vaucouleurs, A., Corwin, Jr., H. G., et al. 1991, Third Reference Catalogue of Bright Galaxies. Volume I: Explanations and references. Volume II: Data for galaxies between 0h and 12h. Volume III: Data for galaxies between 12h and 24h.
- Di Stefano & Kong (2003) Di Stefano, R. & Kong, A. K. H. 2003, ApJ, 592, 884
- Favata (1998) Favata, F. 1998, in Astronomical Society of the Pacific Conference Series, Vol. 154, Cool Stars, Stellar Systems, and the Sun, ed. R. A. Donahue & J. A. Bookbinder, 511
- Freyberg et al. (2004) Freyberg, M. J., Briel, U. G., Dennerl, K., et al. 2004, in Society of Photo-Optical Instrumentation Engineers (SPIE) Conference Series, Vol. 5165, Society of Photo-Optical Instrumentation Engineers (SPIE) Conference Series, ed. K. A. Flanagan & O. H. W. Siegmund, 112–122
- Gehrels et al. (2004) Gehrels, N., Chincarini, G., Giommi, P., et al. 2004, ApJ, 611, 1005
- Getman et al. (2008) Getman, K. V., Feigelson, E. D., Broos, P. S., Micela, G., & Garmire, G. P. 2008, ApJ, 688, 418
- Gilfanov (2004) Gilfanov, M. 2004, MNRAS, 349, 146
- Girard et al. (2011) Girard, T. M., van Altena, W. F., Zacharias, N., et al. 2011, AJ, 142, 15
- Grimm et al. (2003) Grimm, H.-J., Gilfanov, M., & Sunyaev, R. 2003, MNRAS, 339, 793
- Hawarden et al. (1979) Hawarden, T. G., van Woerden, H., Goss, W. M., Mebold, U., & Peterson, B. A. 1979, A&A, 76, 230
- Høg et al. (2000) Høg, E., Fabricius, C., Makarov, V. V., et al. 2000, A&A, 355, L27
- Huchra et al. (2012) Huchra, J. P., Macri, L. M., Masters, K. L., et al. 2012, ApJS, 199, 26
- Ishibashi & Courvoisier (2010) Ishibashi, W. & Courvoisier, T. J.-L. 2010, A&A, 512, A58
- Jarrett et al. (2003) Jarrett, T. H., Chester, T., Cutri, R., Schneider, S. E., & Huchra, J. P. 2003, AJ, 125, 525
- Jenkins et al. (2011) Jenkins, L. P., Brandt, W. N., Colbert, E. J. M., et al. 2011, ApJ, 734, 33
- Johnson (1966) Johnson, H. L. 1966, ARA&A, 4, 193
- Kaastra & Mewe (2000) Kaastra, J. S. & Mewe, R. 2000, in Atomic Data Needs for X-ray Astronomy, ed. M. A. Bautista, T. R. Kallman, & A. K. Pradhan, 161
- Kalberla et al. (2005) Kalberla, P. M. W., Burton, W. B., Hartmann, D., et al. 2005, A&A, 440, 775
- Kalberla & Kerp (2009) Kalberla, P. M. W. & Kerp, J. 2009, ARA&A, 47, 27
- Kinman (1978) Kinman, T. D. 1978, AJ, 83, 764
- Koribalski & López-Sánchez (2009) Koribalski, B. S. & López-Sánchez, Á. R. 2009, MNRAS, 400, 1749
- Koribalski et al. (2004) Koribalski, B. S., Staveley-Smith, L., Kilborn, V. A., et al. 2004, AJ, 128, 16
- Krautter et al. (1999) Krautter, J., Zickgraf, F.-J., Appenzeller, I., et al. 1999, A&A, 350, 743
- Kuntz & Snowden (2008) Kuntz, K. D. & Snowden, S. L. 2008, A&A, 478, 575
- Kuntz & Snowden (2010) Kuntz, K. D. & Snowden, S. L. 2010, ApJS, 188, 46
- Kuntz et al. (2003) Kuntz, K. D., Snowden, S. L., Pence, W. D., & Mukai, K. 2003, ApJ, 588, 264
- Lin et al. (2012) Lin, D., Webb, N. A., & Barret, D. 2012, ApJ, 756, 27
- Maccacaro et al. (1988) Maccacaro, T., Gioia, I. M., Wolter, A., Zamorani, G., & Stocke, J. T. 1988, ApJ, 326, 680
- Maddox et al. (1990) Maddox, S. J., Efstathiou, G., Sutherland, W. J., & Loveday, J. 1990, MNRAS, 243, 692
- Makishima et al. (1986) Makishima, K., Maejima, Y., Mitsuda, K., et al. 1986, ApJ, 308, 635
- Mauch et al. (2003) Mauch, T., Murphy, T., Buttery, H. J., et al. 2003, MNRAS, 342, 1117
- Mewe et al. (1998) Mewe, R., Drake, S. A., Kaastra, J. S., et al. 1998, A&A, 339, 545
- Mineo et al. (2012a) Mineo, S., Gilfanov, M., & Sunyaev, R. 2012a, MNRAS, 419, 2095
- Mineo et al. (2012b) Mineo, S., Gilfanov, M., & Sunyaev, R. 2012b, MNRAS, 426, 1870
- Monet (1998) Monet, D. G. 1998, in Bulletin of the American Astronomical Society, Vol. 30, American Astronomical Society Meeting Abstracts, #120.03
- Monet et al. (2003) Monet, D. G., Levine, S. E., Canzian, B., et al. 2003, AJ, 125, 984
- Ochsenbein et al. (2000) Ochsenbein, F., Bauer, P., & Marcout, J. 2000, A&AS, 143, 23
- O’Sullivan et al. (2001) O’Sullivan, E., Forbes, D. A., & Ponman, T. J. 2001, MNRAS, 328, 461
- Page et al. (2003) Page, M. J., Breeveld, A. A., Soria, R., et al. 2003, A&A, 400, 145
- Park et al. (2006) Park, T., Kashyap, V. L., Siemiginowska, A., et al. 2006, ApJ, 652, 610
- Pickles (1998) Pickles, A. J. 1998, PASP, 110, 863
- Pietsch et al. (2004) Pietsch, W., Misanovic, Z., Haberl, F., et al. 2004, A&A, 426, 11
- Prestwich et al. (2003) Prestwich, A. H., Irwin, J. A., Kilgard, R. E., et al. 2003, ApJ, 595, 719
- Primini et al. (1993) Primini, F. A., Forman, W., & Jones, C. 1993, ApJ, 410, 615
- Revnivtsev et al. (2007) Revnivtsev, M., Churazov, E., Sazonov, S., Forman, W., & Jones, C. 2007, A&A, 473, 783
- Revnivtsev et al. (2008) Revnivtsev, M., Churazov, E., Sazonov, S., Forman, W., & Jones, C. 2008, A&A, 490, 37
- Robertson & Cravens (2003) Robertson, I. P. & Cravens, T. E. 2003, Geochim. Res. Lett., 30, 1439
- Roeser et al. (2010) Roeser, S., Demleitner, M., & Schilbach, E. 2010, AJ, 139, 2440
- Sazonov et al. (2006) Sazonov, S., Revnivtsev, M., Gilfanov, M., Churazov, E., & Sunyaev, R. 2006, A&A, 450, 117
- Schlegel et al. (2003) Schlegel, E. M., Holt, S. S., & Petre, R. 2003, ApJ, 598, 982
- Shirey et al. (2001) Shirey, R., Soria, R., Borozdin, K., et al. 2001, A&A, 365, L195
- Shlosman et al. (1990) Shlosman, I., Begelman, M. C., & Frank, J. 1990, Nature, 345, 679
- Skrutskie et al. (2006) Skrutskie, M. F., Cutri, R. M., Stiening, R., et al. 2006, AJ, 131, 1163
- Smith et al. (2001) Smith, R. K., Brickhouse, N. S., Liedahl, D. A., & Raymond, J. C. 2001, ApJ, 556, L91
- Snowden et al. (2004) Snowden, S. L., Collier, M. R., & Kuntz, K. D. 2004, ApJ, 610, 1182
- Snowden et al. (2008) Snowden, S. L., Mushotzky, R. F., Kuntz, K. D., & Davis, D. S. 2008, A&A, 478, 615
- Soria & Wu (2003) Soria, R. & Wu, K. 2003, A&A, 410, 53
- Stobbart et al. (2006) Stobbart, A.-M., Roberts, T. P., & Wilms, J. 2006, MNRAS, 368, 397
- Strickland & Heckman (2009) Strickland, D. K. & Heckman, T. M. 2009, ApJ, 697, 2030
- Sutherland & Dopita (1993) Sutherland, R. S. & Dopita, M. A. 1993, ApJS, 88, 253
- Tyler et al. (2004) Tyler, K., Quillen, A. C., LaPage, A., & Rieke, G. H. 2004, ApJ, 610, 213
- Ungruhe et al. (2003) Ungruhe, R., Seitter, W. C., & Duerbeck, H. W. 2003, Journal of Astronomical Data, 9, 1
- White et al. (1995) White, N. E., Nagase, F., & Parmar, A. N. 1995, X-ray Binaries, 1
- Wilms et al. (2000) Wilms, J., Allen, A., & McCray, R. 2000, ApJ, 542, 914
- Zacharias et al. (2013) Zacharias, N., Finch, C. T., Girard, T. M., et al. 2013, AJ, 145, 44
Appendix A classification and identification of the XMM-Newton sources
A.1 foreground stars
Source No. 9
Source No. 9 is the brightest X-ray source in the XMM-Newton observation of NGC 1512/1510. It is located outside of the optical discs of NGC 1512 and NGC 1510 (angular separation of from the nuclear region of NGC 1512). It is associated with the optical source USNO-B1 0464-0031154 and the infrared source 2MASS 04030715-4330273. It is close to the galaxy MRSS 250-130342 (Ungruhe et al. 2003) (angular separation of ), but the error circles do not overlap. Therefore, the galaxy is probably not associated with source No. 9.
Source No. 9 is bright enough in the XMM-Newton observation to allow a spectral analysis. We fitted the PN, MOS1, MOS2 spectra simultaneously with the thermal palsma model of Kaastra & Mewe (2000) (mekal in XSPEC), which is commonly used to study the X-ray coronal emission from stars. We first attempted to fit the spectrum with one-temperature model, but we obtained a poor fit with . Then, we fitted the spectrum with a two-temperature model, using non-solar abundances, which led to a significant improvement of the fit (Table 9 and Fig. 8). We obtained the best-fit assuming metal abundances with regard to solar abundances of . Observations of under- or over-abundances of elements are not unusual in the coronae of stars (see e.g. Mewe et al. 1998; Favata 1998). We point out that in our fit the coronal abundances cannot be adequately constrained because of the poor statistics.
| one-temperature model | two-temperature model | |
| ( cm-2) | ||
| (keV) | ||
| norm. | ||
| (keV) | ||
| norm. | ||
| Abundances | ||
| (d.o.f.) | 1.25 (81) | 1.04 (80) |
| unabs. |
Sources No. 13 and 94
Sources No. 13 and 94 have optical, infrared, and radio counterparts. The radio counterparts, detected with ATCA, have fluxes of 0.9 mJy beam-1 (No. 13) and 0.3 mJy beam-1 (No. 94) at 20-cm (beam size: arcsec2). Although the measurement of a proper motion classify them as foreground stars131313We point out that the measurement of the proper motion of No. 94 in PPMXL catalogue ruled out the previous classification of this source as a galaxy (MRSS 250-123273 in the MRSS catalogue; APMUKS(BJ) B040305.24-433329.9 in the The APM galaxy survey, Maddox et al. 1990). they violate the (No. 13) and and vs. of Fig. 7 (No. 94) criteria. The high ratio of source No. 13 can be explained by the strong X-ray and radio emission of a low-mass pre-main sequence star (e.g. Getman et al. 2008; Carkner et al. 1997 and references therein). The hard of No. 94 may indicate a binary nature (with an accreting neutron star in a propeller state).
A.2 background objects
Source No. 23
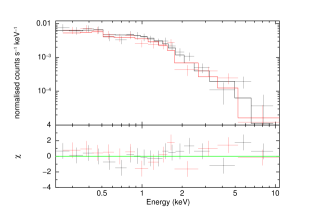
Source No. 23 is located outside of the ellipse of NGC 1512 ( from the nuclear region of NGC 1512). It has neither an optical nor an infrared counterpart. A radio counterpart has been detected with ATCA with a flux of 0.3 mJy beam-1 at 20-cm (beam size: arcsec2). The XMM-Newton spectrum can be well fitted with an absorbed power-law (see Table 7 and Fig. 8). Therefore, we classified source No. 23 as an AGN candidate.
Appendix B X-ray source catalogue of the XMM-Newton observation of the NGC 1512/1510 system
| No. | RA(2000) | DEC(2000) | pos. err. | rate | likelihood | HR1 | HR2 | HR3 | HR4 |
|---|---|---|---|---|---|---|---|---|---|
| ( keV) | |||||||||
| 1 | 04 02 42.04 | 43 16 38.7 | |||||||
| 2 | 04 02 55.40 | 43 22 02.3 | |||||||
| 3 | 04 02 59.32 | 43 19 18.3 | |||||||
| 4 | 04 02 59.40 | 43 32 23.6 | |||||||
| 5 | 04 03 02.96 | 43 15 47.3 | |||||||
| 6 | 04 03 03.12 | 43 24 15.4 | |||||||
| 7 | 04 03 03.72 | 43 28 18.5 | |||||||
| 8 | 04 03 05.55 | 43 21 18.4 | |||||||
| 9 | 04 03 07.15 | 43 30 29.0 | |||||||
| 10 | 04 03 08.30 | 43 31 33.9 | |||||||
| 11 | 04 03 09.95 | 43 15 56.3 | |||||||
| 12 | 04 03 11.98 | 43 20 32.6 | |||||||
| 13 | 04 03 12.96 | 43 11 57.6 | |||||||
| 14 | 04 03 13.46 | 43 28 02.0 | |||||||
| 15 | 04 03 17.87 | 43 14 58.0 | |||||||
| 16 | 04 03 20.13 | 43 25 36.9 | |||||||
| 17 | 04 03 20.51 | 43 17 59.9 | |||||||
| 18 | 04 03 21.47 | 43 10 10.6 | |||||||
| 19 | 04 03 21.87 | 43 24 55.2 | |||||||
| 20 | 04 03 22.09 | 43 12 28.4 | |||||||
| 21 | 04 03 22.27 | 43 25 12.3 | |||||||
| 22 | 04 03 23.19 | 43 17 17.3 | |||||||
| 23 | 04 03 25.37 | 43 17 22.0 | |||||||
| 24 | 04 03 25.76 | 43 23 10.0 | |||||||
| 25 | 04 03 26.52 | 43 21 46.3 | |||||||
| 26 | 04 03 28.37 | 43 29 29.5 | |||||||
| 27 | 04 03 30.29 | 43 31 09.6 | |||||||
| 28 | 04 03 32.12 | 43 21 39.2 | |||||||
| 29 | 04 03 32.71 | 43 24 01.7 | |||||||
| 30 | 04 03 35.40 | 43 17 45.8 | |||||||
| 31 | 04 03 36.55 | 43 16 09.1 | |||||||
| 32 | 04 03 36.61 | 43 11 57.0 | |||||||
| 33 | 04 03 37.26 | 43 17 31.9 | |||||||
| 34 | 04 03 37.46 | 43 11 05.9 | |||||||
| 35 | 04 03 37.63 | 43 27 38.8 | |||||||
| 36 | 04 03 37.69 | 43 09 09.0 | |||||||
| 37 | 04 03 38.08 | 43 24 21.6 | |||||||
| 38 | 04 03 38.24 | 43 10 05.4 | |||||||
| 39 | 04 03 39.09 | 43 31 02.0 | |||||||
| 40 | 04 03 40.85 | 43 28 57.1 | |||||||
| 41 | 04 03 41.82 | 43 10 18.3 | |||||||
| 42 | 04 03 42.10 | 43 18 38.5 | |||||||
| 43 | 04 03 42.40 | 43 19 58.9 | |||||||
| 44 | 04 03 42.72 | 43 23 17.1 | |||||||
| 45 | 04 03 42.90 | 43 20 50.2 | |||||||
| 46 | 04 03 42.94 | 43 16 01.3 | |||||||
| 47 | 04 03 45.43 | 43 26 31.9 | |||||||
| 48 | 04 03 47.11 | 43 24 42.8 | |||||||
| 49 | 04 03 48.29 | 43 10 11.7 | |||||||
| 50 | 04 03 48.97 | 43 14 54.4 | |||||||
| 51 | 04 03 50.86 | 43 22 04.9 | |||||||
| 52 | 04 03 50.91 | 43 24 40.1 | |||||||
| 53 | 04 03 52.76 | 43 20 59.0 | |||||||
| 54 | 04 03 54.26 | 43 20 56.7 | |||||||
| 55 | 04 03 54.30 | 43 18 53.0 | |||||||
| 56 | 04 03 54.52 | 43 14 32.6 | |||||||
| 57 | 04 03 54.79 | 43 22 24.5 | |||||||
| 58 | 04 03 55.58 | 43 09 45.8 | |||||||
| 59 | 04 03 56.14 | 43 17 20.7 | |||||||
| 60 | 04 03 56.36 | 43 08 30.7 | |||||||
| 61 | 04 03 56.60 | 43 29 05.0 | |||||||
| 62 | 04 03 58.34 | 43 22 46.0 | |||||||
| 63 | 04 04 00.99 | 43 23 19.0 | |||||||
| 64 | 04 04 01.23 | 43 33 23.2 | |||||||
| 65 | 04 04 03.38 | 43 25 38.4 | |||||||
| 66 | 04 04 08.28 | 43 14 14.9 | |||||||
| 67 | 04 04 08.90 | 43 18 43.8 | |||||||
| 68 | 04 04 10.89 | 43 07 03.6 | |||||||
| 69 | 04 04 11.17 | 43 19 57.7 | |||||||
| 70 | 04 04 11.19 | 43 16 58.8 | |||||||
| 71 | 04 04 12.64 | 43 22 30.7 | |||||||
| 72 | 04 04 13.90 | 43 29 00.1 | |||||||
| 73 | 04 04 14.97 | 43 22 57.6 | |||||||
| 74 | 04 04 15.17 | 43 22 34.3 | |||||||
| 75 | 04 04 15.21 | 43 24 09.8 | |||||||
| 76 | 04 04 15.72 | 43 31 49.2 | |||||||
| 77 | 04 04 15.79 | 43 28 03.7 | |||||||
| 78 | 04 04 17.53 | 43 19 06.8 | |||||||
| 79 | 04 04 17.77 | 43 25 47.5 | |||||||
| 80 | 04 04 17.94 | 43 29 13.2 | |||||||
| 81 | 04 04 20.21 | 43 24 30.3 | |||||||
| 82 | 04 04 21.24 | 43 22 23.4 | |||||||
| 83 | 04 04 22.57 | 43 24 52.3 | |||||||
| 84 | 04 04 23.05 | 43 12 02.0 | |||||||
| 85 | 04 04 24.15 | 43 25 46.3 | |||||||
| 86 | 04 04 24.20 | 43 13 43.2 | |||||||
| 87 | 04 04 26.82 | 43 28 40.7 | |||||||
| 88 | 04 04 29.73 | 43 23 13.9 | |||||||
| 89 | 04 04 31.49 | 43 26 10.4 | |||||||
| 90 | 04 04 35.29 | 43 20 06.7 | |||||||
| 91 | 04 04 37.22 | 43 13 22.1 | |||||||
| 92 | 04 04 38.05 | 43 14 03.7 | |||||||
| 93 | 04 04 41.89 | 43 09 43.4 | |||||||
| 94 | 04 04 43.73 | 43 25 22.9 | |||||||
| 95 | 04 04 46.15 | 43 15 37.8 | |||||||
| 96 | 04 04 46.86 | 43 29 11.3 | |||||||
| 97 | 04 04 47.02 | 43 16 30.6 | |||||||
| 98 | 04 04 47.14 | 43 22 03.5 | |||||||
| 99 | 04 04 49.77 | 43 20 43.8 | |||||||
| 100 | 04 04 51.53 | 43 19 03.8 | |||||||
| 101 | 04 04 59.35 | 43 13 32.7 | |||||||
| 102 | 04 05 00.38 | 43 14 46.5 | |||||||
| 103 | 04 05 02.17 | 43 20 36.9 | |||||||
| 104 | 04 05 07.07 | 43 18 31.6 | |||||||
| 105 | 04 05 09.57 | 43 18 50.7 | |||||||
| 106 | 04 05 11.59 | 43 22 34.0 |
| No. | USNO B1 | 2MASS | optical | radio | class. |
|---|---|---|---|---|---|
| 1 | 0467-0032009 | ||||
| 2 | |||||
| 3 | |||||
| 4 | 0464-0031137 | 04025923-4332221 | foreground star | ||
| 5 | |||||
| 6 | |||||
| 7 | |||||
| 8 | |||||
| 9 | 0464-0031154 | 04030715-4330273 | foreground star | ||
| 10 | 0464-0031159 | ||||
| 11 | |||||
| 12 | |||||
| 13 | 0468-0031995 | 04031316-4311583 | ATCA 04 03 12.92 -43 11 56.0 | foreground star | |
| 14 | |||||
| 15 | |||||
| 16 | |||||
| 17 | |||||
| 18 | |||||
| 19 | 0465-0031058 | ||||
| 20 | 0467-0032091 | ||||
| 21 | |||||
| 22 | |||||
| 23 | ATCA 04 03 25.54 -43 17 23.2 | background object | |||
| 24 | |||||
| 25 | |||||
| 26 | 0465-0031069 | ||||
| 27 | |||||
| 28 | |||||
| 29 | NGC1510 | ATCA 04 03 32.69 -43 23 59.2 | NGC 1510 | ||
| 30 | |||||
| 31 | |||||
| 32 | |||||
| 33 | |||||
| 34 | |||||
| 35 | |||||
| 36 | 0468-0032035 | ||||
| 37 | 0465-0031095 | ||||
| 38 | 0468-0032036 | ||||
| 39 | |||||
| 40 | 0465-0031108 | 04034120-4329015 | TYC7583-1149-1 | foreground star | |
| 41 | 0468-003204 | ||||
| 42 | |||||
| 43 | 0466-0031581 | ||||
| 44 | |||||
| 45 | |||||
| 46 | |||||
| 47 | |||||
| 48 | |||||
| 49 | |||||
| 50 | |||||
| 51 | |||||
| 52 | |||||
| 53 | |||||
| 54 | 0466-0031598 | 04035419-4320552 | NGC1512 | ATCA 04 03 54.20 -43 20 56.2 | |
| 55 | |||||
| 56 | 0467-0032138 | ||||
| 57 | |||||
| 58 | 0468-0032062 | ||||
| 59 | |||||
| 60 | |||||
| 61 | 0465-0031140 | 04035632-4329041 | MRSS 250-126782 | galaxy | |
| 62 | 0466-0031604 | ||||
| 63 | 0466-0031610 | 04040093-4323175 | QSO or XRB | ||
| 64 | |||||
| 65 | |||||
| 66 | |||||
| 67 | 0466-0031624 | ATCA 04 04 08.82 -43 18 42.3 | background object | ||
| 68 | |||||
| 69 | |||||
| 70 | |||||
| 71 | SUMSS J040412-432235 and ATCA source | background object | |||
| 72 | |||||
| 73 | |||||
| 74 | |||||
| 75 | |||||
| 76 | |||||
| 77 | |||||
| 78 | |||||
| 79 | |||||
| 80 | |||||
| 81 | 0465-0031199 | ||||
| 82 | 0466-0031640 | 04042126-4322204 | |||
| 83 | ATCA 04 04 22.25 -43 24 52.1 | background object | |||
| 84 | |||||
| 85 | |||||
| 86 | |||||
| 87 | |||||
| 88 | |||||
| 89 | 0465-0031223 | 04043150-4326090 | TYC583-426-1 | foreground star | |
| 90 | |||||
| 91 | |||||
| 92 | 0467-0032209 | ||||
| 93 | 0468-0032147 | ||||
| 94 | 0465-0031250 | 04044352-4325227 | MRSS 250-123273 | ATCA 04 04 43.66 -43 25 22.5 | foreground star |
| 95 | |||||
| 96 | |||||
| 97 | |||||
| 98 | ATCA 04 04 46.77 -43 22 02.2 | background object | |||
| 99 | 0466-0031693 | ||||
| 100 | |||||
| 101 | 0467-0032246 | ||||
| 102 | |||||
| 103 | |||||
| 104 | 0466-0031732 | ||||
| 105 | 0466-0031738 | ||||
| 106 | 0466-0031740 |