Optical and
near-infrared spectroscopy of the black hole GX 3394
II. The
spectrocopic
content in the low/hard and high/soft states ††thanks: Based on observations
performed with European Southern Observatory (ESO) Telescopes at the
Paranal Observatory under programmes ID 284.D-5056 and 285.D-5007
Abstract
As a complement to our optical and near-infrared study of the continuum properties of GX 3394 in the two hard and one soft state observations made by the ESO/VLT FORS2 and ISAAC in early 2010, we report here on the results of our spectral line analysis for the same observations. In the soft state, the presence of strong Balmer, Paschen and Brackett emission lines points to the optical and near-infrared spectra stemming from the irradiated chromosphere of the optically thick and geometrically thin accretion disc. Most of these \textH 1 features are still detected in emission in both hard states but are veiled by the compact jets continuum. We also confirm the presence of a broad H absorption feature, prominent in the soft state and shallower in the first hard state, which we argue forms in the deep layers of the optically thick accretion disc. However, this trough is absent in the second hard state, a likely consequence of the formation of a geometrically thick extended envelope that arises above the disc plane and eventually enshrouds the region where the H absorption feature forms. We detect this envelope through the presence of a broad Pa emission line, which is constant during the first hard state but correlates with the underlying continuum during the second hard state, pointing to changing physical properties. We consider that this behaviour may be consistent with the launch of a thermally-driven accretion disc wind during the second hard state.
keywords:
binaries: close X-rays: binaries Infrared: stars accretion, accretion discs Stars: individual: GX 3394 ISM: jets and outflows1 Introduction
Detailed analysis of the optical and near-infrared (near-IR) spectroscopic content of microquasars can be challenging, as many of them are distant and suffer from a high extinction from the interstellar medium (ISM) along their line-of-sight (LOS). Previous studies however revealed that some exhibited very rich spectra during outbursts that gave strong insights into the physical processes at play (see e.g. Callanan et al., 1995; Bandyopadhyay et al., 1997; Soria et al., 2000; Dubus et al., 2001). Although GX 3394 has been extensively studied in the optical (Makishima et al., 1986; Smith et al., 1999; Soria et al., 1999; Shahbaz et al., 2001; Wu et al., 2001; Cowley et al., 2002; Buxton & Vennes, 2003; Hynes et al., 2003, 2004), there has been very little near-infrared (near-IR) spectral investigations (Rahoui et al., 2012, hereafter Paper I). Yet, this source is probably one of the best targets for investigating the near-IR spectral characteristics of microquasars during outburst due to the relatively low extinction along its LOS (, Gandhi et al., 2011), its brightness () and because the emission of the companion star is mostly dominated by that of the accretion disc in the soft state (SS) or the compact jets in the hard state (HS) (Shahbaz et al., 2001).
In Paper I, we presented results based on the
analysis of the optical/near-IR (OIR) continuum of GX 3394, supported by
simultaneous X-ray and radio data. The source was observed twice in
the hard state (MJD 55261.4 and MJD 55262.4, hereafter HS1 and HS2,
respectively) and once in the soft state (MJD 55307.3,
hereafter SS1). We showed that the OIR spectrum stemmed from
(1) a high level of disc irradiation during
SS1, with an excess possibly due to the companion star
at longer wavelengths,
(2) a combination of optically thin synchrotron emission
from the compact jet with a steep UV/optical component during HS1,
(3) more complex emission during HS2; the optical spectrum, fainter
than during HS1, was consistent with disc irradiation, but a strong
near-IR excess was present and we suggested that it might have been
due to more “exotic” processes in the jet and/or corona
(Markoff et al., 2005; Pe’er & Casella, 2009; Veledina et al., 2011).
The near-IR continuum was also
found to be variable on 20 s timescales
in both HS observations but constant during SS1, suggesting a
jet-related origin to these variations.
In this paper, we report on the second part of our study, which focuses on the spectroscopic content in the optical and near-IR domains and aims at (1) making the first detection of spectral lines in the near-IR and (2) understanding the origin and properties of the spectral features in both the HS and SS. The paper is organised in the following way. Section 2 details the specific reduction of the near-IR spectra we performed to avoid contamination by the telluric standards. The spectra are presented in Section 3 and analysed in Section 4. We discuss the results in Section 5 and conclude in Section 6.
2 Observations and data reduction
The observations are presented in detail in Paper I (§ 2) and we refer the reader to that paper for an in-depth description of the data reduction and flux calibration. Whereas Paper I focused primarily on the continuum, here we investigate more specifically on the OIR spectral features. In the near-IR, the data reduction process introduces a contamination by the spectroscopic features of the standard star, which must therefore be removed as much as possible prior to the telluric division. The standard stars which were observed are all giant or main sequence B3–9, as characterised in ISAAC low-resolution spectra by the sole presence of the Paschen and Brackett series in their near-IR spectra (see e.g. Wallace & Hinkle, 1997; Meyer et al., 1998; Wallace et al., 2000). In the J- and K-bands, Pa and Br were isolated enough from any atmospheric absorption dip to be simply removed through interpolation with Gaussians. Unfortunately, this could not be easily done in the H-band because the presence of many Brackett lines between 15000 and 16000 Å as well as the overlapping of Br13 and Br15 with broad atmospheric absorption features made the fitting of the continuum difficult. In the H-band the solution then is to remove the spectroscopic lines of the standard stars by dividing their observed spectra (including atmospheric contribution) by the corresponding Kurucz ones normalised to unity (Kurucz, 1979). The Kurucz spectra were first rebinned to ISAAC resolution and modified by limb darkening and rotational broadening (see Gray, 2008) so that their Br10, Br11 and Br12 lines matched those in the observed spectra. We then checked the resulting feature-free standard star spectra to ensure no measurable residuals.
| SS1 | HS1 | HS2 | |||||||||||
| Feature | a | ||||||||||||
| H | 4342 | – | – | – | – | ||||||||
| \textN 3 | 4515 | 1.27 | -0.410.17 | 248159 | 0.560.21 | – | – | – | – | ||||
| \textHe 2 | 4542 | 1.28 | -0.420.20 | 949100 | 0.550.22 | – | – | – | – | ||||
| \textN 3 | 4640 | 0.69 | -3.120.33 | 116635 | 2.060.18 | 1.35 | -2.210.24 | 75417 | 3.020.12 | 1.06 | -1.210.20 | 70818 | 1.290.16 |
| \textHe 2 | 4686 | 0.69 | -4.450.53 | 53225 | 3.020.19 | 1.40 | -4.620.25 | 77023 | 6.410.36 | 1.10 | -2.450.25 | 56626 | 2.780.19 |
| ? | 4741 | – | – | – | – | ||||||||
| ? | 4801 | – | – | – | – | ||||||||
| H | 4861 | 0.68 | -2.850.70 | 49682 | 2.060.40 | 1.47 | -1.640.38 | 20686 | 2.370.35 | 1.22 | -0.790.24 | 25684 | 0.920.27 |
| H | 0.70 | 2.890.81 | 2400255 | 2.000.5 | 1.49 | 1.270.32 | 1662398 | 1.950.38 | 1.23 | 0.330.26 | 321140 | 0.480.30 | |
| \textHe 1 | 4922 | 1.51 | -0.450.12 | 27376 | 0.670.19 | ||||||||
| \textO 2 | 4942 | 1.51 | -0.540.18 | 91894 | 0.870.27 | ||||||||
| \textN 2 | 5005 | 1.57 | -0.830.35 | 455186 | 0.810.25 | – | – | – | – | ||||
| \textHe 1 | 5017 | – | – | – | – | ||||||||
| \textHe 2 | 5413 | 0.80 | -0.560.33 | 20284 | 0.480.17 | – | – | – | – | ||||
| \textHe 1 | 5876 | ||||||||||||
| ? | 6475 | – | – | – | – | ||||||||
| ? | 6505 | – | – | – | – | ||||||||
| H | 6563 | 0.82 | -8.120.47 | 42144 | 6.790.25 | 2.11 | -5.560.46 | 55030 | 12.010.35 | 1.96 | -4.530.31 | 70453 | 8.650.29 |
| \textHe 1 | 6678 | 0.82 | -1.270.23 | 44433 | 0.980.12 | 2.16 | -0.770.16 | 54136 | 1.770.16 | 2.01 | -0.690.13 | 70734 | 1.330.18 |
| \textHe 1 | 7065 | ||||||||||||
| \textHe 2 | 7280 | – | – | – | – | ||||||||
| Pa (39-3) | 8252 | ||||||||||||
| Pa (22-3) | 8359 | ||||||||||||
| Pa (18-3) | 8438 | ||||||||||||
| Pa (16-3) | 8502 | 0.72 | -1.300.39 | 47947 | 0.940.22 | 2.33 | -0.500.27 | 48175 | 1.130.41 | 2.18 | -0.300.16 | 519119 | 0.710.20 |
| Pa (15-3) | 8545 | 0.71 | -1.820.27 | 63650 | 1.330.19 | 2.31 | -0.650.16 | 51580 | 1.750.26 | 2.18 | -0.480.22 | 54182 | 1.450.37 |
| Pa (14-3) | 8598 | 0.70 | -2.210.29 | 62152 | 1.660.27 | 2.30 | -1.010.20 | 55943 | 2.430.37 | 2.18 | -0.880.21 | 54189 | 1.730.48 |
| Pa (13-3) | 8665 | 0.70 | -2.270.35 | 66282 | 1.740.23 | 2.32 | -1.190.19 | 63256 | 2.420.35 | 2.34 | -0.920.18 | 573108 | 1.700.31 |
| Pa (12-3) | 8750 | 0.69 | -2.300.41 | 60943 | 1.680.24 | 2.35 | -0.900.18 | 60193 | 2.120.38 | 2.34 | -0.640.23 | 59499 | 1.580.36 |
| Pa (11-3) | 8863 | 0.67 | -2.490.38 | 57653 | 1.830.22 | 2.34 | -0.880.21 | 61058 | 2.340.29 | 2.34 | -0.820.31 | 566124 | 1.730.37 |
| \textHe 2 | 8931 | – | – | – | – | – | – | – | – | ||||
| Pa (10-3) | 9015 | 0.62 | -2.800.45 | 64856 | 1.770.22 | 2.25 | -1.080.28 | 58884 | 2.410.45 | ||||
| Pa (9-3) | 9229 | 0.60 | -5.821.05 | 70387 | 3.670.70 | 2.27 | -2.440.48 | 70643 | 5.090.67 | ||||
| Pa | 12818 | 0.41 | -7.000.53 | 49084 | 3.000.25 | 2.51 | -4.910.51 | 89161 | 12.910.63 | 2.93 | -2.790.30 | 110543 | 8.260.42 |
| Br (19-4) | 15265 | ||||||||||||
| Br (18-4) | 15346 | 2.30 | -0.300.21 | 687116 | 1.030.38 | ||||||||
| Br (17-4) | 15443 | 0.28 | -2.420.26 | 34380 | 0.630.11 | 2.28 | -0.440.11 | 482111 | 1.320.26 | ||||
| Br (16-4) | 15561 | 0.27 | -3.480.25 | 36071 | 0.960.12 | 2.26 | -0.610.19 | 466103 | 1.330.20 | ||||
| Br (15-4) | 15705 | 0.27 | -3.910.32 | 413113 | 1.040.11 | 2.71 | -0.300.11 | 466224 | 1.070.33 | ||||
| \textHe 1 | 15859 | 0.26 | -1.700.71 | 646186 | 0.470.20 | 2.21 | -0.750.20 | 433118 | 2.020.35 | 2.65 | -0.800.23 | 508129 | 2.180.47 |
| Br (14-4) | 15885 | 0.26 | -4.960.55 | 70084 | 1.410.25 | 2.21 | -1.220.37 | 483108 | 2.330.47 | 2.65 | -0.600.19 | 677107 | 1.430.32 |
| Br (13-4) | 16114 | 0.25 | -7.000.53 | 55395 | 1.670.23 | 2.17 | -1.350.25 | 53486 | 2.650.31 | 2.59 | -0.390.12 | 47888 | 1.020.31 |
| \textHe 2 | 16246 | 0.25 | -2.280.51 | 49288 | 0.540.13 | – | – | – | – | ||||
| Br (12-4) | 16412 | 0.25 | -7.710.67 | 60072 | 2.000.21 | 2.14 | -0.490.11 | 247124 | 1.750.27 | – | – | – | – |
| Br (11-4) | 16811 | 0.23 | -7.860.72 | 62183 | 1.990.19 | 2.10 | -1.140.21 | 47685 | 2.730.28 | 2.41 | -0.620.18 | 52787 | 1.810.42 |
| \textHe 2 | 16923 | – | – | – | – | 2.09 | -1.120.32 | 426122 | 2.300.57 | 2.38 | -0.310.13 | 544122 | 0.740.21 |
| \textHe 1 | 17000 | 0.23 | -4.410.45 | 168166 | 0.960.16 | 2.09 | -0.600.22 | 472117 | 1.250.33 | 2.36 | -0.200.12 | 224162 | 0.500.19 |
| Br (10-4) | 17367 | 0.22 | -8.200.87 | 60679 | 2.510.30 | 2.06 | -1.500.46 | 48890 | 3.270.39 | 2.28 | -0.700.31 | 760109 | 2.530.41 |
| \textHe 1 | 20586 | 0.14 | -10.011.09 | 222125 | 1.360.34 | – | – | – | – | ||||
| \textHe 1 | 21126 | 0.13 | -6.851.12 | 574161 | 0.870.23 | – | – | – | – | – | – | – | – |
| Br | 21661 | 0.13 | -13.461.03 | 55357 | 1.710.23 | 1.72 | -1.420.23 | 220102 | 2.450.25 | 1.66 | -1.200.20 | 54754 | 1.790.25 |
aLaboratory wavelength (Å)
bContinuum flux (erg cm-2 s-1 Å-1)
cEquivalent widths (Å)
dFull-width at half-maximum (km s-1)
eLine flux (erg cm-2 s-1)
3 Spectral description
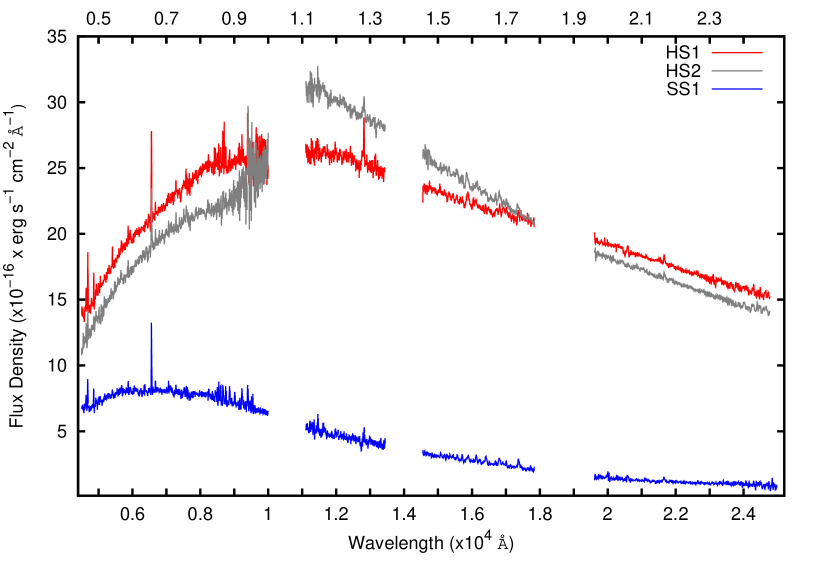
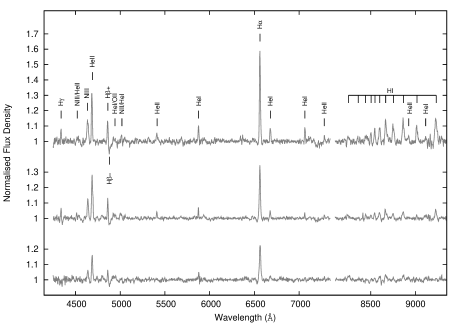
The resulting OIR flux-calibrated spectra are displayed in Figure 1, and the continuum-normalised ones in Figures 2 and 3. Likewise, Table 1 lists all the detected lines and their characteristics. The full-widths at half-maximum (FWHMs) were quadratically corrected for the instrumental broadening which we assessed from the arc spectra, and the underlying continuum was locally assessed with a first-order polynomial. The latter being the primary source of inaccuracy, each measurement was repeated several times with different continuum placements within the same wavelength range to obtain a set of values that eventually averaged out. The uncertainties listed in Table 1 are therefore the scatter to the mean rather than the real errors.
3.1 The optical spectrum
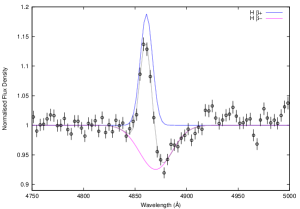
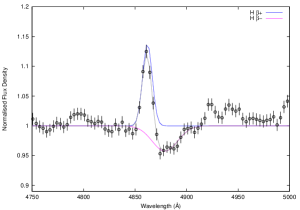
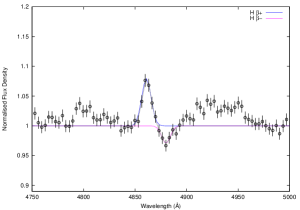
The optical spectrum is consistent with those reported in previous studies of GX 3394. During SS1, we detect H, H, H and the Paschen series, all in emission. There are also several signatures of \textHe 1, \textHe 2, \textO 2, \textN 2 and \textN 3 (including the Bowen Blend at 4640 Å) although many are too weak to be properly measured. The spectroscopic content in both HS are very similar to that during SS1 but many of the higher ionisation features are missing during HS2. Moreover, several unidentified lines are detected, and two very faint emission components shortwards of H appear to be present during SS1 and HS1. One is centered at about 6474 Å and has never been reported while the other, centered at 6505 Å, was explained as either \textN 2 (Soria et al., 1999) or a violet-displaced component of H attributed to a “jet feature” (Cowley et al., 2002). Given that we observe these lines in both the SS and HS, they likely originate either in the disc or the irradiated companion star. More importantly, we confirm the presence during SS1, HS1 and to a lesser extent HS2 of an absorption trough longwards of H; its presence was already mentioned in Buxton & Vennes (2003) but the authors did not conclude on its nature. This dip significantly contaminates H and gives the feature an inverse P-Cygni profile. Because of this, we fit the emission (labelled H+) and absorption (H-) components simultaneously with two Gaussians (see Figure 4), H+ being centered at 4861 Å and H- at 4872 Å, 4880 Å and 4881 Å during SS1, HS1 and HS2, respectively.
All the spectral lines are also variable from one observation to another. Compared to SS1, their intrinsic fluxes are higher during HS1 and similar or slightly lower during HS2, and their equivalent widths are a lot lower, a hint that the continuum in the HS is dominated by a component that does not significantly enhance line emission, likely the compact jet. Moreover, the resolution of our spectra is too low to enable a sufficient analysis of the profiles of most of the features, but Smith et al. (1999), Soria et al. (1999) and Wu et al. (2001) reported several double-peaked optical lines during the soft and quiescent states and only one, \textHe 2 , in the HS. In our case, one can argue that the Bowen blend during SS1, \textHe 2 during HS1 and the Paschen lines during all the observations are double-peaked. We do not see any significant FWHM difference in the HS compared with SS1 with the exception of the Bowen blend, H+ and H- which are narrower and H and \textHe 1 which are broader.
 |
 |
 |
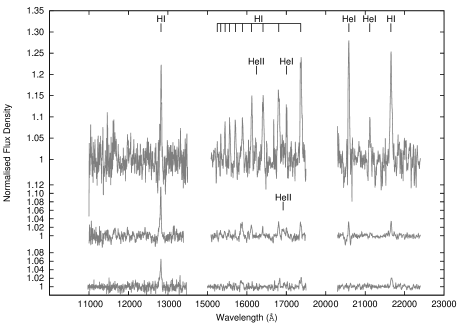
3.2 The near-IR spectrum
The near-IR spectrum of GX 3394 is very rich. During SS1, we detect emissions from (1) Pa in the -band, (2) the whole Brackett series (Br14 being likely blended with \textHe 1 ), \textHe 1 and \textHe 2 in the -band and (3) \textHe 1 , and Br in the -band. Moreover, Br10, Br11, Br13 and Br14 are likely double-peaked and this points towards the accretion disc as the main contributor to the spectroscopic content.
In the HS, most of the aforementioned lines are present. Compared with SS1 their fluxes are larger during HS1 and similar during HS2, with the exception of Pa which is significantly brighter in both HS. In agreement with what we observe in the optical, their equivalent widths are however a lot lower, confirming that the continuum is likely dominated by the compact jet. In the -band, Br10, Br11, Br13 and Br14 may also be double-peaked. In the -band, \textHe 1 is absent during HS2 but present as a strong emission in a relatively deep trough during HS1. Aside from Pa which is broader, there is no significant FWHM difference when compared with SS1.
4 Spectral analysis
The wealth of \textH 1 emission lines in the spectra of GX 3394 allows us to diagnose and compare the physical conditions of the source for each observation. For this purpose, we selected twelve of the most robustly measured optical and near-IR \textH 1 features detected in the three spectra (bold in Table 1) and discuss their behaviour in the subsequent sections.
4.1 The hydrogen decrements during SS1, HS1 and HS2
We list the H/H (Balmer), Pa()/Pa11 (Paschen) and Br()/Br10 (Brackett) decrements in Table 2; the fluxes were corrected for the ISM extinction using the law given in Fitzpatrick (1999) with .
| SS1 | HS1 | HS2 | |
|---|---|---|---|
| H/H | 0.980.21 | 1.500.15 | 2.520.56 |
| Pa/Pa11 | 0.850.12 | 3.000.41 | 2.540.43 |
| Pa12/Pa11 | 0.950.18 | 0.940.20 | 0.940.29 |
| Pa13/Pa11 | 1.000.18 | 1.090.21 | 1.030.29 |
| Pa14/Pa11 | 0.980.20 | 1.120.22 | 1.070.38 |
| Pa15/Pa11 | 0.970.16 | 0.820.15 | 0.920.31 |
| Br/Br10 | 0.590.10 | 0.590.10 | 0.630.14 |
| Br11/Br10 | 0.840.11 | 0.800.14 | 0.720.24 |
| Br14/Br10 | 0.560.13 | 0.810.18 | 0.590.17 |
The decrements are sensitive to the physical conditions of the plasma from which the lines arise, so that we can compare our measurements against expected theoretical values to obtain information on the temperature and/or density of the emitting regions. Relevant theory comparisons are given in Drake & Ulrich (1980) and Elitzur et al. (1983) for high ionising fluxes while Williams (1980) and Williams & Shipman (1988) provide information for optically thick and thin accretion discs in cataclysmic variables (CVs). Likewise, Storey & Hummer (1995) is an important source of line strength comparisons as the authors computed the decrements for the two cases defined in Baker & Menzel (1938) for low-density nebulae that are (a) transparent and (b) opaque to Lyman lines. Since degeneracies exist between the plasma temperature, density and optical thickness, we limit ourselves to a qualitative analysis. Moreover, our , and -band near-IR spectra are non-simultaneous. However, we showed in Paper I that although the continum was variable on short timescales in the HS, it averaged out in about 100-200 s so we will assume that the same is true for the spectroscopic features.
With that in mind, we see that the Balmer decrement is close to unity during SS1, significantly lower than that for a standard Case B low density nebula (i.e. 2.86, Osterbrock, 1989). This is similar to what is usually observed in CVs, an explanation being that the Balmer lines are optically thick to the continuum and that they arise from the dense accretion disc (Williams, 1980). This must be the case for GX 3394 since whatever the electron temperatures and optical depth we consider, only high densities () can explain the measured small decrement values (see Figures 12 and 6 in Drake & Ulrich, 1980; Williams & Shipman, 1988, respectively). In contrast, the Balmer decrement is higher in the HS (1.5 and 2.5 during HS1 and HS2, respectively), which points towards lower density and optically thin emitting regions.
The analysis of the Paschen decrements is more complex. Our measurements are not accurate enough to get any relevant information on the physical parameters of the emitting region. Indeed, Pa12/Pa11 to Pa15/Pa11 are weakly dependent on temperature and density, and a comparison with the data tabulated in Storey & Hummer (1995) does not give any relevant constraints on the physical conditions of the emitting plasma. Moreover, the Pa/Pa11 values are a lot lower than the ones calculated in Storey & Hummer (1995), likely because the high ionising flux of GX 3394 has greater impact on Pa than on the features with higher energy levels. Nevertheless, the decrements are flat and close to unity during SS1, which means that all the Paschen features are optically thick to the continuum. It is important to mention that this was already observed for Sco X-1 (Schachter et al., 1989), likely hinting at an accretion disc origin. During HS1 and HS2, Pa12/Pa11 to Pa15/Pa11 are still flat and close to unity but Pa/Pa11 clearly stands apart, being almost three times higher (2.5-3). Unlike what we observe in the SS, Pa is therefore optically thin in the HS, which can be due to a different emission mechanism and/or emitting region. Finally, the Brackett decrements give similar information. The measurements are not accurate enough for a comparison with theoretical values, but the decrements are flat at 1 and point towards optically thick lines in both the SS and HS and thus an accretion disc origin.
| HS1/SS1 | HS2/SS1 | |
|---|---|---|
| H | 1.150.26 | 0.540.18 |
| H | 1.790.07 | 1.270.06 |
| Pa15 | 1.320.27 | 1.090.32 |
| Pa14 | 1.360.33 | 1.040.34 |
| Pa13 | 1.390.27 | 0.980.22 |
| Pa12 | 1.260.29 | 0.940.25 |
| Pa11 | 1.280.22 | 0.920.23 |
| Pa | 4.300.42 | 2.750.27 |
| Br14 | 1.370.46 | 1.010.29 |
| Br11 | 1.370.19 | 0.910.23 |
| Br10 | 1.360.23 | 1.050.22 |
| Br | 1.430.25 | 1.050.21 |
4.2 Flux variations between SS1, HS1 and HS2
Table 3 compares the average flux ratios of the selected \textH 1 features for our three observations. The same pattern is observed for all the Brackett and Paschen series, with the exception of Pa; during HS1, these lines are roughly (30-40)% brighter than during the SS1 and HS2 observations (which are similar). Since the emissivity of a given line mainly depends on its optical depth, the ionisation parameter of the emitting plasma, the covering factor and the inclination, our finding is consistent with all the Paschen (with the exception of Pa) and Brackett features originating from the same component during the three observations. This is in agreement with the conclusion drawn from the decrements analysis.
The conclusion is different for the Balmer lines. Indeed, H is fainter and H brighter than expected in the HS, especially during HS2. We acknowledge that the uncertainties of our measurements prevent us from making any definitive statement, but if true, these discrepancies are consistent with the larger Balmer decrements measured during HS1 and HS2. Moreover, we note that H and H FWHMs are respectively smaller and larger in the HS, confirming a different and/or additional formation mechanism of the Balmer lines in the HS. The same conclusion can be drawn with more certainty for Pa, which exhibits a clear flux excess and is a lot broader in the HS.
 |
 |
 |
 |
5 Discussion
In the OIR domain, double-peaked emission lines thought to arise from a temperature-inversion layer created by the soft X-ray irradiation of the chromosphere (see e.g. Jameson et al., 1980; Horne & Marsh, 1986; Wu et al., 2001) have long been associated with microquasar accretion discs. Based on our observed flat decrements, Keplerian FWHMs, homogeneous flux variation patterns and, to a lesser extent, double-peaked profiles, an irradiated accretion disc is the likely origin for all the \textH 1 lines we observe. Those for which this is not the case are discussed subsequently.
5.1 Origin of the H absorption trough
Of primary interest is the presence of H-. A straightforward explanation is that it is associated with the 4882 Å diffuse interstellar band (DIB, see Herbig, 1995, for a review) and this may indeed be the case during HS2, as the trough is barely detected. DIBs however are expected to be narrow and to have a constant equivalent width111As for the DIBs we unambiguously detect, like the doublet centered at 5780 Å ( Å, Å and Å for SS1, HS1 and HS2, respectively), NaD at 5890 Å ( Å, Å and Å) or the DIB located at 6284 Å ( Å, Å and Å)., yet the FWHMs of H- during SS1 and HS1 are clearly consistent with a strong rotational broadening and its equivalent width varies between these two observations. We therefore argue that during SS1 and HS1, H- is mainly an absorption signature of H that stems from a region closer to the black hole, with a weak contribution of the 4882 Å DIB. In constrast, the weak absorption detected during HS2 is not associated with GX 3394 but only with the 4882 Å DIB; in other words, the H absorption line detected during SS1 and HS1 is absent during HS2. Balmer line absorption troughs can form in optically thick accretion discs with a vertical temperature decreasing with height above the central plane (La Dous, 1989). We note that such troughs are common in dwarf novae and this is the reason why we favour an accretion disc origin for H-. This hypothesis was also preferred to explain the presence of such broad H absorptions in other outbursting microquasars like GRO J0422+32 (Callanan et al., 1995), GRO J1655-50 (Bianchini et al., 1997; Soria et al., 2000) or XTE J1118+480 (Dubus et al., 2001). For our case, H- may be slightly red-shifted and we refer the interested reader to Callanan et al. (1995) and Dubus et al. (2001) for a discussion of possible explanations for the red-shift, which include relativistic effects or superhump-induced distortions.
5.2 An irradiation-induced envelope in the HS
A comprehensive modelling of the conditions for Balmer absorption line formation in black hole X-ray binaries was presented in Sakhibullin et al. (1998). As stated in the previous section, H- is strong during SS1 and HS1 but absent during HS2. Of relevance to our findings, the Balmer absorption lines are more prominent when at least one of the following conditions is fulfilled: (1) the X-ray emission is harder, (2) the degree of self-illumination (i.e. fraction of reprocessed X-rays) is lower, or (3) the accretion rate is lower. (1) The 3–50 keV RXTE spectrum of GX 3394 is however as hard during HS1 as HS2, with a 6–50 keV to 3–6 keV PCA hardness ratio of about 1.45 and 1.47 during HS1 and HS2, respectively (see Paper I); we can therefore exclude the hardness of the X-ray emission as responsible for the disappearance of H- during HS2. (2) The same conclusion can be drawn for X-ray irradiation, the lower optical continuum during HS2 hinting towards a lower level of X ray reprocessing, which should be more favourable to absorption line formation. (3) Finally, it is very unlikely that the accretion rate during HS2 (1.2-3 keV ASM/flux of about 2 counts cm-2 s-1) is higher than during SS1 (1.2-3 keV ASM/flux of about 27 counts cm-2 s-1). The disappearance of H- during HS2 must therefore stem from another mechanism and the Pa properties in the HS are key to understanding this behaviour.
| HS1 | HS2 | ||||||
|---|---|---|---|---|---|---|---|
| a | |||||||
| 12815 | 2292510 | 3.320.91 | 8.721.25 | 12809 | 1735486 | 2.000.56 | 6.001.13 |
| 12818 | 515231 | 1.740.91 | 4.400.80 | 12819 | 502256 | 0.890.41 | 2.510.54 |
aDerived wavelength (Å)
bFull-width at half-maximum (km s-1)
cEquivalent width (Å)
dLine flux (erg cm-2 s-1)
 |
 |
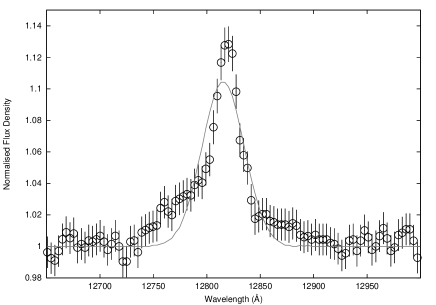
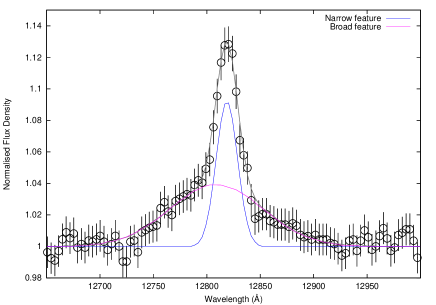
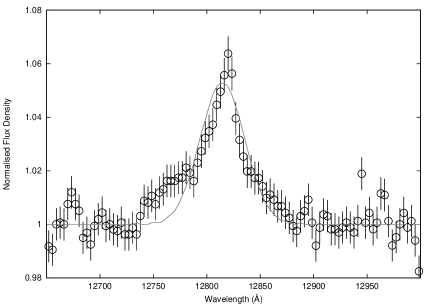
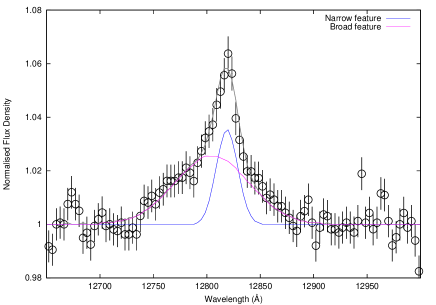
Indeed, compared to the other near-IR \textH 1 emission features, Pa exhibits a strong flux excess and is twice broader in the HS compared to the SS. It is is thus reasonable to assume that several components contribute to the emission. To test this hypothesis, we fitted the HS1 and HS2 Pa profiles with two Gaussians (see Figure 5 for a comparison with the one Gaussian case). We performed Fisher’s tests to assess the need of a second Gaussian (degree of freedom of 350 for the two-Gaussian case vs 353 for the one-Gaussian case) and obtained and chance probabilities for HS1 and HS2, respectively. The need for two Gaussians is therefore statistically justified and Pa is better described by the combination of a narrow feature likely coming from the outer accretion disc and a broad one, hereafter Pa, arising from another region (their derived parameters for both HS1 and HS2 are listed in Table 4). Assuming that the broadening of Pa is mainly due to rotation, the typical distance to the black hole of the region that contributes the most to the emission can be inferred from its FWHM. Indeed, we have , where is the Keplerian velocity and the Schwarzschild radius. We find km s-1 and km s-1 as well as and during HS1 and HS2, respectively ( being the system inclination). Using the orbital parameters derived in Hynes et al. (2003), i.e. the mass function , the companion star to black hole mass ratio and the orbital period days, we estimate , and , where is the orbital radius, is the circularisation radius and is the tidal radius (see Frank et al., 2002, for the expression in function of ). Because the outer radius of the accretion disc is larger than and smaller than , we have . The inclination of the system is unclear, but the most recent measurement points towards (Shidatsu et al., 2011), which results in as well as and during HS1 and HS2, respectively.
The fact that we still detect narrow emission lines in the HS1 and HS2
near-IR spectra of GX 3394 means that the optically thick and
geometrically thin outer disc is still present, whereas Pa arises from an extended region that covers a
significant fraction of the inner accretion disc. While such a
configuration is similar to truncated discs/hot
inner flow geometries thought to be ubiquitous in the HS
(e.g. advection-dominated accretion flows or
ADAF, Narayan & Yi, 1995), is too large to be consistent with
the transition radii between the optically thin and thick regions
derived in these models. For instance, such high radii are predicted
for ADAFs with very low accretion rates
, typical of quiescent
states. Likewise, we were able to model the Swift/XRT+RXTE/PCA
spectrum of GX 3394 during HS1 with an accretion disc model extending
close to the black hole and we found for , kpc and a 10 black hole
mass. We thus rather propose that in the HS only, the hard X-ray
emission irradiates the chromosphere of the accretion disc which
eventually puffs up into a geometrically thick envelope that can
enshroud the region of the accretion disc from which H- originates. We estimate that the typical distance to the
black hole of the region that contributes the most to H- during HS1 is about , to
be compared to a typical radial extension of the envelope of
and during HS1 and HS2, respectively. Two scenarios are thus
possible to explain the H- detection during HS1 and
its disappearance during HS2, but the accuracy of our measurements
prevents us to disentangle between them:
(1) the envelope is optically thick during the two HS. H- is therefore undetected during HS2 because the envelope
inflates and enshrouds the region that contributes the most to the
feature,
(2) the envelope enshrouds the H- region during the
two HS. H- is then detected during HS1 because
the envelope is optically thin, while it becomes optically thick
during HS2.
Finally, it is likely that a significant fraction of H comes from this envelope, which would then be optically thick to the Balmer series (Case C recombination, Xu et al., 1992). Indeed, each H and higher Balmer lines would in this case be split into H plus some near-IR recombination features such as HH+Pa, HH+Pa, etc. (See Soria et al., 2000, for a similar statement in the case of GRO J1655-40). This would be in agreement with the brighter H, fainter H+ and larger Balmer decrements encountered in our HS observations, especially during HS2.
5.3 A thermal accretion disc wind in the HS?
We showed in Paper I that the near-IR continuum was variable at 20 s timescales during HS1 and HS2 but constant during SS1. It is therefore relevant to investigate the Pa variability with respect to that of the continuum, but S/Ns are too low for us to evaluate it on 20 s timescales. Instead, we combined the individual -band spectra in groups of four by decreasing continuum level, measured the Pa flux in each of the three resultant 80 s spectra and plotted them as a function of the underlying continuum level (see Figure 6). It is clear that Pa is constant during HS1 and correlated with the continuum during HS2. We followed the same procedure for Pa during SS1 and Br during the three observations and find the intrinsic fluxes to be constant at 1, a hint that the emission lines coming from the accretion disc are constant. Thus, to understand if Pa was indeed responsible for the flux variations during HS2, we combined the twelve 20 s -band spectra into two 120 s sub-spectra either with a high or a low continuum level and we measured the respective contributions of the narrow and broad Pa components in each of them. For the high continuum level spectrum, we find that Pa can be well-described by a erg cm-2 s-1 narrow feature and a erg cm-2 s-1 broad one. In constrast, the same fit for the low continuum level spectrum gives erg cm-2 s-1 for the narrow feature and erg cm-2 s-1 for the broad one. Although not conclusive, these measurements point towards the broad component being responsible for the Pa variations. If this is indeed the case, Pa must be optically thick to the variable continuum during HS2, which either implies (1) a change of the intrinsic properties of the envelope which becomes optically thick to the compact jet emission, the latter being responsible for the continuum variations or (2) the near-IR continuum during HS2 is dominated by the envelope and not the compact jets. Unfortunately, we cannot disentangle between these scenarios, but both explanations could account for the peculiar shape of the GX 3394 spectrum during HS2 (see Figure 1 in the present paper and Figure 5 in Paper I) and might be consistent with the presence of a thermally-driven accretion disc wind (ADW) during HS2.
Indeed, the presence of a geometrically thick envelope in the HS is consistent with what was proposed in Begelman et al. (1983) to describe the conditions necessary to form thermally-driven ADWs. Moreover, the presence of ADWs in the HS of GX 3394 has already been proposed to explain the flat-topped or round-topped profiles of the Balmer emission lines detected through high-resolution optical spectroscopy (Wu et al., 2001). So, can the GX 3394 envelope really launch such thermal ADWs in the HS? According to Begelman et al. (1983), this is possible for a launching radius where
| (1) |
is the Compton radius and
| (2) |
is the Compton temperature (see also Rahoui et al., 2010, for a discussion in the case of GRS 1915+105). This thermal ADW must moreover overcome gravity, which can be achieved if the luminosity of the irradiating source is about twice larger than the critical luminosity defined as
| (3) |
Based on the modelling of the Swift/XRT+RXTE/PCA spectra of GX 3394 during HS1, we estimate K, , and
. We stress that these
calculations are model-dependent beyond 100 keV, where the slope
differs depending on whether the hard X-ray emission is modelled with
a power law, a cut-off power law or a Comptonisation component; this
is the reason why we integrated the spectrum between 0.1 and 100 keV
only. Furthermore, the lack of Swift/XRT data prevents us for better
modelling the 0.1-100 keV emission of GX 3394 during HS2, but we consider
that the , and
measurements for HS1 are also valid for HS2 due to the similarity of
the hard X-ray emission in both HS. That said, the conditions could be
met for a thermal ADW to arise during HS1 and HS2 if the geometrically
thick envelope is larger than . We previously estimated that the size of
the envelope is about during HS1
and during HS2. Although possible in
both HS within uncertainties, it is thus clear that the conditions are
more favourable for a thermal ADW to be launched during HS2.
Interestingly, the conditions for a thermal ADW in the SS of GX 3394 are not met. Indeed, we do not detect any spectral signature for an geometrically thick envelope in the OIR spectrum during SS1, which means that it is likely absent in the SS. Yet, the calculations for the conditions needed for a thermal ADW during SS1 result in , i.e. a launching radius about seven times larger than in the HS. Thus, if these calculations are correct, it is impossible for a thermal ADW to arise during SS1. As such, another mechanism must be responsable for the formation of the ADW in the SS of GX 3394, plausibly magnetic driving (see Miller et al., 2008, for the case of GRO J165540).
6 Conclusion
The OIR spectra of GX 3394 in the two HS have different properties, and we showed that during HS2, (1) a near-IR continuum excess is present, (2) the H absorption component is absent, (3) the H/H decrement is larger than that during HS1 and (4) Pa is variable and correlated with the underlying continuum. Although speculative, it is tempting to associate these differences with the presence of a thermal ADW launched by the geometrically thick envelope during HS2. Without definitive detections of “typical wind signatures” such as blue-shifted emission lines or P-cygni profiles – which would require higher spectral resolutions – we cannot ascertain the aforementioned statement. We can nonetheless speculate on the implications this scenario could have for our understanding of accretion/ejection processes in GX 3394. From a soft X-ray prospective, we know that an anti-correlation is observed between compact jets in the HS and blue-shifted absorption lines of ionised H-like species in the SS, considered as disc wind signatures. This led some authors to speculate that both outflow types compete for the same matter supply (see e.g. Neilsen & Lee, 2009; Ponti et al., 2012). However, the possible presence of a thermal ADW in the HS and a magnetic ADW in the SS may rather imply a three-player game and complicate the situation (see Neilsen & Homan, 2012, for the case of GRO J165540). For instance, if the compact jets are highly-collimated and accelerated magnetic ADWs (Blandford & Payne, 1982; Pudritz & Norman, 1983), the question then is whether a thermal ADW arising in the HS because of hard X-ray irradiation can significantly impact the configuration of a large scale magnetic field to decrease the degree of collimation through angular momentum losses. These considerations are obviously premature and a first step before proceeding further is to confirm the presence of thermal ADWs in the HS of microquasars. In that respect, optical and near-IR high-resolution spectroscopy could be a good alternative to the soft X-ray domain and we recommend further OIR HS observations of outbursting microquasars with instruments such as ESO/X-shooter or Magellan/FIRE to further explore this point.
Acknowledgments
We thank the anonymous referee for his/her very constructive review, which significantly improved this paper. FR thanks the ESO staff who performed the service observations. JCL thanks the Harvard Faculty of Arts and Sciences and the Harvard College Observatory. This research has made use of data obtained from the High Energy Astrophysics Science Archive Research Center (HEASARC), provided by NASA’s Goddard Space Flight Center. This research has made use of NASA’s Astrophysics Data System, of the SIMBAD, and VizieR databases operated at CDS, Strasbourg, France.
References
- Baker & Menzel (1938) Baker J. G., Menzel D. H., 1938, ApJ, 88, 52
- Bandyopadhyay et al. (1997) Bandyopadhyay R., Shahbaz T., Charles P. A., van Kerkwijk M. H., Naylor T., 1997, MNRAS, 285, 718
- Begelman et al. (1983) Begelman M. C., McKee C. F., Shields G. A., 1983, ApJ, 271, 70
- Bianchini et al. (1997) Bianchini A., della Valle M., Masetti N., Margoni R., 1997, A&A, 321, 477
- Blandford & Payne (1982) Blandford R. D., Payne D. G., 1982, MNRAS, 199, 883
- Buxton & Vennes (2003) Buxton M., Vennes S., 2003, MNRAS, 342, 105
- Callanan et al. (1995) Callanan P. J. et al., 1995, ApJ, 441, 786
- Cowley et al. (2002) Cowley A. P., Schmidtke P. C., Hutchings J. B., Crampton D., 2002, AJ, 123, 1741
- Drake & Ulrich (1980) Drake S. A., Ulrich R. K., 1980, ApJS, 42, 351
- Dubus et al. (2001) Dubus G., Kim R. S. J., Menou K., Szkody P., Bowen D. V., 2001, ApJ, 553, 307
- Elitzur et al. (1983) Elitzur M., Ferland G. J., Mathews S. G., Shields G. A., 1983, ApJL, 272, L55
- Fitzpatrick (1999) Fitzpatrick E. L., 1999, PASP, 111, 63
- Frank et al. (2002) Frank J., King A., Raine D. J., 2002, Accretion Power in Astrophysics. Cambridge University Press
- Gandhi et al. (2011) Gandhi P. et al., 2011, ApJL, 740, L13+
- Gray (2008) Gray D. F., 2008, The Observation and Analysis of Stellar Photospheres. Cambridge University Press
- Herbig (1995) Herbig G. H., 1995, ARA&A, 33, 19
- Horne & Marsh (1986) Horne K., Marsh T. R., 1986, MNRAS, 218, 761
- Hynes et al. (2003) Hynes R. I., Steeghs D., Casares J., Charles P. A., O’Brien K., 2003, ApJL, 583, L95
- Hynes et al. (2004) Hynes R. I., Steeghs D., Casares J., Charles P. A., O’Brien K., 2004, ApJ, 609, 317
- Jameson et al. (1980) Jameson R. F., King A. R., Sherrington M. R., 1980, MNRAS, 191, 559
- Kurucz (1979) Kurucz R. L., 1979, ApJS, 40, 1
- La Dous (1989) La Dous C., 1989, A&A, 211, 131
- Makishima et al. (1986) Makishima K., Maejima Y., Mitsuda K., Bradt H. V., Remillard R. A., Tuohy I. R., Hoshi R., Nakagawa M., 1986, ApJ, 308, 635
- Markoff et al. (2005) Markoff S., Nowak M. A., Wilms J., 2005, ApJ, 635, 1203
- Meyer et al. (1998) Meyer M. R., Edwards S., Hinkle K. H., Strom S. E., 1998, ApJ, 508, 397
- Miller et al. (2008) Miller J. M., Raymond J., Reynolds C. S., Fabian A. C., Kallman T. R., Homan J., 2008, ApJ, 680, 1359
- Narayan & Yi (1995) Narayan R., Yi I., 1995, ApJ, 452, 710
- Neilsen & Homan (2012) Neilsen J., Homan J., 2012, ApJ, 750, 27
- Neilsen & Lee (2009) Neilsen J., Lee J. C., 2009, Nature, 458, 481
- Osterbrock (1989) Osterbrock D. E., 1989, Astrophysics of gaseous nebulae and active galactic nuclei. University Science Books
- Pe’er & Casella (2009) Pe’er A., Casella P., 2009, ApJ, 699, 1919
- Ponti et al. (2012) Ponti G., Fender R. P., Begelman M. C., Dunn R. J. H., Neilsen J., Coriat M., 2012, MNRAS, 422, L11
- Pudritz & Norman (1983) Pudritz R. E., Norman C. A., 1983, ApJ, 274, 677
- Rahoui et al. (2010) Rahoui F., Chaty S., Rodriguez J., Fuchs Y., Mirabel I. F., Pooley G. G., 2010, ApJ, 715, 1191
- Rahoui et al. (2012) Rahoui F. et al., 2012, MNRAS, 422, 2202
- Sakhibullin et al. (1998) Sakhibullin N. A., Suleimanov V. F., Shimanskii V. V., Suleimanova S. L., 1998, Astronomy Letters, 24, 22
- Schachter et al. (1989) Schachter J., Filippenko A. V., Kahn S. M., 1989, ApJ, 340, 1049
- Shahbaz et al. (2001) Shahbaz T., Fender R., Charles P. A., 2001, A&A, 376, L17
- Shidatsu et al. (2011) Shidatsu M. et al., 2011, PASJ, 63, 785
- Smith et al. (1999) Smith I. A., Filippenko A. V., Leonard D. C., 1999, ApJ, 519, 779
- Soria et al. (2000) Soria R., Wu K., Hunstead R. W., 2000, ApJ, 539, 445
- Soria et al. (1999) Soria R., Wu K., Johnston H. M., 1999, MNRAS, 310, 71
- Storey & Hummer (1995) Storey P. J., Hummer D. G., 1995, MNRAS, 272, 41
- Veledina et al. (2011) Veledina A., Poutanen J., Vurm I., 2011, ApJL, 737, L17+
- Wallace & Hinkle (1997) Wallace L., Hinkle K., 1997, ApJS, 111, 445
- Wallace et al. (2000) Wallace L., Meyer M. R., Hinkle K., Edwards S., 2000, ApJ, 535, 325
- Williams & Shipman (1988) Williams G. A., Shipman H. L., 1988, ApJ, 326, 738
- Williams (1980) Williams R. E., 1980, ApJ, 235, 939
- Wu et al. (2001) Wu K., Soria R., Hunstead R. W., Johnston H. M., 2001, MNRAS, 320, 177
- Xu et al. (1992) Xu Y., McCray R., Oliva E., Randich S., 1992, ApJ, 386, 181