*.pdf,.PDF
Pathways for virus assembly around nucleic acids
I Abstract
Understanding the pathways by which viral capsid proteins assemble around their genomes could identify key intermediates as potential drug targets. In this work we use computer simulations to characterize assembly over a wide range of capsid protein-protein interaction strengths and solution ionic strengths. We find that assembly pathways can be categorized into two classes, in which intermediates are either predominantly ordered or disordered. Our results suggest that estimating the protein-protein and the protein-genome binding affinities may be sufficient to predict which pathway occurs. Furthermore, the calculated phase diagrams suggest that knowledge of the dominant assembly pathway and its relationship to control parameters could identify optimal strategies to thwart or redirect assembly to block infection. Finally, analysis of simulation trajectories suggests that the two classes of assembly pathways can be distinguished in single molecule fluorescence correlation spectroscopy or bulk time resolved small angle x-ray scattering experiments.
II Introduction
In many virus families, the spontaneous assembly of a protein shell (capsid) around the viral genome is an essential step in the viral life cycle Hagan2014 . These families include most viruses with single stranded RNA (ssRNA) genomes, as well as the Hepadnaviridae (e.g. hepatitis B virus, HBV). Understanding the mechanisms which underlie this cooperative assembly process could facilitate efforts to develop anti-viral drugs that block or derail the formation of infectious particles (for reviews see Zlotnick2011 ; Prevelige2011 ) and promote efforts to reengineer them for biomedical delivery. In this article, we explore how the interactions between the molecular components determine the mechanism of assembly, and how these interactions can be altered by changing solution conditions or mutagenesis to modulate assembly pathways.
The most detailed knowledge of capsid-RNA interactions comes from structural analysis of assembled viral particles. Atomic resolution structures of capsids assembled around ssRNA have been obtained by x-ray crystallography and/or cryo-electron microscopy (cryo-EM) (e.g. Fox1994 ; Valegard1997 ; Johnson2004 ; Tihova2004 ; Krol1999 ; Stockley2007 ; Toropova2008 ; Lucas2002 ; Valegard1994 ; Worm1998 ; Grahn2001 ; Valegard1997 ; Helgstrand2002 ; Schneemann2006 ). The packaged NAs are less ordered than their protein containers and thus have been more difficult to characterize. However cryo-EM experiments have identified that the nucleotide densities are nonuniform, with a peak near the inner capsid surface and relatively low densities in the interiorTihova2004 ; Zlotnick1997 ; Conway1999 . While atomistic detail has not been possible in these experiments, all-atom models have been derived from equilibrium simulations Freddolino2006 ; Devkota2009 ; Zeng2012 . In some cases, striking image reconstructions reveal that the packaged RNA adopts the symmetry of the overlying capsid (e.g. Tihova2004 ; Toropova2008 ; Schneemann2006 ; Bakker2012 ; Ford2013 ). While it has been proposed that this order arises as a function of the assembly mechanism for several viruses Larson2001 ; Dykeman2011 ; Dykeman2013 , computational analysis of polyelectrolyte configurations inside capsids also indicate that capsid-polymer interactions can generically drive spatial organization of the packaged polymer Siber2008 ; Hu2008c ; Devkota2009 ; Forrey2009 ; Harvey2009 ; Belyi2006 ; Angelescu2006 ; Zhang2004a ; Lee2008 ; Angelescu2008 ; Jiang2009 ; Elrad2010 ; Perlmutter2013 . Theoretical works have also characterized the relationship between the NA charge and structure and the length which is optimal for packaging Perlmutter2013 ; Schoot2013 ; Hu2008a ; Belyi2006 ; Schoot2005 ; Angelescu2006 ; Siber2008 ; Ting2011 ; Ni2012 ; Siber2010 ; Siber2012 .
In addition to this structural data on assembled capsids, an extensive combination of mass spectrometry, assembly kinetics experiments, constraints from assembled capsid structures, and mathematical modeling has delineated assembly pathways for several viruses, with a particular focus on the role of interactions between CPs and specific RNA sequences called packaging signals. Recent single molecule fluorescence correlation spectroscopy (smFCS) experiments indicate that, for these viruses, assembly around the viral genome is more robust and proceeds by a different mechanism as compared to around heterologous RNA Borodavka2012 . Yet, in other cases capsid proteins show no preference for genomic RNA over heterologous RNA (e.g. HBV Porterfield2010 ), and cowpea chlorotic mottle virus (CCMV) proteins preferentially encapsidate heterologous RNA (from BMV) over the genomic CCMV RNA with equivalent length Comas-Garcia2012 . Furthermore, experimental model systems in which capsid proteins assemble into icosahedral capsids around synthetic polyelectrolytes or other polyanions Hiebert1968 ; Bancroft1969 ; Dixit2006 ; Loo2006 ; Goicochea2007 ; Huang2007 ; Loo2007 ; Sikkema2007 ; Sun2007 ; Hu2008 ; Comellas-Aragones2009 ; Crist2009 ; Chang2008 ) demonstrate that specific RNA sequences are not required for capsid formation or cargo packaging. Thus, a complete picture of capsid assembly mechanisms requires understanding how assembly pathways depend on those features which are generic to polyelectrolytes, as well as those which are specific to viral RNAs.
In previous work on assembly around a simple model for a polymer, Elrad and Hagan Elrad2010 proposed that mechanisms for assembly around a cargo (i.e. RNA, polymer, or nanoparticle) can be classified on the basis of two extreme limits. In the first (originally proposed by McPherson McPherson2005 and then Refs Hagan2008 ; Devkota2009 ), strong protein-cargo interactions drive proteins to adsorb ‘en masse’ onto the cargo in a disordered manner, meaning there are few protein-protein interactions. Once enough subunits are bound, subunits undergo cooperative rearrangements (potentially including dissociation of excess subunits) to form an ordered capsid. This mechanism has been observed in recent simulations Mahalik2012 ; Perlmutter2013 ; Elrad2010 ; Hagan2008 ; Perkett2014 . In the second limit, where protein-protein interactions dominate, a small partial capsid nucleates on the cargo, followed by a growth phase in which individual proteins or small oligomers sequentially add to the growing capsid. This class of pathways resembles the nucleation-and-growth mechanism by which empty capsids assemble Endres2002 , except that the polymer plays an active role by stabilizing protein-protein interactions and by enhancing the flux of proteins to the assembling capsid Hu2007 ; Kivenson2010 ; Elrad2010 .
It is difficult to determine assembly mechanisms directly from experiments, due to the small size ( of nm) and transience (ms) of most intermediates. Observations in vitro suggest that both mechanisms may be viable. Kler et al. Kler2012 used time-resolved X-ray scattering (trSAXS) to monitor SV40 capsid proteins assembling around ssRNA. The scattering profiles at all time points during assembly could be decomposed into unassembled components (RNA + protein subunits) and complete capsid; the absence of any signal corresponding to a large disordered intermediate suggests this assembly follows the nucleation-and-growth (ordered) assembly mechanism Kler2012 . Other observations suggest that viruses can assemble through the en masse mechanism. Refs. Garmann2013 ; Cadena-Nava2012 found that in vitro assembly CCMV assembly was most productive when performed in two steps: (1) at low salt (strong protein-RNA interactions) and neutral pH (weak protein-protein interactions) the proteins undergo extensive adsorption onto RNA, then (2) pH is reduced to activate binding of protein-protein binding Garmann2013 . Similarly, a recent observation of capsid protein assembly around charge-functionalized nanoparticles found that assembly initially proceeded through nonspecific aggregation of proteins and nanoparticles, followed by the gradual extrusion of nanoparticles within completed capsids Malyutin2013 . These experiments used viral proteins with relatively weak protein-protein interactions (CCMV and BMV) Zlotnick2013 and moderate salt concentrations (mM). The Kler et al. Kler2012 ; Kler2013 experiments considered SV40 proteins, which have strong protein-protein interactions Zlotnick2013 , and high salt (mM) Together, these in vitro experiments suggest that productive assembly could proceed by either the en masse or nucleation-and-growth mechanism.
In this work, we use dynamical simulations to investigate the extent to which the assembly mechanism can be controlled by tuning solution ionic strength and protein-protein attractions. We extend a model that was recently used to calculate the thermostability and assembly yields of viral particles as a function of protein charge and nucleic acid (NA) length and structure. Those previous simulations found quantitative agreement between predicted NA lengths that optimize capsid thermostability and viral genome length for seven viruses Perlmutter2013 . Here, we perform extensive new simulations of assembly, in which protein-protein interactions, the sequence of charges in capsid protein-NA binding domains, and the solution ionic strength are varied. We find that, by varying these control parameters, the assembly mechanism can be systematically varied between the two extreme limits described above. Our results suggest that knowledge of protein-protein and protein-NA binding affinities may be sufficient to predict which assembly mechanism will occur, and we estimate relative protein-NA binding interactions for three viruses (based on non-specific electrostatic interactions). These findings suggest that assembly mechanisms can be rationally designed through choice of solution conditions and mutagenesis of capsid protein-protein interfaces and protein-NA binding domains. Finally, by calculating hydrodynamic radii and SAXS profiles associated with assembly intermediates, we show that assembly mechanisms can be distinguished by experimental techniques recently applied to virus assembly, respectively smFCS Borodavka2012 ) and trSAXS Kler2012 . While the NA is represented by a linear polyelectrolyte in most of the simulations, we obtain qualitatively similar results when considering a model for base-paired NAs developed in Ref. Perlmutter2013 .
III Results
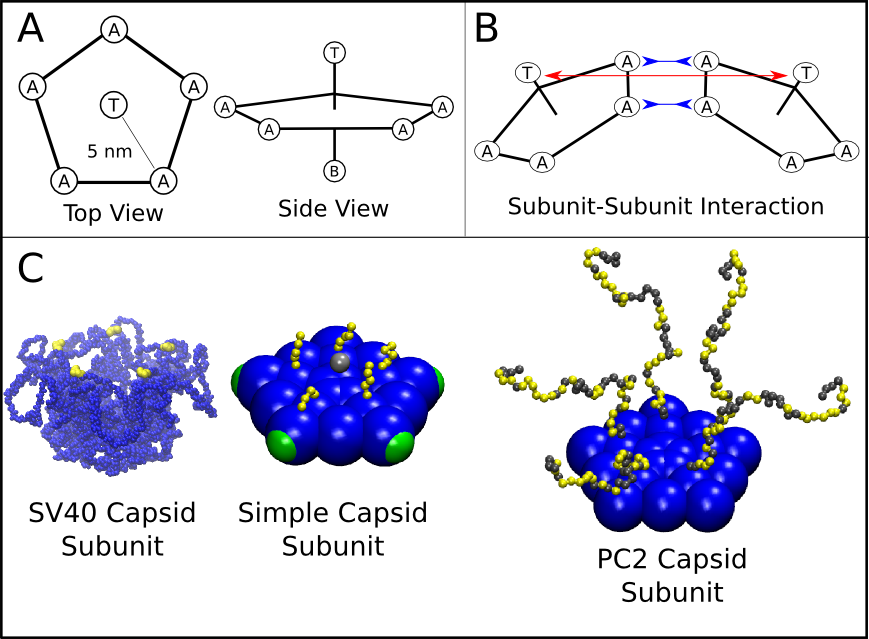
To study how capsid assembly around a polyelectrolyte depends on the strength of protein subunit-subunit and subunit-polyelectrolyte interactions, we performed Brownian dynamics simulations with a recently developed model Perlmutter2013 (Figure 1). This model was motivated by the observation Kler2012 ; Kler2013 that purified simian virus 40 (SV40) capsid proteins assemble around ssRNA molecules to form capsids composed of 12 homopentamer subunits. The capsid is modeled as a dodecahedron composed of 12 pentagonal subunits (each of which represents a rapidly forming and stable pentameric intermediate, which then more slowly assembles into the complete capsid, as is the case for SV40 in vitro around ssRNA Li2002 ; Kler2012 ; Kler2013 ). Subunits are attracted to each other via attractive pseudoatoms at the vertices (type ‘A’) and driven toward a preferred subunit-subunit angle by repulsive ‘Top’ pseudoatoms (type ‘T’) and ‘Bottom’ pseudoatoms (type ‘B’) (see Fig. 1 and the Methods section). These attractions represent the interactions between capsid protein subunits that arise from hydrophobic, van der Waals, and electrostatic interactions as well as hydrogen bonding Hagan2014 ). The magnitude of these interactions varies between viral species Zlotnick2013 and can be experimentally tuned by pH and salt concentration Ceres2002 ; Kegel2004 ; Hagan2014 . Here, the attraction strength is controlled by the model parameter . In order to relate this potential energy to the free energy of dimerization, we have run a separate series of calculations, where in the absence of cargo, we find that the free energy of subunit of dimerization is (see SI section 28). Throughout this article energies are given in units of the thermal energy, .
Capsid assembly around nucleic acids and other polyelectrolytes is primarily driven by electrostatic interactions between negative charges on the encapsulated polyelectrolyte and positive charges on the inner surfaces of capsid proteins Hagan2014 . We consider a linear bead-spring polyelectrolyte, with a charge of per bead and a persistence length comparable to that of ssRNA in the absence of base pairing. Positive charges on capsid proteins are located in flexible polymers affixed to the inner surface of the model subunit, which represent the highly charged, flexible terminal tails known as arginine rich motifs that are typical of positive-sense ssRNA virus capsid proteins (e.g., Schneemann2006 ). Electrostatics are modeled using Debye-Huckel interactions, where the Debye screening length () is determined by the ionic strength , equivalent to the concentration of a monovalent salt, as with in nm and in molar units. Perlmutter et al. Perlmutter2013 showed that Debye-Huckel interactions compare well to simulations with explicit counterions for the parameter values under consideration; furthermore, inclusion of multivalent ions at experimentally relevant concentrations had only a small effect on properties such as the optimal genome length. The effect of base-pairing on the optimal length was also considered in that reference Perlmutter2013 .
III.1 Kinetic phase diagram
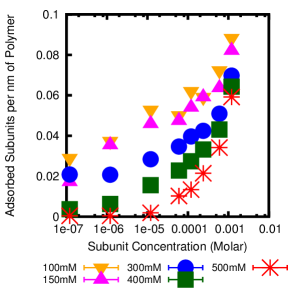
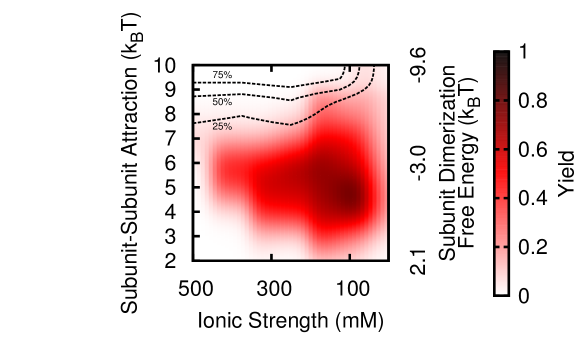
We first consider the predominant assembly products (Fig. 2) and the packaging efficiency (Fig. 3) as a function of Debye length and subunit-subunit interaction strength . The packaging efficiency is defined as the fraction of trajectories in which the polyelectrolyte is completely encapsulated by a well-formed capsid, which contains 12 subunits each of which interact with 5 neighbors. We refer to this as a kinetic phase diagram Hagan2006 ; Hagan2014 because we characterize products at a finite observation time of time steps, which is long enough that assemblages do not vary significantly with time (except for under weak interactions, see below), but is not sufficient to equilibrate kinetic traps if there are large activation barriers Elrad2010 ; Hagan2014 . We see that for the range of simulated ionic strengths ( mM or nm) assembly yields are highest for and mM (the parameter values focused on in Perlmutter2013 ), and that for moderate subunit-subunit interaction strengths () yield to remain high as the ionic strength is increased to about 300 mM ( nm). For higher salt concentrations, yields are depressed by the appearance of long-lived on-pathway intermediates. As will be discussed further below, weakening the electrostatic interaction between the polymer and protein limits the ability of the polymer to promote assembly. Although we expect that these simulations would eventually result in complete capsids, the low yield at our finite measurement time reflects the fact that assembly is less efficient than for lower salt concentrations. At the highest ionic strength considered ( mM), the most prevalent outcome is that no nucleation occurs. At lower salt concentrations ( mM), rapid adsorption of a super-stroichiometric quantity of subunits results in malformed capsids.

At larger-than-optimal protein-protein interaction strengths () assembly yields are lower for two reasons. The first, and more frequent outcome, is long-lived malformed structures with strained interactions. This kinetic trap arises in a wide variety of assembly systems when interactions become strong in comparison to the thermal energy, because strained interactions are unable to anneal before additional subunits lock them in place Hagan2014 ; Hagan2011 ; Grant2011 . In our simulations, we found that these structures frequently result from an incorrect merger between two partial capsid intermediates; even when each individual interaction is too weak to lock-in the non-optimal structure, multiple erroneous interactions formed by two partial capsids are effectively irreversible on our timescale. The tendency for oligomer binding to lead to malformed structures was seen previously in the context of empty capsid assembly Hagan2006 ; Whitelam2009 . Here, the polymer helps to bring oligomers together, and thus this trap arises when nucleation on the polymer is faster than growth of a nucleus into a complete capsid. This trap resembles Geminivirus particles, which are composed of a union of two nearly complete capsids Bottcher2004 .
The second obstacle to polyelectrolyte encapsulation arises at the highest protein-protein interaction strengths studied (), for which subunits not associated with the polyelectrolyte undergo spontaneous assembly. The resulting off-polyelectrolyte assembly depletes the pool of available monomers and small oligomers available for assembly on the polyelectrolyte, leading to a form of the monomer-starvation kinetic trap previously discussed for empty capsid assembly Hagan2014 ; Endres2002 . Triggering formation of empty capsids and thus preventing nucleic acid encapsidation by strengthening subunit-subunit interactions has been suggested as a mode of action for a putative antiviral drug for hepatitis B virus Katen2010 ; Katen2013 .
At smaller-than-optimal protein-protein interaction strengths () assembly is unsuccessful for two reasons, depending upon the ionic strength. At smaller values ( mM), electrostatic interactions are relatively strong, and many proteins adsorb onto to the polymer. However, because of the weak protein-protein interaction strength, these proteins do not form stable capsids, predominantly because nucleation is slow in comparison to (the final observation time, time steps). In a minority of cases, a nucleus will form, but completion is prevented by the excess number of subunits adsorbed to the polyelectrolyte. We refer to the resulting configurations as disordered, due to the lack of ordered binding between protein subunits. At larger ionic strengths ( mM) electrostatic interactions are relatively weak, and individual subunits rapidly desorb from the polyelectrolyte. In this regime, assembly requires a fluctuation in the number of adsorbed subunits which leads to nucleation of a partial capsid intermediate which has enough subunit-polyelectrolyte interactions to be stable against rapid desorption. The nucleation rate decreases exponentially with subunit-subunit interaction strength Hagan2014 ; Kivenson2010 , and thus most simulations at high salt and weak subunit-subunit interactions never undergo nucleation. (We categorize simulations with fewer than 3 subunits adsorbed to the polyelectrolyte and no subunit-subunit interactions (i.e. no progress towards assembly) as ‘unnucleated’.)
Importantly, we expect that trajectories in this region of parameter space will eventually undergo nucleation. Thus, as the finite assembly time is increased the region of successful assembly will expand to lower values of and higher ionic strength, until eventually reaching values below which capsid assembly is thermodynamically unstable (see Hagan2006 , Fig. 7). To confirm this possibility, we used the Markov state model (MSM) approach described in Ref. Perkett2014 to characterize assembly with and mM (see Figs. 4C and S4 (in the SI)). In contrast, the malformed capsids encountered under large parameter values typically will not resolve on any relevant timescales, since numerous strong interactions would need to be broken Hagan2014 . Thus, the boundaries of successful assembly at large values are insensitive to .
Several additional conclusions can be drawn from the variation of packaging efficiency (Fig. 3). Firstly, the yield of complete virus-like particles is relatively high for moderate subunit-subunit interaction strengths across a range of ionic strengths ( mM). Even above ( mM) and below ( mM) this range we observe moderate yields of complete particles. Secondly, as electrostatic interactions are weakened (moving to the left), the subunit-subunit interaction strength which optimizes the yield increases (i.e. from at to at to at ). This result suggests that one interaction type can compensate for the other within a limited range. However, though all successful capsids contain the same subunit geometry, the mechanism by which they form depends on the relative interaction strengths, as discussed next.
III.2 Assembly mechanisms
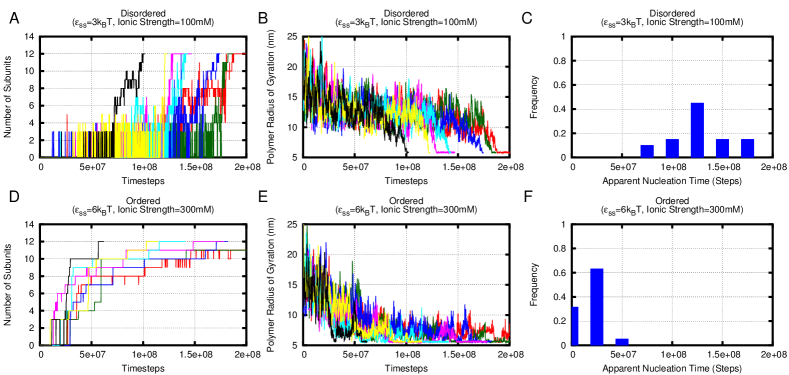
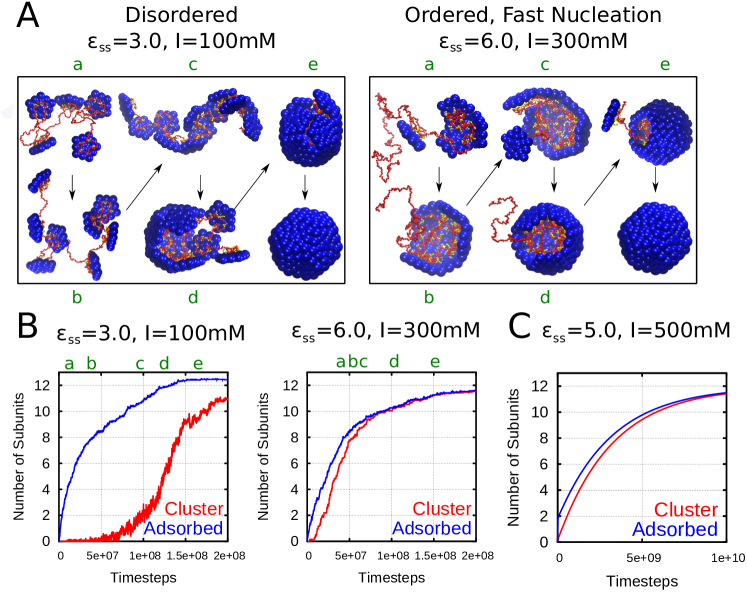
As noted previously Hagan2008 ; Elrad2010 ; Hagan2014 , pathways for assembly around a central core such as a polyelectrolyte can be roughly separated into two classes. In the first class (Fig. 4a), which we refer to as the ‘en masse’ mechanism, subunits first adsorb onto the polyelectrolyte in a disordered manner, followed by cooperative rearrangements to form an ordered capsid. In the second class (Fig. 4b), referred to as the nucleation-and-growth mechanism, a small partial capsid nucleates on the polyelectrolyte followed by the sequential, reversible addition of subunits or small oligomers until assembly completes. In contrast to the earlier models which considered a qualitative subunit-polyelectrolyte interaction, we study here how assembly pathways depend on the ionic strength.
To quantify the degree of order along assembly pathways, we record the total number of subunits adsorbed to the polyelectrolyte and the number of subunits in the largest cluster . Trajectories that pass through configurations with a large value of are disordered, with many adsorbed subunits not participating in ordered assemblies. In Fig. 4, these quantities are shown as a function of time averaged over all simulation trajectories (leading to successful assembly or not), for parameter sets that respectively lead to the en masse mechanism (Fig. 4A) and nucleation-and-growth mechanism (Fig. 4B). In the first case, there are strong subunit-polyelectrolyte interactions (low ionic strength, mM) and weak subunit-subunit interactions (). Subunits therefore initially adsorb nonspecifically and form only transient subunit-subunit interactions, leading to a rapid rise in with . Once enough subunits are adsorbed ( around an optimal-length polyelectrolyte for this model with a 12-subunit capsid), a cooperative fluctuation in subunit configurations eventually leads to a stable nucleus and then rapid completion of the ordered capsid geometry. Since this nucleation process is stochastic, there is a distribution of waiting times and thus a more gradual increase in the average cluster size (see Fig. S2). In the nucleation-and-growth case, on the other hand, the subunit-polyelectrolyte interactions are weak ( mM) and the subunit-subunit interactions are strong (). There is limited nonspecific subunit adsorption onto the polyelectrolyte, adsorbed subunits form relatively strong associations, and thus and increase nearly in lockstep. Snapshots from typical trajectories for each of these parameter sets are shown in Fig. 4A.
To visualize the degree of order as a function of parameter values, we define a trajectory-averaged order parameter , which is averaged over all configurations with and over all trajectories at a given parameter setElrad2008 . Large values of this parameter () indicate the en masse mechanism, while small values () indicate the nucleation-and-growth mechanism. As shown in Fig. 5, the degree of order generally increases with ionic strength and subunit-subunit interaction strength, with the most ordered assembly occurring at mM (where on average fewer than one subunit is adsorbed nonspecifically) and . However, notice that for assembly is always disordered; for such weak subunit-subunit interactions the critical nucleus size is large and a high density of adsorbed subunits is required to achieve nucleation. On the other hand, for moderate subunit-subunit interactions we do not observe the extreme limit of the en masse mechanism even for low ionic strength. Though a low ionic strength drives strong nonspecific subunit adsorption, absorbed subunits collide frequently due to cooperative polymer motions and subunit sliding along the polymer Hu2007 ; Elrad2010 . For absorbed subunits therefore achieve nucleation before nonspecific absorption has time to saturate.
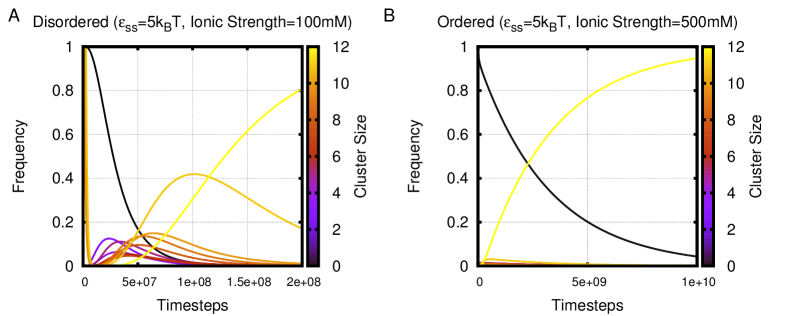
The nucleation-and-growth trajectories can be further classified based on the relative timescales of nucleation and growth. When nucleation is slow compared to growth (Figs. 4C and S4), the reaction is effectively two-state — each critical nucleus rapidly proceeds to completion, leading to low concentrations of intermediates which are essentially undetectable in a bulk experiment. When nucleation and growth timescales are comparable, multiple capsids within a spatial region can be assembling simultaneously, and thus potentially could be detected in bulk experiments. Below, we consider whether it is possible to experimentally distinguish between the latter case, ordered assembly with rapid nucleation, and en masse assembly pathways characterized by disordered intermediates.
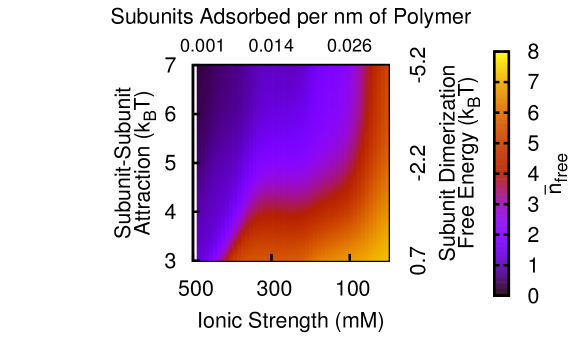
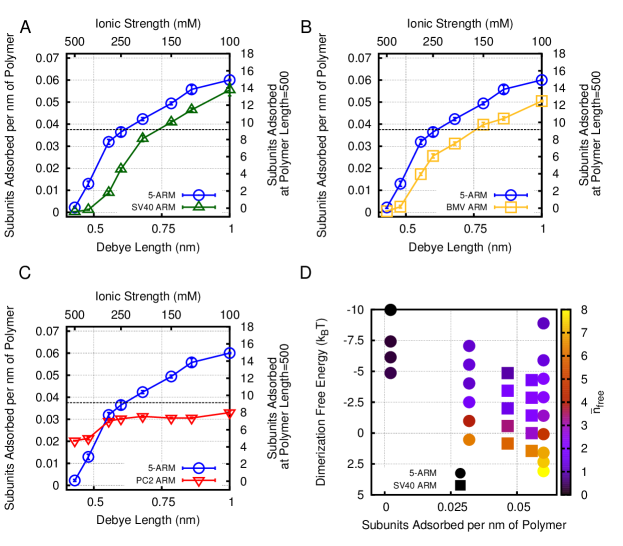
Biological ARM sequences. The assembly simulations described above consider a simplified peptide ARM, which contains only 5 positive ARM charges (Fig. 1). However, our previous work demonstrated that the ARM amino acid sequence (specifically the charges) can significantly affect binding to a polyelectrolyte Perlmutter2013 . Furthermore, results from a more simplified model suggested that the polyelectrolyte binding affinity is a determining factor for the assembly mechanism Elrad2010 . To test this hypothesis and to place our results in the context of specific viruses, we calculated the polyelectrolyte binding affinity for the simplified ARM and three ARM sequences from biological viruses (SV40, BMV, PC2), with each amino acid classified as neutral, cationic, or anionic. These calculations were performed by setting the subunit-subunit interaction strength to zero and recording the average number of adsorbed subunits at varying (or Debye length ). The measured equilibrium linear densities of adsorbed subunits, , are shown as a function of in Fig. 6A-C. In all cases the linear density increases monotonically with decreasing ; saturating at a maximum density. The simplified ARM has the largest binding affinity, despite having the lowest net positive charge (, 0 neutral segments) of the four species considered. Comparison with SV40 (, 14 neutral segments) and BMV (, 33 neutral segments) illustrates the expected result that that neutral segments decrease the binding affinity, particularly at high salt. The PC2 subunits, with net charge demonstrate markedly different behavior, with significant subunit absorption at the highest salt concentration simulated (500 mM), but saturating at about 300 mM ionic strength due to subunit-subunit charge repulsions. Variations in adsorption density with subunit concentration are shown in Fig. S1.
In Fig. 6D we connect these measures of adsorption with assembly mechanism by plotting the assembly order parameter as a function of (controlled by varying ), for several values of the subunit dimerization free energy (determined by and ) for the 5-ARM and SV40 models. Plotting against rather than () allows us to overlay data from these two models while accounting for the differences in affinity due to ARM sequence described above. In support of the proposed link between binding affinity and assembly mechanism, we find rough agreement in the measured assembly order parameters between the two models. The results indicate that ARM sequence can significantly influence the assembly mechanism. For example, if we define as the nucleation-growth mechanism, Fig. 6D indicates that nucleation-growth occurs for with the threshold value for . From Fig. 6A-C, we can then identify the threshold values of ionic strength , above which the nucleation-growth mechanism will occur: mM for the 5-ARM and mM for the BMV and SV40 models; while PC2 is below the threshold value for all salt concentrations considered. This allows us to predict, for example, that recent experiments on SV40 assembly (at mM and observed strong subunit-subunit attraction) would have a very low (), which is consistent with SAXS observations Kler2012 .
III.3 Experimental Observables
We now seek to provide experimental signatures through which the capsid assembly pathways discussed above can be distinguished. We focus on two experimental techniques which have recently been applied to respectively probe the formation of individual capsids and bulk assembly kinetics.
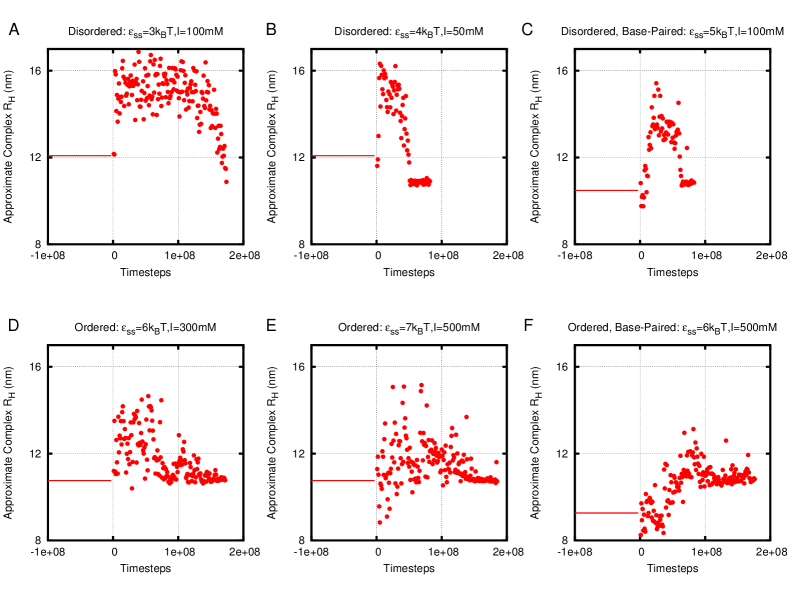
smFCS measurements on individual capsids can distinguish assembly mechanisms. Borodavka et al. Borodavka2012 used single molecule fluorescence correlation spectroscopy (smFCS) to monitor the hydrodynamic radii of nucleocapsid complexes during assembly of MS2 and STNV capsid proteins around cognate RNA or non-cognate RNA. Assembly around cognate RNA was characterized by either constant or, in some trajectories, a collapsed complex followed by gradual increase until reaching the size of an assembled capsid. In contrast, assembly around non-cognate RNA led to an increase in before eventually decreasing to the size of the capsid. The difference between these two behaviors can be attributed to sequence-specific ‘packaging signals’ on cognate RNA that interact with the capsid proteins. In this article we do not consider the effect of packaging signals (these will be considered in a subsequent article); instead, we consider whether the pathways described in the previous section can be distinguished by this experimental technique.
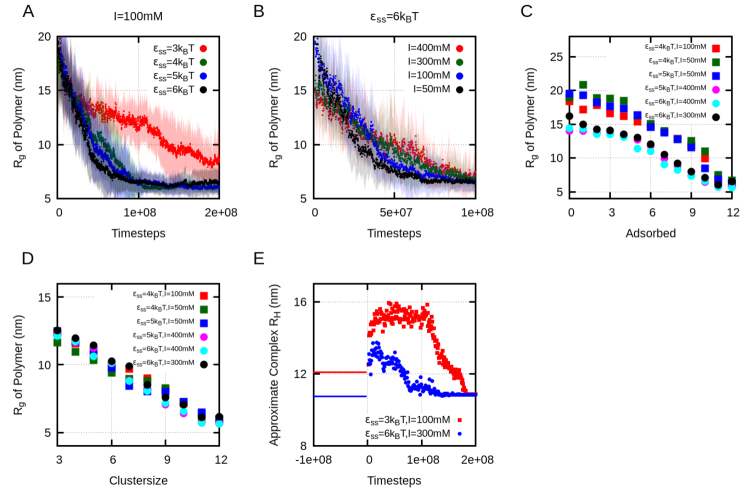
We estimated the hydrodynamic radii for polymer-subunit intermediates using the program HYDROPRO, which has been shown to accurately predict for large protein complexes Ortega2011 . The resulting are shown during representative en masse and ordered assembly trajectories in Fig. 7E. We see that the complex first increases as subunits adsorb onto the complex and then decreases as subunits assemble (Fig. 7E). However, the en masse mechanism leads to a much larger and longer duration increase in , due to the extensive and long-lived disordered adsorption of unassembled subunits. The difference in between en masse and ordered trajectories is conserved across their respective parameter ranges (see SI Fig. S3 for other trajectories), and also occurs for assembly trajectories around the model nucleic acid with intramolecular base- pairing developed in Ref. Perlmutter2013 (see SI Fig. S3C,F). These results suggest that smFCS can distinguish among the classes of assembly pathways observed in our simulations. They are consistent with an interpretation of the Borodavka et al. Borodavka2012 results in which assembly around the non-cognate RNA proceeds via the disordered mechanism while packaging signals lead to an ordered mechanism.
To further characterize the differences in polymer conformations between disordered and ordered assembly pathways, we show the polymer radius of gyration, , during assembly trajectories in Fig. 7. In contrast to , contributions of the capsid proteins are not included in . While the results in Fig. 7 are averaged over multiple trajectories, example individual trajectories are shown in SI Fig. S2. In all cases of successful assembly, the polymer is gradually compacted from its free size into its encapsidated size. However, at fixed mM, the average rate of compaction increases with , with a dramatic increase in rate for (Fig. 7A). Similarly, decreasing increases the rate of compaction (Fig. 7B). Notice that the rate of polymer compaction is not determined by the assembly mechanism — increased order correlates with faster compaction in Fig. 7A but with slower compaction in Figure 7B. When the is plotted as a function of number of adsorbed subunits (), the en masse and ordered pathways clearly split into two groups (Fig. 7C). However, this distinction disappears when is plotted as a function of the number of subunits in the largest cluster (, Fig. 7D). Taken together, these data demonstrate that polymer compaction is driven by adsorbed subunits forming ordered intermediates, with the rate of compaction consequently mirroring the rate of capsid assembly.
trSAXS measurments of bulk assembly kinetics can distinguish assembly mechanisms. While smFCS can detect individual assembly intermediates, Kler et al. Kler2012 ; Kler2013 recently used time resolved small angle x-ray scattering (trSAXS) to elucidate structures of assembling capsids in bulk. They found that the SAXS profiles at all time points could be decomposed into scattering contributions from the unassembled and complete components, suggesting that assembly proceeded by an effectively two-state reaction with undetectable levels of intermediates (i.e. the nucleation-and-growth pathway with relatively slow nucleation). While it is evident that profiles from profiles from a two-state reaction can be decomposed in this way, we investigated the extent to which SAXS profiles from the other pathway classes (en masse or nucleatation-and-growth with rapid nucleation) can be distinguished from the two-state case.
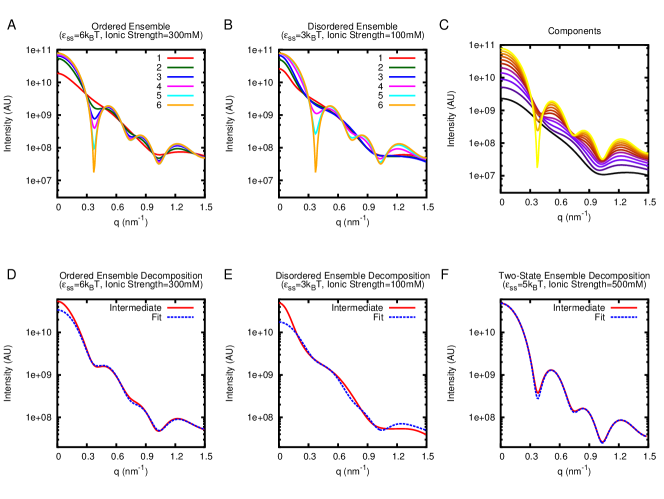
First, Fig. 8A,B shows SAXS profiles calculated (using CRYSOL Svergun1995 ) from simulation snapshots along ensembles of en masse and ordered assembly trajectories. For each parameter set, SAXS profiles are averaged over 6 time windows. In both cases, the first profile is dominated by scattering from free subunits (Fig. 8C) and the final time segment shows clear minima and maxima corresponding to the complete capsid (Fig. 8C). For comparison, Fig. 8C presents the SAXS profiles for ordered subunit clusters ranging in size from a single subunit (black) to a complete capsid (yellow). As the capsid grows distinct minima and maxima appear and become more pronounced. We note that the positions of the minima and maxima in the complete model capsid are similar to those observed experimentally for SV40 Kler2012 .
To test the extent to which these trajectories can be distinguished from the two-state case, we attempted to fit SAXS profiles using a linear combination of the profiles for unassembled polymer and subunits and the complete capsid. The resulting fits for the second fifth of the trajectory (where intermediates are most plentiful) are shown in Figs. 8D–F. At this stage, the ordered systems contain mostly incomplete subunit clusters (6-11 subunits), while the disordered simulations contain mostly adsorbed but unassembled subunits. For the ordered simulations, we find that the fit reproduces all of the features of the intermediates, except at low q. In contrast, the intermediates in the disordered trajectory display a shoulder at that is not observed in any of the unassembled or assembled components. This shoulder is a distinct feature of the disordered intermediate, and thus could be used to identify this class of pathways. Finally, as expected, SAXS profiles from trajectories at parameter sets (Fig. 4C) which lead to two-state kinetics are very well fit by a linear combination of polymer/subunit and complete capsid (Fig. 8F).
A significant distinction between the SAXS profiles is that the ordered pathways lead to an isosbestic point at (as seen in SV40 experimentsKler2012 ), whereas the disordered pathways do not. The presence of an isosbestic point is frequently assumed to indicate two-state behaviour; however, it occurs in our data for ordered trajectories even when the reaction is far from two-state due to rapid nucleation. In these cases the isosbestic point appears due to due to the similarity in scattering from the ordered intermediates and the complete capsid. This suggests that an isosbestic point may distinguish ordered from disordered assemblies, but is less sensitive to the extent to which the reaction kinetics can be approximated as two-state (i.e., how undetectable the intermediate concentrations are).
IV Discussion
Our simulations demonstrate that capsid assembly around a NA or other cargo can proceed through two mechanisms, and that which mechanism occurs depends on the relative strengths of protein-protein and protein-cargo interactions. The assembly mechanism can be rationally designed by tuning these interactions through solution conditions or mutagenesis of capsid protein-NA binding domains. However, because productive assembly requires weak interactions, the parameters must be tuned within relatively narrow ranges, and alterations which increase (decrease) the strength of one type of interaction must be compensated by a decrease (increase) in the other. Our results suggest that the subunit-cargo dissociation constant is an important parameter, whose value might be used to map specific viruses onto our phase diagrams (Figs. 2, 3 ,5), although experimental tests of this capability are required. Finally, we have shown that the nature of assembly pathways can be inferred from the results of recently developed techniques to monitor the assembly of individual capsids or bulk assembly kinetics.
Our simulations predict that a single viral species can be driven to assemble via different mechanisms in vitro by changing solution conditions. In particular, under a constant subunit-subunit binding energy () robust assembly occurs for a range of solvent conditions, with highly ordered or disordered assemblies occurring depending on salt concentration ( mM). To our knowledge, this prediction has not yet been realized experimentally, although the signatures of the two classes of assembly pathways have been seen in experiments on different viruses and/or different cargoes Kler2012 ; Garmann2013 ; Cadena-Nava2012 ; Malyutin2013 ; Borodavka2012 .
One recent experimental study sought to test the role of of and subunit-subunit attractions (controlled by solution H) on in vitro assembly of CCMV around RNA Garmann2013 . In some regards, these experiments mirror our observations, with malformed capsids observed for strong subunit-subunit attractions, disordered products for weak subunit-subunit attractions, and well-formed capsids at intermediate conditions. However, robust assembly was only observed for a two-step process: first was reduced (from ) to drive RNA-subunit interactions, and then secondly H was reduced to activate subunit-subunit attractions. The resulting assembly pathways resemble the en masse mechanism described here. On the other hand, one-step assembly led to malformed particles even at moderate H, suggesting an inability to assemble through a nucleation-and-growth mechanism in these experiments. In our simulations, this outcome would only occur at high salt concentrations (e.g. mM, see Figs. 2, 3), where the narrow range of leading to successful assembly indicates that parameters must be finely tuned. Reproducing such a lack of successful assembly at moderate salt concentrations would require a reduction in the orientation-dependence of the subunit-subunit interaction potential (see Methods), or introduction of additional factors as discussed below. Experiments in which solution conditions are changed for other viruses which do undergo one step assembly (e.g. SV40 Kler2012 ; Kler2013 ), may elucidate which of these possibilities to pursue and would directly test our prediction that the assembly mechanism can be controlled by solution conditions.
Understanding capsid assembly mechanisms and their location within the assembly phase diagram has important implications for the design of antiviral agents. As one example, we consider the recently developed class of HBV inhibitors based on phenylpropenamides Katen2010 ; Katen2013 , which act by increasing the strength of subunit-subunit interactions, driving subunits to assemble in the absence of their genome and thus increasing the generation of empty, non-infective capsids Katen2010 ; Katen2013 . Comparing Figs. 3 and 5 shows that a virus that undergoes ordered assembly (e.g. , mM), sits close to parameters that support empty capsid assembly, which are demarcated by dashed lines in Fig. 3. Thus only a small increase in subunit-subunit interactions is required to trigger unproductive RNA-free assembly. In contrast, a much larger perturbation would be required to achieve empty capsid assembly for a virus that assembles via the en masse mechanism.
Outlook. We have described two classes of assembly pathways and several distinct failure modes (Fig. 2) that arise when assembly is driven by nonspecific electrostatic subunit-cargo interactions. Our phase diagrams can serve as a starting point to understand how virus-specific features, such as packaging signals Stockley2013 , allosteric NA-induced Kler2013 ; Stockley2007 or ‘autosteric’ protein-induced conformational changes Caspar1980 , base pairing-induced NA-structure Perlmutter2013 ; Yoffe2008 ; Borodavka2012 , or subcellular localization Bamunusinghe2011 can robustly avoid failure modes amidst the crowded intracellular milieu while enabling selective assembly around the viral genome Routh2012 ; Ford2013 ; Rao2006 . For example, allosteric or autosteric conformational changes may allow for strong subunit-subunit interactions on the NA while avoiding the off-cargo assembly we observe at large . Systematically studying how these additional factors expand (or contract) regions of parameter space that lead to successful assembly will ultimately reveal how viruses have optimized their structures and interactions for robust assembly in vivo and how their assembly in vivo or in vitro can be manipulated for biomedical or materials science applications.
V Methods
Model. We have recently a presented a complete description of our model system, which we summarize here briefly Perlmutter2013 and in the SI. Our model subunits are based upon that previous used to simulate assembly of empty capsids Wales2005 ; Fejer2009 ; Johnston2010 which we extended previously to model assembly around cargo Perlmutter2013 . The pseudoatoms in the capsid subunit model are illustrated in Fig. 1. Subunit assembly is mediated through an attractive Morse potential between Attractor (‘A’) pseudoatoms located at each subunit vertex. The Top (‘T’) pseudoatoms interact with other ‘T’ psuedoatoms through a potential consisting of the repulsive term of the Lennard-Jones (LJ) potential, the radius of which is chosen to favor a subunit-subunit angle consistent with a dodecahedron (116 degrees). The Bottom (‘B’) pseudoatom has a repulsive LJ interaction with ‘T’ pseudoatoms, intended to prevent ‘upside-down’ assembly. The ‘T’, ‘B’, and ‘A’ pseudoatoms form a rigid body Wales2005 ; Fejer2009 ; Johnston2010 . See Refs. Schwartz1998 ; Hagan2006 ; Hicks2006 ; Nguyen2007 ; Wilber2007 ; Nguyen2008 ; Nguyen2009 ; Johnston2010 ; Wilber2009a ; Wilber2009 ; Rapaport1999 ; Rapaport2004 ; Rapaport2008 ; Hagan2008 ; Elrad2010 ; Hagan2011 ; Mahalik2012 ; Levandovsky2009 for related models.
To model electrostatic interaction with a negatively charged NA or polyelectrolyte we extend the model as follows. Firstly, to better represent the capsid shell we add a layer of ‘Excluder’ pseudoatoms which have a repulsive LJ interaction with the polyelectrolyte and the ARMs. Each ARM is modeled as a bead-spring polymer, with one bead per amino acid. The ‘Excluders’ and first ARM segment are part of the subunit rigid body. ARM beads interact through repulsive LJ interactions and, if charged, electrostatic interactions modelled by a Debye-Huckel potential. We note that repulsion between subunits due to the positive charges does affect the magnitude of the subunit-subunit interaction. Previously, we estimated this repulsion contributes to the dimerization free energy Perlmutter2013 . This contribution (and entropic terms) are not included in , which is the magnitude of the Morse potential depth. See SI section VII.2) for a discussion of binding free energies.
Simulations and units. Simulations were performed with the Brownian Dynamics algorithm of HOOMD, which uses the Langevin equation to evolve positions and rigid body orientations in time Anderson2008 ; nguyen2011 ; LeBard2012 . Simulations were run using a set of fundamental units. The fundamental energy unit is selected to be . The unit of length is set to the circumradius of a pentagonal subunit, which is taken to be nm so that the dodecahedron inradius of nm gives an interior volume consistent with that of the smallest capsids. Assembly simulations were run at least 10 times for each set of parameters, each of which were concluded at either completion, persistent malformation, or time steps. For all dynamics simulations there were 60 subunits with nm, resulting in a concentration of M.
SAXS profile and hydrodynamic radius estimations. Small Angle X-ray Scattering (SAXS) analysis was performed using CRYSOL Svergun1995 . For this analysis the all-atom structure of an SV40 pentameric subunit Stehle1996 was aligned into the position of each coarse-grained subunit and the polymer was replaced with a carbon chain. We note that this entails significant simplification: segments of the protein which were not resolved in the crystal structure were not reconstructed and there is no optimization of structure at the all-atom resolution. We believe this approximation is suitable, given that our analysis is limited to the X-ray scattering profile in the small angle regime, which reflects nm scale structural features. Fitting of the scattering profiles was performed using least squares fitting. Hydrodynamic radius analysis was performed using HYDROPRO Ortega2011 . This program is capable of calculating the hydrodynamic radius of large protein complexes. In order to perform this analysis, we treated the synthetic polymer as an amino acid chain. Though this is a gross approximation, it has a negligible effect: removing the polymer entirely does not change the trend and only alters the magnitude by . Simulations were visualized using VMD Humphrey1996 .
VI Acknowledgments
We gratefully acknowledge Adam Zlotnick for insightful discussion and critical reading of the manuscript. This work was supported by Award Number R01GM108021 from the National Institute Of General Medical Sciences. Computational resources were provided by the NSF through XSEDE computing resources (Longhorn, Maverick, Condor, and Keeneland) and the Brandeis HPCC which is partially supported by NSF-MRSEC-0820492.
References
- [1] Joshua A. Anderson, Chris D. Lorenz, and A. Travesset. General purpose molecular dynamics simulations fully implemented on graphics processing units. J Comput Phys, 227(10):5342–5359, 2008.
- [2] D. G. Angelescu, R. Bruinsma, and P. Linse. Monte Carlo simulations of polyelectrolytes inside viral capsids. Phys Rev E, 73(4):041921, 2006.
- [3] Daniel George Angelescu and Per Linse. Modelling of icosahedral viruses. Curr Opin Colloid Interface Sci, 13(6):389–394, 2008.
- [4] Saskia E Bakker, Robert J Ford, Amy M Barker, Janice Robottom, Keith Saunders, Arwen R Pearson, Neil A Ranson, and Peter G Stockley. Isolation of an asymmetric RNA uncoating intermediate for a single-stranded RNA plant virus. Journal of Molecular Biology, 417(1):65–78, 2012.
- [5] Devinka Bamunusinghe, Jang-Kyun Seo, and A. L. N. Rao. Subcellular Localization and Rearrangement of Endoplasmic Reticulum by Brome Mosaic Virus Capsid Protein. J Virol, 85(6):2953–2963, 2011.
- [6] Jb Bancroft, Hiebert E, and Bracker Ce. Effects Of Various Polyanions On Shell Formation Of Some Spherical Viruses. Virology, 39(4):924–930, 1969.
- [7] V. A. Belyi and M. Muthukumar. Electrostatic origin of the genome packing in viruses. Proc Natl Acad Sci U S A, 103(46):17174–17178, 2006.
- [8] Alexander Borodavka, Roman Tuma, and Peter G. Stockley. Evidence that viral RNAs have evolved for efficient, two-stage packaging. Proc Natl Acad Sci U S A, 109(39):15769–15774, 2012.
- [9] B. Bottcher, S. Unseld, H. Ceulemans, R. B. Russell, and H. Jeske. Geminate structures of African cassava mosaic virus. J Virol, 78(13):6758–6765, 2004.
- [10] G. R. Bowman, K. A. Beauchamp, G. Boxer, and V. S. Pande. Progress and challenges in the automated construction of Markov state models for full protein systems. J Chem Phys, 131(12), 2009.
- [11] G. R. Bowman, D. L. Ensign, and V. S. Pande. Enhanced Modeling via Network Theory: Adaptive Sampling of Markov State Models. J Chem Theory Comput, 6(3):787–794, 2010.
- [12] G. R. Bowman, V. A. Voelz, and V. S. Pande. Atomistic Folding Simulations of the Five-Helix Bundle Protein lambda(6-85). J Am Chem Soc, 133(4):664–667, 2011.
- [13] Ruben D. Cadena-Nava, Mauricio Comas-Garcia, Rees F. Garmann, A. L. N. Rao, Charles M. Knobler, and William M. Gelbart. Self-Assembly of Viral Capsid Protein and RNA Molecules of Different Sizes: Requirement for a Specific High Protein/RNA Mass Ratio. J Virol, 86(6):3318–3326, 2012.
- [14] Donald L Caspar. Movement and self-control in protein assemblies. Quasi-equivalence revisited. Biophysical journal, 32(1):103–138, 1980.
- [15] P. Ceres and A. Zlotnick. Weak protein-protein interactions are sufficient to drive assembly of hepatitis B virus capsids. Biochemistry, 41(39):11525–11531, 2002.
- [16] Connie B. Chang, Charles M. Knobler, William M. Gelbart, and Thomas G. Mason. Curvature dependence of viral protein structures on encapsidated nanoemulsion droplets. ACS Nano, 2(2):281–286, FEB 2008.
- [17] J. D. Chodera, N. Singhal, V. S. Pande, K. A. Dill, and W. C. Swope. Automatic discovery of metastable states for the construction of Markov models of macromolecular conformational dynamics. J Chem Phys, 126(15), 2007.
- [18] John D. Chodera, William C. Swope, Frank Noe, Jan-Hendrik Prinz, Michael R. Shirts, and Vijay S. Pande. Dynamical reweighting: improved estimates of dynamical properties from simulations at multiple temperatures. J Chem Phys, 134(24):244107, 2011.
- [19] Mauricio Comas-Garcia, Ruben D. Cadena-Nava, A. L. N. Rao, Charles M. Knobler, and William M. Gelbart. In vitro quantification of the relative packaging efficiencies of single-stranded RNA molecules by viral capsid protein. J Virol, 2012.
- [20] Marta Comellas-Aragones, Andres de la Escosura, A. J. Dirks, Anne van der Ham, Anna Fuste-Cune, Jeroen J. L. M. Cornelissen, and Roeland J. M. Nolte. Controlled Integration of Polymers into Viral Capsids. Biomacromolecules, 10(11):3141–3147, NOV 2009.
- [21] J. F. Conway and A. C. Steven. Methods for reconstructing density maps of ”single” particles from cryoelectron micrographs to subnanometer resolution. J of Struct Biol, 128(1):106–118, 1999.
- [22] R. M. Crist, S. A. K. Datta, A. G. Stephen, F. Soheilian, J. Mirro, R. J. Fisher, K. Nagashima, and A. Rein. Assembly Properties of Human Immunodeficiency Virus Type 1 Gag-Leucine Zipper Chimeras: Implications for Retrovirus Assembly. J Virol, 83(5):2216–2225, 2009.
- [23] P. Deuflhard and M. Weber. Robust Perron cluster analysis in conformation dynamics. Linear Algebra and Its Applications, 398:161–184, 2005.
- [24] B. Devkota, A. S. Petrov, S. Lemieux, M. B. Boz, L. Tang, A. Schneemann, J. E. Johnson, and S. C. Harvey. Structural and Electrostatic Characterization of Pariacoto Virus: Implications for Viral Assembly. Biopolymers, 91(7):530–538, 2009.
- [25] S. K. Dixit, N. L. Goicochea, M. C. Daniel, A. Murali, L. Bronstein, M. De, B. Stein, V. M. Rotello, C. C. Kao, and B. Dragnea. Quantum dot encapsulation in viral capsids. Nano Lett, 6(9):1993–1999, 2006.
- [26] E. C. Dykeman, N. E. Grayson, K. Toropova, N. A. Ranson, P. G. Stockley, and R. Twarock. Simple Rules for Efficient Assembly Predict the Layout of a Packaged Viral RNA. J Mol Biol, 408(3):399–407, 2011.
- [27] Eric C Dykeman, Peter G Stockley, and Reidun Twarock. Packaging signals in two single-stranded RNA viruses imply a conserved assembly mechanism and geometry of the packaged genome. Journal of molecular biology, 425(17):3235–3249, 2013.
- [28] O. M. Elrad and M. F. Hagan. Nano Lett, 8(11):3850–3857, 2008.
- [29] O.M. Elrad and M. F. Hagan. Encapsulation of a polymer by an icosahedral virus. Phys Biol, 7:045003, 2010.
- [30] D. Endres and A. Zlotnick. Model-based analysis of assembly kinetics for virus capsids or other spherical polymers. Biophys J, 83(2):1217–1230, 2002.
- [31] Szilard N. Fejer, Tim R. James, Javier Hernandez-Rojas, and David J. Wales. Energy landscapes for shells assembled from pentagonal and hexagonal pyramids. Phys Chem Chem Phys, 11(12):2098–2104, 2009.
- [32] Robert J Ford, Amy M Barker, Saskia E Bakker, Robert H Coutts, Neil A Ranson, Simon EV Phillips, Arwen R Pearson, and Peter G Stockley. Sequence-specific, RNA–protein interactions overcome electrostatic barriers preventing assembly of satellite tobacco necrosis virus coat protein. Journal of molecular biology, 425(6):1050–1064, 2013.
- [33] C. Forrey and M. Muthukumar. Electrostatics of capsid-induced viral RNA organization. J Chem Phys, 131(10), 2009.
- [34] J. M. Fox, J. E. Johnson, and M. J. Young. RNA/Protein Interactions in Icosahedral Virus Assembly. Seminars in Virology, 5(1):51–60, 1994.
- [35] Peter L. Freddolino, Anton S. Arkhipov, Steven B. Larson, Alexander McPherson, and Klaus Schulten. Molecular Dynamics Simulations of the Complete Satellite Tobacco Mosaic Virus. Structure, 14(3):437–449, 2006.
- [36] Rees F. Garmann, Mauricio Comas-Garcia, Ajaykumar Gopal, Charles M. Knobler, and William M. Gelbart. The Assembly Pathway of an Icosahedral Single-Stranded {RNA} Virus Depends on the Strength of Inter-Subunit Attractions. Journal of Molecular Biology, (0):–, 2013.
- [37] Nancy L. Goicochea, Mrinmoy De, Vincent M. Rotello, Suchetana Mukhopadhyay, and Bogdan Dragnea. Core-like particles of an enveloped animal virus can self-assemble efficiently on artificial templates. Nano Lett, 7(8):2281–2290, 2007.
- [38] E. Grahn, T. Moss, C. Helgstrand, K. Fridborg, M. Sundaram, K. Tars, H. Lago, N. J. Stonehouse, D. R. Davis, P. G. Stockley, and L. Liljas. Structural basis of pyrimidine specificity in the MS2 RNA hairpin-coat-protein complex. RNA-a Publication of the RNA Society, 7(11):1616–1627, 2001.
- [39] James Grant, Robert L. Jack, and Stephen Whitelam. Analyzing mechanisms and microscopic reversibility of self-assembly. J Chem Phys, 135(21), 2011.
- [40] M. F. Hagan. Controlling viral capsid assembly with templating. Phys Rev E, 77:051904, 2008.
- [41] M. F. Hagan and D. Chandler. Dynamic pathways for viral capsid assembly. Biophys J, 91(1):42–54, 2006.
- [42] M. F. Hagan, O. M. Elrad, and R. L. Jack. Mechanisms of kinetic trapping in self-assembly and phase transformation. J Chem Phys, 135:104115, 2011.
- [43] M.F. Hagan. Modeling Viral Capsid Assembly. Adv Chem Phys, 155, 2014. http://arxiv.org/abs/1301.1657.
- [44] S. C. Harvey, A. S. Petrov, B. Devkota, and M. B. Boz. Viral assembly: a molecular modeling perspective. Phys Chem Chem Phys, 11(45):10553–10564, 2009.
- [45] C. Helgstrand, E. Grahn, T. Moss, N. J. Stonehouse, K. Tars, P. G. Stockley, and L. Liljas. Investigating the structural basis of purine specificity in the structures of MS2 coat protein RNA translational operator hairpins. Nucleic Acids Res, 30(12):2678–2685, 2002.
- [46] S. D. Hicks and C. L. Henley. Irreversible growth model for virus capsid assembly. Phys Rev E, 74(3):031912, 2006.
- [47] E Hiebert, JE Bancroft, and CE Bracker. Assembly In Vitro Of Some Small Spherical Viruses, Hybrid Viruses, And Other Nucleoproteins. Virology, Vol 34 Issue 3(3):492–509, 1968.
- [48] N. S. Hinrichs and V. S. Pande. Calculation of the distribution of eigenvalues and eigenvectors in Markovian state models for molecular dynamics. J Chem Phys, 126(24), 2007.
- [49] L. H. Hu, A. Y. Grosberg, and R. Bruinsma. Are DNA transcription factor proteins Maxwellian Demons? Biophys J, 95(3):1151–1156, 2008.
- [50] T. Hu, R. Zhang, and B. I. Shklovskii. Electrostatic theory of viral self-assembly. Physica a-Statistical Mechanics and Its Applications, 387(12):3059–3064, 2008.
- [51] Tao Hu and B. I. Shklovskii. Kinetics of viral self-assembly: Role of the single-stranded RNA antenna. Phys Rev E, 75:051901, 2007.
- [52] Tao Hu, Rui Zhang, and B. I. Shklovskii. Electrostatic theory of viral self-assembly: a toy model. Physica A, 387:3059, 2008.
- [53] Xinlei Huang, Lyudmila M. Bronstein, John Retrum, Chris Dufort, Irina Tsvetkova, Stella Aniagyei, Barry Stein, Galen Stucky, Brandon McKenna, Nicholas Remmes, David Baxter, C. Cheng Kao, and Bogdan Dragnea. Self-assembled virus-like particles with magnetic cores. Nano Lett, 7(8):2407–2416, AUG 2007.
- [54] W. Humphrey, A. Dalke, and K. Schulten. VMD: Visual molecular dynamics. J Mol Graph, 14(1):33–38, 1996.
- [55] G. Jayachandran, V. Vishal, and V. S. Pande. Using massively parallel simulation and Markovian models to study protein folding: Examining the dynamics of the villin headpiece. J Chem Phys, 124(16), 2006.
- [56] T. Jiang, Z. G. Wang, and J. Z. Wu. Electrostatic Regulation of Genome Packaging in Human Hepatitis B Virus. Biophys J, 96(8):3065–3073, 2009.
- [57] J. M. Johnson, D. A. Willits, M. J. Young, and A. Zlotnick. Interaction with capsid protein alters RNA structure and the pathway for in vitro assembly of Cowpea chlorotic mottle virus. J Mol Biol, 335(2):455–464, 2004.
- [58] I. G. Johnston, A. A. Louis, and J. P. K. Doye. Modelling the self-assembly of virus capsids. J Phys : Condens Matter, 22(10), 2010.
- [59] S. P. Katen, S. R. Chirapu, M. G. Finn, and A. Zlotnick. Trapping of Hepatitis B Virus Capsid Assembly Intermediates by Phenylpropenamide Assembly Accelerators. ACS Chemical Biology, 5(12):1125–1136, 2010.
- [60] Sarah P Katen, Zhenning Tan, Srinivas Reddy Chirapu, M G Finn, and Adam Zlotnick. Assembly-directed antivirals differentially bind quasiequivalent pockets to modify hepatitis B virus capsid tertiary and quaternary structure. Structure, 21(8):1406–16, August 2013.
- [61] W. K. Kegel and P. van der Schoot. Competing hydrophobic and screened-Coulomb interactions in hepatitis B virus capsid assembly. Biophys J, 86(6):3905–3913, 2004.
- [62] A Kivenson and MF Hagan. Mechanisms of viral capsid assembly around a polymer. Biophys J, Vol 99 Issue 2(2):619–628, 2010.
- [63] Stanislav Kler, Roi Asor, Chenglei Li, Avi Ginsburg, Daniel Harries, Ariella Oppenheim, Adam Zlotnick, and Uri Raviv. RNA Encapsidation by SV40-Derived Nanoparticles Follows a Rapid Two-State Mechanism. J Am Chem Soc, 134(21):8823–8830, 2012.
- [64] Stanislav Kler, Joseph Che-Yen Wang, Mary Dhason, Ariella Oppenheim, and Adam Zlotnick. Scaffold properties are a key determinant of the size and shape of self-assembled virus-derived particles. ACS Chem. Biol., 8(12):2753–61, December 2013.
- [65] MA Krol, NH Olson, J Tate, JE Johnson, TS Baker, and P Ahlquist. RNA-controlled polymorphism in the in vivo assembly of 180-subunit and 120-subunit virions from a single capsid protein. Proc Natl Acad Sci U S A, 96(24):13650–13655, NOV 23 1999.
- [66] Thomas J. Lane, Gregory R. Bowman, Kyle Beauchamp, Vincent A. Voelz, and Vijay S. Pande. Markov State Model Reveals Folding and Functional Dynamics in Ultra-Long MD Trajectories. J Am Chem Soc, 133(45):18413–18419, 2011.
- [67] Steven B Larson and Alexander McPherson. Satellite tobacco mosaic virus RNA: structure and implications for assembly. Current opinion in structural biology, 11(1):59–65, 2001.
- [68] David N. LeBard, Benjamin G. Levine, Philipp Mertmann, Stephen A. Barr, Arben Jusufi, Samantha Sanders, Michael L. Klein, and Athanassios Z. Panagiotopoulos. Self-assembly of coarse-grained ionic surfactants accelerated by graphics processing units. Soft Matter, 8(8):2385–2397, 2012.
- [69] S. Lee and T. T. Nguyen. Radial distribution of RNA genomes packaged inside spherical viruses. Phys Rev Lett, 100(19), 2008.
- [70] Artem Levandovsky and Roya Zandi. Nonequilibirum assembly, retroviruses, and conical structures. Phys Rev Lett, 102(19):198102–198102, 2009.
- [71] P. P. Li, A. Nakanishi, S. W. Clark, and H. Kasamatsu. Formation of transitory intrachain and interchain disulfide bonds accompanies the folding and oligomerization of simian virus 40 Vp1 in the cytoplasm. Proc Natl Acad Sci U S A, 99(3):1353–1358, 2002.
- [72] L Loo, RH Guenther, VR Basnayake, SA Lommel, and S Franzen. Controlled encapsidation of gold nanoparticles by a viral protein shell. J Am Chem Soc, 128(14):4502–4503, APR 12 2006.
- [73] LiNa Loo, Richard H. Guenther, Steven A. Lommel, and Stefan Franzen. Encapsidation of nanoparticles by Red Clover Necrotic Mosaic Virus. J Am Chem Soc, 129(36):11111–11117, SEP 12 2007.
- [74] R. W. Lucas, S. B. Larson, and A. McPherson. The crystallographic structure of brome mosaic virus. J Mol Biol, 317(1):95–108, 2002.
- [75] J. P. Mahalik and M. Muthukumar. Langevin dynamics simulation of polymer-assisted virus-like assembly. J Chem Phys, 136(13):135101, 2012.
- [76] Andrey G Malyutin and Bogdan Dragnea. Budding Pathway in the Templated Assembly of Viruslike Particles. J Phys Chem B, September 2013.
- [77] JD Mcghee and PHV Hippel. Theoretical Aspects Of Dna-protein Interactions - Cooperative And Non-cooperative Binding Of Large Ligands To A One-dimensional Homogeneous Lattice. J. Mol. BioEssays, 86(2):469–489, 1974.
- [78] A. McPherson. Micelle formation and crystallization as paradigms for virus assembly. Bioessays, 27(4):447–458, 2005.
- [79] H. D. Nguyen, V. S. Reddy, and C. L. Brooks. Deciphering the kinetic mechanism of spontaneous self-assembly of icosahedral capsids. Nano Lett, 7(2):338–344, 2007.
- [80] HD Nguyen and CL Brooks. Generalized structural polymorphism in self-assembled viral particles. Nano Lett, 8:4574, 2008.
- [81] Hung D. Nguyen, Vijay S. Reddy, and Charles L. Brooks. Invariant polymorphism in virus capsid assembly. J Am Chem Soc, 131(7):2606–14, 2009.
- [82] Trung Dac Nguyen, Carolyn L. Phillips, Joshua A. Anderson, and Sharon C. Glotzer. Rigid body constraints realized in massively-parallel molecular dynamics on graphics processing units. Comput Phys Commun, 182(11):2307–2313, 2011.
- [83] P. Ni, Z. Wang, X. Ma, N. C. Das, P. Sokol, W. Chiu, B. Dragnea, M. F. Hagan, and C. C Kao. An Examination of the Electrostatic Interactions between the N-Terminal Tail of the Coat Protein and RNA in Brome Mosaic Virus. J Mol Biol, 419:284–300, 2012.
- [84] F. Noe, C. Schutte, E. Vanden-Eijnden, L. Reich, and T. R. Weikl. Constructing the equilibrium ensemble of folding pathways from short off-equilibrium simulations. Proc Natl Acad Sci U S A, 106(45):19011–19016, 2009.
- [85] A Ortega, D Amorós, and J García de La Torre. Prediction of hydrodynamic and other solution properties of rigid proteins from atomic-and residue-level models. Biophysical journal, 101(4):892–898, 2011.
- [86] V. S. Pande, K. Beauchamp, and G. R. Bowman. Everything you wanted to know about Markov State Models but were afraid to ask. Methods, 52(1):99–105, 2010.
- [87] S. Park, D. L. Ensign, and V. S. Pande. Bayesian update method for adaptive weighted sampling. Phys Rev E, 74(6), 2006.
- [88] Matthew R Perkett and Michael F. Hagan. Using Markov State Models to Study Self-Assembly. Submitted for publication.
- [89] Jason D. Perlmutter, Cong Qiao, and Michael F. Hagan. Viral genome structures are optimal for capsid assembly. eLife, 2:e00632, 2013.
- [90] J. Zachary Porterfield, Mary Savari Dhason, Daniel D. Loeb, Michael Nassal, Stephen J. Stray, and Adam Zlotnick. Full-Length Hepatitis B Virus Core Protein Packages Viral and Heterologous RNA with Similarly High Levels of Cooperativity. J Virol, 84(14):7174–7184, 2010.
- [91] Peter E Prevelige. New approaches for antiviral targeting of HIV assembly. J. Mol. Biol., 410(4):634–40, July 2011.
- [92] Jan-Hendrik Prinz, John D. Chodera, Vijay S. Pande, William C. Swope, Jeremy C. Smith, and Frank Noe. Optimal use of data in parallel tempering simulations for the construction of discrete-state Markov models of biomolecular dynamics. J Chem Phys, 134(24), 2011.
- [93] A. L. N. Rao. Genome packaging by spherical plant RNA viruses. In Annual Review of Phytopathology, volume 44 of Annual Review of Phytopathology, pages 61–87. 2006.
- [94] D. C. Rapaport, J. E. Johnson, and J. Skolnick. Supramolecular self-assembly: molecular dynamics modeling of polyhedral shell formation. Comput Phys Commun, 122:231–235, 1999.
- [95] D.C. Rapaport. Self-assembly of polyhedral shells: a molecular dynamics study. Phys. Rev. E., 70:051905, 2004.
- [96] D.C. Rapaport. The role of reversibility in viral capsid growth: A paradigm for self-assembly. Phys Rev Lett, 101:186101, 2008.
- [97] Andrew Routh, Tatiana Domitrovic, and John E Johnson. Host RNAs, including transposons, are encapsidated by a eukaryotic single-stranded RNA virus. Proceedings of the National Academy of Sciences, 109(6):1907–1912, 2012.
- [98] A. Schneemann. The structural and functional role of RNA in icosahedral virus assembly. Annu Rev Microbiol, 60:51–67, 2006.
- [99] Paul Schoot and Roya Zandi. Impact of the topology of viral RNAs on their encapsulation by virus coat proteins. Journal of Biological Physics, 39(2):289–299, 2013.
- [100] R. Schwartz, P. W. Shor, P. E. Prevelige, and B. Berger. Local rules simulation of the kinetics of virus capsid self-assembly. Biophys J, 75(6):2626–2636, 1998.
- [101] A. Siber and R. Podgornik. Nonspecific interactions in spontaneous assembly of empty versus functional single-stranded RNA viruses. Phys Rev E, 78:051915, 2008.
- [102] Antonio Siber, Anze Losdorfer Bozic, and Rudolf Podgornik. Energies and pressures in viruses: contribution of nonspecific electrostatic interactions. Phys Chem Chem Phys, 14(11):3746–3765, 2012.
- [103] Antonio Siber, Roya Zandi, and Rudolf Podgornik. Thermodynamics of nanospheres encapsulated in virus capsids. Phys Rev E, 81(5):051919, 2010.
- [104] F. D. Sikkema, M. Comellas-Aragones, R. G. Fokkink, B. J. M. Verduin, Jjlm Cornelissen, and R. J. M. Nolte. Monodisperse polymer-virus hybrid nanoparticles. Org Biomol Chem, 5(1):54–57, 2007.
- [105] T. Stehle, S. J. Gamblin, Y. W. Yan, and S. C. Harrison. The structure of simian virus 40 refined at 3.1 angstrom resolution. Structure, 4(2):165–182, 1996.
- [106] Peter G. Stockley, Ottar Rolfsson, Gary S. Thompson, Gabriella Basnak, Simona Francese, Nicola J. Stonehouse, Steven W. Homans, and Alison E. Ashcroft. A simple, RNA-mediated allosteric switch controls the pathway to formation of a T=3 viral capsid. J. Mol. BIo., 369:541–552, 2007.
- [107] Peter G Stockley, Reidun Twarock, Saskia E Bakker, Amy M Barker, Alexander Borodavka, Eric Dykeman, Robert J Ford, Arwen R Pearson, Simon EV Phillips, Neil A Ranson, et al. Packaging signals in single-stranded RNA viruses: nature’s alternative to a purely electrostatic assembly mechanism. Journal of biological physics, 39(2):277–287, 2013.
- [108] J. Sun, C. DuFort, M. C. Daniel, A. Murali, C. Chen, K. Gopinath, B. Stein, M. De, V. M. Rotello, A. Holzenburg, C. C. Kao, and B. Dragnea. Core-controlled polymorphism in virus-like particles. Proc Natl Acad Sci U S A, 104(4):1354–1359, 2007.
- [109] D Svergun, C Barberato, and MHJ Koch. CRYSOL-a program to evaluate X-ray solution scattering of biological macromolecules from atomic coordinates. Journal of Applied Crystallography, 28(6):768–773, 1995.
- [110] W. C. Swope, J. W. Pitera, and F. Suits. Describing protein folding kinetics by molecular dynamics simulations. 1. Theory. J Phys Chem B, 108(21):6571–6581, 2004.
- [111] W. C. Swope, J. W. Pitera, F. Suits, M. Pitman, M. Eleftheriou, B. G. Fitch, R. S. Germain, A. Rayshubski, T. J. C. Ward, Y. Zhestkov, and R. Zhou. Describing protein folding kinetics by molecular dynamics simulations. 2. Example applications to alanine dipeptide and beta-hairpin peptide. J Phys Chem B, 108(21):6582–6594, 2004.
- [112] M. Tihova, K. A. Dryden, T. V. L. Le, S. C. Harvey, J. E. Johnson, M. Yeager, and A. Schneemann. Nodavirus coat protein imposes dodecahedral RNA structure independent of nucleotide sequence and length. J Virol, 78(6):2897–2905, 2004.
- [113] Christina L. Ting, Jianzhong Wu, and Zhen-Gang Wang. Thermodynamic basis for the genome to capsid charge relationship in viral encapsidation. Proc Natl Acad Sci U S A, 108(41):16986–16991, 2011.
- [114] K. Toropova, G. Basnak, R. Twarock, P. G. Stockley, and N. A. Ranson. The three-dimensional structure of genomic RNA in bacteriophage MS2: Implications for assembly. J Mol Biol, 375:824–836, 2008.
- [115] K. Valegard, J. B. Murray, P. G. Stockley, N. J. Stonehouse, and L. Liljas. Crystal structure of an bacteriophage RNA coat protein operator complex. Nature, 371(6498):623–626, 1994.
- [116] K. Valegard, J. B. Murray, N. J. Stonehouse, S. vandenWorm, P. G. Stockley, and L. Liljas. The three-dimensional structures of two complexes between recombinant MS2 capsids and RNA operator fragments reveal sequence-specific protein-RNA interactions. J Mol Biol, 270(5):724–738, 1997.
- [117] S. H. E. van den Worm, N. J. Stonehouse, K. Valegard, J. B. Murray, C. Walton, K. Fridborg, P. G. Stockley, and L. Liljas. Crystal structures of MS2 coat protein mutants in complex with wild-type RNA operator fragments. Nucleic Acids Res, 26(5):1345–1351, 1998.
- [118] P. van der Schoot and R. Bruinsma. Electrostatics and the assembly of an RNA virus. Phys Rev E, 71(6):061928, 2005.
- [119] D. J. Wales. The energy landscape as a unifying theme in molecular science. Phil Trans R Soc A, 363(1827):357–375, 2005.
- [120] Stephen Whitelam, Carl Rogers, Andrea Pasqua, Chad Paavola, Jonathan Trent, and Phillip L. Geissler. The Impact of Conformational Fluctuations on Self-Assembly: Cooperative Aggregation of Archaeal Chaperonin Proteins. Nano Lett, 9:292–297, 2009.
- [121] A. W. Wilber, J. P. K. Doye, and A. A. Louis. Self-assembly of monodisperse clusters: Dependence on target geometry. J Chem Phys, 131(17), 2009.
- [122] A. W. Wilber, J. P. K. Doye, A. A. Louis, E. G. Noya, M. A. Miller, and P. Wong. Reversible self-assembly of patchy particles into monodisperse icosahedral clusters. J Chem Phys, 127(8), 2007.
- [123] Alex W. Wilber, Jonathan P. K. Doye, Ard A. Louis, and Anna C. F. Lewis. Monodisperse self-assembly in a model with protein-like interactions. J Chem Phys, 131(17):175102, 2009.
- [124] A. M. Yoffe, P. Prinsen, A. Gopal, C. M. Knobler, W. M. Gelbart, and A. Ben-Shaul. Predicting the sizes of large RNA molecules. Proc Natl Acad Sci U S A, 105(42):16153–16158, 2008.
- [125] Y. Zeng, S.B. Larson, C.E. Heitsch, A. McPherson, and S.C. Harvey. A Model for the Structure of Satellite Tobacco Mosaic Virus. J Struct Biol, 2012.
- [126] Z. L. Zhang and S. C. Glotzer. Self-assembly of patchy particles. Nano Lett, 4(8):1407–1413, 2004.
- [127] A. Zlotnick, N. Cheng, S. J. Stahl, J. F. Conway, A. C. Steven, and P. T. Wingfield. Localization of the C terminus of the assembly domain of hepatitis B virus capsid protein: Implications for morphogenesis and organization of encapsidated RNA. Proc Natl Acad Sci U S A, 94(18):9556–9561, 1997.
- [128] A. Zlotnick and S. Mukhopadhyay. Virus assembly, allostery and antivirals. Trends Microbiol, 19(1):14–23, 2011.
- [129] Adam Zlotnick, J. Zachary Porterfield, and Joseph Che-Yen Wang. To Build a Virus on a Nucleic Acid Substrate. Biophys J, 104(7):1595–1604, 2013.
VII Supporting Information
VII.1 Model potentials and parameters
The model details are described in Ref. [89]; we summarize them here for the convenience of the reader. In our model, all potentials can be decomposed into pairwise interactions. Potentials involving capsomer subunits further decompose into pairwise interactions between their constituent building blocks – the excluders, attractors, ‘Top’ and ‘Bottom’, and ARM pseudoatoms. It is convenient to write the total energy of the system as the sum of 6 terms: a capsomer-capsomer part (which does not include interactions between ARM pseudoatoms), capsomer-polymer , capsomer-ARM , polymer-polymer , polymer-ARM , and ARM-ARM parts. Each is summed over all pairs of the appropriate type:
| (1) |
where is the sum over all distinct pairs of capsomers in the system, is the sum over all capsomer-polymer pairs, etc.
The capsomer-capsomer potential is the sum of the attractive interactions between complementary attractors, and geometry guiding repulsive interactions between ‘Top’ - ‘Top’ pairs and ‘Top’ - ‘Bottom’ pairs. There are no interactions between members of the same rigid body, but ARMs are not rigid and thus there are intra-subunit ARM-ARM interactions. Thus, for notational clarity, we index rigid bodies and non-rigid pseudoatoms in Roman, while the pseudoatoms comprising a particular rigid body are indexed in Greek. E.g., for capsomer we denote its attractor positions as with the set comprising all attractors , its ‘Top’ positions , and its ‘Bottom’ positions . The capsomer-capsomer interaction potential between two capsomers and is then defined as:
| (2) |
where is an adjustable parameter which both sets the strength of the capsomer-capsomer attraction at each attractor site and scales the repulsive interactions which enforce the dodecahedral geometry. , , and are the number of ‘Top’, ‘Bottom’, and attractor pseudoatoms respectively in one capsomer, and are the effective diameters of the ‘Top’ – ‘Top’ interaction and ‘Bottom’ – ‘Top’ interactions, which are set to 10.5 nm and 9.0 nm respectively throughout this work, is the minimum energy attractor distance, set to 1 nm, is a parameter determining the width of the attractive interaction, set to 2.5, and is the cutoff distance for the attractor potential, set to 10.0 nm.
The function is defined as the repulsive component of the Lennard-Jones potential shifted to zero at the interaction diameter:
| (3) |
The function is a Morse potential:
| (4) |
The capsomer-polymer interaction is a short-range repulsion that accounts for excluded-volume. For capsomer with excluder positions and polymer subunit with position , the potential is:
| (5) |
where is the number of excluders on a capsomer and is the effective diameter of the excluder – polymer repulsion. The diameter of the polymer bead is nm and the diameter for the excluder beads is nm for the model and nm for the model.
The capsomer-ARM interaction is a short-range repulsion that accounts for excluded-volume. For capsomer with excluder positions and ARM subunit with position , the potential is:
| (6) |
with as the effective diameter of the excluder - ARM repulsion with nm the diameter of an ARM bead.
The polymer-polymer non-bonded interaction is composed of electrostatic repulsions and short-ranged excluded-volume interactions. These polymers also contain bonded interactions which are only evaluated for segments occupying adjacent positions along the polymer chain and angular interactions which are only evaluated for three sequential polymer segments. As noted in the main text, electrostatics are represented by Debye Huckel interactions.
| (13) |
where is the center-to-center distance between the polymer subunits, is the valence of charge on each polymer segment, and is a Debye-Huckel potential smoothly shifted to zero at the cutoff:
| (14) | ||||
| (21) |
is the Debye length, is the Bjerrum length, and and are the valences of the interacting charges.
Bonds are represented by a harmonic potential:
| (22) |
Angles are also represented by a harmonic potential:
| (23) |
where is the angle formed by the sequential polymer units .
The ARM-ARM interaction is similar to the polymer-polymer interaction, consisting of non-bonded interactions composed of electrostatic repulsions and short-ranged excluded-volume interactions. These ARMs also contain bonded interactions which are only evaluated for segments occupying adjacent positions along the polymer chain:
| (28) |
where is the center-to-center distance between the ARM subunits and is the valence of charge on ARM segment .
Finally, the ARM-Polymer interaction is the sum of short-ranged excluded-volume interactions and electrostatic interactions:
| (29) |
VII.2 Calculation of binding free energy estimates
Subunit-Subunit binding free energy. Our method of calculating the subunit-subunit binding free energy was described previously [89] and is similar to that presented in our previous work [29, 42]. Briefly, subunits were modified such that only one edge formed attractive bonds, limiting complex formation to dimers. We measured the relative concentration of dimers and monomers for a range of attraction strengths (). The free energy of binding along that interface is then with standard state concentration M and in molar units. We can then correct for the multiplicity of dimer conformations, by adding in the additional term , where the five pentagonal edges are assumed to be distinguishable, but complex orientations which differ only through global rotation are not. For subunits which do not contain ARMs, the free energy is well fit by the linear expression where , and these values are used in Figures 3 and 5. Calculations were also performed with ARMs at varying . For mM, increases by due to ARM-ARM repulsion for the simple 5-ARM model. For the SV40 ARM, increases by at mM.
Subunit-Polymer interaction. Our method of estimating the subunit-polymer binding free energy is also similar to that presented in our previous work [29, 42]. In these simulations, the subunit-subunit attraction is eliminated (i.e. ), and the average number of subunits adsorbed to the polymer is measured as a function of the subunit concentration and salt concentration (Fig. S1A). With sufficient data, the dissociation constant and free energy as a function of salt concentration could be determined using the McGhee-von Hippel formulation, wherein a bound ligand occupies multiple binding sites on the polymer [77]. In our previous simulations the number of binding sites occupied by a subunit was determined by the model [29, 42], whereas here the number of polymer sites occupied per subunit emerges from collective interactions. As our estimate, we use the number of subunits per polymer length for the maximal saturation observed, which for our subunits containing 25 ARM charges (5 ARMs of length 5 each) results in . This leads to estimates in the free energy of subunit-polymer binding of for mM. However, we found systematic variations of our estimate for changing total subunit concentration, suggesting that our sampling was incomplete.
VII.3 Constructing the Markov state model
Markov state models (MSMs) have been used extensively to study protein folding [12, 11, 10, 111, 110, 92, 87, 86, 84, 66, 55, 18, 48, 17, 23], and are one of the few methods that can describe out-of-equilibrium dynamical processes that include rare events, such as a nucleation barrier crossing. Our strategy for using MSMs to study capsid self-assembly is described in detail in Ref. [88]; we summarize the key points here. We construct an MSM by running many short (relative to the assembly timescale) simulations using a ratcheting procedure, which starts simulations from configurations based on the most poorly sampled states. System configurations are partitioned into states such that configurations which interconvert rapidly are collected in the same state while those which interconvert slowly are in separate states. The separation of timescales provided by such decomposition ensures that the system behaves Markovian beyond the relatively short intra-state relaxation timescales. Inter-state transition probabilities are then measured after a ‘lag time’ which is longer than intra-state relaxation times. We follow the simplest approach described in Ref. [88], in which states are defined by the largest cluster size and the total number of subunits adsorbed to the polyelectrolyte . Using this state decomposition produced 74 states for the slow nucleation parameters (, mM) with a lag time of simulation steps sufficient to maintain the Markov property.
MSM Calculations. The transition probability matrix is calculated by column-normalizing the count matrix , in which each element gives the total number of transitions from state to state measured at a lag time . The count matrix is calculated from the many, relatively short, trajectories run in parallel using the ratcheting procedure described below. After diagonalizing , the time-dependent state probabilities can be written as
| (30) |
where is the eigenvalue of and and are the corresponding left/right eigenvectors, which are assumed to be normalized. Since is generally not Hermitian the left and right eigenvectors are not equivalent. There is only one unit eigenvalue, whose associated right eigenvector corresponds to the equilibrium distribution, while all other eigenvalues are positive and real [110]. The average value of an order parameter, , can then be calculated as a function of time from
| (31) |
with as the order parameter value for state and as the time dependent probability of state (from Eq. 30). Eq. 31 was used to calculate the mean cluster size and mean number adsorbed in SI Fig. 4C. In order to calculate the probability of a given cluster size as a function of time in SI Fig. S4, the same procedure was followed except that all states for a given were lumped together to give a single curve for each .
Ratcheting Procedure. Because of the Markov property, starting coordinates for simulations can be chosen to efficiently generate good statistics for all of the relevant transition elements. Many simulations are run in parallel for a time , which must be longer than the lag time , but can be much shorter than the longest relaxation timescale. For the slow nucleation calculation in this paper, we continuously ran simulations in parallel starting from an unassembled bath of subunits. New simulations were seeded from the states with the fewest number of simulation starts, biasing sampling to unexplored regions of state space. Our ratcheting procedure initially grouped states only by the number of subunits adsorbed to polymer . However, after discovering states for each cluster size on the pathway to assembly, we ran a large number of simulations in parallel seeded from a random selection of existing states. This crude, but effective approach could be improved by using adaptive sampling [11], which explicitly considers the error in the MSM when seeding new simulations. A total of simulation steps were used to build the MSM.