Multilayer formation and evaporation of deuterated ices in prestellar and protostellar cores
Abstract
Extremely large deuteration of several molecules has been observed towards prestellar cores and low-mass protostars for a decade. New observations performed towards low-mass protostars suggest that water presents a lower deuteration in the warm inner gas than in the cold external envelope. We coupled a gas-grain astrochemical model with a one-dimension model of collapsing core to properly follow the formation and the deuteration of interstellar ices as well as their subsequent evaporation in the low-mass protostellar envelopes with the aim of interpreting the spatial and temporal evolutions of their deuteration. The astrochemical model follows the formation and the evaporation of ices with a multilayer approach and also includes a state-of-the-art deuterated chemical network by taking the spin states of H2 and light ions into account. Because of their slow formation, interstellar ices are chemically heterogeneous and show an increase of their deuterium fractionation towards the surface. The differentiation of the deuteration in ices induces an evolution of the deuteration within protostellar envelopes. The warm inner region is poorly deuterated because it includes the whole molecular content of ices while the deuteration predicted in the cold external envelope scales with the highly deuterated surface of ices. We are able to reproduce the observed evolution of water deuteration within protostellar envelopes but we are still unable to predict the super-high deuteration observed for formaldehyde and methanol. Finally, the extension of this study to the deuteration of complex organics (COMs), important for the prebiotic chemistry, shows a good agreement with the observations, suggesting that we can use the deuteration to retrace their mechanisms and their moments of formation.
Subject headings:
astrochemistry — ISM: abundances — ISM: molecules — stars: formation1. Introduction
The early stages of low-mass star formation are characterized by extremely enhanced molecular deuteration observed for various gaseous species. In spite of the low cosmic elemental reservoir of deuterium (, Linsky, 2003), the deuterium fractionation111In the following of this manuscript, the deuterium fractionation, also referred as the D/H abundance ratio, of a deuterated species XD stands for the abundance ratio between this deuterated species and its main isotopologue XH: D/H(XD) = [XD]/[XH]. of simply and doubly deuterated species can reach % and %, respectively in low-mass prestellar cores and Class 0 protostars (Parise et al., 2006; Bergman et al., 2011) while triply deuterated isotopologues have also been detected (Parise et al., 2004; Roueff et al., 2005).
The deuterium chemistry in the gas phase is believed to be triggered by the deuterium exchange between HD and H, as the deuterium reservoir is likely initially located in HD, via the reaction
| (1) |
which is in competition with the reaction between H and CO. In dense and cold prestellar cores, the CO freeze-out at the surface of interstellar grains increases the reactivity of reaction (1) as well as its deuterated analogues through the decrease of the destruction of H via the reaction between H and CO. For high densities and high CO depletions, the gas phase D/H abundance ratio of deuterated species can easily reach 100 % (Roberts et al., 2003). Since reaction (1) is exothermic, its backward process cannot occur in the cold conditions ( K) found in prestellar cores if only the para spin state of H2 is considered. However, due to its higher internal energy, the ortho spin state allows the reaction between H2 and H2D+ to occur, even at low temperatures. Therefore, the ortho/para ratio of H2 opr(H2) strongly influences the deuteration of gaseous species in prestellar cores (Flower et al., 2006).
Millimetric observations performed towards Class 0 protostars have shown that various molecules, mostly formed at the surface of interstellar grains in molecular clouds and evaporated in the warm inner regions of protostellar envelopes at K (the so-called hot corinos), show different deuterations. For example, in the low-mass protostar prototype IRAS 16293-2422 (hereafter I16293), formaldehyde and methanol show higher deuterations (with D/H ratios of 15 and 40 %, respectively, see Loinard et al., 2001; Parise et al., 2002, 2004) than ammonia and water ( and 3 %, respectively, see van Dishoeck et al., 1995; Coutens et al., 2012). The deuterium fractionation can be used as a chemical tool to retrace the history of interstellar ices and gas-grain astrochemical models have been developed to interpret the observations of low-mass protostars (Cazaux et al., 2011; Taquet et al., 2012b, 2013a). The lower deuterium fractionation of water with respect to that of formaldehyde and methanol is likely due to a different epoch of formation. Water would be mainly produced for typical molecular cloud conditions (low density and warm temperature) while most of formaldehyde and methanol would be formed afterwards, during the colder and denser prestellar phase. A low opr(H2), lower than , is also required to reproduce the observed deuterations (Taquet et al., 2013a).
Because of its high sensitivity to the variation of physical and chemical parameters, the deuterium fractionation can also be used to probe the chemical evolution through the formation of low-mass stars like the Sun. The comparison of the molecular content observed in prestellar cores and low-mass protostars with that found in Solar System comets and meteorites shows that the deuterium fractionation of water and organics decreases by several orders of magnitude (from 1 - 100 % to 0.01 - 0.1 %, see Ceccarelli et al., 2014). The decrease of the D/H ratio with the evolutionary stage of star formation can be interpreted by the chemical alteration of the molecular content in protoplanetary disks and in the solar nebula. Molecules observed in protostellar envelopes will be eventually recycled in protoplanetary disks due to the high turbulent mixing and the strong UV and X-ray radiation fields irradiating the disks (Furuya et al., 2013; Albertsson et al., 2014). The difference of deuteration could also come from the different scales probed by the astronomical observations and by the study of solar system bodies. Most of the meteorites and comets studied in our Solar System were initially relatively closed to the Sun ( AU) while most of sub-millimetric astronomical observations of low-mass protostars are sensitive to much larger scales of several hundreds/thousands of AU (see Ceccarelli et al., 2014).
New observations of deuterated water performed with the Herschel Space Observatory (Coutens et al., 2013a, b) as well as ground-based interferometers (Persson et al., 2013; Visser et al., 2013; Taquet et al., 2013b; Persson et al., 2014.) towards low-mass protostars have allowed astronomers to probe the deuteration of warm water originating from the inner regions of protostellar envelopes ( AU), and suggest that warm water shows a lower deuteration ([HDO]/[H2O] %) than the values derived in previous studies with single-dish telescopes (1 - 10 %, Liu et al., 2011; Coutens et al., 2012). Moreover, Coutens et al. (2013a, b) showed that the deuteration of cold water originating from the external envelope would be higher ( %) than the deuteration of warm inner water. These observations, therefore, suggest an evolution of the deuteration within protostellar envelopes encompassed by the large beam of single-dish telescopes used so far to study the deuteration of most of molecules. Consequently, astrochemical models have to to be coupled with evolutionary models to properly follow the deuteration within prestellar cores and protostellar envelopes. A previous attempt has been made by Aikawa et al. (2012) who followed the evolution of the molecular deuteration from molecular clouds to protostellar envelopes through the coupling of a gas-grain astrochemical model with a one-dimensional radiative hydrodynamic model. These authors showed an evolution of the chemical abundances of icy species and complex organics with the age of the protostar and gave predictions for their deuterium fractionation. However, they used a standard two-phase gas-grain astrochemical model which did not allow them to distinguish the chemical processes between the ice surface and the ice mantle, a crucial aspect for the modelling of deuterated ices (Taquet et al., 2012b), and did not include the effect of the spin states of H2 on the deuterium chemistry.
The ortho/para ratio of H2 is believed to evolve in molecular clouds from a high ortho/para ratio, induced by its formation at the surface of interstellar grains as recently observed in laboratory experiments (Watanabe et al., 2010) to its low Boltzmann value (), with a timescale comparable to the lifetime of molecular clouds ( yr, see Flower et al., 2006). The slow decrease of the opr(H2) is supported by the non-detection of DCO+ towards interstellar clouds outside dense cores which has been attributed by Pagani et al. (2011) to an opr(H2) higher to 0.1. Since interstellar ices start to form in translucent regions of molecular clouds, when the visual extinction exceeds mag (Whittet et al., 1988), a part of these interstellar ices would likely form when the opr(H2) is still high.
In this work, we aim at self-consistently studying the deuterium chemistry from molecular clouds to protostellar envelopes. For this purpose, we coupled our astrochemical model GRAINOBLE with a simple, but accurate, one-dimensional evolutionary model of core collapse and we included the spin states of H2 and light ions that are of crucial importance for the deuterium chemistry. We will focus our study on the formation, the deuteration and the evaporation of interstellar ices and complex organics, which are believed to be relevant for the prebiotic chemistry found in the Solar System (see Pizzarello & Huang, 2005; Mumma & Charnley, 2011). The physical code and the astrochemical model are described in section 2. In section 3, we present the evolution of the molecular deuteration by focusing our study on the main ice components and on complex organics formed at the surface of grains. We then discuss the implications of our work in section 4 and present our conclusions in section 5.
2. Model
2.1. Dynamical Model
This section describes the physical model used in this work to follow the formation of a prestellar core and its collapse, giving birth to a central protostar surrounded by a protostellar envelope. The physical evolution can be divided into three steps: 1) the static formation of the dense core for , where is defined as the beginning of the core contraction; 2) the collapse of the dense core for , where is the free-fall timescale of the core; 3) the birth of the protostar and the collapse of the protostellar envelope for , where is the timescale of the Class 0 stage, defined as the moment when the mass of the central protostar reaches half of the total (protostar+envelope) mass.
We considered 182 shells of gas and dust initially spaced between AU so they are spaced at logarithmic intervals for specific times during the Class 0 stage. Because the core is evolving dynamically, the position of each shell evolves with time, so it is necessary to solve the chemistry in a frame of reference comoving with the gas in the Lagrangian coordinates.
2.1.1 Static formation of the core
We followed the formation of the dense core by assuming a static contraction, starting from a homogeneous translucent sphere of a density embedded in surroundings by a visual extinction . During its static contraction, the core keeps a Plummer-like density profile obtained from this equation
| (2) |
where is the central density, is the characteristic radius inside which the density is uniform. Outside , the density follows a power-law r-η when . increases with time between and the central density of the observed core (see section 2.1.3) to reach different selected intermediate central densities in timescales given by their respective free-fall timescale. The choice of the intermediate and final central densities (and of their timescale) is explained in section 2.1.3 and is based on the observational estimates of molecular clouds ages. As is given by the product of the sound speed and the free-fall time of the central density (Keto & Caselli, 2010), decreases with .
2.1.2 Free-fall collapse
After its static formation, the dense core undergoes a free-fall collapse following the model developed by Whitworth & Ward-Thompson (2001). At , the collapse is triggered artificially, the density and velocity profiles as well as the accretion rate are followed with time from equations (4), (6), and (7) of Whitworth & Ward-Thompson (2001).
Due to the rapid accretion of the inner shells towards the center, a protostar is formed at the center of the envelope once , with
| (3) |
where is the proton mass. The gravitational energy of the collapsed mass is released radiatively as the material falls onto the protostar radius . The luminosity of the protostar is, therefore, given by
| (4) |
where is the mass of the protostar, and is the accretion rate. and are directly given the dynamical model and we derived from the work by Hosokawa & Omukai (2009) who computed the evolution of the star radius as function of the stellar mass, for different constant accretion rates. Since the accretion rate computed by our code evolves with time, we extrapolated their Fig. 14 by computing the averaged accretion rate at each timestep relative to the beginning of the protostar formation in order to derive an estimate of for each timestep.
2.1.3 Physical parameters
The density profile reached at the end of the static formation phase aims at modelling the starless core L1498. L1498 is thought to have a central density cm-3 and tends to be extended with a radius AU and presents a steep slope () (Tafalla et al., 2002).
| Name | ||||||||
|---|---|---|---|---|---|---|---|---|
| (cm-3) | (AU) | () | (yr) | (yr) | (yr) | (yr) | ||
| A-F | 4 | 5.0 | ||||||
| A-S | 4 | 5.0 | ||||||
| Observations |
The timescale for the static formation needed to reach the observed profile of the core is based on the timescale estimates derived from observations and models of molecular clouds. The lifetime of molecular clouds is still controversial as two main contradictory theories have been developed. The first one is a quasi-static theory in which clouds are closed to equilibrium, giving long timescales for the evolution of molecular clouds of Myr (Mouschovias et al., 2006). A more recent view of cloud evolution has been proposed, which is based on the importance of supersonic turbulent flows leading to a lack of equilibrium and giving, therefore, shorter timescales of 3-5 Myr (Hartmann et al., 2001). Chemistry can be used as a tracer for the age of molecular clouds. From the non-detection of DCO+ in dark clouds, Pagani et al. (2011) estimated an upper limit for the clouds age of 6 Myr. Consequently, we can reasonably assess that molecular clouds have a total lifetime of a few Myr. We then derived the total timescale of static formation based on the molecular cloud lifetime estimate and on the free-fall timescale of seven different Plummer-like cores with selected central densities between and (see also Lee et al., 2004a, for a similar method of static formation). Table 1 summarizes the physical properties of the core and compares the different timescales spent in the molecular cloud phase (i.e, when the central density is lower than yr). Model A-F is a model with a standard static formation while model A-S is a model with a two times longer static formation timescale.
2.2. Radiative transfer
We used the radiative transfer code DUSTY (Ivezic & Elitzur, 1997) to compute the dust temperature profile of the prestellar and protostellar cores at each timestep. We assumed , a reasonable assumption for protostellar envelopes (see for instance Maret et al., 2004) and for the central region of dark cores but not necessarily true at the outer edges of dark cores where the gas and dust are thermally decoupled due to the lower density (see Galli et al., 2002; Sipilä, 2012). We verified that this assumption is not important for the chemical abundance and deuteration of ices by running two simulations for the streamline at AU with two gas phase temperatures: K (the temperature assumed in the reference model) and K (corresponding to the kinetic temperature derived by Tafalla et al. (2004) at the edge of L1498). The largest differences for the deuteration and the chemical composition of ices are found to be about 30 %. The opacities of dust grains are taken from column 5 in Table 5 of Ossenkopf & Henning (1994) corresponding to grains showing a MRN size distribution covered by thin ice mantles at cm-3. This data has been successfully used in many works, such as those by van der Tak et al. (2000) and Evans et al. (2001) to model the emission of prestellar and protostellar envelopes.
The thermal structure of the prestellar core is derived from a slab geometry in which the core is irradiated by the Interstellar Radiation Field (ISRF) with a spectrum taken from Evans et al. (2001). We fixed the temperature at the edge of the cores to 17 K, following the values derived by Ward-Thompson et al. (2002) towards L1498 at AU ( ′). Once the protostar has formed at the center of the envelope, the temperature profile is computed with the sphere geometry structure. The effective temperature of the protostar and the grain temperature at AU, derived from the protostar luminosity, are given as input parameters to the DUSTY code.
2.3. Astrochemical model
2.3.1 Description of the model
To follow the interstellar gas-grain chemistry, we used our astrochemical model GRAINOBLE presented in previous studies (Taquet et al., 2012a, b, 2013a). GRAINOBLE couples the gas-phase and grain-surface chemistry with the rate equations approach introduced by Hasegawa et al. (1992). The grain surface chemistry processes are the following:
i) The accretion of gas phase species onto the surface of spherical grains
with a constant grain radius m.
ii) The diffusion of adsorbed species via thermal hopping.
iii) The reaction between two particles once they meet in the same
site via the Langmuir-Hinshelwood mechanism. The reaction rate is given
by the product of the number of times that the two reactants meet each other
and the transmission probability of reaction.
iv) The desorption of adsorbed species into the gas phase, via several processes:
- thermal desorption, which exponentially depends on the
binding energy of each species relative to the substrate (see Table
2 for a list of binding energies for selected species).
- cosmic-ray induced heating of grains following Hasegawa & Herbst (1993a)
and adapted for the binding energies considered in this work.
- chemical desorption caused by the energy release of exothermic
reactions. Following Garrod et al. (2007), we assumed a value of 0.012
for the factor (the ratio of the surface-molecule bond frequency
to the frequency at which energy is lost to the grain surface) for all
surface reactions as it seems to be the most consistent value given by
molecular dynamics simulations (Kroes & Andersson, 2005).
- UV photodissociation and photodesorption. Photodissociation and
photodesorption rates of hydrogenated species are derived from molecular
dynamics simulations (Andersson et al., 2008) while photodesorption rates
of CO, N2, O2 are taken from the experimental studies by
Fayolle et al. (2011, 2013).
| Species | E | E | E | Ref. |
|---|---|---|---|---|
| (K) | (K) | (K) | ||
| H | 660 | 500 | 45 | 1, 2, 3 |
| C | 800 | 800 | 800 | 4 |
| O | 800 | 800 | 800 | 4 |
| N | 800 | 800 | 800 | 4 |
| S | 1100 | 1100 | 1100 | 4 |
| H2 | 640 | 500 | 45 | 1, 2, 3 |
| O2 | 895 | 915 | 915 | 5, 6 |
| N2 | 790 | 790 | 790 | 7 |
| CO | 830 | 1150 | 855 | 5, 8, 6 |
| CO2 | 2270 | 2690 | 2270 | 5, 9 |
| H2O | 1870 | 5775 | 5775 | 10, 11 |
| NH3 | 5535 | 5535 | 3080 | 8, 12 |
| CH4 | 1090 | 1090 | 1090 | 13 |
| HCN | 2100 | 2100 | 2100 | 14 |
| H2CO | 3260 | 3260 | 3765 | 15 |
| CH3OH | 5530 | 5530 | 4230 | 8, 12 |
| C2H2 | 2600 | 2600 | 1830 | 16 |
| C2H4 | 3600 | 3600 | 2060 | 17 |
| HCOOH | 5570 | 5570 | 5000 | 8, 18 |
| CH3CN | 4680 | 4680 | 4680 | 8 |
| HCOOCH3 | 4630 | 4630 | 4000 | 19, 18 |
| CH3CHO | 3800 | 3800 | 3800 | 18 |
| CH3OCH3 | 4230 | 4230 | 3300 | 19, 18 |
| CH3CH2OH | 6795 | 6795 | 5200 | 19, 18 |
| NH2OH | 6250 | 6250 | 6250 | 20 |
| CH3COOH | 8155 | 8155 | 6300 | 19, 18 |
| CN | 1600 | 1600 | 1600 | 21 |
| CH | 870 | 870 | 870 | 22 |
| NH | 2380 | 2380 | 1560 | 23 |
| CH2 | 945 | 945 | 945 | 24 |
| NH2 | 3960 | 3960 | 2320 | 25 |
| CH3 | 1017 | 1017 | 1017 | 26 |
| OH | 1300 | 2820 | 2820 | 27, 11 |
| HCO | 2050 | 2200 | 2300 | 28 |
| CH3O | 3800 | 3800 | 4000 | 29 |
| C2 | 1600 | 1600 | 1600 | 30 |
| C2H | 2100 | 2100 | 1715 | 31 |
In this work, we adopted the multilayer approach developed by Hasegawa & Herbst (1993b) (see also Charnley & Rodgers, 2009; Garrod & Pauly, 2011; Garrod, 2013; Vasyunin & Herbst, 2013, for other models adopting a multilayer approach) to follow the multilayer formation and evaporation of interstellar ices since it allows a better treatment of the ice evaporation than the approach used in Taquet et al. (2012a, b, 2013a). The multilayer approach proposed by Hasegawa & Herbst (1993b) considers three sets of differential equations: one for gas phase species, one for surface species, and one for bulk species. The equations governing chemical abundances on the surface and in the bulk are linked via an additional term, proportional to the rate of growth or evaporation of the grain mantle. Surface species are continuously trapped into the bulk because of the accretion of new particles, unlike the approach by Taquet et al. (2012a) in which the trapping is carried out one layer at a time. Using the chemical network and the reference physical conditions adopted in Taquet et al. (2012a), we verified that the two methods give similar ice chemical compositions. The largest difference is found for methanol which shows a difference of 50 % at yr.
2.3.2 Gas phase chemical network
The initial chemical network was taken from the KIDA database and includes 11 elements (H, He, C, N, O, Si, S, Fe, Na, Mg, Cl) and 6250 reactions. It has then been extended to include the spin states of H2, H, and H and the deuterated isotopologues of hydrogenated species with four or less atoms, with some exceptions (see below).
We added the spin states of H2, H, and H into the KIDA chemical network following the method summarized by Sipilä et al. (2013) in which the separation of each chemical reaction including H2, H, or H depends on the type of the reaction. There are about 1150 reactions containing H2, H, and H, the ortho/para separation process results in 2150 reactions, increasing the number of reactions from 6250 to 7150 reactions.
The chemical network including the spin states of H2, H, H was then deuterated with the routine developed by Sipilä et al. (2013) (see also Rodgers & Millar, 1996; Aikawa et al., 2012; Albertsson et al., 2013, for other generated deuterated networks). Since we aim at following the deuteration of interstellar ices, we are particularly interested in the evolution of the atomic [D]/[H] abundance ratio in the gas phase. We, therefore, included deuterated forms of species with up to four atoms. All reactions including an hydrogenated species are cloned by assuming same rate coefficients. When the final position of the D atom is ambiguous, giving several sets of possible products, statistical branching ratios have been assumed. 2840 reactions containing species with up to four atoms have been deuterated, resulting in new 7900 reactions added to the network. We also deuterated the reactions involved in the gas phase chemical network of H2O, NH3, H2CO, and CH3OH and which contain molecules with more than four atoms (see Roberts & Millar, 2000, for a schematic picture of the water, ammonia, and formaldehyde networks).
Although we aim at investigating the deuterium fractionation of specific complex organics in the hot corino, we chose not to deuterate their formation and destruction reactions in the gas phase. Following recent state-of-the-art gas-grain astrochemical models, the current scenario is that complex organics are mostly formed at the surface of interstellar grains (Garrod et al., 2008) while gas phase reactions would alter their abundances and deuterations in a timescale higher than yr (Charnley et al., 1997; Aikawa et al., 2012). Due to the free-fall collapse model used in this work, molecules formed at the surface of grains stay in the warm gas phase after their evaporation for 100 yr before being accreted by the protostar. Gas phase reactions are therefore considered as negligible in the formation and the deuteration of complex organics.
The atomic [D]/[H] abundance ratio and the ortho/para ratio of H2 are mostly governed by deuterium fractionation reactions involving H+, H2, H, H, and their deuterated isotopologues (see Flower et al., 2006; Taquet et al., 2013a). Deuterium fractionation reactions of the H-H2 system have been introduced in the network with the reaction rate coefficients recently computed by Hugo et al. (2009). Deuteration reactions of the important H-H2, H-H, H+-H2, CH-H2, and C2H-H2 systems and recombinations on electronegative charged grains have also been included following Roberts & Millar (2000); Roberts et al. (2003, 2004); Walmsley et al. (2004) and Pagani et al. (2009). Finally, we considered the chemical network involved in the formation of deuterated water at warm temperatures and including neutral-neutral and radical-neutral reactions, following Thi et al. (2010). We therefore added about 3000 reactions to the deuterated KIDA network, resulting in a gas phase chemical network of 15260 reactions.
2.3.3 Surface chemical network
The formation of the main ice species (H2O, CO2, H2CO, CH3OH, NH3, CH4) along with their deuterated isotopologues was followed with the chemical network developed by Taquet et al. (2013a) from laboratory experiments showing the efficient formation of interstellar ice analogs on cold surfaces. The transmission probability of chemical reactions with activation energy barriers included in the water and carbon dioxide networks as well as the key reaction CO+H have been computed with the Eckart model. Transmission probabilities of addition, substitution, and abstraction reactions included in the methanol network have been deduced from the rates experimentally derived by Hidaka et al. (2009).
We also added the surface network introduced by Garrod et al. (2008) to form complex organics. Primary radical-primary radical, primary radical-secondary radical reactions, and reactions between aldehydes and H atoms have been incorporated to our network and extended to include their deuterated counterparts by assuming statistical branching ratios. The transmission probabilities through quantum tunneling of the aldehyde-H reactions have been computed by assuming rectangular energy barriers with a width Å. In total, the gas-grain chemical network includes about 2700 species and 24500 chemical processes.
For each species , the effective binding energy relative to the surface was derived from the fractional coverage of , and H2, (H2) on the surface layer and from the fraction of bare surface, lying under the surface layer, following this formula:
| (5) | |||||
where , , , and are the binding energies of species relative to amorphous solid water (ASW) ice, H2 ice, a bare (amorphous carbon or silicate) substrate and a pure ice. To deduce for all species, we applied the scaling factor
| (7) |
where is 45 K (Vidali et al., 1991). Table 2 lists the sets of binding energies of selected species for different substrates. In spite of their higher mass, deuterated isotopologues seems to show similar binding energies than their main isotopologue (see Taquet et al., 2013a, for a discussion of the binding energy values). We therefore assumed the same binding energies for all deuterated species and their main isotopologue.
2.3.4 Input parameters
The initial elemental abundances in the gas phase considered in this work are listed in Table 3. The elemental abundances of species other than He and HD correspond to the set EA1 from Wakelam et al. (2008). The initial abundances of He and HD are taken from the set EA2 from Wakelam et al. (2008) and from Linsky (2003), respectively.
| Species | Abundance |
|---|---|
| H2 | 0.5 |
| HD | |
| He | |
| C | |
| N | |
| O | |
| Si | |
| S | |
| Fe | |
| Na | |
| Mg | |
| Cl |
The value of the ortho/para ratio of H2 in molecular clouds is still highly uncertain. The initial value of H2 opr formed on grain surfaces is most likely 3, as recently confirmed by the experiment by Watanabe et al. (2010) conducted on amorphous solid water. However, proton-exchange reactions in the gas phase would then convert ortho-H2 to para-H2, decreasing the opr(H2) towards the Boltzmann value ( at 10 K, see Flower et al., 2006). Pagani et al. (2011) interpreted the non-detection of DCO+ towards dark cloud envelopes with an opr(H2) higher than 0.1. However, indirect estimates of H2 based on the comparison between observations of dark cores or cold protostellar envelopes with chemical models suggest lower values of about (Pagani et al., 2009; Dislaire et al., 2012; Le Gal et al., 2013). In this work, the standard value for the initial opr(H2) is set to . This value corresponds to an average between the values derived in the early stages (dark cloud envelopes) and the late stages (protostellar envelopes) of molecular evolution. Nevertheless, given the relative uncertainty of this value and its importance in the molecular deuteration process, we also studied the effect of other initial opr(H2) values ( and 3) on the ice deuteration.
We aimed at investigating the influence of some physical parameters on the formation and the deuteration of interstellar ices. Therefore, we assumed several values for the timescale of static formation, initial density, visual extinction and temperature at the edge of the core, listed in Table 4. We also considered an other core, model B, aiming at modelling the well-known core L1544, showing a higher central density cm-3, a smaller characteristic radius AU, and a shallower slope (Crapsi et al., 2007) than L1498.
As discussed in Taquet et al. (2012a) and Taquet et al. (2013a), the binding energy of light particles and the diffusion to binding energy ratio show distributions of values depending on the ice composition and morphology. We, therefore, explored several values for these two parameters in a range given by the literature.
We kept fixed the following other parameters:
- distance between two binding sites Å;
- cosmic-ray ionization rate s-1;
- interstellar radiation field (ISRF)
photons cm-2 s-1;
- cosmic ray induced radiation field (CRH2RF) photons cm-2 s-1;
- scaling factor in multiples of the local interstellar field .
| Input parameters | Values |
|---|---|
| Type of core | A - B (see text) |
| (cm-3) | - |
| (mag) | 1 - 2 |
| (K) | 14 - 17 - 20 |
| (yr) | |
| o/p(H2) | - - 3 |
| 0.5 - 0.65 - 0.8 | |
| (H) (K) | 400 - 500 - 600 |
3. Results
3.1. Physical model validation
Figure 1 presents the physical (density, temperature, velocity) profiles and the accretion rate of the modelled core A-F as a function of time, from the beginning of the translucent phase to the end of the Class 0 stage. is defined as the beginning of the core collapse, negative times stand for the static formation of the dense core while positive times correspond the dynamical collapse of the core.
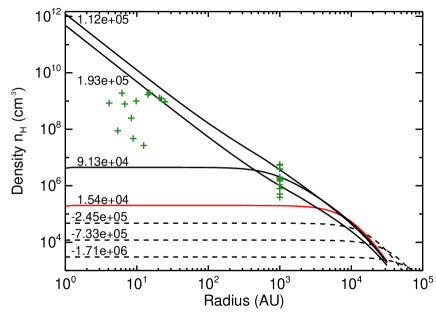
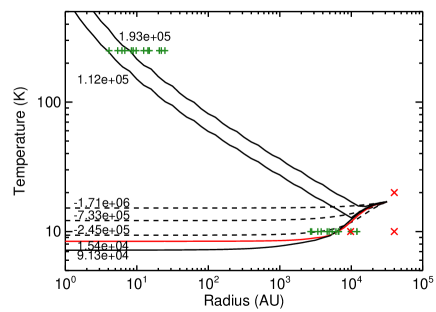
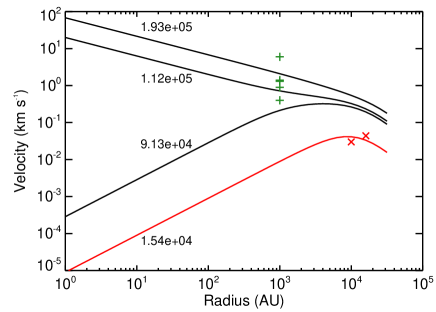
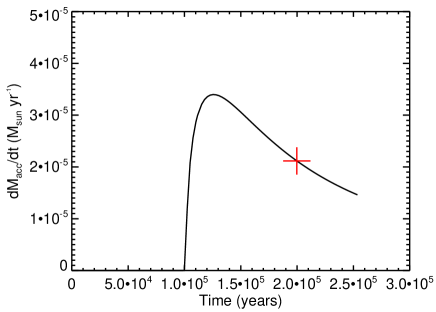
For , the core shows slow internal motions that decrease proportionally with the radius towards the center. The core keeps its Plummer-like structure, the density profiles are flat in the center at and steepen towards the edge. However, with time, the central density slowly increases while decreases. When one free-fall time is reached, all the shells located inside collapse almost simultaneously because of their similar free-fall timescale due to their nearly uniform density. It, therefore, induces a quick increase of the accretion rate, that allows the formation of the central protostar. The density profile quickly steepens at the center, the density at 10 AU increasing from less than to cm-3 in yr, and follows an asymptote with a power-law index of . Since the temperature profile increases with the protostar luminosity and the protostar mass, the temperature in the protostellar envelope also quickly increases from less to 10 K to 200 K at 10 AU. After the formation of the central protostar, the accretion rate slowly decreases because of the slow and gradual collapse of each shell located outside .
In spite of its relative simplicity, the physical model used in this work is in fair agreement with the observations of molecular clouds, dense cores, and Class 0 protostars regarding their timescales and their physical profiles, as shown in Table 1 and Figure 1. Table 1 compares the lifetimes derived from the observations with the timescales obtained with the physical model. It can be seen that all the timescales obtained with the model lie in the range of values deduced from the observations, derived as explained below.
By analysing the IRAS survey carried out by Beichman et al. (1986), Ward-Thompson et al. (1994) estimated a total lifetime of Myr for prestellar cores detected in the submillimeter continuum. The more recent c2d Spitzer legacy project has yielded shorter lifetimes. Enoch et al. (2008) and Evans et al. (2009) estimated the lifetime of prestellar cores to be Myr with variation from cloud to cloud between 0.23 Myr in the Serpens cloud and 0.78 Myr in Perseus. A significant fraction of cores displays internal motions of contractions. The analysis of the line profiles of sources by Lee et al. (1999) has shown that 3 % of them display contraction signatures. However, more recent studies by Gregersen & Evans (2000) and Lee et al. (2004b) show that about 10-20 % of them are contracting. Assuming a total prestellar core lifetime between 0.23 and 0.78 Myr gives a lifetime of static cores and contracting cores of and yr, respectively. By comparing the number of Young Stellar Objects in different stages detected in various clouds, Evans et al. (2009) and Maury et al. (2011) estimated the lifetime of Class 0 protostars of yr and yr, respectively.
Figure 1 compares the physical profiles obtained with our model with observations of dark cores and low-mass protostars. Red crosses represent the temperatures and velocities obtained towards L1498 by Lee et al. (2001), Ward-Thompson et al. (2002), and Tafalla et al. (2004) from observations of CS, N2H+ and C18O transitions, from continuum observations obtained with ISO and from the modelling of the emission of NH3 line transitions assuming a thermal coupling between dust and gas, respectively. As can be seen in Fig. 1, the temperature and velocity profiles obtained with our model are in fair agreement with the observations at the edge of the core.
Green plus symbols in Figure 1 stand for the density, temperature, and velocity values derived by Kristensen et al. (2012) and Mottram et al. (2013) for a sample of low-mass protostars observed by the Herschel Space Observatory. For each model, only the observed protostars whose envelope masses are lower than the mass of the modelled core are shown. The density profiles obtained with our model are in good agreement with the observational values at 1000 AU while they are slightly higher than the values observationally derived at the inner regions ( AU) of the protostellar envelopes. The discrepancy probably results from the break of the 1D symmetry in the inner 100 AU and the eventual formation of protoplanetary disks during the Class 0 phase (see Pineda et al., 2012, for instance). The temperatures of the warm inner region reached at the end of the Class 0 phase lie in the range of the observed values while the predicted temperatures at the external part of the envelope seem to be slightly higher than the observations, probably induced by the coupling between the dust and gas temperatures assumed in our model. The velocity profiles in the external protostellar envelopes obtained with our model assuming a free-fall collapse lie in the range of the values derived observationally. However, the 1D free-fall collapse assumed in our model is not necessarily correct in the inner few hundreds of AU and would tend to overestimate the infall velocity occurring in the hot corino.
3.2. Chemical differentiation of ices in dark clouds
3.2.1 Reference model
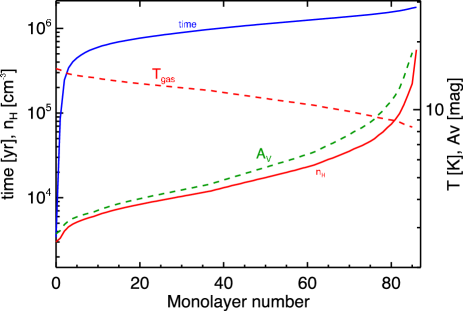
The physical model used in this work allows us to follow the multilayer formation of interstellar ices from the sparse translucent phase of molecular clouds to the dense and cold phase seen at the center of dark cores. Figures 2, 3, 4, and 5 present the evolution of the physical and chemical properties of a shell located at the center of the model A-F as a function of the ice deposition profile. The time corresponding to any layer represents the time at which the layer has been formed.
Fig. 2 shows the evolution of the physical properties (, , ) and time with the formation of ices. Most of the ice formation occurs in molecular clouds since about 80 % of the ice monolayers are formed when cm-3 and mag. Consequently, only 20 % of the ices has been formed in cold ( K) and dense ( cm-3) conditions.
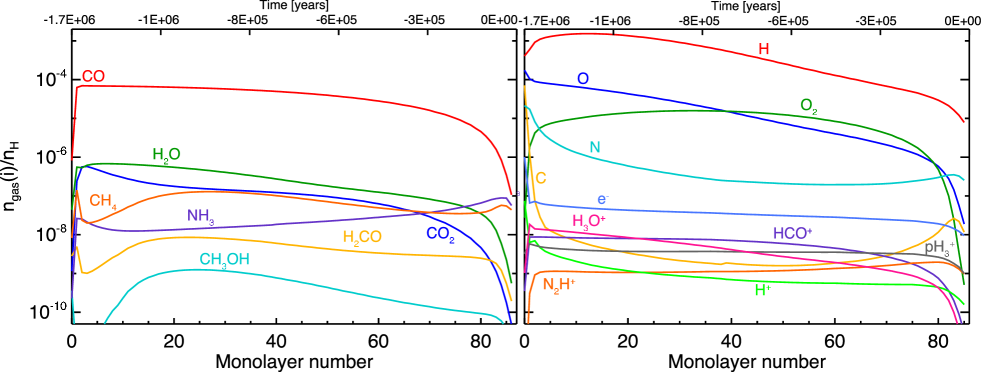
The evolution of the physical conditions induces an evolution of the gas phase chemistry shown in Fig. 3 for a selection of important gaseous species and for the main ice components. In particular, the abundances of atomic C, O, and N do not display the same evolution. Atomic C is quickly transferred to CO via reactions in the gas phase while the abundance of atomic O slowly decreases because of its freezes-out onto the grain surfaces forming icy species, or through reactions in the gas phase forming gaseous species such as O2. The modelled abundance of O2 is several orders of magnitude higher than the observations of molecular clouds carried out with space telescopes (see Larsson et al., 2007; Liseau et al., 2012). Atomic nitrogen shows a decrease of its abundance due to its freeze-out on the grains and through reactions in the gas phase. Since CO is the main destroyer of N2H+, its depletion in dense core conditions tends to re-increase the abundance of N-bearing species, such as N2H+, NH3 or N, at the end of the calculation. This effect has already been observed by Bergin et al. (2001) and Tafalla et al. (2002) and previously modelled by Bergin & Langer (1997) and Aikawa et al. (2001). The gas phase abundances of the main icy components lie within a few orders of magnitude since some species (CH3OH) are only formed at the surface of grains and are then evaporated through non-thermal processes while others (H2O, H2CO, NH3) can also be formed in the gas phase and show higher abundances.
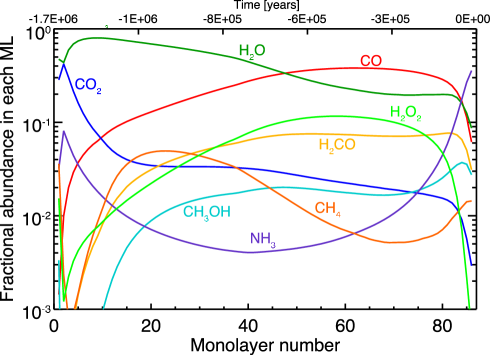
The mantle of cold interstellar ices is believed to be mostly inert (Watanabe et al., 2004). The chemical composition of each layer would, therefore, reflect the physical and chemical properties at the moment of its formation. Figure 4 shows the chemical composition of each layer within interstellar ices formed with our reference model. It can be seen that the ices are very heterogeneous and their chemical structure depends on the evolution of both the physical properties and the gas phase abundances (see also Garrod & Pauly, 2011; Taquet et al., 2013a; Vasyunin & Herbst, 2013). Water and carbon dioxide are mostly formed in the inner parts of ices when the density is limited with high atomic abundances, and when the temperature is warm, allowing the diffusion of heavier species, such as CO, O, or OH, to recombine together to form CO2. As the density increases and the temperature decreases with time, CO freezes-out onto the grains and is gradually destroyed to form H2CO and CH3OH instead of CO2. Interestingly, NH3 shows high abundances in the inner and outer parts of the ices. The high abundance in the inner part is due to the high abundances of H and N that favour the hydrogenation of atomic N on grains while the high abundance at the surface of the ice is due to the increase of N-bearing species in the gas phase at high CO depletions.
As mentioned in the introduction, the deuteration of gaseous and icy species depends on several physical (density, temperature) and chemical (opr(H2), (CO)) parameters. Hydrogenated icy species are mostly formed through hydrogenation reactions triggered by the irradiation of H atoms at the surface of interstellar grains. The atomic [D]/[H] abundance ratio in the gas phase, therefore, governs the deuteration on the ices.
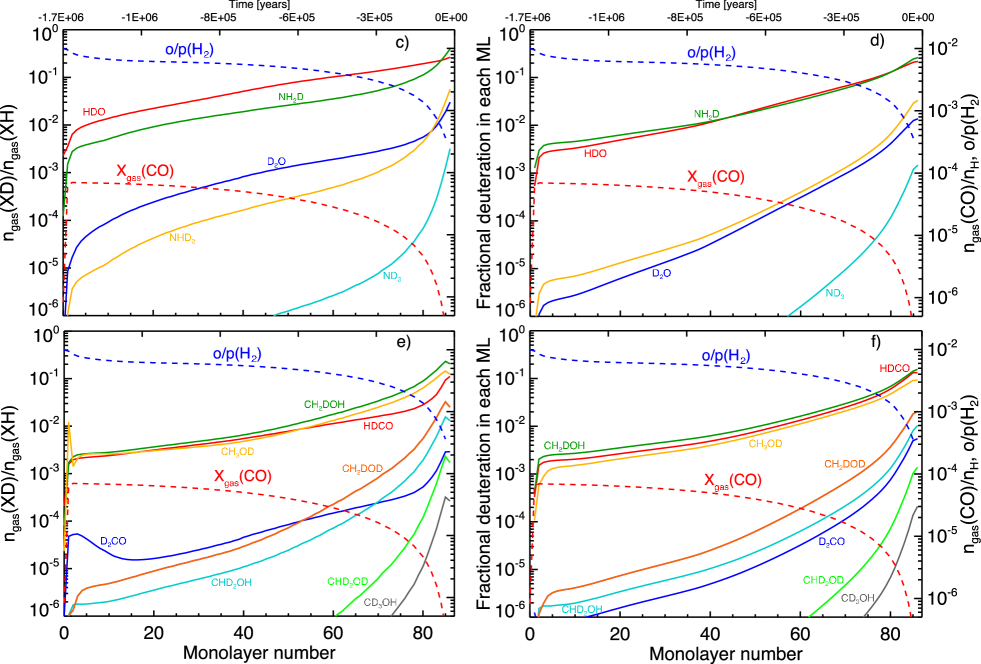
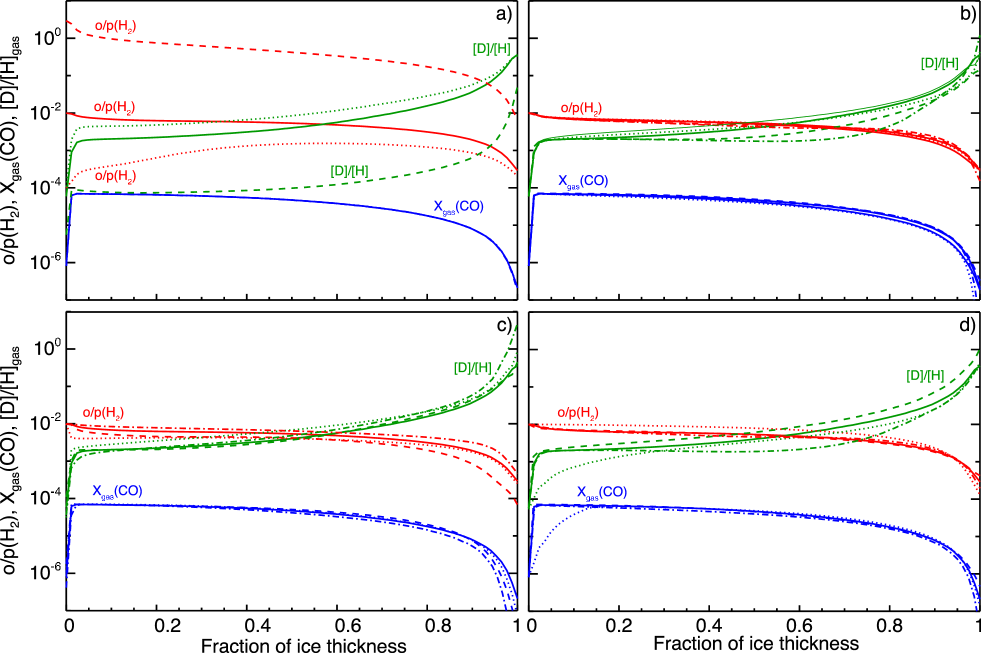
The effect of these two chemical parameters on the deuteration can be seen in Fig. 5 showing the evolution of the deuteration in the gas phase and in each ice monolayer, overplotted with the evolution of opr(H2) and (CO), whose values are shown on the right axis, as function of the ice deposition profile. The timescale needed to decrease opr(H2) and (CO) are similar to the timescale of the total ice formation. The two parameters slowly decrease during most of the ice formation, keeping high values ( and , respectively) up to 70-80 MLs, inducing a slight increase of the deuteration both in the gas phase and on ices. The decrease of these two crucial parameters is enhanced at the end of the ice formation for dense core conditions, and generates a sharp increase of the deuteration of doubly and even more triply deuterated species near the surface. It can be seen that the deuteration of water, ammonia, formaldehyde, and methanol in the gas phase reflects the deuteration within each monolayer which, in turn, roughly follows the evolution of the atomic D/H abundance ratio in the gas phase, reaching values higher than 10 % at the end of ice formation. Doubly deuterated species show fractionations higher than 1 % while triply deuterated forms of methanol show D/H ratios higher than at the surface.
The deuteration of gaseous water seems to be slightly enhanced compared to the evolution of the atomic D/H ratio and the deuteration of formaldehyde and methanol. It is due to its efficient deuteration in the gas phase through ion-neutral reactions, as also predicted by the gas phase calculations of Roberts et al. (2004). CH2DOH and CH3OD show similar deuteration profiles but their final abundances in the outermost layers differ by %. The difference is due to the abstraction reactions occurring only on the methyl group of methanol introduced in our chemical network following the experiments by Hidaka et al. (2009).
3.2.2 Influence of input parameters
We have investigated the influence of several physical and chemical parameters on the formation and the deuteration of interstellar ices. For this purpose, we varied the values of the parameters listed in Table 4 to our reference model. Table 7 and Table 8 of the Appendix present the ice composition and the deuteration of water, formaldehyde, and methanol obtained when the density reaches the observed value for the considered core (L1498: cm-3 for model A and L1544: cm-3 for model B).
The variation of the five physical properties (type of core, initial density, initial external visual extinction, initial external temperature, and timescale for the static formation) slightly influence the chemical composition of ices, in particular the conversion from CO to CO2 and to H2CO and CH3OH. CO2 is mainly formed at the beginning of the molecular cloud phase, through reactions involving heavy particles, at low-density and warm conditions ( K) while H2CO and CH3OH are rather formed in the external part of ices for dense and colder conditions. The increase of the initial density decreases the abundance of H atoms in the gas phase and, therefore, the efficiency of hydrogenation reactions forming formaldehyde and methanol in competition with the H2O and CH4 formation. The increase of the initial visual extinction decreases the photodesorption of reactive particles and, therefore, increases the efficiency of surface reactions. The increase of the temperature increases the mobility of heavy species allowing the formation of CO2, but also the mobility of H atoms in dense core conditions when the H/CO abundance ratio is high, enhancing the formation of formaldehyde and methanol.
The surface parameters, namely the binding energies of light particles and the diffusion to desorption energy ratio, strongly influence the chemical composition of ices because the rates of surface reactions depend exponentially on them. Therefore, the increase of and strongly decrease the abundances of surface molecules formed through reactions with activation energies (CO2, H2CO, and CH3OH). These two parameters are, therefore, the two most important parameters for the chemical composition of ices. By following the multilayer ice formation during a free-fall collapse with their Monte-Carlo model, Vasyunin & Herbst (2013) observed the same influence of the diffusion-to-binding energy ratio on the chemical composition of ices. The comparison of our modelling results with typical interstellar ice abundances deduced from infrared observations of ices show that, although the chemical composition of most species strongly depend on and , the reference models give predictions that are in fair agreement with observations. Overall, CO2 tends to be slightly underproduced while H2CO, CO, and NH3 show overpredictions of their abundances.
Not surprisingly, the most important parameter for the deuterium chemistry is the initial value of the opr of H2. Since the timescale needed to decrease the opr(H2) is similar to the timescale of total ice formation, a high initial opr(H2) value of 3 gives a final opr(H2) of (see Fig. 6 showing the evolution of the opr of H2, the CO abundance in the gas phase, and the atomic gaseous D/H abundance ratio as function of the normalized ice deposition profile for each model). The deuteration reactions are, therefore, strongly limited by the high abundance of o-H2 throughout the formation of dense cores, decreasing the deuterium fractionation of reactive ions, such as the p-D2H+/o-H2D+ and N2D+/N2H+ abundance ratios, by more than one order of magnitude. Since the overall deuteration of icy species is governed by the atomic D/H abundance ratio in the gas phase which is, in turn, mostly governed by the deuteration of H (Roberts et al., 2003; Taquet et al., 2012b), the deuteration in ices is also reduced by more than one order of magnitude.
The variation of other chemical and physical parameters has only a moderate impact on the atomic gaseous [D]/[H] abundance ratio and, therefore, on the ice deuteration since they do not influence the variation of opr(H2) and (CO) as it can be seen in Fig. 6. The three parameters roughly follow the same trend for all the parameters explored in this work, except when the opr(H2) is varied. The deuteration in ices is, therefore, almost independent of these parameters. The variation of the overall ice deuteration seen in Table 8 is mainly due to the variation of their moment of formation within ices. For instance, the increase of the initial temperature increases the abundance of methanol which is also located in the inner and less deuterated part of ices.
3.3. Spatial evolution in dark cores
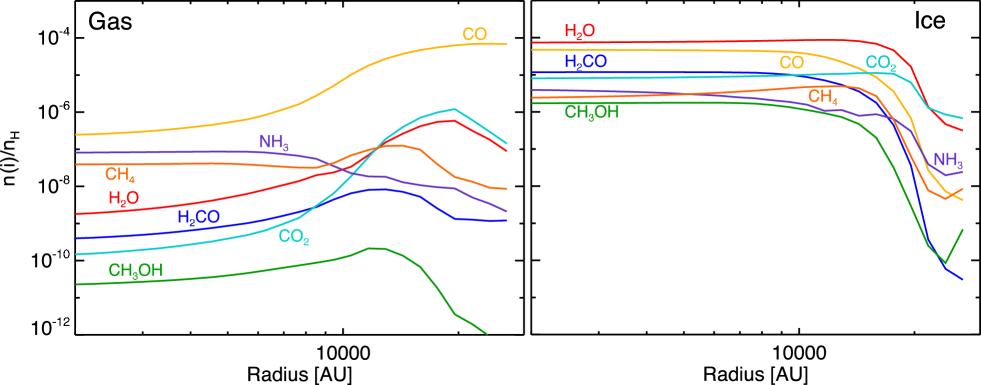
The abundances and deuterations profiles of the main ice components in the gas phase and in ices, obtained when the density profile reaches the observed profile of L1498, are shown in Figures 7 and 8. Every species shows a decrease of the abundance in ices towards the edge of the core, mainly due to the high flux of UV photons which photo-evaporates and photo-dissociates interstellar ices. However, the abundances of formaldehyde and methanol decrease more strongly, by five orders of magnitude, and at lower radius ( AU) than other species because of the warm temperature reached at the edge of the core that favours the CO2 formation from CO instead of formaldehyde and methanol. Unlike interstellar ices, the abundances in the gas phase of most of icy species tend to increase towards the edge of the core because they are governed by the balance between their formation through the evaporation from grains supported by an eventual formation in the gas phase (for CO, H2O, H2CO, or NH3) and their depletion through the freeze-out on grains in the center of cores or their photodissociation at the edge of the cores. Thus, the gas-phase abundances of most of species tend to deplete towards the center because of the increase of the density, enhancing the accretion rate, and the decrease of the temperature that decreases the evaporation rate. Species that are more strongly bound to the ices and that do not show any efficient formation in the gas phase, such as CO2 and CH3OH, display lower abundances at the center. In contrast, and as already discussed previously, NH3 abundance tends to increase towards the center of the core because its formation in the gas phase and on ices is enhanced by the CO depletion.
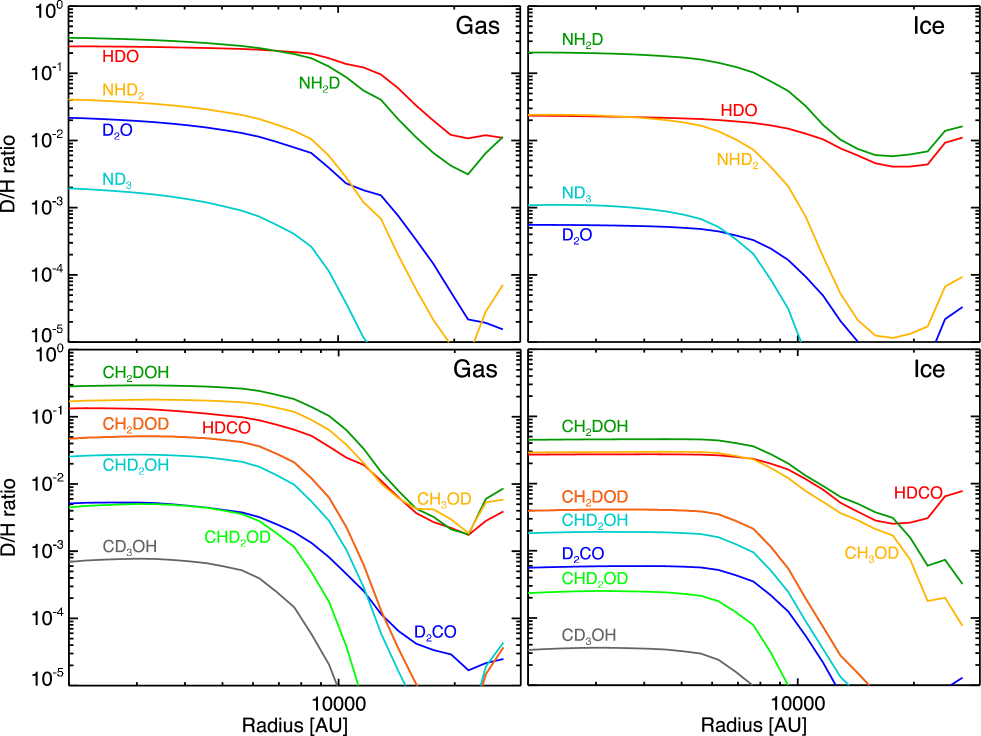
As shown in Fig. 8, the icy and gaseous deuterations of all species increase towards the center of the core, because of the increase of the density and the decrease of the temperature which decrease (CO) and opr(H2). The deuteration of all simply deuterated isotopologues is of a few percents in ices except for the deuteration of ammonia which is about 20 % because of its late formation. The deuteration of methanol decreases more strongly towards the edge of the core than for other species because CH3OH deuteration is not efficient at warmer temperatures while gas phase reactions can still account for the deuteration of H2O, H2CO, and NH3. The deuteration of all icy species in the gas phase is higher than the overall deuteration in ices by about one order of magnitude. This is due to the deuteration differentiation in ices; the deuteration of the gas phase roughly scales with the deuteration of the highly deuterated surface of ices while the overall deuteration in ices also includes the inner and poorly deuterated ice mantle.
3.4. Ice evaporation in Class 0 envelopes
Once the free-fall timescale of the core is reached, the protostar formation starts influencing the chemical abundance profiles through the warm-up of the protostellar envelope. Figure 9 presents the gas phase abundance profiles in the protostellar envelope of the collapsing core A-F for the main ice components obtained at the beginning and at the end of the Class 0 phase. As shown in section 3.1, the strong increase of the accretion rate induces a quick increase of the temperature in the protostellar envelope. The multilayer approach used to follow the evolution of interstellar ices induces complex abundance profiles with double abundance jumps for solid species that are more volatile than water (see also Vasyunin & Herbst, 2013; Garrod, 2013).
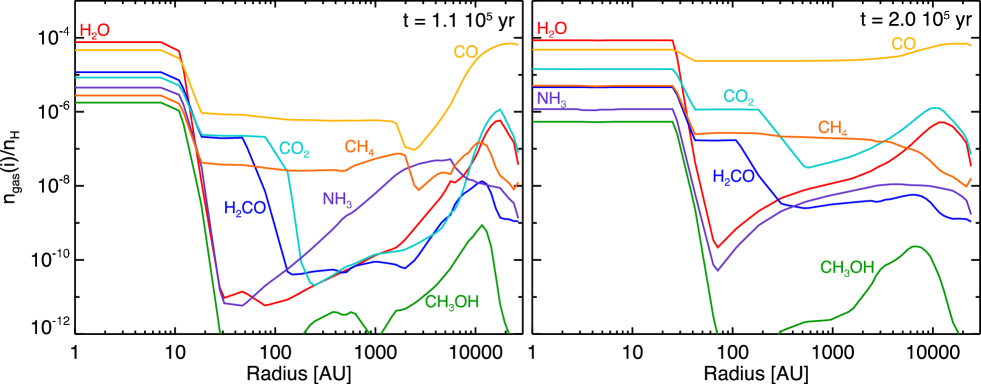
For species like CO, CO2, CH4, or H2CO, the abundance
profiles can be distinguished into three regimes:
i) the cold external envelope, where (where
is the temperature of sublimation of species ), in which the
abundance profile in the gas phase of each species is governed by
the balance between its formation from gas phase reactions and
photo-evaporation and its destruction through the freeze-out on grains
and its photodissociation.
The decrease of the abundances towards the protostar is due
to the increase of the density, as the accretion rate becomes more
efficient, and to the increase of the visual extinction, decreasing
the photodesorption rates.
ii) the cold intermediate envelope, where ,
in which a part of their icy content evaporates thermally when the
temperature reaches their temperature of sublimation through the
diffusion of volatile particles towards the surface.
However, most of their volatile content stays trapped into the ices.
iii) the warm inner envelope, where , in which all the
icy material is evaporated with water in the gas phase when K via the so-called
“volcano desorption” (Collings et al., 2004).
The abundance profiles of species showing similar or higher binding
energies than water do not display the second regime.
Since the temperature in the protostellar envelope increases with the age of
the protostar while the density decreases, the gas phase abundances
tend to increase with time, inducing a disappearance of the double
desorption peaks for some species, and an increase of the size of the
hot corino region.
As it can be seen in Figure 10, the deuteration of all species but ammonia is higher in the external envelope than in the hot corino. The D/H ratio predicted in the hot corino reflects the overall deuteration of ices whereas the deuteration of the external envelope is due to the sublimation of the highly deuterated ice surface through non-thermal processes and eventually supported by a gas phase chemistry. At the beginning of the Class 0 phase, the D/H ratio of simply deuterated species is about 10 times higher in the cold envelope, at AU, than in the hot corino, at AU. This is in good agreement with the difference of deuteration between icy and gaseous molecules predicted in dense cores. A peak of the deuteration is observed between 20 and 100 AU, corresponding the zone where interstellar ices start to sublimate at K during the fast collapse. Since deuterated species are mostly located at the surface, they mostly evaporate before their main isotopologue which are rather located in the inner part of the ice, increasing the D/H abundance ratio in the gas phase in the evaporation zone.
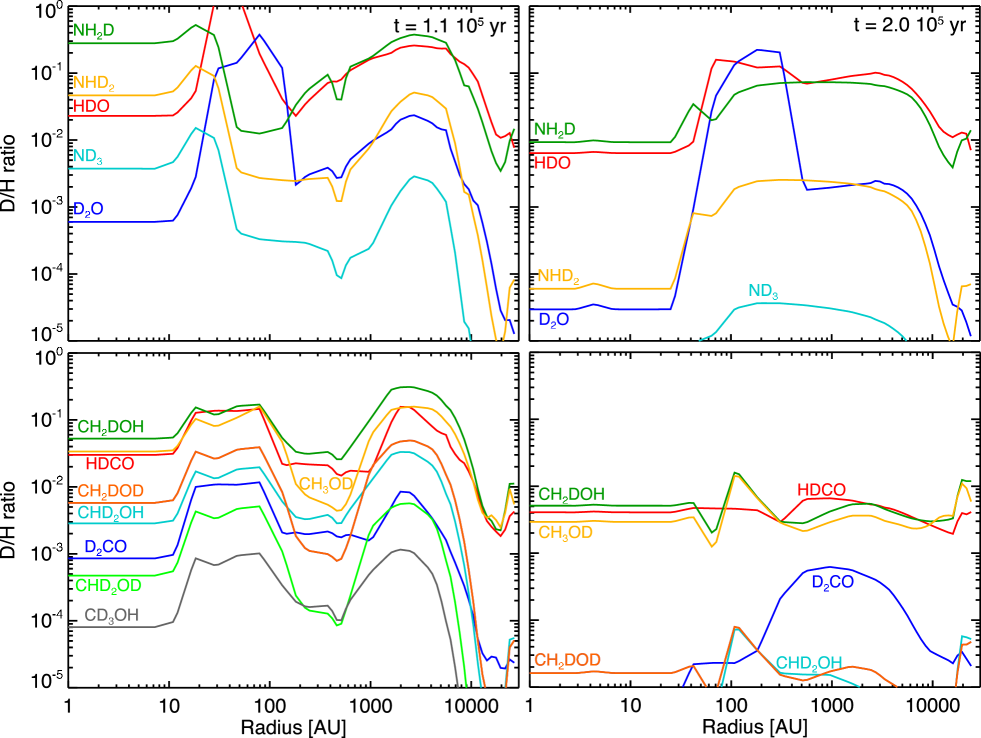
During the evolution of the Class 0 phase, the deuteration of simply and doubly deuterated species in the hot corino decrease by one and more than two orders of magnitude respectively, due to the gradual collapse of each shell of the envelope (see Table 6 for deuteration values of various species). At the beginning of the Class 0 phase, the gas seen in the hot corino ( AU) comes from the shells located at AU whereas the warm gas modelled at the end of the Class 0 phase originates from shells located at AU where the deuteration is lower. Although the deuteration of water in the hot corino decreases with the age of the protostar, its deuteration remains roughly constant in the external envelope. This is due to gas phase reactions and in particular to the recombination reactions between highly deuterated OH radicals, and their deuterated isotopologues, in the gas phase at K that form highly deuterated water.
3.5. Consequences on complex organics deuteration
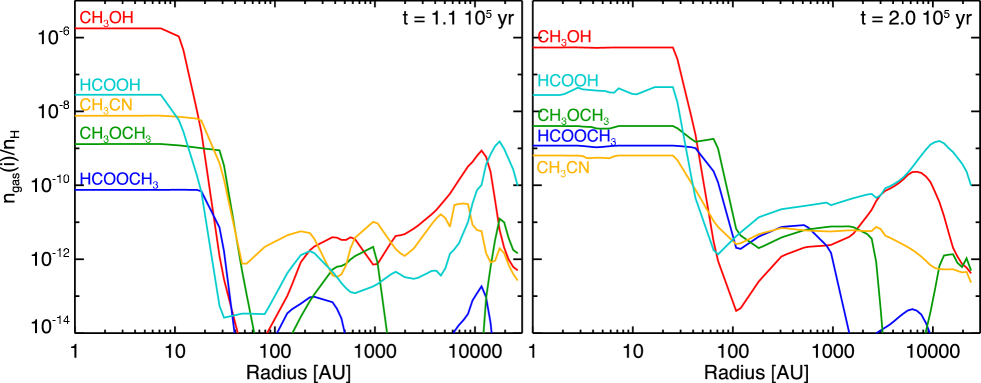
We modelled the formation and the deuteration of complex organics at the surface of interstellar grains through radical recombinations and hydrogenation reactions by incorporating the surface chemical network of Garrod et al. (2008). We only focused our study on a few prototype COMs; methyl formate (HCOOCH3), methyl cyanide (CH3CN), di-methyl ether (CH3OCH3), and formic acid (HCOOH) whose sub-millimetric spectra of their deuterated isotopologues have recently been measured in laboratories (Margulès et al., 2010; Cazzoli et a., 2011; Richard et al., 2013; Nguyen et al., 2013; Coudert et al., 2013), allowing recent and future detections towards low-mass protostars. Figure 11 presents the spatial distributions of the gas phase abundances of methanol and the four COMs in the protostellar envelope of the collapsing core A-F at the beginning and the end of the Class 0 phase.
In our model, methyl formate and di-methyl ether are mostly formed through radical recombination reactions (HCO + CH3O for methyl formate and CH3 + CH3O for di-methyl ether) at the surface of warm interstellar grains ( K), triggered by the photodissociation of the main ice constituents from the cosmic ray induced UV field. Formic acid is thought to be mostly formed in cold ices in dark clouds through the reaction sequence
| (8) |
as suggested by laboratory and theoretical works (Goumans et al., 2008; Ioppolo et al., 2011). The reaction between HCO and OH also plays a minor role. Two main routes play a major role in the formation of methyl cyanide as it can be formed either in cold ices through the hydrogenation sequence of C2N or during the warm-up phase through the radical recombination between CH3 and CN.
Complex organics desorb thermally in the hot corino when the temperature reaches their temperature of sublimation. A part of the particles formed on ices also evaporates through non-thermal processes at lower temperature, generating the complex abundance profiles shown in Fig. 11. The abundances of methyl formate and di-methyl ether tend to increase with the age of the protostar because the timescale of the warm-up phase (when K) required for an efficient formation of COMs increases with the age of the protostar. Like water and carbon dioxide, the abundance of formic acid remains roughly constant with the evolutionary stage because it is efficiently formed throughout the precursor dark core, unlike methyl cyanide whose abundance decreases by one order of magnitude because of its lower formation at the edges of the core.
The deuteration of the simply deuterated isotopologues of COMs in the hot corino is shown in Table 6 along with the deuteration of the main ice components. It can be seen that the deuteration roughly scales with the deuteration of their parent molecules. Since methyl formate and di-methyl ether are mostly formed at the external surface of warm ices from the photodissociation of highly deuterated formaldehyde and methanol, their deuterium fractionation is high (up to %) at the beginning of the Class 0 phase and decreases with time. The fractionation of HCOOCH2D is larger than that of DCOOCH3 because formaldehyde, forming HCO (and DCO) through photodissociation, is less deuterated than methanol, forming CH3O (and its deuterated isotopologues) at the surface of ices. A significant part of formic acid and methyl cyanide is formed in the less deuterated phase of dark clouds, their D/H abundance ratio is consequently lower (1 - 2 % and 3.5 %, respectively). As for the main ice species, the deuteration of COMs decreases with the age of the protostar from one to two orders of magnitude.
4. Discussion
4.1. Comparison with previous models
One of the goals of this work is the study of the spatial and temporal evolutions of the deuterium chemistry within protostellar envelopes. It is therefore worth comparing our results with those by Aikawa et al. (2012) although the two approaches differ slightly. Aikawa et al. (2012) adopted a more simple astrochemical model, assuming a homogeneous ice chemistry and neglecting the spin states of H2 and other ions important for the deuterium chemistry but they adopted a more sophisticated hydrodynamical model than ours.
The most striking difference is found for the spatial evolution of abundances and deuterations within prestellar cores. Our model predicts stronger decreases of the abundances and deuterations of the main icy species towards the edge of the core than the model by Aikawa et al. (2012). These differences are likely due to the use of the multilayer approach in this work which makes the ice chemistry much more dependent on the physical parameters than the standard approach that assumes homogeneous ices (see Taquet et al., 2012a). The temporal evolution of the gaseous deuteration predicted at the center of protostellar envelopes is consequently much stronger in our work than in the work by Aikawa et al. (2012).
The comparison of our “early phase” results (at yr, see Table 6) with those by Aikawa et al. (2012) at yr shows that the two works predict a similar evolution of the water deuteration, with a D/H ratio of a few percents in the inner region and % in the cold external envelope. However, the deuteration of ammonia, formaldehyde, and methanol is 2 to 20 times higher in our work, because of their late formation at the surface of interstellar ices when the gas phase D/H ratio is high. We also note a discrepancy in the predictions of the deuteration of the COMs since we predicted higher deuteration for methyl formate than for formic acid and methyl cyanide ( % versus %) while Aikawa et al. (2012) predicted a higher deuteration for methyl cyanide and formic acid (7 and 50 %) than for methyl formate (1 %).
4.2. Comparison with observations
4.3. Abundances
Table 7 of the Appendix compares the chemical composition of interstellar ices predicted by GRAINOBLE with infrared observations of ices towards dense cores. Observational data is taken from Öberg et al. (2011) who summarized results obtained by Boogert et al. (2011) towards a sample of dense cores and compared them with the Spitzer c2d Legacy ice survey carried out towards low-mass protostars. It can be seen that, even if surface parameters strongly influence the ice composition as discussed in section 3.2.2, the standard model seems to be in fair agreement with the ice observations, since the predicted abundance of most of species are close to the range of abundances given by the observations. However, the standard model tends to underpredict the formation of CO2 (10 % versus 38 %) in favour of CO (65 % versus 31 %), and overestimates the H2CO abundance compared to CH3OH. An increase of the external temperature of 3 K ( to 20 K) significantly increases the abundance of CO2 and CH3OH, showing observable values. In all of the models, H2CO is overproduced, implying that the destruction of H2CO, forming CH3OH, is not efficient enough. Laboratory studies have shown that H and D atoms can penetrate into a few surface layers (Watanabe et al., 2004; Ioppolo et al., 2010). The incorporation of such diffusion processes between several reactive surface layers in astrochemical models would, therefore, increase the efficiency of hydrogenation reactions and decrease the abundance of H2CO in favour of CH3OH.
Table 5 compares the predicted abundances of selected COMs with respect to that of methanol with the sub-millimetric observations towards a sample of low-mass protostars performed with single-dish telescopes. For a sake of consistency between all the molecules, all the observed values are derived from rotational diagram analysis, giving column densities averaged over the large beam of the single-dish telescope ( ″) that encompass the hot corino, and the cold external envelope. Absolute abundances are not presented since they strongly depend on the choice of the H2 column density, which is quite uncertain. The predicted abundance ratios are, therefore, derived from column densities averaged over a beam of a radius AU ( ″ at 200 pc, the averaged distance of the observed low-mass protostars).
| Model ( AU) | Observations | ||||||
|---|---|---|---|---|---|---|---|
| yr | yr | I16293 | I2A | I4A | I4B | Ref. | |
| H2CO | 870 | 1400 | 20 - 33 | 25 - 36 | 11 - 17 | 17 - 26 | 1, 2 |
| HCOOCH3 | 0.011 | 0.44 | 21 - 57 | 30 - 91 | 2.6 - 31 | 3, 4, 5 | |
| CH3OCH3 | 0.24 | 1.45 | 11 - 64 | 3, 4, 5 | |||
| CH3CN | 1.7 | 0.59 | 0.50 - 1.50 | 0.68 - 1.6 | 0.9 - 1.8 | 0.98 - 1.9 | 3, 4, 5 |
| HCOOH | 6.2 | 38 | 5.2 -6.5 | 0 - 12 | 3, 4, 5 | ||
As for ices, our model strongly overpredicts the abundance of H2CO in protostellar envelopes. We predict a gaseous H2CO/CH3OH abundance ratio of while the gaseous H2CO/CH3OH abundance ratio observed in the gas phase of protostellar envelopes is consistent with that observed in ices ( %), suggesting that the gas phase chemistry does not alter significantly their relative abundance after their evaporation. The comparison between predicted and observed abundances of COMs gives contrasting results. On the one hand, the abundance ratios of CH3CN and HCOOH are in good agreement with observations. While the predicted CH3CN abundance ratio tends to decrease with the age of the protostar, it remains within the range of observed values, which are roughly constant from source to source (between 0.5 and 1.9 %). The HCOOH abundance ratio predicted at the beginning of the Class 0 stage lie in the range of observed values while the late prediction slightly overestimates the ratio. On the other hand, the abundance of HCOOCH3 and CH3OCH3, considered as late-stage molecules, is underpredicted by our model by one to three orders of magnitude, showing that the formation of these molecules is still not completely understood. The predicted abundances of these two COMs barely exceed 1 % with respect to methanol whereas observations show that their abundance should easily exceed 10 % in some cases. Because of the fast collapse considered in our one-dimension model, molecules that are evaporated at K stay in the hot corino for yr before being accreted by the protostar. Warm gas phase chemistry is not efficient enough to produce complex organics in significant quantities (Horn et al., 2004). Experimental studies and molecular dynamics simulations have demonstrated that UV photons can penetrate into the inner part of interstellar ices, up to monolayers (Gerakines et al., 2001; Andersson et al., 2008), triggering a bulk chemistry induced by the mobility of photoproducts. Garrod (2013) introduced a three-phase approach in order to treat the bulk chemistry, allowing the formation of complex organics in the ice mantle. However, the predicted abundance ratios of HCOOCH3 and CH3OCH3 do not exceed 1 % for the three types of physical models considered in his work, suggesting that bulk chemistry does not seem to be efficient enough to produce complex organics.
4.3.1 Deuterium fractionations
The deuterium fractionation of various species predicted by our model is compared with sub-millimetric observations of low-mass protostars in Table 6. As for Table 5, the predicted deuterations are derived from the beam-averaged column densities for two typical sizes. AU corresponds to a small beam of 0.4 ″ obtained with sub-millimetric interferometers, such as PdBi, SMA, or ALMA, while AU corresponds to a large single-dish beam of 30 ″. As already mentioned in the introduction, the deuteration of water has been extensively studied in a sample of low-mass protostars with different telescopes (ground-based and space telescopes, single-dish and interferometers) and with different methods (standard LTE and non-LTE LVG models based on constant and spherical physical structures) giving contrasting results. By taking all the results together into account, the warm [HDO]/[H2O] ratio originating from the hot corino shows a large range of values, from 0.04 to 8 %, while the water deuteration of the cold envelope is about 0.3 - 18 % (see the discussion in Coutens et al., 2013b) which are in good agreement with our predictions since the predicted HDO/H2O and D2O/H2O abundance ratios decrease with the age of the protostar within the large range of values given by the observations. However, the more recent observations using sub-mm interferometers and the Herschel Space Observatory have refined the results. Interferometric observations, with high angular resolution allowing astronomers to probe the hot corino region of protostellar envelopes, have yielded low HDO/H2O abundance ratios of % (Persson et al., 2013, 2014.) while Herschel observations, more sensitive to the external envelope, show that the cold water shows a higher deuteration of % (Coutens et al., 2013b). This trend is confirmed by our astrochemical model. The deuteration in the hot corino scales with the overall deuteration of interstellar ices and includes the poorly deuterated inner mantle whereas the deuteration of the cold envelope, induced by the evaporation of highly deuterated ice surfaces and supported by the cold gas phase chemistry, remains roughly constant and shows higher values of a few %. The deuteration of water, therefore, increases with the size of the beam, by a factor 2 to 10, showing that the highly deuterated external and cold protostellar envelopes can contribute significantly to the overall deuteration observed with single-dish telescopes, in spite of their low abundance.
| Model | Low-mass protostars | Comets | ||||||||
| yr | yr | D/H | Source | Ref. | D/H | Source | Ref. | |||
| AU | AU | AU | AU | |||||||
| HDO | 2.3 | 4.5 | 0.65 | 2.2 | In: 0.04 - 8 | 4 protostars | 1 - 8 | 0.032 - 0.092 | 8 comets | 22, 23 |
| Out: 0.3 - 18 | 3, 6, 9 | |||||||||
| D2O | 0.062 | 0.11 | 0.0036 | 0.043 | In: 0.007 | IRAS 16293 | 3 | / | / | / |
| Out: 0.03 | 3 | |||||||||
| HDS | 4 | 3.8 | 0.54 | 0.65 | 5 - 15 | IRAS 16293 | 10 | Hale-Bopp | 24 | |
| D2S | 0.28 | 0.28 | 0.00094 | 0.0021 | 0.6 - 1.8 | IRAS 4A | 11 | / | / | / |
| NH2D | 29 | 31 | 0.99 | 4.3 | 7.0 - 10 | 2 protostars | 10, 12 | Hale-Bopp | 24 | |
| NHD2 | 5.1 | 3.8 | 0.0074 | 0.11 | 2.6 - 3.0 | IRAS 16293 | 13 | / | / | / |
| ND3 | 0.44 | 0.21 | 0.000057 | 0.0012 | 0.09 | NGC 1333 | 14 | / | / | / |
| DCN | 18 | 18 | 0.46 | 1.1 | 0.40 - 7.1 | 17 protostars | 15, 16 | 0.2 | Hale-Bopp | 25 |
| HDCO | 4.1 | 3.8 | 0.42 | 0.43 | 2.2 - 170 | 7 protostars | 15, 17 | Hale-Bopp | 24 | |
| D2CO | 0.18 | 0.16 | 0.00064 | 0.0092 | 4.6 - 44 | 7 protostars | 17 | / | / | / |
| CH2DOH | 5.5 | 5.6 | 0.51 | 0.51 | 37 - 65 | 4 protostars | 17 | Hale-Bopp | 24 | |
| CH3OD | 3.5 | 3.5 | 0.3 | 0.3 | 1.6 - 4.7 | 4 protostars | 17 | Hale-Bopp | 24 | |
| CHD2OH | 0.31 | 0.31 | 0.00078 | 0.00076 | 7.4 - 25 | 3 protostars | 17 | / | / | / |
| CD3OH | 0.0092 | 0.0092 | 0.0016 | 0.0016 | 0.20 - 1.4 | IRAS 16293 | 18 | / | / | / |
| DCOOCH3 | 9.2 | / | 0.0025 | / | 15 | IRAS 16293 | 19 | / | / | / |
| HCOOCH2D | 21 | / | 0.65 | / | / | / | / | / | / | / |
| CH2DOCH3 | 22 | / | 0.61 | / | 15 | IRAS 16293 | 20 | / | / | / |
| CH2DCN | 3.6 | / | 0.15 | / | 1.3 | IRAS 16293 | 21 | / | / | / |
| DCOOH | 2.3 | / | 0.58 | / | / | / | / | / | / | / |
| HCOOD | 1 | / | 0.66 | / | / | / | / | / | / | / |
Formaldehyde and methanol show very high deuterium fractionations, with observed HDCO/H2CO and CH2DOH/CH3OH abundance ratios of and %, respectively. Such high fractionations are not reproduced by our model, since the highest D/H ratios of formaldehyde and methanol, reached at the beginning of the Class 0 phase, are and %, respectively, a factor of 4 and 9 lower than the observed values. For all the protostars observed by Parise et al. (2006), the rotational diagram analysis give lower rotational temperatures for deuterated formaldehyde and methanol isotopologues than for their main isotopologue, suggesting that deuterated species would originate from colder regions than their main isotopologue. As shown in Fig. 8, the high observed deuteration can indeed be reached in the external envelope, between and 5000 AU but the absolute abundances of deuterated formaldehyde and methanol in the external envelope are too low to increase the beam-averaged deuteration. The CH3OD/CH3OH abundance ratio predicted at the beginning of the Class 0 phase lies in the range of observational values. CH3OD is thought to be formed only via addition reactions since abstraction reactions that enhance the deuteration of methanol seem to occur only on the methyl group of methanol. The abstraction reactions are, therefore, not efficient enough to increase the abundances of CH2DOH, CHD2OH, and CD3OH. As shown in Fig. 4, methanol is present in a significant part of ices, and not only in the outermost layers, as it was predicted in the pseudo-time dependent calculations assuming constant physical conditions (Taquet et al., 2012b). While the multilayer approach considered here only considers one reactive surface, the diffusion of H and D atoms into the bulk would tend to increase the deuteration of methanol and the [CH2DOH]/[CH3OD] abundance ratio since more CH3OH molecules will be available to react. Other processes, such as H/D exchange between water and methanol, or gas phase reactions can also play an important role in the evolution of the [CH2DOH]/[CH3OD] ratio (Charnley et al., 1997; Ratajczak et al., 2009).
The deuteration of methyl formate, methyl cyanide, and dimethyl ether, observed towards I-16293, are in fair agreement with our model predictions. They confirm that methyl formate and dimethyl ether, thought to be mainly formed from highly deuterated ices during the warm-up phase in protostellar envelopes, show higher deuterations than methyl cyanide which would also be formed in the cold anterior phase. This comparison tends to valid the formation mechanisms and the moment of formation of these three molecules. Now that sub-millimetric spectra have been measured and constrained by laboratory experiments for other COMs, the deuterium fractionation of COMs observed in protostellar envelopes can be used as a chemical tracer to understand their chemical history through the interpretation of their moment and their mechanisms of formation.
5. Conclusions
In this work, we have theoretically followed the chemical evolution of interstellar ices from the translucent phases of molecular clouds to the envelopes of low-mass protostars by focusing on their deuterium fractionation. For this purpose, we coupled a gas-grain astrochemical model, following the multilayer formation and the evaporation of ices, with a one-dimensional dynamical/radiative transfer model of collapsing core. The main conclusions of this work are summarized below.
1) Interstellar ices predicted by our model present a chemical heterogeneity, in agreement with infrared observations of ices. Water and carbon dioxide are mostly formed in the inner part of the ice mantle while carbon monoxide, formaldehyde, and methanol are closer to the ice surface. Ammonia is present in the innermost and outermost ice layers.
2) Interstellar ices display an evolution of the deuteration within the mantle, the deuteration of all species increasing towards the surface by several orders of magnitude. This is due to the slow formation of ices from the translucent phases of molecular clouds to the dense and cold phase of dense cores, and the slow decrease of two chemical parameters, the gas phase abundance of CO and the ortho/para ratio of H2, that limit the deuterium chemistry,
3) The multilayer approach used to follow the formation and the evaporation of ices induces double abundance jumps of icy species more volatile than water in protostellar envelopes. A part of the volatile content stays trapped into the ices when the temperature exceeds the temperature of sublimation and is released when water ice evaporates at K.
4) The deuteration of most hydrogenated species evolves within the envelopes of low-mass protostars. The deuteration predicted in the hot corino is generally lower than the deuteration of the external envelope. The difference of deuteration in the warm and cold envelopes is explained by the gradient of deuteration within interstellar ices. Only the external ice layers evaporate in the cold envelope through non-thermal processes while the inner part of ice mantles evaporates only in the hot corino.
5) The deuteration tends to decrease with the evolutionary stage of the protostar, due to the gradual collapse of the external shells of the protostellar envelope that are less deuterated because of their lower density.
6) We have modelled the deuteration of some complex organics (COMs) that are believed to be mainly formed at the surface of interstellar grains. The deuteration of COMs is very sensitive to their formation pathways and to their moment of formation, Consequently, the deuterium fractionation can be used as a tracer to interpret their chemical history.
7) The comparison with the observations gives contrasting results. The model successfully reproduces the evolution of the D/H abundance ratio of water within protostellar envelopes as recently observed with ground-based interferometers and the Herschel Space Observatory. It also reproduces the different D/H ratio of COMs recently observed with single-dish telescopes. However, it underestimates the very high deuteration of formaldehyde and methanol, suggesting that the understanding and the modelling of interstellar ices is still not well understood.
References
- Acharyya et al. (2007) Acharyya, K., Fuchs, G. W., Fraser, H. J., van Dishoeck, E. F. and Linnartz, H. 2007, A&A, 466, 1005-1012
- Aikawa et al. (2001) Aikawa, Y., Ohashi, N., Inutsuka, S.-i., Herbst, E. and Takakuwa, S. 2001, ApJ, 552, 639-653
- Aikawa et al. (2012) Aikawa, Y., Wakelam, V., Hersant, F., Garrod, R. T. and Herbst, E. 2012, ApJ, 760, 40
- Albertsson et al. (2013) Albertsson, T., Semenov, D. A., Vasyunin, A. I., Henning, T. and Herbst, E. 2013, ApJS, 207, 27
- Albertsson et al. (2014) Albertsson, T., Semenov, D. and Henning, T. 2014, ApJ, 784, 39
- Avgul & Kiselev (1970) Avgul, N. N. and Kiselev, A. V. 1970, Chem. Phys. Carbon, 6, 1
- Andersson et al. (2008) Andersson, S., van Dishoeck, E. F. 2008, A&A, 491, 907-916
- Beichman et al. (1986) Beichman, C. A., Myers, P. C., Emerson, J. P., Harris, S., Mathieu, R., Benson, P. J. and Jennings, R. E. 1986 ApJ, 307, 337-349
- Bergin & Langer (1997) Bergin, E. A. and Langer, W. D. 1997, ApJ, 486, 316
- Bergin et al. (2001) Bergin, E. A., Ciardi, D. R., Lada, C. J., Alves, J. and Lada, E. A. 2001, ApJ, 557, 209-225
- Bergman et al. (2011) Bergman, p. and Parise, B. and Liseau, R. and Larsson, B. 2011, A&A, 527, 39
- Bisschop et al. (2006) Bisschop, S. E., Fraser, H. J., Öberg, K. I., van Dishoeck, E. F. and Schlemmer, S. 2006, A&A, 449, 1297-1309
- Boogert et al. (2011) Boogert, A. C. A., Huard, T. L., Cook, A. M., Chiar, J. E. et al. 2011, ApJ, 729, 92
- Bottinelli et al. (2004) Bottinelli, S., Ceccarelli, C., Lefloch, B. et al. 2004, ApJ, 615, 354-358
- Bottinelli et al. (2007) Bottinelli, S., Ceccarelli, C., Williams, J. P. and Lefloch, B. 2007, A&A, 463, 601-610
- Caux et al. (2011) Caux, E., Kahane, C., Castets, A., Coutens, A., Ceccarelli, C. et al. 2011, A&A, 532, A23
- Cazaux et al. (2003) Cazaux, S., Tielens, A. G. G. M., Ceccarelli, C., Castets, A., Wakelam, V., Caux, E., Parise, B. and Teyssier, D. 2003, ApJ, 593, L51-L55
- Cazaux et al. (2011) Cazaux, S., Caselli, P. and Spaans, M. 2011, ApJ, 741, L34
- Cazzoli et a. (2011) Cazzoli, G., Puzzarini, C., Stopkowicz, S. and Gauss, J. 2011, ApJS, 196, 10
- Ceccarelli et al. (2014) Ceccarelli, C., Caselli, P., Bockelée-Morvan, D., Mousis, O., Pizzarello, S., Robert, F. and Semenov, D. 2014, PPVI
- Charnley et al. (1997) Charnley, S. B., Tielens, A. G. G. M. and Rodgers, S. D. 1997, ApJ, 482, L203
- Charnley & Rodgers (2009) Charnley, S. B. and Rodgers, S. B. 2009, Astronomical Society of the Pacific Conference Series, 420, 29
- Coudert et al. (2013) Coudert, L. H., Drouin, B. J., Tercero, B., Cernicharo, J., Guillemin, J.-C., Motiyenko, R. A. and Margulès, L. 2013, ApJ, 779, 119
- Coutens et al. (2012) Coutens, A., Vastel, C., Caux, E., Ceccarelli, C., Bottinelli, S., Wiesenfeld, L., Faure, A., Scribano, Y. and Kahane, C. 2012, A&A, 539, A132
- Coutens et al. (2013a) Coutens, A., Vastel, C., Cazaux, S., et al. 2013, A&A, 53, A75
- Coutens et al. (2013b) Coutens, A., Vastel, C., Cabrit, S., et al. 2013, A&A, 560, A39
- Collings et al. (2004) Collings, M. P., Anderson, M. A., Chen, R., Dever, J. W., Viti, S., Williams, D. A. and McCoustra, M. R. S. 2004, MNRAS, 354, 1133-1140
- Congiu et al. (2012) Congiu, E., Fedoseev, G., Ioppolo, S., Dulieu, F., Chaabouni, H., Baouche, S., Lemaire, J. L., Laffon, C., Parent, P., Lamberts, T., Cuppen, H. M. and Linnartz, H. 2012, ApJ, 750, L12
- Crapsi et al. (2007) Crapsi, A., Caselli, P., Walmsley, M. C. and Tafalla, M. 2007, A&A, 470, 221-230
- Crovisier et al. (2004) Crovisier, J., Bockelée-Morvan, D., Colom, P., Biver, N., Despois, D., Lis, D. C. et al. 2004, A&A, 418, 1141-1157
- Cuppen & Herbst (2007) Cuppen, H. M., Herbst, E. 2007, ApJ, 668, 294
- Demyk et al. (2010) Demyk, K., Bottinelli, S., Caux, E., Vastel, C., Ceccarelli, C., Kahane, C. and Castets, A. 2010, A&A, 517, A17
- Dislaire et al. (2012) Dislaire, V., Hily-Blant, P., Faure, A., Maret, S., Bacmann, A. and Pineau Des Forêts, G. 2012, A&A, 537, A20
- Enoch et al. (2008) Enoch, M. L., Evans, II, N. J., Sargent, A. I., Glenn, J., Rosolowsky, E. and Myers, P. 2008, ApJ, 684, 1240-1259
- Evans et al. (2001) Evans, II, N. J., Rawlings, J. M. C., Shirley, Y. L. and Mundy, L. G. 2001, ApJ, 557, 193-208
- Evans et al. (2009) Evans, II, N. J., Dunham, M. M., Jørgensen, J. K., Enoch, M. L., Merín, B., van Dishoeck, E. F., Alcalá, J. M., Myers, P. C., Stapelfeldt, K. R., Huard, T. L., Allen, L. E., Harvey, P. M., van Kempen, T., Blake, G. A., Koerner, D. W., Mundy, L. G., Padgett, D. L. and Sargent, A. I. 2009, ApJS, 181, 321-350
- Fayolle et al. (2011) Fayolle, E. C., Bertin, M., Romanzin, C., Michaut, X., Öberg, K. I., Linnartz, H. and Fillion, J.-H. 2011, ApJ, 739, L36
- Fayolle et al. (2013) Fayolle, E. C., Bertin, M., Romanzin, C., Poderoso, H. A. M., Philippe, L., Michaut, X., Jeseck, P., Linnartz, H., Öberg, K. I. and Fillion, J.-H. 2013, A&A, 556, A122
- Flower et al. (2006) Flower, D. R., Pineau Des Forêts, G., Walmsley, C. M. 2006, A&A, 449, 621-629
- Fraser et al. (2001) Fraser, H. J., Collings, M. P., McCoustra, M. R. S. and Williams, D. A. 2001, MNRAS, 327, 1165-1172
- Furuya et al. (2013) Furuya, K., Aikawa, Y., Nomura, H., Hersant, F. and Wakelam, V. 2013, ApJ, 779, 11
- Galli et al. (2002) Galli, D., Walmsley, M. and Gonçalves, J. 2002, A&A, 394, 275-284
- Garrod et al. (2007) Garrod, R. T., Wakelam, V. and Herbst, E. 2007, A&A, 467, 1103-1115
- Garrod et al. (2008) Garrod, R. T., Weaver, S. L. W. and Herbst, E. 2008, ApJ, 682, 283-302
- Garrod & Pauly (2011) Garrod, R. T. and Pauly, T. 2011, ApJ, 735, 15
- Garrod (2013) Garrod, R. T. 2013, ApJ, 765, 60
- Gerakines et al. (2001) Gerakines, P. A., Moore, M. H. and Hudson, R. L. 2001, J. Geophys. Res., 106, 33381-33386
- Goumans et al. (2008) Goumans, T. P. M., Uppal, M. A. and Brown, W. A. 2008, MNRAS, 384, 1158-1164
- Gregersen & Evans (2000) Gregersen, E. M. and Evans, II, N. J. 2000, ApJ, 538, 260-267
- Hartmann et al. (2001) Hartmann, L., Ballesteros-Paredes, J. and Bergin, E. A. 2001 ApJ, 562, 852-868
- Hartogh et al. (2011) Hartogh, P., Lis, D. C., Bockelée-Morvan, D., de Val-Borro, M., Biver, N. et al. 2011, Nature, 478, 218-220
- Hasegawa et al. (1992) Hasegawa, T. I., Herbst, E. and Leung C. M. 1992, ApJ, 82, 167
- Hasegawa & Herbst (1993a) Hasegawa, T. I. and Herbst, E. 1993, MNRAS, 261, 83-102
- Hasegawa & Herbst (1993b) Hasegawa, T. I. and Herbst, E. 1993, MNRAS, 263, 589-606
- Hidaka et al. (2009) Hidaka, H., Watanabe, M., Kouchi, A. and Watanabe, N. 2009, ApJ, 702, 291-300
- Herrero et al. (2010) Herrero, V. J., Galvez, O., Maté, B. and Escribano, R. 2010, Phys. Chem. Chem. Phys., 12, 3164-3170
- Horn et al. (2004) Horn, A., Møllendal, H., Sekiguchi, O., Uggerud, E., Roberts, H., Herbst, E., Viggiano, A. A. and Fridgen, T. D. 2004, ApJ, 611, 605-614
- Hornekær et al. (2005) Hornekær, L., Baurichter, A., Petrunin, V. V. and Luntz, A. C., Kay, B. D. and Al-Halabi, A. 2005, J. Chem. Phys., 122, 12
- Hosokawa & Omukai (2009) Hosokawa, T. and Omukai, K. 2009, ApJ, 691, 823-846
- Hugo et al. (2009) Hugo, E., Asvany, O. and Schlemmer, S. 2009, J. of Chem. Phys., 130, 164302
- Ioppolo et al. (2010) Ioppolo, S. and Cuppen, H. M. and Romanzin, C. and van Dishoeck, E. F. and Linnartz, H. 2010, Physical Chemistry Chemical Physics (Incorporating Faraday Transactions), 12, 12065
- Ioppolo et al. (2011) Ioppolo, S., van Boheemen, Y., Cuppen, H. M., van Dishoeck, E. F. and Linnartz, H. 2011, MNRAS, 413, 2281-2287
- Loinard et al. (2001) Loinard, L., Castets, A., Ceccarelli, C. et al. 2001, ApJ, 552, L163-L166
- Ivezic & Elitzur (1997) Ivezic, Z. and Elitzur, M. 1997, MNRAS, 287, 799-811
- Jørgensen et al. (2004) Jørgensen, J. K., Schöier, F. L. and van Dishoeck, E. F. 2004, A&A, 416, 603-622
- Katz et al. (1999) Katz, N., Furman, I., Biham, O., Pirronello, V. and Vidali, G. 1999, ApJ, 522, 305-312
- Keto & Caselli (2010) Keto, E. and Caselli, P. 2010, MNRAS, 402, 1625-1634
- Kristensen et al. (2012) Kristensen, L. E., van Dishoeck, E. F., Bergin, E. A., Visser, R., Yıldız, U. A., San Jose-Garcia, I. et al. 2012, A&A, 2012, 542, A8
- Kroes & Andersson (2005) Kroes, G. J. and Andersson, S. 2005, IAU Symposium, 231, 427-442
- Larsson et al. (2007) Larsson, B., Liseau, R., Pagani, L., Bergman, P. et al. 2007, A&A, 466, 999-1003
- Lattelais et al. (2011) Lattelais, M., Bertin, M., Mokrane, H., Romanzin, C., Michaut, X., Jeseck, P., Fillion, J.-H., Chaabouni, H. et al. 2011, A&A, 532, A12
- Lee et al. (1999) Lee, C. W., Myers, P. C. and Tafalla, M. 1999, ApJ, 526, 788-805
- Lee et al. (2001) Lee, C. W., Myers, P. C. and Tafalla, M. 2001, ApJS, 136, 703-734
- Lee et al. (2004b) Lee, C. W., Myers, P. C. and Plume, R. 2004, ApJS, 153, 523-543
- Lee et al. (2004a) Lee, J-E., Bergin, E. A. and Evans, N. J. 2004, ApJ, 617, 360-383
- Le Gal et al. (2013) Le Gal, R., Hily-Blant, P., Faure, A., Pineau des Forêts, G., Rist, C. and Maret, S. 2013, in press
- Linsky (2003) Linsky, J. L. 2003, Space Science Reviews, 106, 49-60
- Liseau et al. (2012) Liseau, R., Goldsmith, P. F., Larsson, B., Pagani, L. et al. 2012, A&A, 541, A73
- Liu et al. (2011) Liu, F.-C., Parise, B., Kristensen, L., Visser, R., van Dishoeck, E. F. and Güsten, R. 2011, A&A, 527, A19
- Loinard et al. (2001) Loinard, L., Castets, A., Ceccarelli, C. et al. 2001, ApJ, 552, L163-L166
- Maret et al. (2004) Maret, S., Ceccarelli, C., Caux, E. et al. 2004, A&A, 416, 577-594
- Margulès et al. (2010) Margulès, L., Huet, T. R., Demaison, J., Carvajal, M., Kleiner, I., Møllendal, H., Tercero, B., Marcelino, N. and Cernicharo, J. 2010, ApJ, 714, 1120-1132
- Maury et al. (2011) Maury, A. J., André, P., Men’shchikov, A., Könyves, V. and Bontemps, S. 2011, A&A, 535, A77
- Mouschovias et al. (2006) Mouschovias, T. C., Tassis, K. and Kunz, M. W. 2006, ApJ, 646, 1043-1049
- Meier et al. (1998) Meier, R., Owen, T. C., Jewitt, D. C., Matthews, H. E., Senay, M., Biver, N., Bockelee-Morvan, D. Crovisier, J. and Gautier, D. 1998, Science, 279, 1707
- Mottram et al. (2013) Mottram, J. C., van Dishoeck, E. F., Schmalzl, M., Kristensen, L. E., Visser, R., Hogerheijde, M. R. and Bruderer, S. 2013, A&A, 558, A126
- Mumma & Charnley (2011) Mumma, M. J. and Charnley, S. B. 2011, ARA&A, 49, 471-524
- Noble et al. (2012a) Noble, J. A., Congiu, E., Dulieu, F. and Fraser, H. J. MNRAS, 2012, 421, 768-779
- Noble et al. (2012b) Noble, J. A., Theule, P., Mispelaer, F., Duvernay, F., Danger, G., Congiu, E. and Dulieu, F. and Chiavassa, T. 2012, A&A, 543, A5
- Öberg et al. (2009) Öberg, K. I., Garrod, R. T., van Dishoeck, E. F. and Linnartz, H. 2009, A&A, 504, 891-913
- Öberg et al. (2011) Öberg, K. I., Boogert, A. C. A., Pontoppidan, K. M., van den Broek, S., van Dishoeck, E. F., Bottinelli, S., Blake, G. A. and Evans, II, N. J. 2011, ApJ, 740, 109
- Oka (2004) Oka, T. 2004, J. Mol. Spectr., 228, 635
- Ossenkopf & Henning (1994) Ossenkopf, V. and Henning, T. 1994, A&A, 291, 943-959
- Nguyen et al. (2013) Nguyen, L., Walters, A., Margulès, L., Motiyenko, R. A., Guillemin, J.-C., Kahane, C. and Ceccarelli, C. 2013, A&A, 553, A84
- Pagani et al. (2009) Pagani, L., Vastel, C., Hugo, E., Kokoouline, V., Greene, C. H., Bacmann, A., Bayet, E., Ceccarelli, C., Peng, R. and Schlemmer, S. 2009, A&A, 494, 623-636
- Pagani et al. (2011) Pagani, L., Roueff, E. and Lesaffre, P. 2011, A&A, 739, L35
- Parise et al. (2002) Parise, B., Ceccarelli, C., Tielens, A. G. G. M. et al. 2002, A&A, 393, L49-L53
- Parise et al. (2004) Parise, B. and Castets, A. and Herbst, E. and Caux, E. and Ceccarelli, C. and Mukhopadhyay, I. and Tielens, A. G. G. M. 2004, A&A, 416, 159-163
- Parise et al. (2005) Parise, B., Caux, E., Castets, A., Ceccarelli, C., Loinard, L., Tielens, A. G. G. M. et al. 2005, A&A, 431, 547-554
- Parise et al. (2006) Parise, B., Ceccarelli, C., Tielens, A. G. G. M., Castets, A., Caux, E., Lefloch, B. and Maret, S. 2006, A&A, 453, 949-958
- Ratajczak et al. (2009) Ratajczak, A., Quirico, E., Faure, A., Schmitt, B. and Ceccarelli, C. 2009, A&A, 496, L21-L24
- Persson et al. (2013) Persson, M. V., Jørgensen, J. K. and van Dishoeck, E. 2013, A&A, 549, L3
- Persson et al. (2014.) Persson, M. V., Jørgensen, J. K., van Dishoeck, E. and Harsono, D. 2014, ApJ, in press.
- Pineda et al. (2012) Pineda, J. E., Maury, A. J., Fuller, G. A., Testi, L., García-Appadoo, D., Peck, A. B., Villard, E. et al. 2012, A&A, 544, L7
- Pizzarello & Huang (2005) Pizzarello, S. and Huang, Y. 2005, Geochim. Cosmochim. Acta, 69, 599-605
- Ratajczak et al. (2011) Ratajczak, A., Taquet, V., Kahane, C., Ceccarelli, C., Faure, A. and Quirico, E. 2011, A&A, 528, L13
- Richard et al. (2013) Richard, C., Margulès, L., Caux, E., Kahane, C., Ceccarelli, C., Guillemin, J.-C., Motiyenko, R. A., Vastel, C. and Groner, P. 2013, A&A, 552, A117
- Roberts & Millar (2000) Roberts, H. and Millar, T. J. 2000, A&A, 361, 388-398
- Roberts et al. (2002) Roberts, H., Fuller, G. A., Millar, T. J., Hatchell, J. and Buckle, J. V. 2002, A&A, 381, 1026-1038
- Roberts et al. (2003) Roberts, H., Herbst, E. and Millar, T. J. 2003, ApJ, 591, L41-L44
- Roberts et al. (2004) Roberts, H., Herbst, E. and Millar, T. J. 2004, A&A, 424,905-917
- Rodgers & Millar (1996) Rodgers, S. D. and Millar, T. J. 1996, MNRAS, 280, 1046-1054
- Roueff et al. (2005) Roueff, E., Lis, D. C., van der Tak, F. F. S., Gerin, M. and Goldsmith, P. F. 2005, A&A, 438, 585-598
- Sakai et al. (2009) Sakai, N., Sakai, T., Hirota, T. and Yamamoto, S. 2009, ApJ, 702, 1025-1035
- Sandford & Allamandola (1990) Sandford, S. A. and Allamandola, L. J. 1990, ApJ, 355, 357-372
- Sandford & Allamandola (1993) Sandford, S. A. and Allamandola, L. J. 1993, ApJ, 417, 815-825
- Sipilä (2012) Sipilä, O. 2012, A&A, 543, A38
- Sipilä et al. (2013) Sipilä, O., Caselli, P. and Harju, J. 2013, A&A, 554, A92
- Tafalla et al. (2002) Tafalla, M., Myers, P. C., Caselli, P., Walmsley, C. M. and Comito, C. 2002, ApJ, 569, 815-835
- Tafalla et al. (2004) Tafalla, M., Myers, P. C., Caselli, P. and Walmsley, C. M. 2004, A&A, 416, 191-212
- Taquet et al. (2012a) Taquet, V., Ceccarelli, C. and Kahane, C. 2012, A&A, 538, A42
- Taquet et al. (2012b) Taquet, V., Ceccarelli, C. and Kahane, C. 2012, ApJ, 748, L3
- Taquet et al. (2013a) Taquet, V., Peters, P. , Kahane, C., Ceccarelli, C., López-Sepulcre, A., Toubin, C., Duflot, D., Faure, A. and Wiesenfeld, L. 2013, A&A, 550, A127
- Taquet et al. (2013b) Taquet, V., López-Sepulcre, A., Ceccarelli, C., Neri, R., Kahane, C., Coutens, A., Vastel, C. 2013, ApJ, 768, L29
- Thi et al. (2010) Thi, W.-F., Woitke, P. and Kamp, I. 2010, MNRAS, 407, 232-246
- Tielens & Allamandola (1987) Tielens, A. G. G. M. and Allamandola, L. J. 1987, Interstellar Processes, eds. D. J. Hollenbach, & H. A. Thronson, 134, 397-469
- van der Tak et al. (2000) van der Tak, F. F. S., van Dishoeck, E. F., Evans, II, N. J. and Blake, G. A. 2000, ApJ, 537, 283-303
- van der Tak et al. (2002) van der Tak, F. F. S., Schilke, P., Müller, H. S. P., Lis, D. C., Phillips, T. G., Gerin, M. and Roueff, E. 2002, A&A, 388, L53-L56
- van Dishoeck et al. (1995) van Dishoeck, E. F., Blake, G. A., Jansen, D. J., and Groesbeck, T. D. 1995, ApJ, 447, 760
- Vastel et al. (2003) Vastel, C., Phillips, T. G., Ceccarelli, C. and Pearson, J. 2003, ApJ, 593, L97-L100
- Vasyunin & Herbst (2013) Vasyunin, A. I., Herbst, E. 2013, ApJ, 762, 86
- Vidali et al. (1991) Vidali, G., Ihm, G., Kim, H. and Cole, M. 1991, Surface Science Reports, 12, 4, 135-181
- Visser et al. (2013) Visser, R., Jørgensen, J. K., Kristensen, L. E., van Dishoeck, E. F. and Bergin, E. A. 2013, ApJ, 769, 19
- Wakelam et al. (2008) Wakelam, V. and Herbst, E. 2008, ApJ, 680, 371-383
- Wakelam et al. (2012) Wakelam, V., Herbst, E., Loison, J.-C., Smith, I. W. M. et al. 2012, ApJS, 199, 21
- Walmsley et al. (2004) Walmsley, C. M., Flower, D. R. and Pineau des Forêts, G. 2004, A&A, 418, 1035-1043
- Ward-Thompson et al. (1994) Ward-Thompson, D., Scott, P. F., Hills, R. E. and André, P. 1994, MNRAS, 268, 276-290
- Ward-Thompson et al. (2002) Ward-Thompson, D., André, P. and Kirk, J. M. 2002, MNRAS, 329, 257-276
- Watanabe et al. (2004) Watanabe, N., Nagaoka, A., Shiraki, T. and Kouchi, A. 2004, ApJ, 616, 638-642
- Watanabe et al. (2010) Watanabe, N., Kimura, Y., Kouchi, A., Chigai, T., Hama, T. and Pirronello, V. 2010, ApJ, 714, L233-L237
- Weaver et al. (2008) Weaver, H. A., A’Hearn, M. F., Arpigny, C., Combi, M. R., Feldman, P. D., Tozzi, G.-P., Dello Russo, N. and Festou, M. C. 2008, LPI Contributions, 1405, 8216
- Whittet et al. (1988) Whittet, D. C. B., Bode, M. F., Longmore, A. J. et al. 1988, MNRAS, 233, 321-336
- Whitworth & Ward-Thompson (2001) Whitworth, A. P. and Ward-Thompson, D. 2001, ApJ, 547, 317-322
| Model | H2O | CO2 | CO | H2CO + | CH3OH | NH3 | CH4 |
|---|---|---|---|---|---|---|---|
| HCOOH | |||||||
| A | 100 | 10.5 | 64.8 | 16.3 | 2.4 | 6.0 | 3.0 |
| B | 100 | 10.9 | 93.9 | 16.3 | 1.8 | 12.0 | 1.5 |
| A, cm-3 | 100 | 10.5 | 64.8 | 16.3 | 2.4 | 6.0 | 3.0 |
| A, cm-3 | 100 | 7.7 | 56.7 | 13.1 | 1.9 | 13.2 | 6.7 |
| A-F, mag | 100 | 8.6 | 74.9 | 12.5 | 1.3 | 5.2 | 1.0 |
| A-F, mag | 100 | 10.5 | 64.8 | 16.3 | 2.4 | 6.0 | 3.0 |
| A, = 14 K | 100 | 7.5 | 81.7 | 11.3 | 1.0 | 6.0 | 0.5 |
| A, = 17 K | 100 | 10.5 | 64.8 | 16.3 | 2.4 | 6.0 | 3.0 |
| A, = 20 K | 100 | 26.2 | 33.7 | 19.6 | 10.9 | 6.0 | 7.9 |
| A, yr | 100 | 10.5 | 64.8 | 16.3 | 2.4 | 6.0 | 3.0 |
| A, yr | 100 | 8.7 | 45.9 | 13.3 | 2.3 | 10.0 | 5.9 |
| A-F, | 100 | 14.9 | 5.4 | 7.8 | 20.8 | 4.5 | 20.0 |
| A-F, | 100 | 10.5 | 64.8 | 16.3 | 2.4 | 6.0 | 3.0 |
| A-F, | 100 | 9.6 | 93.3 | 1.4 | 0.0 | 6.3 | 0.4 |
| A-F, K | 100 | 12.1 | 37.4 | 19.7 | 12.1 | 4.4 | 6.6 |
| A-F, K | 100 | 10.5 | 64.8 | 16.3 | 2.4 | 6.0 | 3.0 |
| A-F, K | 100 | 34.3 | 73.7 | 13.3 | 1.5 | 8.4 | 0.8 |
| A-F, o/p(H2) = 10-4 | 100 | 10.5 | 64.7 | 16.2 | 2.4 | 6.0 | 3.0 |
| A-F, o/p(H2) = 10-2 | 100 | 10.5 | 64.8 | 16.3 | 2.4 | 6.0 | 3.0 |
| A-F, o/p(H2) = 3 | 100 | 10.5 | 64.9 | 16.4 | 2.4 | 5.8 | 3.0 |
| Observations | 100 |
| Gas phase deuteration | ||||||||
| Model | p-D2H+/-oH2D+ | N2D+ | HDO | D2O | HDCO | D2CO | CH2DOH | CHD2OH |
| A | 1.60(-01) | 7.76(-01) | 2.40(-01) | 1.80(-02) | 1.02(-01) | 3.32(-03) | 2.30(-01) | 1.60(-02) |
| B | 1.73(-01) | 1.75(+00) | 2.58(-01) | 4.57(-02) | 1.11(-01) | 1.28(-03) | 9.00(-02) | 2.56(-03) |
| A, cm-3 | 1.60(-01) | 7.76(-01) | 2.40(-01) | 1.80(-02) | 1.02(-01) | 3.32(-03) | 2.30(-01) | 1.60(-02) |
| A, cm-3 | 2.78(-01) | 1.28(+00) | 2.46(-01) | 1.97(-02) | 9.51(-02) | 4.09(-03) | 3.00(-01) | 3.01(-02) |
| A-F, mag | 1.42(-01) | 6.86(-01) | 2.37(-01) | 1.71(-02) | 9.58(-02) | 2.84(-03) | 2.03(-01) | 1.22(-02) |
| A-F, mag | 1.60(-01) | 7.76(-01) | 2.40(-01) | 1.80(-02) | 1.02(-01) | 3.32(-03) | 2.30(-01) | 1.60(-02) |
| A, 14 K | 1.16(-01) | 6.98(-01) | 2.15(-01) | 1.61(-02) | 4.00(-02) | 9.60(-04) | 7.38(-02) | 1.44(-03) |
| A, 17 K | 1.60(-01) | 7.76(-01) | 2.40(-01) | 1.80(-02) | 1.02(-01) | 3.32(-03) | 2.30(-01) | 1.60(-02) |
| A, 20 K | 2.27(-01) | 7.47(-01) | 2.49(-01) | 1.70(-02) | 1.74(-01) | 8.54(-03) | 3.49(-01) | 4.12(-02) |
| A, yr | 1.60(-01) | 7.76(-01) | 2.40(-01) | 1.80(-02) | 1.02(-01) | 3.32(-03) | 2.30(-01) | 1.60(-02) |
| A, yr | 3.11(-01) | 1.18(+00) | 2.33(-01) | 1.09(-02) | 8.65(-02) | 3.84(-03) | 3.43(-01) | 3.93(-02) |
| A-F, | 1.13(-01) | 2.94(-01) | 2.17(-01) | 8.63(-03) | 1.14(-01) | 7.87(-03) | 5.36(-01) | 1.33(-01) |
| A-F, | 1.60(-01) | 7.76(-01) | 2.40(-01) | 1.80(-02) | 1.02(-01) | 3.32(-03) | 2.30(-01) | 1.60(-02) |
| A-F, | 1.81(-01) | 1.10(+00) | 2.33(-01) | 1.88(-02) | 1.86(-02) | 8.31(-04) | 4.64(-02) | 5.24(-04) |
| A-F, K | 2.01(-01) | 8.89(-01) | 2.43(-01) | 1.45(-02) | 1.32(-01) | 5.06(-03) | 2.68(-01) | 2.30(-02) |
| A-F, K | 1.60(-01) | 7.76(-01) | 2.40(-01) | 1.80(-02) | 1.02(-01) | 3.32(-03) | 2.30(-01) | 1.60(-02) |
| A-F, K | 1.19(-01) | 4.56(-01) | 2.20(-01) | 1.49(-02) | 9.11(-02) | 3.53(-03) | 2.69(-01) | 2.11(-02) |
| A-F, o/p(H2) = 10-4 | 1.67(-01) | 7.09(-01) | 2.38(-01) | 1.76(-02) | 9.70(-02) | 3.08(-03) | 2.30(-01) | 1.62(-02) |
| A-F, o/p(H2) = 10-2 | 1.60(-01) | 7.76(-01) | 2.40(-01) | 1.80(-02) | 1.02(-01) | 3.32(-03) | 2.30(-01) | 1.60(-02) |
| A-F, o/p(H2) = 3 | 1.54(-02) | 4.24(-02) | 1.06(-01) | 6.89(-04) | 1.29(-02) | 6.41(-04) | 9.09(-03) | 2.43(-05) |
| Observations L1498 | / | 4.00(+00) | ||||||
| Observations L1544 | 2.30(-01) | 3.20(-01) | 4.00(-02) | |||||
| Ice deuteration | ||||||||
| HDO | D2O | HDCO | D2CO | CH2DOH | CHD2OH | |||
| A | 2.41(-02) | 5.24(-04) | 2.54(-02) | 4.26(-04) | 3.92(-02) | 1.23(-03) | ||
| B | 2.14(-02) | 2.59(-04) | 1.57(-02) | 9.59(-05) | 2.29(-02) | 1.55(-02) | ||
| A, cm-3 | 2.41(-02) | 5.24(-04) | 2.54(-02) | 4.26(-04) | 3.92(-02) | 1.23(-03) | ||
| A, cm-3 | 2.10(-02) | 5.96(-04) | 2.83(-02) | 7.20(-04) | 6.07(-02) | 3.19(-03) | ||
| A-F, mag | 2.69(-02) | 5.17(-04) | 3.41(-02) | 5.00(-04) | 6.12(-02) | 1.80(-03) | ||
| A-F, mag | 2.41(-02) | 5.24(-04) | 2.54(-02) | 4.26(-04) | 3.92(-02) | 1.23(-03) | ||
| A, 14 K | 2.47(-02) | 2.75(-04) | 2.20(-02) | 1.24(-04) | 3.42(-02) | 3.70(-04) | ||
| A, 17 K | 2.41(-02) | 5.24(-04) | 2.54(-02) | 4.26(-04) | 3.92(-02) | 1.23(-03) | ||
| A, 20 K | 2.36(-02) | 6.91(-04) | 1.78(-02) | 5.31(-04) | 1.42(-02) | 6.52(-04) | ||
| A, yr | 2.41(-02) | 5.24(-04) | 2.54(-02) | 4.26(-04) | 3.92(-02) | 1.23(-03) | ||
| A, yr | 2.32(-02) | 6.62(-04) | 3.35(-02) | 7.60(-04) | 6.01(-02) | 2.69(-03) | ||
| A-F, | 1.98(-02) | 1.53(-04) | 1.46(-02) | 2.48(-04) | 3.15(-02) | 2.12(-03) | ||
| A-F, | 2.41(-02) | 5.24(-04) | 2.54(-02) | 4.26(-04) | 3.92(-02) | 1.23(-03) | ||
| A-F, | 1.45(-02) | 9.67(-05) | 7.38(-03) | 2.02(-05) | 6.78(-03) | 3.33(-05) | ||
| A-F, K | 1.97(-02) | 5.10(-04) | 1.53(-02) | 3.76(-04) | 1.04(-02) | 3.52(-04) | ||
| A-F, K | 2.41(-02) | 5.24(-04) | 2.54(-02) | 4.26(-04) | 3.92(-02) | 1.23(-03) | ||
| A-F, K | 2.86(-02) | 6.16(-04) | 3.59(-02) | 7.04(-04) | 6.38(-02) | 2.37(-03) | ||
| A-F, o/p(H2) = 10-4 | 3.62(-02) | 9.32(-04) | 3.86(-02) | 6.86(-04) | 5.62(-02) | 1.89(-03) | ||
| A-F, o/p(H2) = 10-2 | 2.41(-02) | 5.24(-04) | 2.54(-02) | 4.26(-04) | 3.92(-02) | 1.23(-03) | ||
| A-F, o/p(H2) = 3 | 1.33(-03) | 1.59(-06) | 6.35(-04) | 5.43(-07) | 1.06(-03) | 1.35(-06) | ||