∎
Departamento de Astrofísica, Universidad de La Laguna, Tenerife, Spain
22email: jos@iac.es 33institutetext: B. G. Elmegreen 44institutetext: IBM Research Division, T.J. Watson Research Center, Yorktown Heights, NY 10598, USA
44email: bge@us.ibm.com 55institutetext: C. Muñoz-Tuñón 66institutetext: Instituto de Astrofísica de Canarias, E-38205 La Laguna, Tenerife, Spain
Departamento de Astrofísica, Universidad de La Laguna, Tenerife, Spain
66email: cmt@iac.es 77institutetext: D. M. Elmegreen 88institutetext: Department of Physics and Astronomy, Vassar College, Poughkeepsie, NY 12604, USA
88email: elmegreen@vassar.edu
Star formation sustained by gas accretion
Abstract
Numerical simulations predict that metal-poor gas accretion from the cosmic web fuels the formation of disk galaxies. This paper discusses how cosmic gas accretion controls star formation, and summarizes the physical properties expected for the cosmic gas accreted by galaxies. The paper also collects observational evidence for gas accretion sustaining star formation. It reviews evidence inferred from neutral and ionized hydrogen, as well as from stars. A number of properties characterizing large samples of star-forming galaxies can be explained by metal-poor gas accretion, in particular, the relationship between stellar mass, metallicity, and star formation rate (the so-called fundamental metallicity relationship). They are put forward and analyzed. Theory predicts gas accretion to be particularly important at high redshift, so indications based on distant objects are reviewed, including the global star formation history of the universe, and the gas around galaxies as inferred from absorption features in the spectra of background sources.
Keywords:
Galaxies: evolution Galaxies: formation Galaxies: general Galaxies: high-redshift Galaxies: star formation large-scale structure of Universe1 Introduction
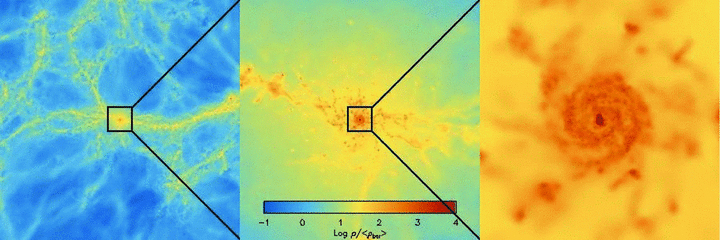
Numerical simulations predict that accretion of metal-poor gas from the cosmic web fuels the formation of disk galaxies (e.g., Dekel & Birnboim 2006, Dekel et al. 2009, Silk & Mamon 2012, Genel et al. 2012b; see also Fig. 1). The gas originally resides outside the virial radius of the dark matter (DM) halo that hosts the galaxy, and by accretion over cosmic time it becomes part of the pool of baryons that forms new stars. This cosmological gas supply has a strong dependence on redshift and halo mass. When the gas encounters a massive halo (), it becomes shock heated and requires a long time to cool and settle into the galaxy disk. For less massive haloes, cool gas streams can reach the inner halo or disk directly. This so-called cold-flow accretion may have an extreme impact on the disk, or it may provide a gentle gas supply that is transported radially in the disk. Since high redshift haloes tend to be low in mass, cold-flow accretion is predicted to be the main mode of galaxy growth in early times. Ultimately, the galaxies evolve into a quasi-stationary state (Sect. 2.1), where inflows and outflows balance the star formation rate (SFR), a phase that still goes on for most of them.
The importance of gas infall is as clear from numerical simulations as it is obscure to observations. This paper gives an overview of this rapidly evolving field, emphasizing the role of metal-poor gas accretion to sustain star formation in the local universe. We limit ourselves to the global picture, leaving aside details about star formation processes (Krumholz et al. 2012; Gnedin et al. 2014), stellar and active galactic nucleus (AGN) feedback (Silich et al. 2010; Hopkins et al. 2013a; Trujillo-Gomez et al. 2013), secular evolution (Binney 2013; Kormendy 2013), dense cluster environments (Santini 2011; Kravtsov & Borgani 2012), and the growth of black holes (BH) through cosmic gas accretion (Husemann et al. 2011; Chen et al. 2013). Other recent reviews covering cosmic gas accretion from different perspectives are in Sancisi et al. (2008), Silk & Mamon (2012), Combes (2014), Fraternali (2014), Conselice et al. (2013) (observationally oriented), Shlosman (2013), Benson (2010) (theoretically oriented), and Madau & Dickinson (2014) (emphasizing the high redshift aspects).
In addition to gas accretion, galaxies also grow through mergers (e.g, Guo et al. 2011; Kormendy 2013). Simulations suggest that direct accretion from the cosmic web dominates mergers by about an order of magnitude (e.g., Wang et al. 2011; L’Huillier et al. 2012; Combes 2013; van de Voort et al. 2011). For example, the Aquarius project to study galaxy formation in cold dark matter (CDM) haloes shows inside-out growth, with major mergers contributing less than 20 % to the total mass growth (Wang et al. 2011). These simulations indicate that most of the baryons from which visible galaxies form are accreted diffusely, rather than through mergers, and only relatively rare major mergers affect galaxy structure at later times. L’Huillier et al. (2012) use a multi-zoom simulation to quantify mass assembly and find that, on average, 77 % of growth is from smooth accretion, with 23 % from mergers. In dense regions, mergers play a more prominent role, although even there gas accretion still dominates the growth in the L’Huillier et al. simulations. Groups and clusters are the primary environments in which mergers are important. Since our review paper is focused on gas accretion driving star formation (SF), we do not consider dense environments but concentrate on the evolution of galaxies in relative isolation. For the same reason, we ignore satellite galaxies where ram pressure stripping and starvation are important.
This paper is organized as follows: Sect. 2 summarizes the expected properties of the cosmic gas that fuels SF. Section 2.1 puts forward a simple analytical model that intuitively explains how gas accretion controls SF. Section 2.2 describes the physical properties of accreting gas in numerical simulations, with outflows discussed in Sec. 2.3 and disk growth in Sect. 2.5. Section 3 reviews the evidence for gas accretion inferred from neutral (Sect. 3.1) and ionized hydrogen (Sect. 3.2). Evidence from stellar properties is included in Sect. 4. A number of observational properties characterizing large samples of star-forming galaxies can be explained if the SF is driven by metal-poor gas accretion. These properties are put forward and discussed in Sect. 5, specifically, the stellar mass-metallicity-SFR relationship (Sect. 5.1), the stellar mass-metallicity-gas mass relationship (Sect. 5.2), and the stellar mass-metallicity-size relationship (Sect. 5.3). Theory predicts gas accretion to be particularly important at high redshift. Section 6 reviews observational evidence for accretion at high redshift, starting with the SF history of the universe (Sect. 6.1). In addition, it treats the (secondary) role of mergers (Sect. 6.2), the evidence for gas around galaxies as inferred from absorption features in the spectra of background sources (Sect. 6.3), and the imaging of web gas through its emission (Sect. 6.4). Theory predicts that most of the gas going into stars in a typical SF episode is not recycled gas from previous star formation, but it comes from accretion. Section 7 collects the few measurements of the fraction of SF produced by gas accretion available so far. The review concludes by summarizing the role of gas accretion in star formation, and indicating several open issues to be explored in the future (Sect. 8). The acronyms and main symbols used along the text are listed in Table 1.
2 Cosmological accretion: basics
During the expansion of the Universe, cosmological gas that falls into the potential well of a DM concentration eventually shocks when it meets other gas and stops or deflects in its path (Rees & Ostriker 1977; White & Rees 1978; Binney 1977; Silk 1977). The post-shock temperature increases with the speed of the fall and therefore with the depth of the potential well, and this depth scales with the halo mass. At small enough halo mass, around for a modest metal abundance (Birnboim & Dekel 2003), the temperature is sufficiently low that the post-shock cooling time becomes short compared to the dynamical time. Then cooling behind the shock efficiently removes its pressure support and the shock collapses. This collapse is the result of an instability that occurs at a low effective adiabatic index, when the pressure increase following compression cannot offset the increase in self-gravity. If the shock collapses completely, then the gas may not be heated to the halo virial temperature until it mixes with the inner regions or hits the disk. The structures falling in are expected to take the form of filamentary streams or clouds (e.g., Kereš et al. 2005; Dekel et al. 2009). The importance of such cold streams is that the gas can reach the disk faster, so SF can begin sooner and achieve a rate that is within a factor of a few of the baryonic accretion rate in the halo (e.g., Brooks et al. 2009).
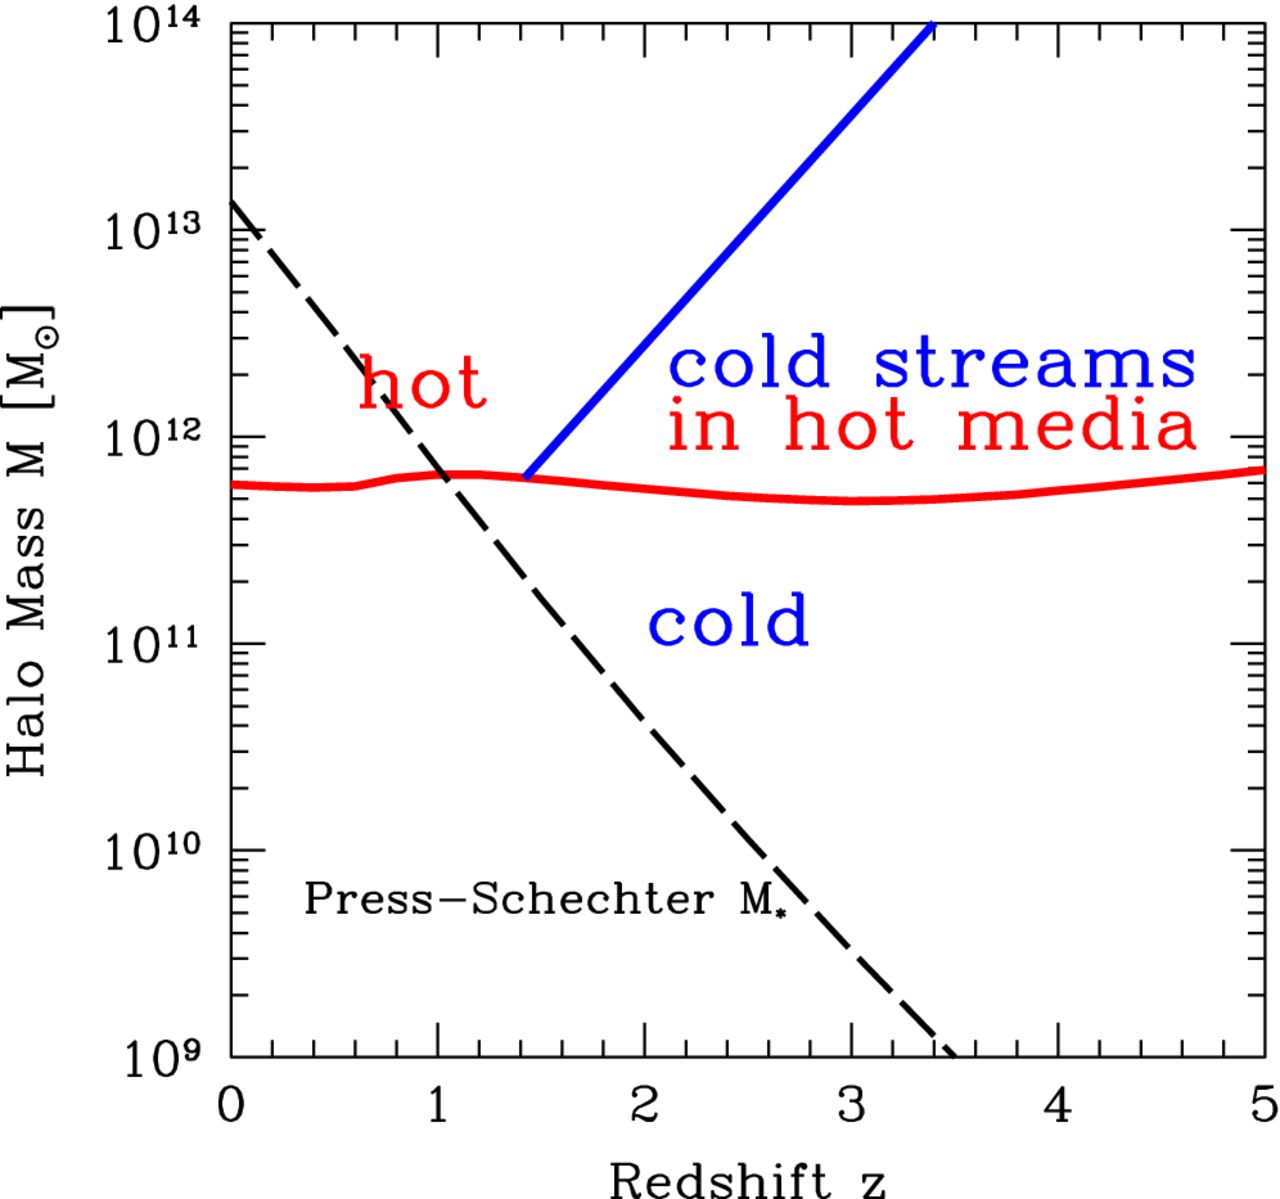
At early times, when galaxies were generally low-mass, and at recent times in the case of low-mass galaxies, a significant fraction of the gas from cosmological accretion remains cold and falls directly to the center (Birnboim & Dekel 2003; Semelin & Combes 2005; Stewart et al. 2011a; van de Voort et al. 2011). Figure 2 shows when the cold and hot accretion regimes operate as a function of halo mass and redshift (from Dekel et al. 2013). Haloes below are dominated by cold accretion at all redshifts, whereas even high mass galaxies at could have some cold accretion in streams that penetrate the surrounding hot haloes (see also Ocvirk et al. 2008; Dekel et al. 2009; Kereš et al. 2009; Stewart et al. 2011a).
Much progress has been made on the details of galaxy accretion since the early studies, with few changes to the basic conclusion that the cold fraction of accretion is determined by the dark halo mass. This section summarizes the physical properties of the gas that falls in and forms stars as predicted by recent numerical simulations. We outline expected observational properties, keeping in mind that the numerical methods used to carry out the simulations may matter for some important details since the resolution is not good enough to capture many of the physical processes controlling the gas infall (the typical mass resolution is about -; Brooks et al. 2009; van de Voort & Schaye 2012). For example, the moving mesh code AREPO gets less purely-cold gas at high halo mass than do smoothed particle hydrodynamics (SPH) codes because cold filaments break apart and mix with hot halo gas more readily in AREPO (Nelson et al. 2013). Similarly, Kereš et al. (2012), Vogelsberger et al. (2012) and Sijacki et al. (2012) found higher star formation rates with AREPO than SPH because realistic turbulent cascades in AREPO channel the energy to denser scales where it dissipates at a greater rate. Often simulations do not reach readshift and the predictions for the local universe come from higher , considering that the accretion decreases with time.
2.1 Simple analytical description
Quasi-stationary state.
Numerical simulations produce galaxies that are originally very dynamic, but as time goes on they enter a quasi-stationary phase were inflows and outflows balance the SFR (Finlator & Davé 2008; Schaye et al. 2010; Fraternali & Tomassetti 2012; Davé et al. 2012; Dekel et al. 2013; Bothwell et al. 2013; Feldmann 2013; Altay et al. 2013; Forbes et al. 2014). Such equilibrium follows naturally from the gas consumption timescale being shorter than the other relevant timescales in the problem. For example, in the local universe is on the order of 1-2 Gyr whereas the timescale for gas inflow from the web is some 7-8 Gyr (e.g., Lilly et al. 2013). Under this condition the gas inflow rate determines both the SFR and the mass of gas in the galaxy (Lilly et al. 2013). The latter is just the gas mass needed to maintain the SFR given the gas consumption time-scale. These conclusions follow from mass conservation, and can be summarized in a few analytical expressions which provide insight to understand the underlying physics.
Using equations from chemical evolution models (e.g., Edmunds 1990), the variation with time of the gas mass available to form stars is given by,
| (1) |
which considers the formation of stars (1st term on the right-hand side of the equation), the gas inflow rate , and the gas outflow rate . The symbol in Eq. (1) stands for the fraction of the stellar mass that returns to the interstellar medium (ISM) rather than being locked into stars and stellar remnants. For simplicity, the SFR produced by a given mass of gas is parameterized in terms of the star formation efficiency , or its inverse the gas consumption time-scale ,
| (2) |
The outflow rate is reasonably assumed to scale with the SFR,
| (3) |
with the so-called mass-loading factor. Provided that all scaling factors and are constant, the general solution of Eq. (1) is
| (4) |
Under the current assumption that is much shorter than the other relevant timescales, , and the source term only contributes to the integral in Eq. (4) when . When this stationary-state is reached, Eq. (4) becomes
| (5) |
showing that the SFR is set by the gas infall rate (corrected for returned fraction and outflows ). In addition, the mass of gas is also set by the infall rate to be the amount needed to maintain the SFR forced by the infall rate,
| (6) |
Equations (5) and (6) tell us that galaxies self-regulate to maintain the gas needed to produce a SFR set by the balance between inflows and outflows. We note that Eq. (2), and so Eq. (6), is a version of the Kennicutt-Schmidt (KS) relation (Schmidt 1959; Kennicutt 1998) stating that the SFR scales as a power of the gas mass, with power index close to one. The details of this relation are not as important on the scale of a whole galaxy as they are for kpc-scales, where observations still have some uncertainties (see the review in Kennicutt & Evans 2012). Observations suggest that goes from 0.5 to 2 Gyr for galaxies in the redshift range between 2 and 0 (e.g., Genzel et al. 2010; Gnedin et al. 2014). Theory suggests that scales with the instantaneous Hubble time as (Dekel et al. 2013).
In this stationary-state, a significant part of the SF relies on accreted gas because the gas in the disk that has been returned from previous stars (the returned fraction ) is not massive enough to maintain the level of SF very long. The fraction of SF that comes from gas that has never been processed by stars in the galaxy can be determined by dividing the gas into one component of this type, , and another component that has been inside a star, ,
| (7) |
where the subscripts f and p refer to fresh and processed gas, respectively. The fresh gas follows an equation identical to Eq. (1) but without the returned fraction , since the gas returned by stars is not fresh gas,
| (8) |
This equation states that all of the cosmic accretion adds to the fresh gas reservoir, which is depleted by star formation (both the locked-up mass and the returned mass) and by winds that are proportional to the SFR. We have assumed that winds carry away fresh gas in proportion to its mass, because the fresh and processed components should mix before significant star formation begins in them, and then both get dragged out by mass loading in the wind. These are reasonable assumptions since the time during which the gas is able to mix before star formation occurs in it, on average, is the consumption time, , and this is generally much longer than the turbulent crossing time in the ISM. There could be some situations, however, where fresh gas is not well mixed with processed gas before it gets into a star, and then the young star metallicity in those regions could be less than the average in the ISM. The evolution of is given by,
| (9) |
showing that the only source of processed gas is the mass that has been returned from star formation, while the loss of is from star formation and winds, as for the fresh gas loss. Since Eq. (8) is formally identical to Eq. (1), it admits a solution like Eq. (5) with . Then the ratio between the SFR in fresh gas, , and the total SFR is given by,
| (10) |
The ratio decreases with increasing returned fraction and with decreasing outflows, but it is never small. Even for large returned fractions (e.g., Edmunds 2005; Leitner & Kravtsov 2011; Torrey et al. 2012) and moderate outflows (e.g., Zahid et al. 2012, ; see also Sect. 2.3), is as large as 58 %. If then Eq. (10) yields , which implies that when outflows are very important most of the SF during a gas consumption time is due to gas fallen in over that time.
The mass in metals can be expressed using a differential equation similar to Eq. (1) (e.g., Edmunds 1990). It can be formally solved as indicated above, and the stationary-state solution gives a metallicity,
| (11) |
The symbol stands for the stellar yield, i.e., the mass of new metals eventually ejected per unit mass locked into stars. represents the metallicity of the infall gas, which is usually much smaller than the metallicity of the disk gas. In this case Eq. (11) points out that the gas metallicity is independent of mass inflow rate, SFR or mass of gas. just depends on stellar physics ( and ) and on the outflows through the mass loading factor . This holds true even when , SFR and the stellar mass vary with time, provided they do it with a timescale longer than . Equation (11) implies that in a stationary state, the rate at which metal mass in the ISM is locked up into stars equals the rate at which new metal mass is ejected into the ISM by stars. This is how the metal mass fraction in the ISM can stay constant in the stationary state. The ISM does not necessarily have such an equilibrium because the disk gas mass and star formation rate fluctuate in time as a result of accretion fluctuations. Z in Eq. (11) depends on the mass loading factor to compensate for the metal lost in outflows – increasing is equivalent to decreasing the effectiveness of SF to produce metals. It is as if were smaller which forces the equilibrium metallicity to be smaller as well. These results were originally found by Larson (1972) in the context of the G dwarf problem discussed in Sect. 4.
Deviations from the stationary state.
The stationary state described above represents a useful idealization that has to be abandoned when the infall rate changes in a short time scale. This is expected to happen quite often in view of the clumpy and stochastic nature of the infall accretion (Sect. 2.2). Thus deviations from the stationary state are needed to understand the observed relationship between stellar mass, metallicity and SFR treated in Sect. 5.1. In addition, a young universe could have a relatively long gas consumption time, and then the SFR cannot keep up with the accretion rate. Observations of this imbalance were suggested by Reddy et al. (2012) who found at an accretion rate from the KS relation that is 2 to 3 times larger than the SFR during galaxy build-up.
Average mass infall rate.
Cosmological accretion drives star formation. It is primarily dark matter accretion carrying along baryons – intermittent but with a marked global trend. The average mass accretion rate into haloes of mass at redshift may be approximated by a formula in Dekel et al. (2013; see also Lilly et al. 2013 and Davé et al. 2012),
| (12) |
where . Approximating by , and integrating equation (12) over time for an Einstein-deSitter Universe (which relates time and redshift), the mass and accretion rate become (Dekel et al. 2013)
| (13) |
| (14) |
The fiducial mass corresponds to the mass at , which would be today’s mass if . The baryonic accretion rate is approximately the dark matter accretion rate multiplied by the cosmological baryonic mass fraction, . The gas accretion rate depends on the faction of these baryons that get to the star-forming part in the center of the halo, , so that,
| (15) |
For the Milky Way (MW) today with , , , and (e.g., Peng & Maiolino 2014), Eqs. (12) and (15) render an infall rate .
2.2 Expected properties of accreted gas
Generally speaking, gas accretion from the cosmic web occurs in two modes, hot and cold, both taking place simultaneously in all galaxies and over cosmic time. However, the mass of the DM halo determines which one is favored, so that the less massive galaxies prefer the cold-flow mode (Fig. 2). The hot mode is produced by the gas being shock heated when entering the DM halo. It reaches a temperature K and a density between a hundred and a thousand times the mean density of the universe (Birnboim & Dekel 2003; Kereš et al. 2005). Gas at this temperature and density exhibits a cooling time of several Gyr (e.g., Dekel & Birnboim 2006; Wiersma et al. 2009), which is long enough for the gas to be spread over the halo by the time it settles down onto the galaxy disk. The high temperature gas is too tenuous to be observed in X-ray, and is fully ionized. Cold-flow gas, however, rapidly ends up in the center of the potential well in a free-fall timescale, where it meets, strikes and heats the galaxy. Depending on the flux and clumpiness of the gas stream, it may destroy a pre-existing disk and create a new one, or just contribute to the growth of the disk (e.g., Dekel et al. 2009). The cold-flows are partly ionized with K. The sources of ionization are mainly thermal collisions with electrons, and photoionization due to individual galaxies and the UV background (e.g., Fumagalli et al. 2011b).
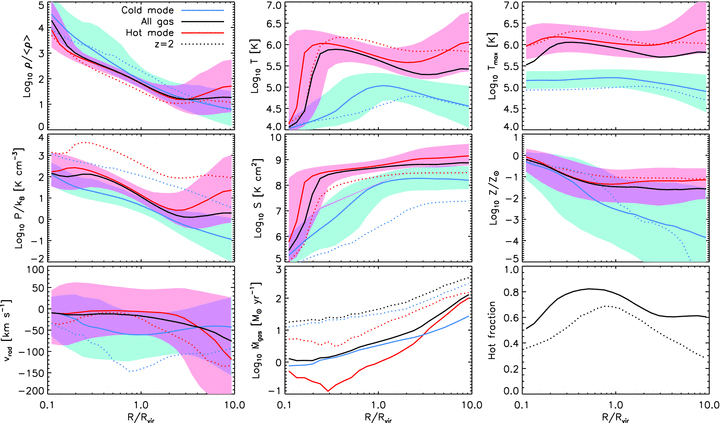
A summary of numerical model predictions is shown in Fig. 3 (from van de Voort & Schaye 2012). It describes the physical conditions of the gas being accreted by MW-size haloes ( M⊙) at z= 0. The cold gas is defined to be the component that never reaches a temperature above K (Fig. 3; top right panel). This cold component comes directly from the intergalactic medium (IGM) and is more metal poor than the hot component (Fig. 3; middle right panel) which is enriched by galactic outflows. The gas falls in pulled by gravity so that the characteristic velocities are similar to the Keplerian velocities in the outer parts of disks. The typical inflow velocity for the cold-flow goes from 50 to 100 km s-1 at although it increases with redshift for the same halo mass (see the bottom-left panel of Fig. 3). The hot component has essentially no infall speed except near the outer parts. Distances to the center of the potential are normalized to the virial radius defined as the radius than contains a density greater than 170 times the mean density of the universe. is typically very large compared to the optical half-light radius of the resulting galaxies ( times according to Kravtsov 2013). Note that the average densities of both the hot and cold components are similar to within a factor of 5 and that both increase towards the center. Still, the accretion rate is dominated by the cold component (lower middle panel) because it has the greater infall speed. The temperature of the hot component stays high until it finally reaches the disk, at which point it drops down to the temperature of the cold component.
The dimensions of the cold streams determine how the gas interacts with the galaxy at the center of the gravitational well, whether it is focused onto a small portion of the galaxy or affects the galaxy disk as a whole. Numerical simulations predict the comic gas streams to be very broad – larger than the virial radius of a dwarf galaxy. They are 0.1 Mpc across at in the MW-like galaxy simulations by Schaye et al. (2010), and the width increases with time, so that they are even broader in the nearby universe. However, these broad streams develop small-scale structure (called substreams), which is poorly captured at the resolution of the present simulations. These substreams may eventually be small enough to become disk-galaxy size or smaller, and so they may identifiable through inhomogeneities produced in the disks (e.g., Ceverino et al. 2010).
The infall rates in the center of the potential well decrease with time, from a few tens of M⊙ yr-1 at to a few M⊙ yr-1 at (e.g., Kereš et al. 2005 van de Voort & Schaye 2012, and also Eqs. [14] and [15]). These accretion rates are characteristic of MW haloes; higher masses have larger infall rates and a much steeper decrease with time. The accretion rate is bursty since the cold-flow gas falling in is clumpy rather than smooth (e.g., Fig. 1 in Brooks et al. 2009). As we addressed in more detail in Sect. 2.1, galaxies tend to be in a slowly evolving equilibrium state, with the predicted infall rates comparable to the SFRs. At every radius accretion is balanced by SF, winds and radial transport of gas through the disk (Forbes et al. 2014).
The mass in baryons in galaxy haloes can be several times larger than the stellar mass of the galaxy. In massive haloes, most of halo gas is in the hot phase (Fig. 3, bottom right panel), ionized at high temperatures. The cold gas is not uniformly distributed but covers only a small halo volume ( %, Fumagalli et al. 2011b). On average, the majority of stars present in any mass halo at any were formed from the gas accreted in the cold mode, although the hot mode contributes typically over 10 % for (van de Voort et al. 2011). At redshift zero the fraction of stellar disk mass formed from shock-heated gas is between 5 % and 15 % when goes from to (Brooks et al. 2009).
2.3 The importance of galactic winds
Mass outflows, also known as galactic winds, have important effects on the evolution of galaxies, their haloes and the IGM. Together with mass accretion, they regulate the SFR of the galaxies, so that the larger the winds the smaller the gas available to form stars and, therefore, the smaller the SFR. Winds also transport the metals produced by stars out of the galaxy disks, and so reduce the galaxy metallicity and pollute the circum-galactic medium (CGM) and the IGM. All of these features are present in the numerical simulations, but the underlying cause can be appreciated using the analytic model worked out in Sect. 2.1, where the strength of the wind is parameterized in terms of the mass loading factor . At a given accretion rate, when increases, the SFR decreases (Eq. [5]), the mass of gas decreases (Eq. [6]), and the metallicity decreases (Eq. [11]).
Winds explain several central properties of galaxies. Without winds, there would be too many metals in the disks given the nucleosynthetic yield and the observed gas-to-star mass ratio (Sect. 5.1). Moreover, galaxies of different masses tend to have different metallicities, therefore, if Eq. (11) has to describe this property, the mass loading factor must vary with the stellar mass. Such dependence is to be expected, since galaxies of lower mass have shallower gravitational potentials and so they lose gas more easily (see Sect. 5). Winds also affect the metallicity of the IGM, whose expected properties are put forward in Sect. 2.4 and whose observational properties are described in Sect. 3.2. Evidence for metal enrichment of the CGM is analyzed in Sect. 3.1.
The impact of winds on metallicity is so important because can be large, far in excess of unity. If , then most of the accreted gas is not used to form stars but dragged along with the mass ejected in galactic winds ( when in Eq. [5]). In order to reproduce the observed mass-metallicity relationship, Davé et al. (2012) and Peeples & Shankar (2011) need to change from 1 to 6 when varies from to . The same range is also found in numerical simulations ( goes from 1 to 10 for between and ; Shen et al. 2012). Thus low mass galaxies are extremely wasteful using the cosmological gas, most of which returns to the IGM without being processed through the stellar machinery. In addition, the nature of the wind of low and high mass galaxies may not be the same. The HI mass function of galaxy haloes depends on the wind model; it was matched in a simulation by Davé et al. (2013) using momentum-driven outflows for large galaxies and energy driven outflows for small galaxies. Low velocity winds from dwarf galaxies can reach the intergalactic medium, while even high velocity winds from massive galaxies may not as a result of the higher halo density that blocks them (Oppenheimer et al. 2012).
Winds do not seem to prevent cold accretion. Faucher-Giguère et al. (2011) showed from simulations that a factor of 2 increase in the mass loading factor or a factor of 2 increase in the wind speed affect most sensitively the accretion rate at the virial radius without much effect on the cold gas accretion rate to the center. When both the loading factor and speed increased by this factor, the cold accretion rate did decrease for low halo masses. Powell et al. (2011) also found that galactic winds do not strongly affect the cold gas accretion rate.
The cycle of metals ejected by winds is complex, often involving re-accretion. Shen et al. (2012) model a galaxy at with a halo and a stellar disk (like the present day MW disk), and include in the model satellites and nearby dwarfs. They find that 60 % of the accreted metals within 3 of the galaxy come from SNe in the host itself, 28 % come from satellite progenitors, and 12 % from nearby dwarfs. Most metals beyond 2 are released very early, at from 5 to 8. An early release of highly ionized metals was found by Ford et al. (2013) also. Low ionization metals like MgII tend to re-accrete within 2 Gyr, while high ionization metals take much longer.
Strong winds appear to be important for metallicity gradients in disks. Fu et al. (2013) model analytically disk evolution with accretion, winds, and star formation, assuming a radial accretion in the disk plane with a velocity proportional to radius. They find that the largest influence on the metallicity gradient is the re-accreted and enriched halo gas, rather than metals mixed with the disk gas. To match observations of weak metallicity gradients in galaxies with stellar masses of , they need 80 % of the metals produced by SNe to go into the halo where they can return to the disk, mostly in the outer parts. Bresolin et al. (2012) also suggest that metal-enriched outflows and re-accretion to the disk might explain their observation of metallicities in outer disks of two galaxies that are too large for the low rates of star formation there.
SNe affect accretion in another way, by providing ejecta of cool gas into the lower regions of the halo onto which the hot halo gas above it can condense. Marinacci et al. (2010) show in simulations that gas in a galactic fountain (Melioli et al. 2008) mixes with hot halo gas, and if the pressure and metallicity of the halo are high enough, the mixture cools to become HI. The total amount of captured halo gas can be about 20 % of the fountain gas for each event. Marasco & Fraternali (2011) and Marasco et al. (2012) model the fountain and resulting halo accretion in detail, reproducing the intermediate velocity HI clouds above the MW and obtaining an accretion rate comparable to the star formation rate of M⊙ yr-1. This may solve the problem posed by the low inflow rate in MW HVCs discussed in Sect. 3.1. Marasco et al. (2012) suggest that the fountain ejection speed is around 70 km s-1. Absorption lines from the warm (e.g., SiIV) component of the MW, and from about half of the hot (OVI) component are also reproduced by this model (Marasco et al. 2013), with these lines coming from fountain-mixed halo gas within a few kpc of the disk. Hobbs et al. (2013) simulate the formation of cold clumps in fountain filaments.
2.4 Expected observational properties
Metallicity.
One of the fingerprints of the cosmic web gas is its low metallicity (between and at low redshift; see Fig. 3, central row, right panel), with a very large scatter indicating that the metals are not uniformly spread (Fumagalli et al. 2011b). Actually the question arises as to why metallicity is not zero if the gas is of cosmological origin. The answer is, partly, a small contamination from the first population III stars. They provide a floor of about , above which these very massive stars are no longer produced (e.g., Bromm & Larson 2004), but the threshold may be even lower if the metals generated by these stars do not reach the IGM (Muratov et al. 2013). However, the bulk of the metals is due to outflows from galaxies that come along with the gas streams (Shen et al. 2012; Brook et al. 2013). Accordingly, the metallicity of the web increases with decreasing redshift, reaching the level of at (see Fig. 3, and also Oppenheimer et al. 2012).
Gas inflow.
Inflow is the other distinct feature of accretion. Unfortunately, observations do not easily distinguish inflows, outflows or other proper motions of the gas around galaxies. Doppler shifts alone do not suffice since an inflow in the foreground and an outflow in the background produce the same Doppler shift. Additional physical constraints must be invoked. For example, the gas expelled from the galaxy tends to escape in the direction perpendicular to the galaxy plane, therefore, motions in the plane of the galaxy favor the inflow interpretation (e.g., Bouché et al. 2013; Combes 2014). As we discuss above, cosmic web inflows are expected to be metal-poor so metal-rich moving gas is commonly interpreted as outflow rather than inflow (Lehner et al. 2013; Bregman et al. 2013). A third possibility is using the relative velocity as a discriminant. The inflows cannot acquire a velocity largely exceeding the Keplerian velocities (Sect. 2.2) and therefore large velocities must be associated with outflows. The only direct way of assessing accretion, however, is by observing the gas in absorption in the starlight spectrum emitted by the galaxy (e.g., Lebouteiller et al. 2013) – since the gas is in between galaxy and observer, redshift implies infall.
Ly forest.
One of the most consistent predictions of numerical simulations has been the Ly forest of low column density absorption lines to quasi stellar objects (QSO) produced by the cosmic web (Bi et al. 1992; Hernquist et al. 1996; Schaye 2001). Simulations reproduce the distribution of column densities, equivalent widths and power spectra (for recent work, see Borde et al. 2014). Fumagalli et al. (2011b) work out the HI column density expected from the web considering the ionization balance to be controlled by thermal collisions with electrons, by photoionization due to individual sources and the UV background, and by dust shielding from ionizing photons. They predict column densities of neutral hydrogen between and cm-2 (Fig. 4).
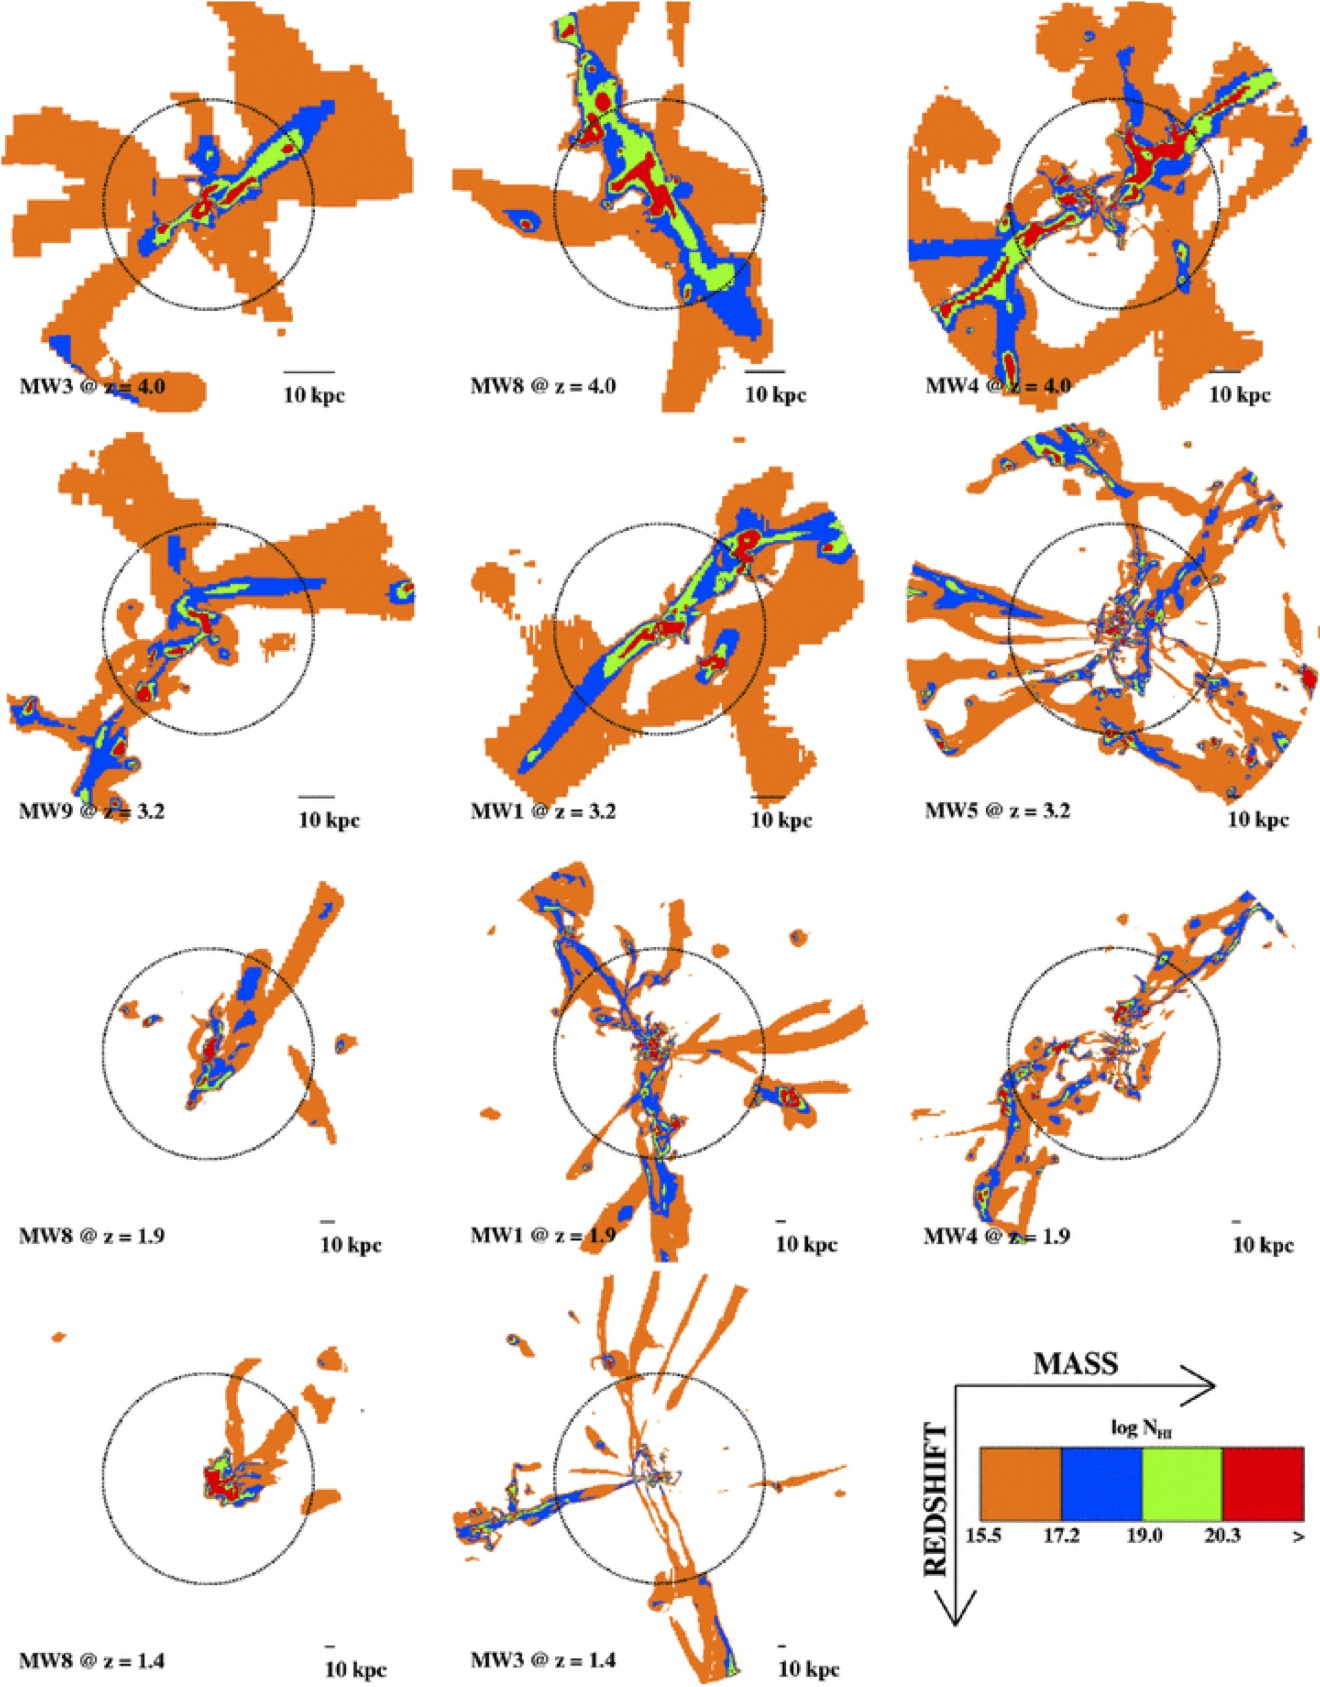
The expected properties coincide with those observed in Lyman limit systems (LLS; cm-2) and damped Lyman- absorbers (DLA; cm-2), including inflows of 100 km s-1 and metallicities between and for between 5 and 0 (e.g., Tornatore et al. 2010; Rafelski et al. 2014). The closer to the center of the gravitational potential the denser the gas, and the lower the redshift the more diffuse. In simulations also including radiative transfer, van de Voort & Schaye (2012) and van de Voort et al. (2012) find that at -3, most HI absorbers above cm-2 reside in haloes, those above cm-2 are in disks, and cold flow accretion should appear as an infalling component with low metallicity. Fumagalli et al. (2011b) suggest that cold streams from galaxies in the mass range account for more than 30 % of the Ly absorption in QSO spectra (see also Faucher-Giguère & Kereš 2011).
Imaging the gas streams.
Cold-flow streams contain partly ionized gas undergoing continuous recombination and should produce an HI emission line spectrum. Goerdt et al. (2010) work out the Ly flux to be expected from the cold streams that fed galaxies at high redshift. UV background excitation, collisions with free electrons, and dust attenuation are included. They find that the emission is mainly driven by collisions since the filaments are thick enough to be shielded from the background. The peak surface brightness is erg cm-2 s-1 arcsec-2 for MW-like haloes at . Assuming that this flux is observed through a narrow bandpass of 50 Å, it corresponds to 25.5 AB mag per square arcsec. The structures have sizes from 50 to 100 kpc, luminosities between and erg s-1, and are identified by some authors as the observed Ly blobs (LABs; Steidel et al. 2000; Fardal et al. 2001; Ouchi et al. 2009; Latif et al. 2011, see Sect. 6.4). Simulations by Rosdahl & Blaizot (2012) also suggest that cold stream accretion can account for the Ly emission. The cosmic web gas also emits through fluorescence of Ly photons produced by nearby sources (Cantalupo et al. 2012). This fluorescence has been recently observed as we discuss in Sect. 6.4.
2.5 Accretion and disk growth
Accretion tends to favor the outer parts of galaxies with both stars from minor mergers (Font et al. 2011; Lackner et al. 2012) and gas from cold streams (Roškar et al. 2010; Moran et al. 2012). Surveys of extended UV disks around both early and late type galaxies actually suggest on-going gas accretion and star formation in the outer parts (Lemonias et al. 2011; Moffett et al. 2012). These ideas are consistent with cosmological numerical simulations, where disk galaxies acquire their spin together with their mass through cold gas accretion.
Pichon et al. (2011) carry out simulations where the disk angular momentum comes from filaments and increases over time, building up disks from the inside out. Codis et al. (2012), Laigle et al. (2013), and Dubois et al. (2014) show from cosmological simulations that low mass galaxies, which tend to be disklike, spin in a direction that is aligned to their accretion filaments, but high-mass spheroidal galaxies spin perpendicular to their filaments. The difference arises because the disks accrete gas directly from their filament and inherit its angular momentum, while the spheroids grow from the mixture of other galaxies coming in along the filament (i.e, grow from mergers). Stewart et al. (2011b) found that cold streams in haloes contain higher angular momentum than dark matter. The reason for this is that the total angular momentum of the dark matter adds positive and negative contributions from the mixing of many sub-haloes, with a net value that is small. In contrast, gas cannot pass through itself but dissipates relative motions and coheres into a smooth flow with the net angular momentum appearing as a systematic rotation.
So far no numerical simulation details the interaction between a cold-flow stream and a galaxy disk in the local universe. Ceverino et al. (2012) model the kind of clumpy disks observed at high redshift (Elmegreen et al. 2005, 2007b; Genzel et al. 2011). The advent of the gas stream changes the morphology of the disk so that it becomes more lopsided. Stars are formed immediately after gas arrival at high rate ( M⊙ yr-1), but the metallicity of the resulting HII regions is not well modeled because part of the gas forming stars was in the disk already, and also because these simulations assume an instantaneous recycling of the SN ejecta. The size of the ensuing star-forming regions has to do with the gas accretion rate and the turbulence, rather than with the cross section of the gas stream that induces the process. The turbulence in numerical disks may (Genel et al. 2012a) or may not (Hopkins et al. 2013b) be maintained by cold-flow accretion events. Turbulence enhances mixing processes on the scale of the disk thickness, so the mixing timescale for the ISM in a small radial annulus of a disk galaxy is expected to be short – of the order of a rotational period or shorter (Tenorio-Tagle 1996; de Avillez & Mac Low 2002; Edmunds 2005; Yang & Krumholz 2012).
3 Accretion inferred from gas observations
3.1 Neutral gas observations
Pools of neutral gas.
The presence of pools of neutral gas around almost all galaxies is well known from the early days of radio astronomy (e.g., Muller & Oort 1951; Haynes et al. 1984; Dickey & Lockman 1990). The improvement in sensitivity and the diversification of observational techniques have reinforced the original view. Roughly speaking, the HI mass scales with the SFR of the galaxies (KS law; see Sect. 2.1) and since the SFR varies systematically with the Hubble type and with , gas rich systems tend to have late morphological types and low stellar masses. The gas-to-star mass ratio varies from 0.01 to 10 when goes from 11.5 to 8, with the same range of variation from red early type galaxies to blue late types (Kannappan 2004; Pilyugin et al. 2004; Davé et al. 2013). The scatter of the relationships with stellar mass and Hubble type is significant, so that neither the mass nor the Hubble type fully determine the gas fraction of a galaxy (Kannappan 2004; Kannappan et al. 2013; Wang et al. 2011).
Sancisi et al. (2008) summarize radio observations of HI cloud complexes, tails and filaments in and around local galaxies, suggesting ongoing minor mergers and recent arrival of external gas. The HI image of the dwarf galaxy IZw18 in Fig. 5 is particularly illustrative (from Lelli et al. 2012a). It shows large amounts of HI gas around the galaxy () with a plume of different velocity directed towards the galaxy where a large starburst goes on at present (Fig. 5, left panels). Although not as spectacular as in IZw18, elongated extra-planar features are quite common in disk galaxies (e.g., NGC925, Pisano et al. 1998, and the many other examples given in the review by Sancisi et al. 2008).
Extra-planar gas is also found in our own galaxy, where the existence of gas clouds falling in is long known (Oort 1966; Blitz et al. 1999; van Woerden et al. 2004; Wakker et al. 2007, 2008). Some of these high velocity clouds (HVC) are part of the so-called galactic fountain, where SN ejecta return to the galaxy plane after cooling down (e.g., Tenorio-Tagle 1996; Spitoni et al. 2008). However, HVCs with low metallicities are likely of extragalactic origin (e.g., Hernandez et al. 2013). The existence of HVCs agree qualitatively with theoretical expectations, however, they pose an observational problem common to many other galaxies. Their mass infall rate is estimated to be 0.1-0.2 M⊙ yr-1 which is one order of magnitude too small to maintain the MW SFR of 1-2 M⊙ yr-1 (Sancisi et al. 2008; Fraternali 2014), and thus inconsistent with the MW being in a stationary state sustained by HVCs (Sect. 2.1). This imbalance between observed SFR and observed gas accretion rate is common but not universal (counter examples are given by, e.g., Bouché et al. 2013; Schmidt et al. 2014). Moreover, Richter (2012) has mapped HVCs in local galaxies. His HI observations and models indicate that the gas accretion rate density of galaxies is 0.022 , which is comparable to the local universe SFR density (Sect. 6 and Fig. 11). He notes that most local accretion may be warm rather than cool gas, although cool infalling HVCs undoubtedly are important components of local galaxy star formation (e.g., Pisano 2014). A massive () hot ( K) gas is indeed detected over a large region (100 kpc) around the MW (Gupta et al. 2012). Part of the gas supply needed to balance the MW SFR may be due to ionized HVCs. Lehner & Howk (2011) measure the ionized HVC mass to be and estimate an infall time of -130 Myr, which gives an accretion rate of 0.8-1.4 yr-1, large enough to sustain the SFR in the MW. The gas supply may also come from the Magellanic stream. The MW is surrounded by a long stream of neutral and ionized gas that is leading and trailing the Large and Small Magellanic Clouds (Wannier & Wrixon 1972; Mathewson et al. 1974). This gas presumably came from the Magellanic clouds during their interaction with each other (Diaz & Bekki 2012) and is now experiencing a drag force from its motion in the hot MW halo gas (Mastropietro et al. 2005). Taking into account the neutral and ionized gas, the Magellanic stream contains at a distance of 55 kpc (Fox et al. 2014). If the gas in the Magellanic system survives to reach the MW disk over its inflow time of -1.5 Gyr, it will represent an average inflow rate of 4-7 M⊙ yr-1 potentially raising the current MW SFR. Multiple signs of an evaporative interaction with the hot halo indicate that the stream may not survive its journey to the disk fully intact. It will break apart by hydrodynamic instabilities and evaporate, contributing the hot halo mass (Bland-Hawthorn et al. 2007; Fox et al. 2014)
Another big piece of evidence for gas reservoirs in galaxies comes from Ly absorption produced by gas around galaxies that happen to be near QSO lines-of-sight. In a systematic search for such systems, Tumlinson et al. (2013) find absorption in all star-forming galaxies, with a detection rate as large as 75 % for the early types and 100% for late types. The sample contains all Hubble types in the near universe () with intermediate masses , and the lines-of-sight sample impact parameters kpc. The gas is associated with the galaxies (with velocities smaller than the escape velocity) and it is found to be in a cold phase, with temperatures well below the halo virial temperatures ( K). This reservoir of gas is often metal poor, indicating that it was not generated and ejected by the galaxies but it is of cosmic origin (Sect. 2.4). Kacprzak & Churchill (2011) examine Mg II absorption kinematics in halo gas at impact parameters from 12-90 kpc along 11 QSO sightlines towards 13 L⋆ galaxies111L⋆ is the characteristic luminosity that separates low and high luminosities in the galaxy luminosity function by Schechter (1976). It turns out to be roughly comparable in luminosity to the MW. at and find that thick disk rotating halo models are not sufficient to explain the broad lines. They suggest the gas is infalling along filaments and streams. In a blind survey, Burchett et al. (2013) found C IV absorption that appears to be associated with either of two dwarf galaxies, and concluded that the most likely origin for the lines is cold gas accreting onto the dwarf galaxy. The same kind of cold gas is also present in galaxies of lower mass and to even larger impact parameter. Jia Liang & Chen (2014) search for galaxy-QSO close pairs suitable for finding gas absorption systems. They find 111 independent pairs among nearby low mass galaxies , with impact parameters between 30 and 500 kpc (median kpc). Abundant hydrogen gas is found beyond the dark matter halo radius and all through kpc, with a mean covering fraction of %. No heavy elements are detected at , though. The authors estimate that the metallicity of the inner halo is 0.1 (Chen 2014, private communication), which sets an upper limit to the metallicity of the IGM at distances larger than . The above results present just a few cases among the extensive list of evidence for neutral gas reservoirs next to galaxies drawn from absorption on QSO spectra – more will be given in Sect. 6.
Within the cold-flow accretion scenario, gravitationally bound HI structures devoid from stars are to be expected. HI filaments of this kind have been discovered in blind HI surveys. For example, Popping & Braun (2011a) analyze data from the Parkes All Sky Survey to find ten faint extra-galactic filaments that can correspond to extended haloes, tidal remnants, or potentially diffuse filaments tracing the neutral fraction of the cosmic web. Popping & Braun (2011b) map the galaxy filament connecting the Virgo cluster with the local group, finding 20 new detections of neutral hydrogen with no obvious sign of stellar emission. Dark galaxies are also found in the HI ALFALFA survey (Haynes 2007; Martinkus et al. 2014). They represent some 3% of the extragalactic sources (Haynes 2008). Other examples exist in the recent literature (e.g., Oosterloo et al. 2013). So far it is unclear whether the small number of HI-only sources agrees with cosmological numerical simulations since the predictions are not specific enough.
Environment influences gas content and recycling. An HI ALFALFA survey of 365 dwarf galaxies in the Virgo Cluster revealed 12 red early-type dwarfs with the same HI per unit mass as star-forming dwarfs (Hallenbeck et al. 2012). The most likely interpretation is that the early type dwarfs were once stripped in the cluster are recently re-accreting gas. In a VLA HI study of counter-rotating disks, three early-type barred galaxies appear to be accreting cold gas. Several of the HI features are cold gas blobs, possibly gas-rich dwarfs (Chung et al. 2012). Kreckel et al. (2011) selected voids out to 100 Mpc based on SDSS galaxy data in order to search for HI in regions of greatest galaxy underdensities. Among 15 galaxies, 14 were detected with HI gas masses from - . While some of the galaxies are interacting or have companions, others appear isolated and undisturbed, with flocculent spiral or chain morphologies. They note that one void galaxy is a polar ring galaxy in a thin wall between voids, and may be slowly accreting gas from the cosmic web, as also for another ring galaxy in a void (Spavone & Iodice 2013). Two dwarf galaxies with extended HI disks have unusual kinematics that may be explained by ongoing cold flow accretion. One, the only known dwarf galaxy in the Local Void (KK 246), has an extended HI disk of and an unusually high mass-to-light ratio of 90 (Kreckel et al. 2011).
In order to characterize faint diffuse gas in local galaxies, Heald et al. (2011) have initiated the HALOGAS (Westerbork Hydrogen Accretion in LOcal GAlaxieS) survey. Their deep HI survey is designed to search for extraplanar gas in edge-on and inclined nearby galaxies and determine the distribution and gas properties. The pilot survey of 4 galaxies tentatively suggests that galaxies with higher star formation energy form gas haloes from outflow, and that extraplanar gas is associated with a high star formation rate per unit area (Zschaechner et al. 2012). The full survey should also be a useful characterization of halo gas in local systems.
Morphological distortions.
Very often the HI maps present non-axisymmetric distortions showing that the gas is not contained in a disk or a spheroid (e.g., Baldwin et al. 1980) and so, suggesting the gas distribution to be transient. For example, spirals are known to have extended warped HI distributions, a pattern that cannot be sustained for long. Among other explanations, gas infall has been proposed as the origin of warped disks (e.g., López-Corredoira et al. 2002; Bournaud et al. 2005; Kamphuis et al. 2013). Figure 5 shows an extreme case of distorted HI morphology. Such extreme distortion is actually common among galaxies with large specific SFR in the local universe – blue compact dwarf (BCD) galaxies often show such complex HI topology (Ekta et al. 2006; Ekta & Chengalur 2010; Lelli et al. 2012b; Nidever et al. 2013). The survey LITTLE THINGS finds BCDs with kinematically separate components, streamers extending far beyond the optical size, kinematic HI axes offset from the optical axes, clouds associated with recent starbursts, and so on (Johnson et al. 2012; Ashley et al. 2013). Many other examples of HI maps showing galaxies with plumes and filaments can be found in the literature (e.g., López-Sánchez et al. 2012). Morphological distortions suggestive of gas accretion are also common in optical images and are discussed in Sect. 4.
A particularly telling deviation from axi-symmetry has been found recently by Kacprzak et al. (2012a). They report a bimodality in the azimuthal angle distribution of low ionization gas around galaxies as traced by MgII absorption along QSO lines-of-sight. The circum-galactic gas prefers to lie near the projected galaxy major and minor axes. The bimodality is clear in blue star-forming galaxies whereas red passive galaxies exhibit an excess of absorption along their major axis. These results suggest the bimodality to be driven by gas accretion along the galaxy major axis and gas outflows along the minor axis (Sect. 2.4). There is no other clear alternative. For this interpretation to be correct, the inflow has to be highly anisotropic, concentrated in the plane of the galaxy. This fact favors cold-flow accretion with respect to the isotropic gas inflow to be expected from hot coronal gas cooling down (Sect. 2.2).
The lack of axi-symmetry of the gas properties in galaxy haloes is corroborated by Zhu & Ménard (2013) in their study of CaII H&K absorption lines produced by one million foreground galaxies at in SDSS QSO spectra. For edge-on galaxies the absorption is more concentrated along the minor axis. This is consistent with the idea that bipolar outflows induced by star formation produce the metallic gas in the haloes. Actually, the inflows along the galaxy plane help to channel the outflows along the poles (Tenorio-Tagle & Muñoz-Tuñón 1997; Tenorio-Tagle & Munoz-Tunon 1998).
Metallicity.
Having low metallicity can be regarded as the main fingerprint of cosmic web gas (Sect. 2.4) and, indeed, the neutral gas around galaxies is often very metal poor. Gaseous systems observed in absorption along QSO lines-of-sight are easier to detect if they are metallic, simply because the absorption features are intrinsically stronger. In order to avoid this bias, Lehner et al. (2013) use an HI selected sample of some 30 galaxies with redshifts up to one. They study the metallicity of LLS () with impact parameters between 10 and 150 kpc. Interestingly, they find a bimodal metallicity distribution with metal poor and metal rich branches peaking at 0.025 and 0.5 , respectively. Both branches have a nearly equal number of absorbers. These two populations fit in well with the scenario depicted in Sect. 2, with coexisting metal-rich gas outflows from the galaxies and cosmological gas inflows. We note that the cosmic web metallicity at predicted by numerical models is very close to the metal-poor branch observed by Lehner et al. In a complementary work, Jia Liang & Chen (2014) find that the absorbing gas next to the galaxies has metallic lines, but only hydrogen absorptions show up at distances beyond the virial radius. This pattern is corroborated by other studies (e.g., Churchill et al. 2013).
Extremely metal poor (XMP) galaxies provide another piece of evidence for large amounts of cosmic gas around local star-forming galaxies. These galaxies have a number of properties consistent with disks being assembled by accretion of gas (Elmegreen et al. 2012b; Sánchez Almeida et al. 2013, 2014). In particular, they are enshrouded by large amounts of neutral gas, so that is typically as large as 20 (Filho et al. 2013). The ratio is so large that normal stellar evolution cannot produce enough metals for their HI gas to have the same metallicity as that observed in the HII regions of the galaxies, which are already extremely metal poor because XMP galaxies are selected to have . Then the HI gas around XMPs must have a metallicity and so of the order of a few hundredths of the solar value, which is the level of metallicity expected for the cosmic web in the local universe (Sect. 2.4).
The CGM has also been studied in absorption in the stellar spectra produced by the host galaxy. Then one can unambiguously measure whether the gas goes in or out (see Sect. 2.4). Lebouteiller et al. (2013) make this observation with IZw18 (Fig. 5). The HI gas pool around it has a metal abundance lower by a factor of two as compared to the HII regions, and it may even present pockets of gas with metallicity essentially null. The HII metallicity samples the gas in the disk, which is already extremely low in this particular galaxy. Since the observed HI gas metallicity is at the level expected for the cosmic web (Sect. 2.4), and it is lower than the metallicity in the disk, the HI is likely cosmic gas being accreted. Lebouteiller et al. (2009) find an even larger discrepancy between the HI and HII metallicities of Pox 36, where the HI metallicity is around 0.03 .
Gas consumption timescales.
As we point out above, the stellar mass is a poor predictor of the gas-to-stellar mass ratio , however, Kannappan et al. (2013) find that correlates well with the stellar mass in young stars formed only during the last Gyr, . Actually, was found to be close to , which implies routine refueling of star-forming galaxies on Gyr timescales, i.e., implies a continuous gas accretion to maintain SF. The study is based on thousands of objects so it portrays a general property of galaxies. This short time for exhausting the gas is very consistent with the HI consumption timescales inferred from the KS law ( in Eq. 2), of the order of 0.5-2 Gyr (Sect. 2.1). The fact that galaxies have been forming stars along the Hubble time (e.g., Sánchez Almeida et al. 2012), but they consume their gas in only one Gyr, is one of the best arguments in favor of the need for an external gas supply to keep up with the star formation (e.g., Kennicutt 1983; Fraternali & Tomassetti 2012).
3.2 Ionized gas observations
The emission line spectra produced by HII regions surrounding the star-forming regions provide a direct means of measuring the physical conditions of the gas forming stars and, in particular, its metallicity that represents the prime diagnostic for cosmic gas accretion (Sect. 2.4). There are a number of compelling observations of ongoing gas accretion based on such HII-based metallicity measurements.
Metallicity inhomogeneities and inverted gradients.
The secular evolution of disk galaxies produces a regular pattern with the metallicity decreasing inside out, i.e., having a negative gradient with galactocentric distance (Vilchez et al. 1988; Edmunds & Greenhow 1995; van Zee et al. 1998; Magrini et al. 2007; Sánchez et al. 2014). The timescale for gas mixing in a disk inside an annulus is fairly short, on the order of a rotational period or a few hundred Myr (Sect. 2.5). Deviations from negative metallicity gradients are usually attributed to the recent arrival of cosmic gas that feeds the star formation. If the gas is accreted through the cold-flow mode (Sect. 2), it is expected to reach the disks in clumps often forming stars already (e.g., Dekel et al. 2009; Ceverino et al. 2010; Genel et al. 2012b). Alternatively, the external gas streams may fuel the disks with metal-poor gas, so that gas mass builds up developing starbursts through internal gravitational instabilities (e.g., Noguchi 1999; Elmegreen et al. 2008; Bournaud & Elmegreen 2009). In any case, the cold-flow accretion is bound to induce metal-poor starbursts.
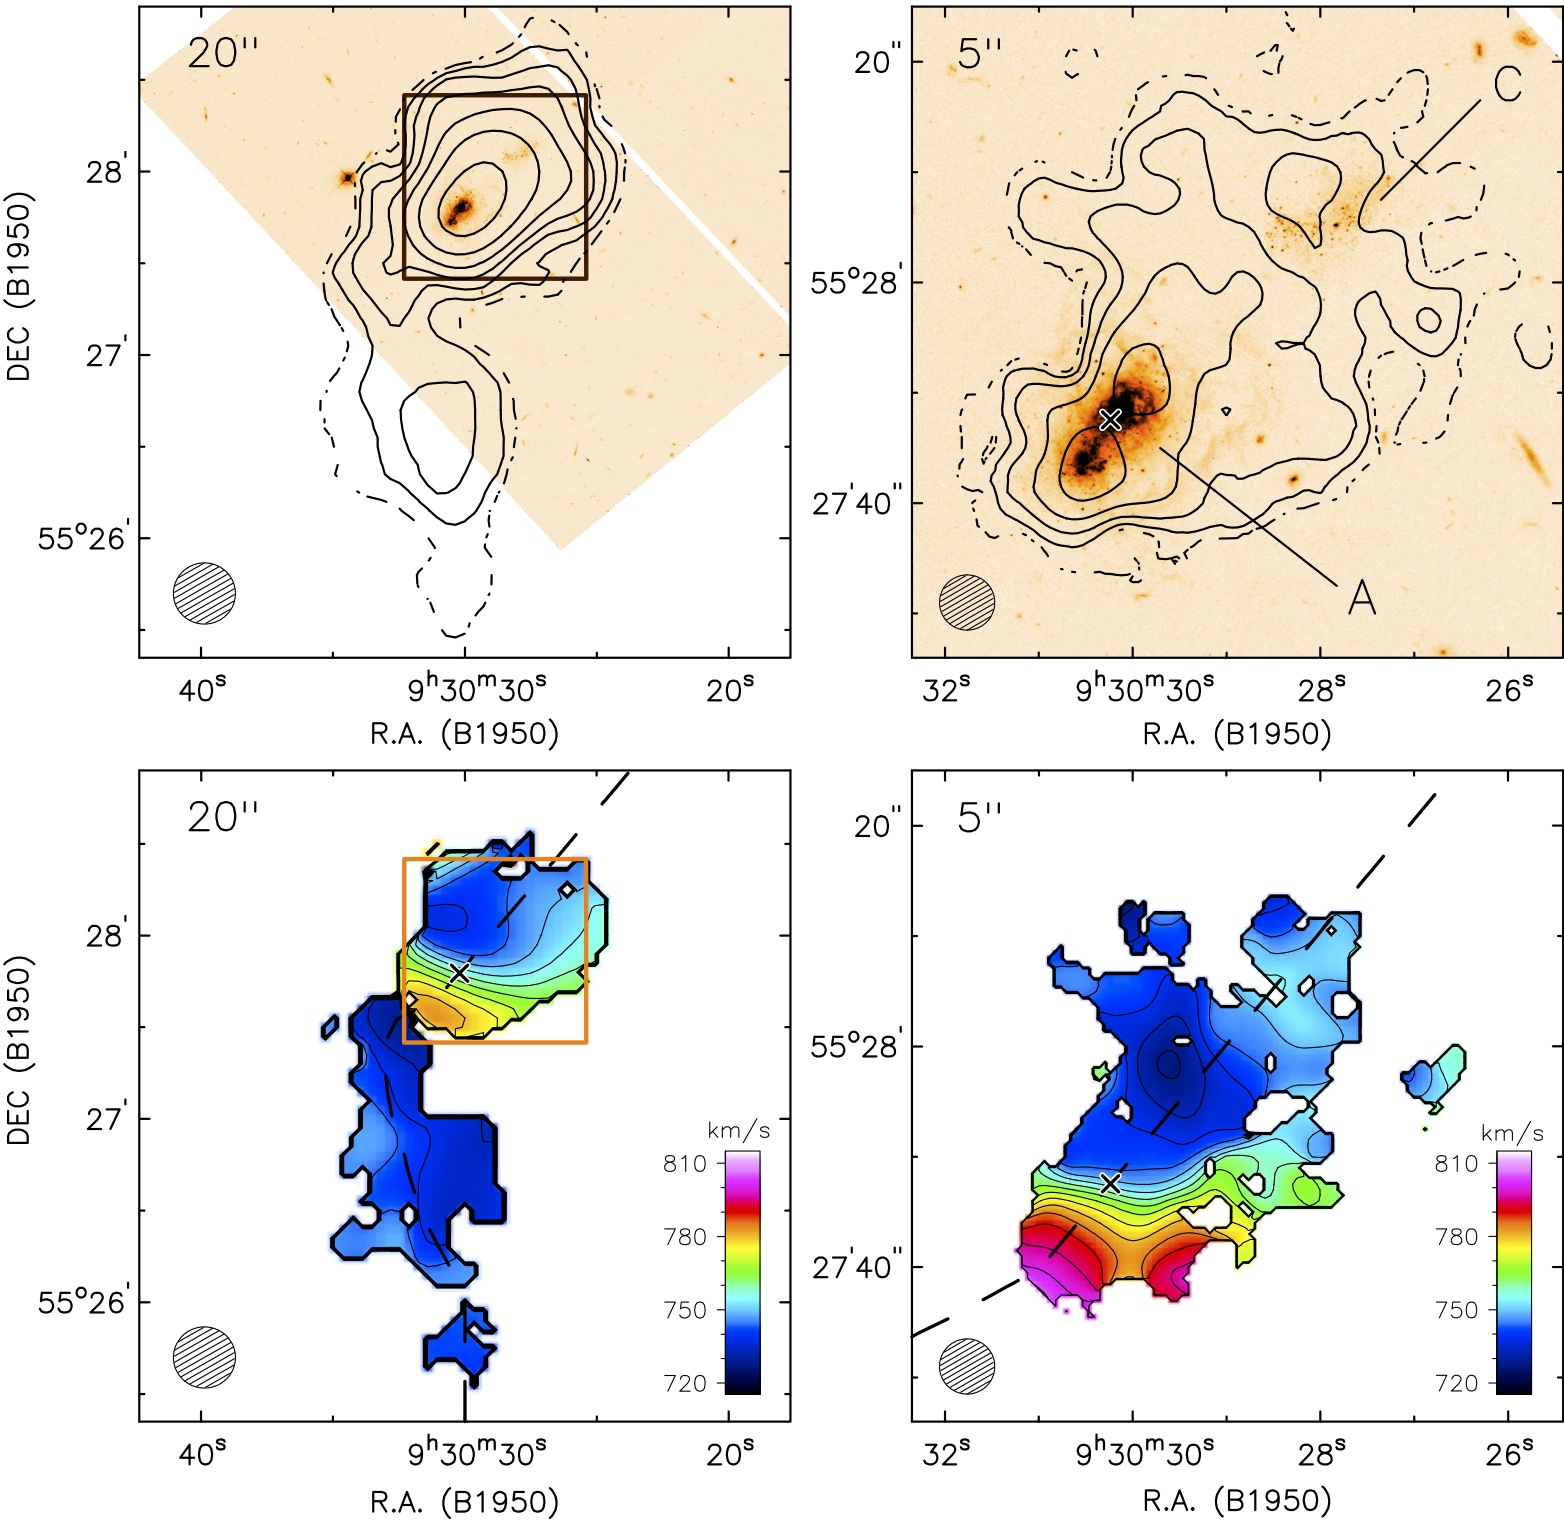
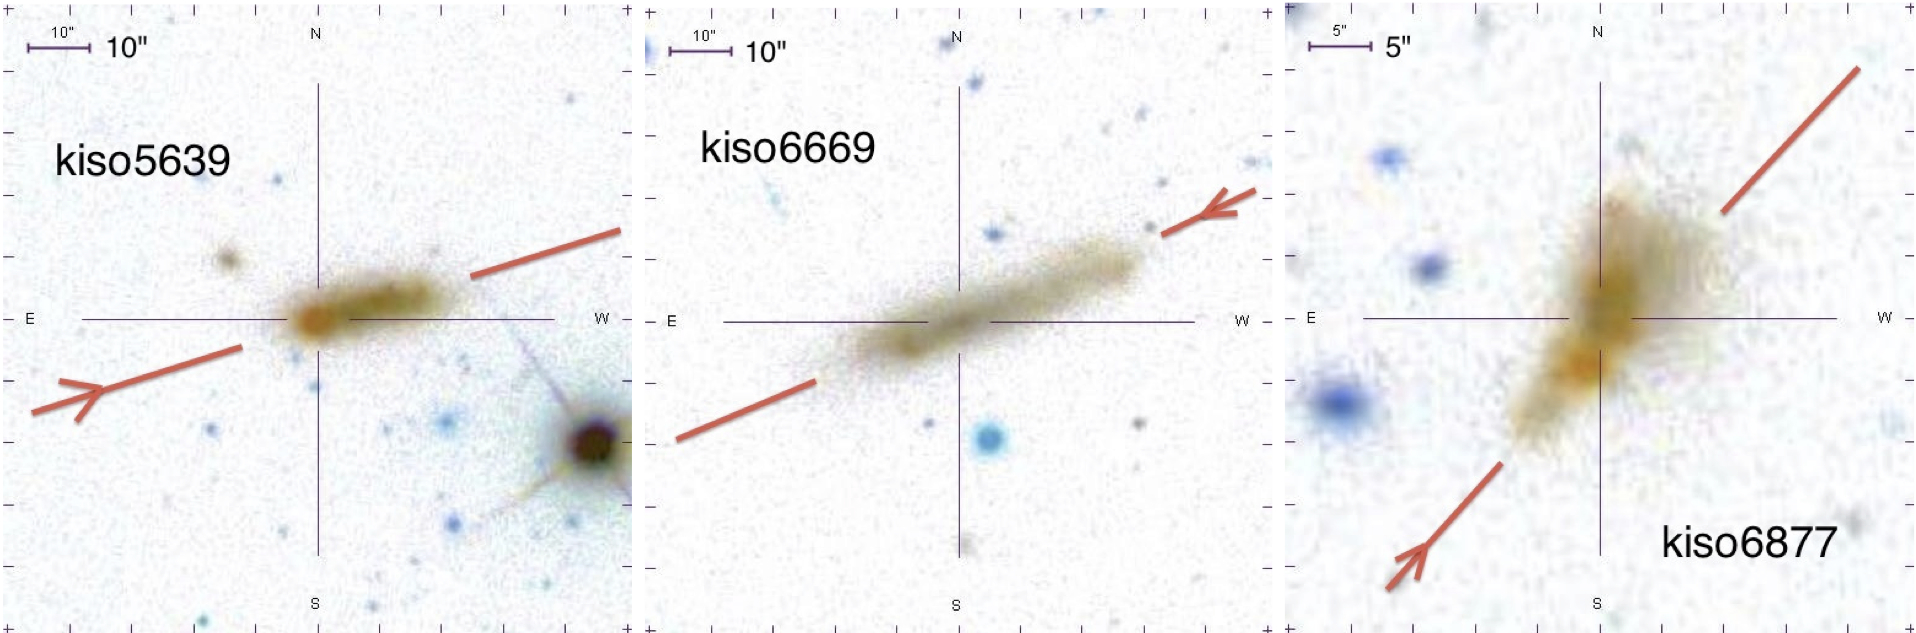
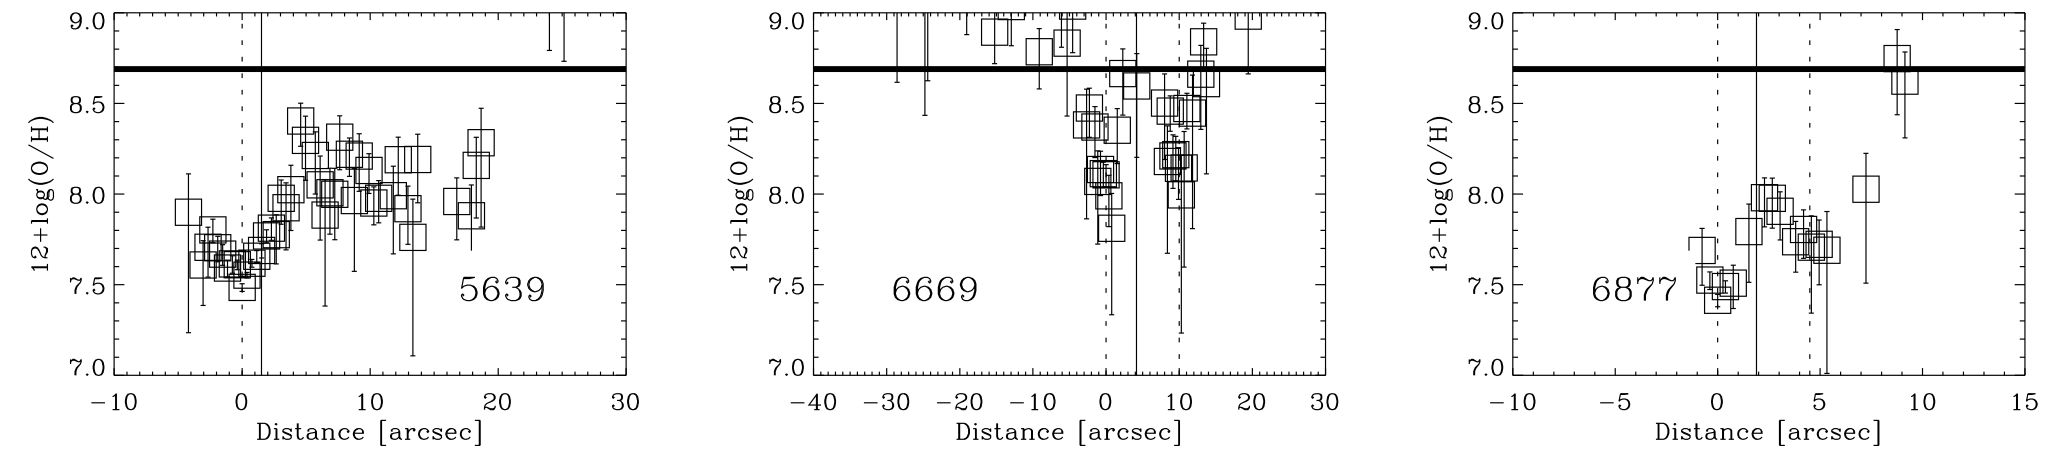
Metallicity drops associated with intense starbursts may reflect cold-flow accretion. Cresci et al. (2010) were the first to identify this pattern in high redshift galaxies. The same kind of metallicity drops appear in local tadpole galaxies, where the bright star-forming head of the tadpole often has lower metallicity than the underlying galaxy (see Fig. 6). Sánchez Almeida et al. (2013) interpret this observation as an episode of gas accretion onto the tadpole head.
Localized metallicity drops associated with star-forming regions have also been observed in other objects, including gamma ray burst host galaxies (Levesque et al. 2011; Thöne et al. 2014), BCDs (Izotov et al. 2009; Werk et al. 2010; Sánchez Almeida et al. 2014) and dwarf irregular galaxies (Haurberg et al. 2013). Variations of metallicity among HII regions located at the same galactrocentric distance are not unusual even in large nearby spirals (Bresolin et al. 2012; Li et al. 2013); some of these variations could come from localized accretion events.
Secular evolution produces negative metallicity gradients, but some spirals show reverse gradients, where the metallicity is lowest in the inner galactic regions. Examples are given by Queyrel et al. (2012), who point out that of their galaxies at show such reverse gradients, especially those objects with the lowest metallicities. This observation may be due to averaging out metallicity drops in inner regions, or other artifacts caused by the limited angular resolution (e.g. Yuan et al. 2013). Alternatively, it may also be interpreted as produced by fast inflows within the disk giving gas to the central regions. Metal poor gas deposited in the outskirts can be transported outside-in by bar instabilities or some type of tidal interaction (Combes 2008, 2014; Elmegreen et al. 2012a). The same mechanism of gas transport is able to explain the presence of metal-poor gas in the narrow-line region of a nearby QSO found by Husemann et al. (2011). It may also account for the finding by Moran et al. (2012) that 10 % of the galaxies with regular metallicities exhibit a sharp downturn in metallicity at the edge of the disk. Surprisingly, the magnitude of the outer drop is correlated with the fractional HI content of the galaxy. The recent stellar mass growth at the edge of the galaxies is apparently due to the accretion or radial transport of gas from beyond the stellar disk.
High metallicity of quiescent BCDs.
BCDs are high surface brightness targets relatively easy to detect. The luminosity of these galaxies is dominated by one or several young starbursts. However, most if not all BCDs contain host galaxies with old stars too (e.g., Papaderos et al. 1996; Cairós et al. 2003; Corbin et al. 2006; Amorín et al. 2007). The dominant starburst is so intense that it cannot be sustained for long, therefore, the BCDs have to be in a transient phase. Consequently, there must be many local galaxies in the pre or post BCD phase, i.e., many quiescent BCDs (or, for short, QBCDs). The BCD host galaxies should show up best outside of their starburst regions. Masking out these regions, Amorín et al. (2007, 2009) were able to characterize their photometric properties. Using the typical host colors and magnitudes as proxies for QBCD properties, Sánchez Almeida et al. (2008) searched the SDSS-DR6 archive for QBCD candidates. They turned out to be rather common: one out of three local dwarf galaxies is of this kind, and there are some thirty of them per BCD galaxy. Their main properties, including their luminosity functions, are consistent with the BCDs being QBCDs observed during a starburst phase in a duty cycle where the quiescent phase lasts 30 times longer than the active phase. This interpretation presents a difficulty, though: the gas-phase metallicity of the QBCDs is systematically higher than the metallicity of the BCDs. This cannot happen in a closed-box evolution, where the precursor galaxy always has lower metallicity than the follower, so that QBCDs could not be precursors of BCDs. The problem naturally disappears if almost every BCD phase is preceded by the advent of fresh metal-poor gas that triggers the star formation episode. Moreover, such gas infall triggering explains why the stellar metallicities of BCDs and QBCDs agree, even though their gas-phase metallicities do not (Sánchez Almeida et al. 2009). The stars of BCDs and QBCDs are statistically the same because only a small fraction of galaxy stellar mass is produced in each starburst. Their gas differs because BCDs have just rejuvenated their ISM. Keeping in mind that 30 % of all local dwarfs are QBCDs, gas-infall must be a common phenomenon. These findings are consistent with the recent results by Zhao et al. (2013).
Metallicity threshold.
Local galaxies with ionized gas metallicity smaller than are rare. They are usually called extremely metal poor (XMP). The recent compilation by Morales-Luis et al. (2011) rendered only 140 such objects, all of them with metallicity above . The existence of this threshold has been known for a long time since the prototypical XMP galaxy IZw 18 is close to the limit (some ), and its singularity was acknowledged more than 40 years ago (Sargent & Searle 1970). Despite repeated efforts to find galaxies more metal poor (e.g., Terlevich et al. 1991; Izotov et al. 1999; Kunth & Östlin 2000) the 1 % lower limit metallicity remains today (Izotov et al. 2005; Kunth & Lebouteiller 2011). Several explanations have been put forward to account for this minimum metallicity: the self-enrichment of the HII region used for measuring (Kunth & Sargent 1986), the metal abundance of the proto-galactic cloud (Kunth & Lebouteiller 2011), the metallicity threshold set by the ejecta from population III stars (Audouze & Silk 1995; Thuan & Izotov 2005), technical difficulties for metallicity determinations below a threshold (Papaderos et al. 2008), and others. None of them seem to be fully compelling. However, the accretion scenario provides a natural explanation for this long-lasting problem. Numerical simulations predict the cosmic web gas to accumulate metals from the outflows of dwarf galaxies (Sect. 2.3). These contributions add up along the Hubble time so that at redshift zero the cosmic web metallicity has to be at the few percent level (Sect. 2.4), which is precisely the observational threshold. This is the metallicity to be expected if the SF in XMPs is driven by gas directly accreted from the cosmic web.
Nitrogen and Oxygen in green-pea (GP) galaxies.
GPs are star-forming galaxies which receive this name because of their compactness and green color in SDSS composite images (Cardamone et al. 2009). The color is produced by an unusually large [OIII]5007 Å emission line redshifted so as to contribute to the g-band color. They have some of the highest specific SFRs in the local Universe, able to double their stellar masses in a fraction of Gyr. GPs are low metallicity outliers of the mass metallicity relationship (Amorín et al. 2010, 2012a). Detailed analyses of their emission lines reveals complex kinematical structures with several components coexisting in only a few kpc (Amorín et al. 2012b). Even though GPs have low oxygen metallicity, they present an overabundance of which is typical of aging stellar populations. This puzzling observation is naturally explained if GPs have recently received a major flood of low metallicity gas (Amorín et al. 2010, 2012a). Then the mixing with metal-poor gas reduces the metallicity (i.e., O/H), but the ratio between metal species (N/O) remains as in the original high metallicity ISM. The motions of a galaxy in the N/O vs O/H plane due to gas infall have been modeled by Köppen & Hensler (2005), who point out that large excursions require the infall gas mass to be larger than the gas present in the galaxy, with the infall rate exceeding the SFR. We note that GPs are not special but just extreme cases in the continuous sequence of local star-forming galaxies (e.g., Izotov et al. 2011).
4 Accretion inferred from stellar observations
Morphology metallicity relationship.
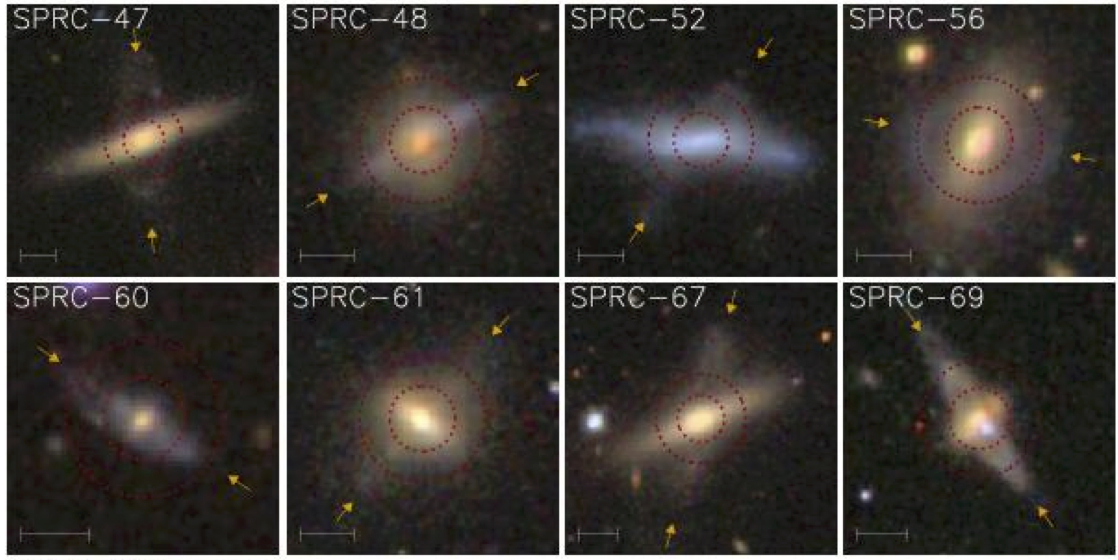
There is a relationship between the morphology of the galaxy as inferred from broad-band imaging (thus tracing stars) and the metallicity of the star-forming gas. It has several manifestations, the most conspicuous one being the association between cometary shape and extremely metal poor galaxies (Papaderos et al. 2008; Morales-Luis et al. 2011; Munoz-Tunon et al. 2014). In a systematic search for XMP galaxies in SDSS-DR7, Morales-Luis et al. (2011) find that 75 % of them have either cometary shape or are formed by chained knots. Likewise, from the comprehensive catalog of 140 known XMPs used by Filho et al. (2013), 80 % have cometary structure or two or multiple star-forming regions. For reference, only 0.2 % of the star-forming galaxies in the Kiso survey are cometary (Elmegreen et al. 2012b). Even if surprising, XMPs seem to be the extreme case of a common relationship between morphology and metallicity followed by the bulk of the star-forming galaxies in the local universe. Reichard et al. (2009) measure lopsidedness in a sample of nearby galaxies from SDSS. At a fixed mass, the more metal-poor galaxies are more lopsided – see Fig. 7.
Whatever process causes lopsidedness, it is associated with low metallicity gas in the galaxies. This non-trivial observational result is naturally accommodated within the gas accretion scenario (e.g., Ceverino et al. 2012, and Sect. 2). Extreme lopsidedness is produced by off-center large starbursts, fed by gas accretion either directly or indirectly – directly if the gas arrives to the disk ready to form stars or indirectly if the gas is accumulated until disk instabilities trigger SF. Thus low metallicity and lopsidedness come together naturally. The process has to be quite common to be responsible for the lopsidedness in the large dataset explored by Reichard et al.
Kinematical distortions.
Galaxies are, to first order, axi-symmetric systems. However, they frequently show kinematical distortions with respect to an axi-symmetric velocity pattern. When the distortions are significant but the underlying axisymmetric structure remains identifiable, the best explanation is often the recent accretion of a gas rich object or a gas stream onto a pre-exiting galaxy. For example, polar-ring galaxies are composed of a central component (usually an early-type disk galaxy) surrounded by an outer ring or disk made of gas, dust and stars, which orbits nearly perpendicular to the plane of the central galaxy (Whitmore et al. 1990; see also Fig. 8). The polar ring itself is gas rich, with a gas fraction corresponding to 30 % of the baryonic mass, suggesting that polar ring galaxies have just accreted a large amount of gas (Combes et al. 2013) and new stars are formed in situ. Polar rings can be formed through galaxy interaction and merging, but most likely through accretion from cosmic filaments (e.g., Finkelman et al. 2011; Pizzella et al. 2013; Blasco-Herrera et al. 2013). Kinematically distinct inner polar gaseous disks appear common in disk early-type galaxies; their juxtaposition with old stellar nuclei suggests that they may be remnants of gas accretion that occurred prior to the main gas accretion in the galaxy (Sil’chenko & Moiseev 2014; Corsini et al. 2012). Polar ring metallicities of 0.1–0.4 , lower than the metallicities in the parent galaxies, are consistent with cold accretion (Spavone et al. 2011).
Often galaxy disks show a number of kinematically distinct components like counter-rotating bulges (Prada et al. 1996), counter-rotating disk stars (Vergani et al. 2007; Coccato et al. 2011), and SF regions kinematically decoupled from the rest of the galaxy (Sánchez Almeida et al. 2013; Koleva et al. 2014). These features are expected from numerical simulations of minor mergers (e.g., Balcells & Quinn 1990; Immeli et al. 2004), however they also arise in hierarchical galaxy formation scenarios even in the absence of merging. Algorry et al. (2014) model a disk galaxy fed by two distinct filamentary structures with opposite spins. They produce counter rotating stars that are not dragged along with the gas but mostly produced in situ. Tidal streams or little tails are also kinematically distinct components, and they turn out to be quite common in the local universe. At least 6 % of the local galaxies show distinct stream-like features, and a total of 19 % show some sort of faint tail (e.g., Miskolczi et al. 2011; Martínez-Delgado et al. 2010). They are thought to be leftovers of tidally disrupted gas rich satellites on their way to reach the center of the global gravitational potential. A study by Matthews et al. (1998) indicated a correlation between optical and HI asymmetries in isolated galaxies, which could result from cold gas accretion.
The highly organized distribution of satellites surrounding the MW and M31 has been long noticed (e.g., Lynden-Bell 1983). The best explanation seems to be that the dwarf satellite galaxies fell into the gravitational potential along only one or two filaments (Li & Helmi 2008; Angus et al. 2011). Using a high-resolution dark matter simulation of the local group, Libeskind et al. (2011) concluded that the satellites of both MW and M31 were accreted anisotropically onto their haloes, entering the virial radius from a specific direction with respect to the large-scale structure. These conclusions are confirmed in other simulations of M31 dwarfs (Goerdt & Burkert 2013; Sadoun et al. 2013), MW dwarfs (Nichols et al. 2011; Lovell et al. 2011), and in observations of dwarfs around NGC 3109 (Bellazzini et al. 2013).
Star formation history of dwarf galaxies.
The variation of the SFR with time is often very bursty in late type galaxies, even if they are isolated. Episodes of large star formation are intertwined with long quiescent phases. This result is inferred using fitting techniques on integrated galaxy spectra (e.g., Cid Fernandes 2007), color-magnitude diagrams of resolved stellar populations (McQuinn et al. 2010a), and statistical arguments involving active and quiescent BCDs (Sánchez Almeida et al. 2008). Convulsive SF histories fit in well the cold-flow accretion scenario. Models predict the process to be intermittent, so, if gas accretion drives star formation, then the SFR is expected to be bursty (Sect. 2). A number of factors conspire to make the effect more clear in dwarfs. They are actively forming stars at present, so that the bursts are young and luminous, and they provide SF histories with good time resolution. Outflows are far more important in dwarfs, and they quench star formation forcing long inter-burst periods. Forming massive galaxies by cold-flows requires the contribution of many discrete accretion events, therefore, statistical fluctuations in their arrival time tend to cancel, giving rise to a smooth SF history. The lower the galaxy mass the less effective the statistical averaging, and dwarfs tend to have a more spasmodic SFR.
Even though individual HII regions last for a few Myr (e.g., Mas-Hesse & Kunth 1999; Harris et al. 2004), the SF episodes of a galaxy as a whole do not shut off within this timescale but they last for several hundred Myr (Dohm-Palmer et al. 1998; McQuinn et al. 2010b; Hidalgo et al. 2011). This relatively long duration of the burst is consistent with a single gas accretion event which suddenly increases the gas but which requires a much longer gas consumption timescale to transform it into stars (Gyr; Sect. 2.1).
G dwarf problem.
There is a long known deficit of sub-solar metallicity G dwarf stars in the solar neighborhood (van den Bergh 1962; Schmidt 1963; Lynden-Bell 1975). This so-called G dwarf problem has been amply discussed in the literature, with solutions ranging from changes in the initial mass function (IMF) to inhomogeneous star formation (Caimmi 2008, and references therein). Among them, a continuous metal-poor gas inflow feeding star formation seems to be the preferred one (Edmunds 1990, 2005). The argument dates back to Larson (1972), who pointed out that star-formation maintained by metal-poor gas accretion self-regulates to produce a constant gas phase metallicity close to the stellar yield, which implies close to the solar metallicity (Sect. 2.1). Therefore the apparent deficit of sub-solar metallicity G dwarfs is actually an excess of solar metallicity G dwarf stars formed over time out of an ISM always near equilibrium at approximately the solar metallicity. Interestingly, the G dwarf problem is not exclusive to the MW but is known to happen in other galaxies as well (e.g., Worthey et al. 1996). The enhanced deuterium fraction in the Galaxy is also consistent with this scenario (e.g., Tsujimoto 2011), and chemical evolution models cannot produce the abundances observed in other stars or the abundance gradients without extensive and continuous accretion of fresh metal-poor gas (e.g., Schönrich & Binney 2009).
5 Scaling laws as evidence for metal-poor gas accretion
A number of observational properties characterizing large samples of local star-forming galaxies can be explained if the star-formation is driven by metal poor gas accretion. The gas infall explanation provides a simple physical unifying mechanism, even though often it is not the only explanation of each individual observation. The very existence of general laws or trends implies that the underlying mechanism has to be something fundamental, since it affects not just a few objects but the bulk of the star-forming galaxies. Some of these general properties are discussed elsewhere in this work, and will not be repeated here; in particular the short gas consumption time-scale compared with the age of the stars (Sect. 3.1), the large metallicity of quiescent BCDs (Sect. 3.2), the metallicity-morphology relationship (Sect. 4), and the similarity between the mass in young stars and mass of gas (Sect. 3.2).
5.1 The stellar mass-metallicity-SFR relationship
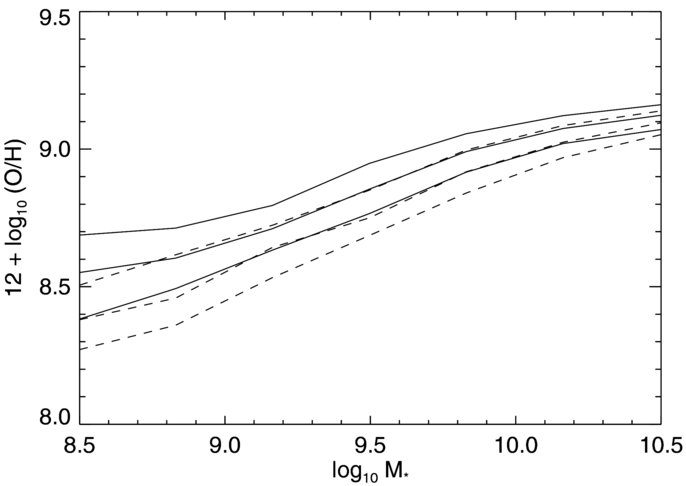
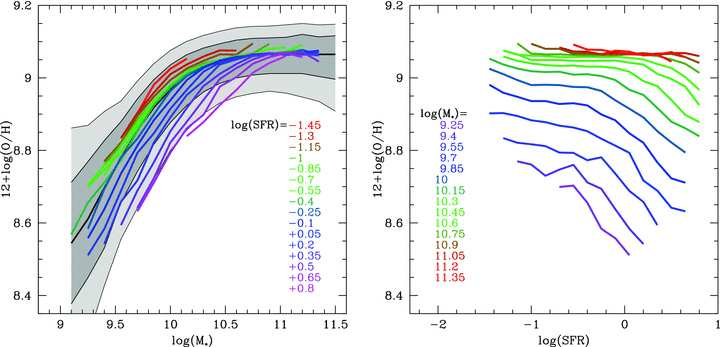
Galaxies are known to follow a mass-metallicity relationship, where the larger the stellar mass the higher the metallicity (e.g., Skillman et al. 1989; Tremonti et al. 2004; Gallazzi et al. 2005). The relationship presents a significant scatter that has been recently found to be associated with the present SFR in the galaxy (Mannucci et al. 2010; Lara-López et al. 2010; Yates et al. 2012; Pérez-Montero et al. 2013; Andrews & Martini 2013; Zahid et al. 2013). Specifically, for galaxies with the same stellar mass, the metallicity decreases as the current SFR increases. This new relationship is often referred to as the fundamental metallicity relationship (FMR, Mannucci et al. 2010), and is shown in Fig. 9.
The mass-metallicity relationship is commonly interpreted as due to variations of the star-formation efficiency with galaxy mass, and/or to galaxy mass-dependent metal-rich outflows (e.g., Lee et al. 2008; Ellison et al. 2008). The former implies that low mass galaxies produce less stars for their gas, and so remain more metal poor, whereas the latter relies on the metal-rich SN ejecta to be preferentially lost to the IGM by low mass galaxies. Neither of these two mechanisms, however, predict the observed dependence of metallicity on the SFR. The observed anti-correlation between metallicity and SFR can be qualitatively understood if the star-formation is preferentially triggered and sustained by the inflow of metal-poor gas. The arrival of new gas simultaneously drops the ISM metallicity and increases the SFR. This idea was already advanced by Mannucci et al. (2010), and it seems to work also quantitatively as shown in the next paragraphs.
Several recent numerical and analytic works explain the FMR within this framework of gas infall forcing SF. It is important to acknowledge that such an explanation implies a time variable infall rate, which moves the galaxy system out of the stationary-state. Otherwise, in a gas consumption time-scale (1 Gyr), the galaxies reach an equilibrium characterized by a metallicity independent of the infall rate (see Eq. [11]). The stationary-state metallicity depends only on parameters set by stellar physics and on the mass loading factor (i.e, the ratio between the outflow rate and the SFR; see Eq. [3]). Since the gas has to overcome the gravitational pull to escape, is expected to be a strongly varying function of galaxy mass. This dependence of on the depth of the gravitational well (as parameterized by ) seems to be the key ingredient giving rise to the observed mass-metallicity relationship (e.g., Garnett 2002; Finlator & Davé 2008; Peeples & Shankar 2011). Since at low stellar mass, Davé et al. (2012) conclude that , as expected if the outflows are produced by momentum driven winds.
Brisbin & Harwit (2012) describe the FMR with an intrinsically bursty model which is always out of equilibrium. Galaxies receive metal-poor gas parcels of different masses that are instantaneously mixed up with the existing ISM. This arrival dilutes the metallicity of the gas and triggers star formation, with the two parameters set by the received gas mass and thus correlated. The authors show that at fixed , the observed relationship between metallicity and SFR follows the scaling to be expected from this model. The explanation works for most of the galaxies with , and many with masses above this threshold and large radii.
Dayal et al. (2013) explain the FMR by forcing a secular deviation from the stationary state, so that given a , those systems that happen to have larger gas masses are also those with higher SFR and lower . The reason why two galaxies with same have different gas masses can be pinned down to their different ages, so the youngest is the one with the largest gas mass. Both inflows and outflows are required to reproduce the observed relationship, but the outflows dominate by far.
Lilly et al. (2013) work out a model galaxy whose main properties self-regulate due to the short gas consumption time scale. Although more sophisticated, it is very much in the spirit of the simple description given in Sect. 2.1. The model galaxy is near the stationary state, but the gas supply available to form stars is allowed to change with time. This drives the system out of the stationary state and provides a dependence of the metallicity on the SFR and mass gas. The authors successfully fit the FMR by Mannucci et al. (2010, in our Fig. 9), allowing both and the gas consumption time scale to vary with . As in the case of Dayal et al. (2013), the deviations from the stationary state are set by the galaxy age.
Yates et al. (2012) use the semi-analytical model L-Galaxies by Guo et al. (2011) to explain the FMR. Thousands of individual galaxies are taken from purely dark-matter cosmological numerical simulations. Baryons that follow the dark-matter are added, implying that a non-stationary clumpy gas accretion drives the system. Mass loading factors that depend on are included. The model reproduces the main observational trends, including an apparent turnover of the mass-metallicity relationship at very high stellar masses. Figure 10 shows the evolution of four prototypical model galaxies in the vs plane. It illustrates how the FMR naturally emerges in this seemingly complex picture. There is a global quasi-stationary drift up and to the right, as the galaxies gather mass and so decrease their outflow losses. On top of this trend, galaxies move down and up at an almost constant stellar mass. First they move down in response to the arrival of fresh gas, and then they quickly recover the stationary-state metallicity and move back up. This is particularly clear in the galaxy of lowest mass in Fig. 10 (, brown line and symbols).
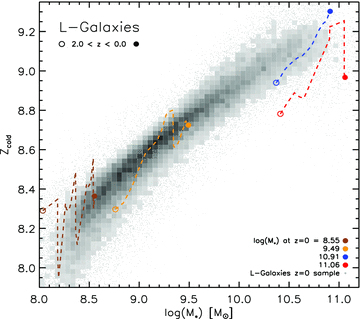
The stationary-state metallicity is given by the upper envelope of the vs relationship. Obviously, the downward excursions are accompanied by bursts of star formation, giving rise to the observed FMR when many galaxies at different phases of the cycle are represented in the vs plane.
Forbes et al. (2013) present a simple model to understand the genesis of the FMR. The scatter arises from the intrinsic scatter in the accretion rate, but may be substantially reduced depending on the timescale on which the accretion varies compared to the timescale on which the galaxy loses gas mass. They show that observational constraints on the scatter can be translated into constraints on the galaxy-to-galaxy variation in the mass loading factor, and into the timescales and magnitude of stochastic accretion onto star-forming galaxies. They infer remarkably small scatter in the mass loading factor, dex, and that the scatter in accretion rates is smaller than expected from numerical simulations.
The parameterization of the FMR by Mannucci et al. (2010), seems to hold until , and then it changes substantially at higher redshift (e.g., Mannucci et al. 2010; Yabe et al. 2012; Ly et al. 2014; Troncoso et al. 2014; Cullen et al. 2014). Variations are expected if the relationship is caused by cosmic gas accretion since accretion rates and IGM metallicities change over time. Thus the variation with redshift of the FMR provides a powerful diagnostic tool to evaluate the evolution of the accreted gas along the history of the universe (Forbes et al. 2013; see also Sect. 8).
N/O is independent of SFR at a given .
Unlike the metallicity, the ratio between the observed N and O does not seem to depend on SFR (see Pérez-Montero et al. 2013; Andrews & Martini 2013). This lack of SFR-dependence is consistent with the relation between metallicity and SFR being maintained by episodic metal-poor inflows. The advent of fresh gas triggers star formation and drops the metallicity, but it does not change the pre-existing relative abundance between metals.
5.2 The stellar mass-metallicity-gas mass relationship
Bothwell et al. (2013) point out that the FMR relationship between stellar mass, metallicity, and SFR described in Sect. 5.1 is just a consequence of a more fundamental relationship where the SFR is replaced with the HI gas mass. The authors find the HI-based relationship cleaner, and without the saturation at high masses, where irrespectively of their SFR, all massive galaxies have the same metallicity (Fig. 9, left panel). A similar anti-correlation between HI mass excess and metallicity has been found by Robertson et al. (2013). Hughes et al. (2013) also find the anti-correlation between metallicity and gas mass at fixed stellar mass in a volume-limited sample of 260 nearby late-type galaxies. Interestingly, the relationship is nearly invariant to the environment when going from clusters to the field. This finding indicates that internal evolutionary processes, rather than environmental effects, shape the observed relationships.
According to the theoretical models put forward to explain the FMR in Sect. 5.1, a relationship between stellar mass, metallicity, and gas mass is to be expected. Given the FMR, it follows from the KS relation which states that the gas mass sets the SFR and vice versa (Eq. [2]). Thus the FMR and the relationship discussed in this section are just two renderings of the same underlying physical principle, namely, that galaxies are driven out the equilibrium mass-metallicity relationship by sudden bursts in the inflow rate. These changes increase the HI mass, increase the SFR, and decreases the metallicity of the ISM, all at once.
5.3 The mass-metallicity-size relationship
Based on some 44000 SDSS galaxies, Ellison et al. (2008) found a relation between , specific SFR, and galaxy size (as parameterized by the half-light radius). They found that at fixed , physically smaller galaxies are also more metal rich. The metallicity changes by 0.1 dex when the galaxy size changes by a factor of 2. The authors discard biases due to the finite size of the central region used to estimate metallicities, and to the Hubble type dependence of the radius. A similar relationship between size and metallicity was also found at by Yabe et al. (2012).
This non-trivial observational result is, however, a natural outcome of the gas accretion driven SF process. In the stationary state the metallicity is mainly set by the mass loading factor ( in Eq. [11]), which changes systematically with halo mass, that is to say, with the depth of the gravitational potential well from which the baryons have to escape. The mass-metallicity relationship is interpreted considering that the halo mass scales with (Sect. 5.1). However, the gravitational binding energy also depends on the distance of the matter to the center of the gravitational well. At fixed mass, winds escape easier from larger galaxies. Thus they are expected to have larger mass loading factors. If the mass loading factor depends on mass through the escape velocity, then it depends as mass/size. A factor 2 increase in size is equivalent to a factor 2 decrease in mass, and this scaling is consistent with the observed 0.1 dex metallicity drop when either the mass decreases a factor of 2 or the effective radius increases by this amount.
6 Gas accretion and star formation at high redshift
Most of the observational evidence for gas accretion put forward so far has been concentrated on the low redshift universe. Theory predicts that cold gas accretion is particularly important at high redshift, when DM haloes are low mass and the accreted cosmic gas remains cold and ready to form stars (Sect. 2). Thus the high redshift universe corresponds to an epoch of galaxy assembly and high SFR. Here we review observational evidence emphasizing the high redshift aspects not addressed elsewhere in the paper. We include a section on the role of mergers, just to complement the statement made in Sect. 1 that mergers play only a subordinate role in galaxy growth outside dense environments.
6.1 Star formation history of the universe
The star formation rate over the history of the universe has been studied since the mid 90s (e.g., Lilly et al. 1996; Madau et al. 1996; Steidel et al. 1999; Ouchi et al. 2004; Madau & Dickinson 2014). It requires observing faint objects at high redshift and is thus one of the primary drivers for building larger telescopes with adaptive optics and infrared sensitivity. Recent observations of the variation of the cosmic SFR density with redshift are summarized in Fig. 11 (from Bouwens et al. 2011). This diagram includes a candidate redshift galaxy detected in a dropout search in the Hubble Ultra Deep Field. The diagram also includes SFR density determinations at and from Bouwens et al., and values from earlier studies at . Dust corrections are applied, and are already negligible by (Oesch et al. 2010; Bouwens et al. 2010, 2009). Note how the SFR steadily increases with time in the early universe until reaching a maximum at an age of 2.5 Gyr ( 3 - 2).
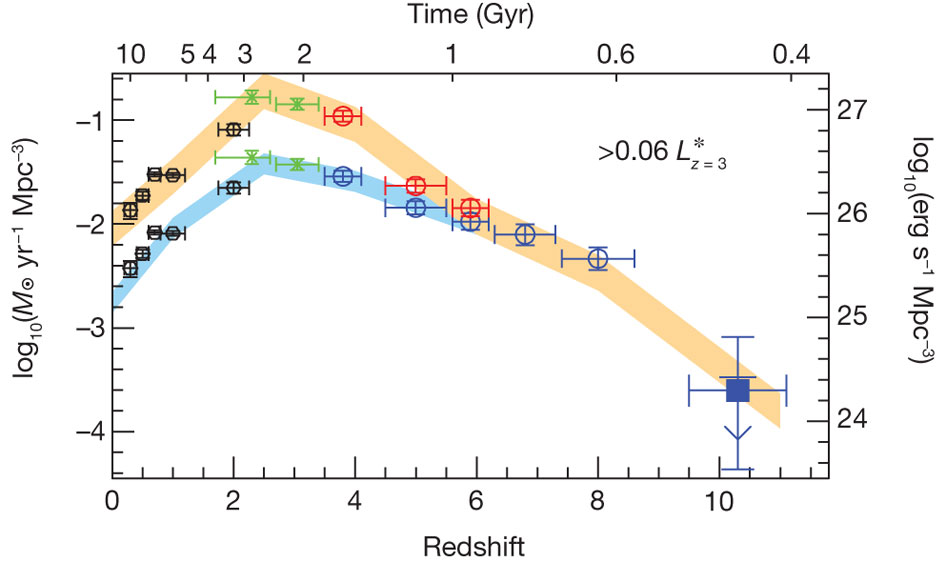
In a complementary work, Heavens et al. (2004) analyzed the fossil record of the current stellar populations in nearly nearby galaxies. This allowed them to reconstruct the SFR density along the age of the universe for galaxies of different masses independently. The results are shown in Fig. 12. The inferred star formation history differs according to the (present) galaxy mass so that the larger the stellar mass the earlier their stars were formed. High and low mass galaxies have very different SF histories. In particular, the global SFR density is driven by the behavior of the most massive systems (cf., Figs 11 and 12), and galaxies with today produced their stars at constant SFR back to at least .
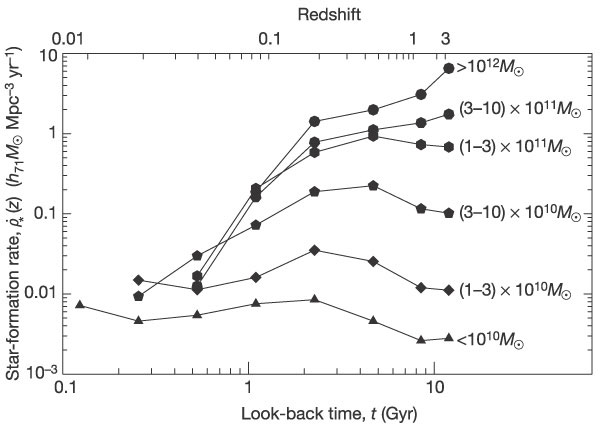
Both the global history (Fig. 11) and the differences among galaxies of different masses (Fig. 12) are well reproduced by cosmological numerical simulations in which most galaxies grow by cold-flow accretion. The agreement with the global SF history (Fig. 11) can be attributed to DM halo growth as reflected in Eq. (12): at very high redshift the haloes grow slowly because of their low mass and their shallow gravitational potential. At low redshift there is little DM available. The two opposing terms conspire to yield a maximum halo growth at 2 - 3 (Eq. [14]). The cosmic star formation history is well reproduced by cosmological numerical simulations including baryons. For example, Schaye et al. (2010) systematically vary details of the modeling to determine the dominant physical processes responsible for the SF history. After a large number of simulations that comprise the OverWhelmingly Large Simulations Project, theoretical diagrams match the observations. The resulting SFR is limited at high redshift by the build-up of dark matter haloes, it reaches a broad maximum at intermediate redshift, and then decreases at lower redshift. The decrease at late times is due to the quenching of SF by lower cooling rates in hotter and lower density gas, in addition to gas exhaustion and self-regulated feedback from stars and black holes. Similar results are provided by, e.g., White & Frenk (1991), Hernquist & Springel (2003), Somerville et al. (2008), Crain et al. (2009), and Choi & Nagamine (2009). Schaye et al. (2010) stress that without AGN feedback it is difficult to match the steep decline in the cosmic SFR below . However, it is not yet clear whether feedback from massive stars can solve the problem. The role of stellar feedback through winds and SNe is an active topic of research at this moment.
6.2 The role of mergers
Gas accretion and feedback, rather than mergers, are the primary processes responsible for the evolution of the cosmic SFR density. This is clear from numerical simulations which point out that accretion of cold gas is the dominant growth mechanism by about an order of magnitude over mergers (e.g., Wang et al. 2011; Combes 2013, see also see Sec. 1). Observations seem to favor this view too.
Galaxies at are often clumpy disks (e.g. Glazebrook et al. 1995; Abraham et al. 1996a, b; van den Bergh et al. 1996; Cowie et al. 1995; Im et al. 1999; Elmegreen et al. 2004, 2005, 2007b, 2009; Förster Schreiber et al. 2009) with large SFR in excess of 100 M⊙ yr-1 (e.g., Bauer et al. 2011). If mergers were responsible for the enhanced star formation, observations should show double nuclei and tidal features, which are indeed observed in some galaxies but not in these clumpy types (Elmegreen et al. 2007a). Unfortunately, there is no direct evidence of gas accretion in the clumpy galaxies; in one system at z=1.6, UDF 6462, the metallicity map shows an overall value of about 0.5 with a central concentration and an outward decrease (Bournaud et al. 2008). The negative gradient is consistent with regular inside-out star formation with no excess of metal-poor gas in the inner regions. Other high- galaxies show positive gradients, though (see Sect. 3.2 and Queyrel et al. 2012; Jones et al. 2013).
H emitters, detected from a flux excess in the Spitzer/IRAC 3.6-m band, comprise more than 70 % of the galaxies with redshifts . Shim et al. (2013) find that the rest-frame UV to optical morphologies for half of them do not show any signs of mergers or tidal interactions. They have large H equivalent widths despite their relatively old stellar population age, which suggests that H emitters are producing stars continuously at a constant rate, rather than through multiple bursts invoked by major mergers. Their continuous star formation rate, relative isolation, and number density are consistent with star formation driven by gas infall.
Conselice et al. (2013) find that the observed merger rate alone cannot explain the mass growth rate of massive galaxies . An additional gas accretion of 90 is needed. Such accretion would account for 36 % of the stellar mass growth and 58 % of the star formation in the 2 Gyr period from . This holds for the most massive galaxies, but the need for gas accretion is even more extreme for less massive galaxies. Based on HST imaging, Kaviraj et al. (2013) find that only 27 % of the star formation budget is hosted by major mergers. Discounting the SFR that even non-interacting galaxies have, the authors estimate an upper limit of 15 % as the contribution of major mergers to star formation in massive galaxies ().
MW-like progenitors also grew by gas accretion from to the present, according to van Dokkum et al. (2013). They study the mass assembly of galaxies expected to have present day . In marked contrast to the assembly history of massive ellipticals, mass growth is not limited to large radii. The mass growth takes place in a fairly uniform way, with the galaxies increasing their mass at all radii. After the growth in the central regions gradually stops and the disk continues to be built up. None of these features reflect the dramatic effects expected from major mergers.
Another indication disfavoring mergers comes from the increase of tadpole or cometary galaxies in high redshift fields. These galaxies, with a bright head on a faint tail, exist in the local universe as well as at high redshift (van den Bergh et al. 1996), but they are much more common at high redshift where of the resolved galaxies in the Hubble ultra deep field have this shape (Elmegreen et al. 2005). Local tadpoles are unusual but, surprisingly, they turn out to be very common among extremely low metallicity dwarfs. These and other properties indicate that they are disk galaxies in early stages of assembly through gas accretion (Sects. 3.2 and 4). Low and high redshift tadpoles show a continuum in their properties (Elmegreen & Elmegreen 2010; Elmegreen et al. 2012b), therefore, the physics behind them is likely to be common. High- tadpoles may represent disks being formed by accretion too. Thus, the large number of tadpoles observed at high is consistent with an increase in gas accretion to the detriment of mergers. Tadpoles are only a particular sub-set within the BCD family. The abundance of the BCD high- counterparts, the clumpy-disk galaxies, also increases with increasing (Elmegreen et al. 2005; Swinbank et al. 2009; Genzel et al. 2011; Wisnioski et al. 2012). Therefore the arguments used for tadpoles supporting gas accretion can be extended to BCDs as well.
6.3 The cosmic web in absorption
Star formation in galaxies is self-regulated by the intimate connection between gas mass and SFR, so that the SFR plus outflows driven by feedback tend to balance the cosmic gas accretion rate (Sects. 2.1 and 2.3). These inflows and outflows controlling galaxy evolution show up as intervening absorption systems along the lines-of-sight to background sources, typically QSOs. They include DLAs around galaxies ( cm-2) as well as LLS ( cm-2) and the rest of the Ly forest ( cm-2) (e.g., Wolfe et al. 2005; Rafelski et al. 2011; Kim et al. 2013). Numerical simulations predict Ly column densities spanning the range from the Ly forest to DLAs, inflow velocities km s-1, and metallicities between and (Sect. 2.4). All of these features are present in the observed absorption systems.
DLAs are predominantly neutral gas reservoirs with metallicities that decrease with increasing redshift. From , the relationship has a slope of -0.2 dex per unit , a large scatter ( dex at a given ), and a lower limit that extends at least to (Rafelski et al. 2012, 2014; Cooke et al. 2011b). There are also reports of null detection at high redshift: at (Fumagalli et al. 2011a, LLS), and at (Simcoe et al. 2012, LLS/DLA). The /Fe ratios of the most metal-poor DLAs are similar to those of MW halo stars with metallicities below , suggesting that DLA-like clouds may have been the source of gas that formed halo stars (Cooke et al. 2011a, b). A similarly weak evolution with redshift of the metal content of the IGM had been noted by Pettini et al. (2003, see also ), who speculated that the observed metals were created by the sources responsible for the re-ionization of the universe or, alternatively, by outflows from star forming galaxies at later times.
Ribaudo et al. (2011) reported an LLS at with very low metallicity gas at 37 kpc from a near solar-metallicity 0.3 star-forming galaxy. This was taken as proof of gas infalling onto the galaxy (see the discussion in Sect. 2.4). From this and other evidence from the literature, Ribaudo et al. concluded that 50 % of the LLSs have such low metallicities (a few percent ) and are near ( kpc) a sub- galaxy with solar metallicity. In a subsequent work by this team, also mentioned in Sect. 3.1, Lehner et al. (2013) conducted a survey of HI-selected LLSs to provide an unbiased metallicity study of the CGM at . Their main result is that the metallicity distribution of the LLS is bimodal, with one peak at low metallicity () and the other at high metallicity (). The metal-poor gas has properties consistent with cold accretion streams, while the metal-rich gas likely traces winds, recycled outflows and tidally stripped gas. The behavior of the bimodal metallicity is evidence that inflows and outflows do not mix, and that outflows do not prevent inflows, in agreement with numerical simulations (Sect. 2.3).
Multi-temperature gas in galaxy haloes has been reported too. Crighton et al. (2013) detected Ly, deuterium, OI, and other metals in the CGM of a star-forming galaxy at an impact parameter of 58 kpc. Several components are detected, one of which has low temperature ( K) and metallicity (), which is taken as a direct detection of a high redshift cold accretion stream. The CGM of this galaxy seems to be highly inhomogeneous. The majority of the gas is in a cool, metal-poor and predominantly neutral phase, but the majority of the metals are in a highly ionized phase. The multi-phase nature of the haloes is revealed in the study of a LLS at redshift by Tumlinson et al. (2011). They detected high and low ionization species. The strong detected OVI seems to arise in interface material surrounding the photoionized clouds responsible for the low ionization absorption. A cold phase has also been found by Giavalisco et al. (2011) in an overdensity of galaxies at , and by Kacprzak et al. (2012b) along the projected minor axis of a star-forming spiral galaxy at z = 0.7. Low temperature is not necessarily equivalent to cold accretion. Cold gas inflow has been unambiguously observed towards 6 galaxies in the redshift range by Rubin et al. (2012). In this case the metallicity is supposed to be high and so the authors infer that the material is not from the cosmic web but from dwarf satellites or galactic fountains.
When several lines-of-sight to QSOs are present near a galaxy, the halo gas can begin to be mapped. This is the case for two intermediate redshift galaxies, at z=0.48 and 0.78, which have multiply-lensed QSOs at projected distances of 50 and 33 kpc, respectively (Chen et al. 2014). MgII absorption lines are detected along each of the 4 sightlines in both galaxies. A comparison of the linewidths and velocities with that of their galaxy disks rules out a disk origin or a wind outflow. Instead, the MgII line kinematics are consistent either with infalling streams from the cosmic web or from tidally stripped gas.
One of the predictions of cosmic gas accretion refers to very massive galaxies and the quenching of star formation. If a galaxy becomes too massive, the cosmic web gas is shock-heated when entering the halo, and it takes a long time before the gas settles down and can be used to form new stars (Sect. 2 and Sect. 2.2). This seems to be happening in an HI absorbing complex at z = 0.7 with an impact parameter of 58 kpc from an elliptical galaxy with virial mass (Churchill et al. 2012). Ionization models suggest a cold gas structure surrounded by a hot cloud. The authors interpret the HI complex as a metal-poor filamentary structure being shock heated as it accretes into the halo of the galaxy.
A critically important result from cosmic Ly absorption systems is the fact that the average neutral gas density in the universe has not changed much during the last 10 Gyr. From ESO UVES spectra of 122 QSOs and data from the literature, Zafar et al. (2013) find a constant neutral gas mass density in the universe for , even though star formation varies significantly during that period (Fig. 11). At the peak SFR density (), the time scale to consume all of the cosmic gas in galaxies is only 1 Gyr, therefore, the total neutral gas has to be continuously replenished, partly through galaxy outflows but mostly by recombination of ionized gas. The source of this neutral gas would be the ionized IGM that contains most of the baryons (e.g., Fukugita & Peebles 2004).
6.4 The cosmic web in emission
The cosmic web gas is also detected in emission as Ly blobs (LABs; Keel et al. 1999; Steidel et al. 2000; Francis & McDonnell 2006; Ouchi et al. 2009). Cold-flow streams contain partly ionized gas undergoing continuous recombination and should produce a hydrogen emission line spectrum (Sect. 2.4). Goerdt et al. (2010) determine the Ly flux to be expected from the cold streams that fed galaxies at high redshift. Model MW haloes at have a peak Ly surface brightness of erg cm-2 s-1 arcsec-2, sizes from 50 to 100 kpc, and luminosities between and erg s-1. These characteristics agree with the LABs, primarily observed at redshifts . The number of known LABs is still not very large. For example, a narrow-band imaging survey with the Subaru/Suprime-Cam revealed 14 LAB candidates with a mayor axis diameter larger than 100 kpc (Matsuda et al. 2011). Their shapes range from circular to filamentary. The LAB sample shows a possible morphology-density relationship: filamentary LABs are in average density environment while circular ones reside in both average and overdense environments. Matsuda et al. point out that the more filamentary LABs may relate to cold gas accretion and the more circular ones may relate to large scale gas outflows.
The cosmic web gas also emits through fluorescence of Ly photons originally produced by a relatively nearby source such as a powerful starburst galaxy or a luminous QSO (Cantalupo et al. 2012). Figure 13 shows the Ly image of the UM287 nebula at taken from Cantalupo et al. (2014). In the figure the nebula appears broadly filamentary and asymmetric, extending mostly on the eastern side of QSO up to a projected distance of about 55 arcsec or 460 kpc, which is well beyond the virial radius of any plausibly associated dark-matter halo. Therefore the nebula traces intergalactic gas. Fluorescent Ly photons have also been observed by Rauch et al. (2011) as an elongated structure at with a peak surface brightness around erg cm-2 s-1 arcsec-2. Several of these Ly emitting structures without continuum counterparts have been found by Cantalupo et al. (2012) near a hyperluminous QSO at .
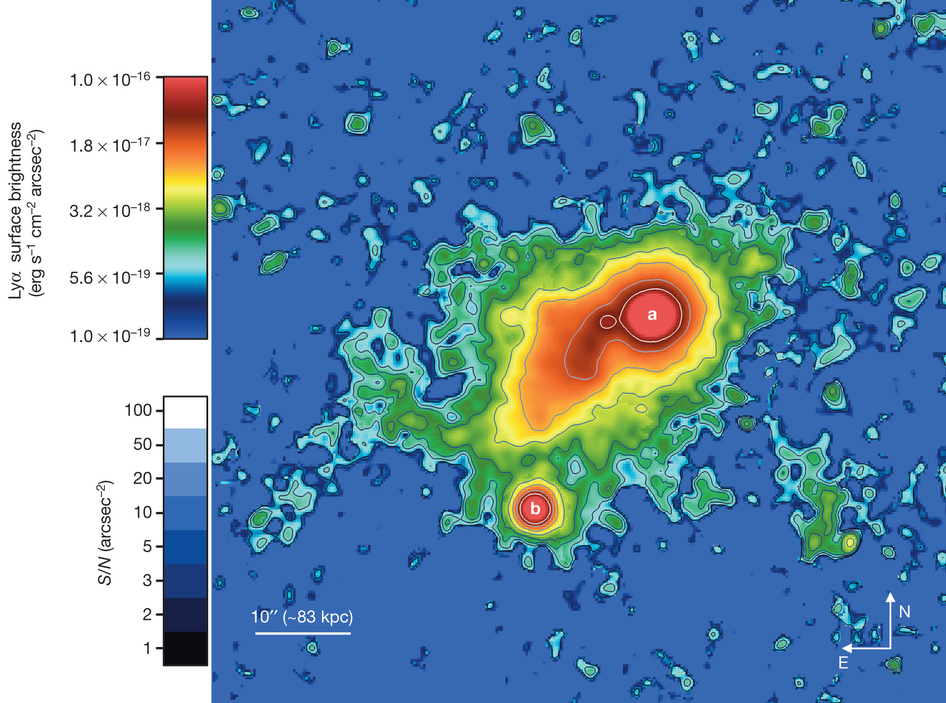
7 Fraction of the star formation sustained by cosmic gas accretion
So far we have been citing evidence for gas accretion driving SF. The question arises as to what is the actual contribution of this cosmic web gas to the observed SF; that is, what is the fraction of SFR in gas that has not previously been inside other stars compared to SFR in gas that has been reprocessed in the galaxy? From a theoretical point of view, the fraction of recently accreted gas involved in star formation must be very high. Equation (10) shows that in a quasi-stationary state more than half of the gas mass participating in any typical star formation event comes directly from cosmological infall; it is not gas ejected from previous star-formation episodes in the galaxy. Theory also tells us that the fraction depends very much on the galaxy tendency to lose mass through winds, so that the larger the losses the higher the fraction of cosmological gas needed to maintain the SF. The fraction reaches 90 % for a mass loading factor typical of a galaxy with (see Sect. 2.3). This section collects a few estimates of this fraction, i.e., of the percentage of star formation sustained by gas accretion. The list is not exhaustive but the number is limited mainly because there are only a few estimates of this parameter in the literature. In general, observations support the theoretical expectations, but the issue is far from settled.
Kaviraj (2014) estimate the contribution of minor mergers to the cosmic SF budget but, in our context, minor mergers are equivalent to gas accretion events. Neither observations nor numerical simulations can easily distinguish a gas rich merger from a starless gas clump (Sect. 2). Kaviraj computes the fraction of the SFR associated with each Hubble type using a sample of 6500 SDSS-Stripe 82 galaxies. He assumes that all SF in early types is due to an external gas supply, because most of their stars were formed so long ago than the debris from those stars render very little gas at this moment. Early types provide only 14 % of the current SFR despite the fact that they account for 50 % of the stellar mass (Fig. 14). If two galaxies have the same mass and the same environment, then they should have the same cosmic gas accretion rate, independently of their Hubble type. Under this premise, he finds that at least 21 % of the SF activity in late types is due to accretion. Adding up the contributions from early and late types, he concludes that at least 35 % of the star formation is due to external accretion. This figure represents a lower limit since it assumes that early and late types have available similar gas supplies, which underestimates late type gas resources.
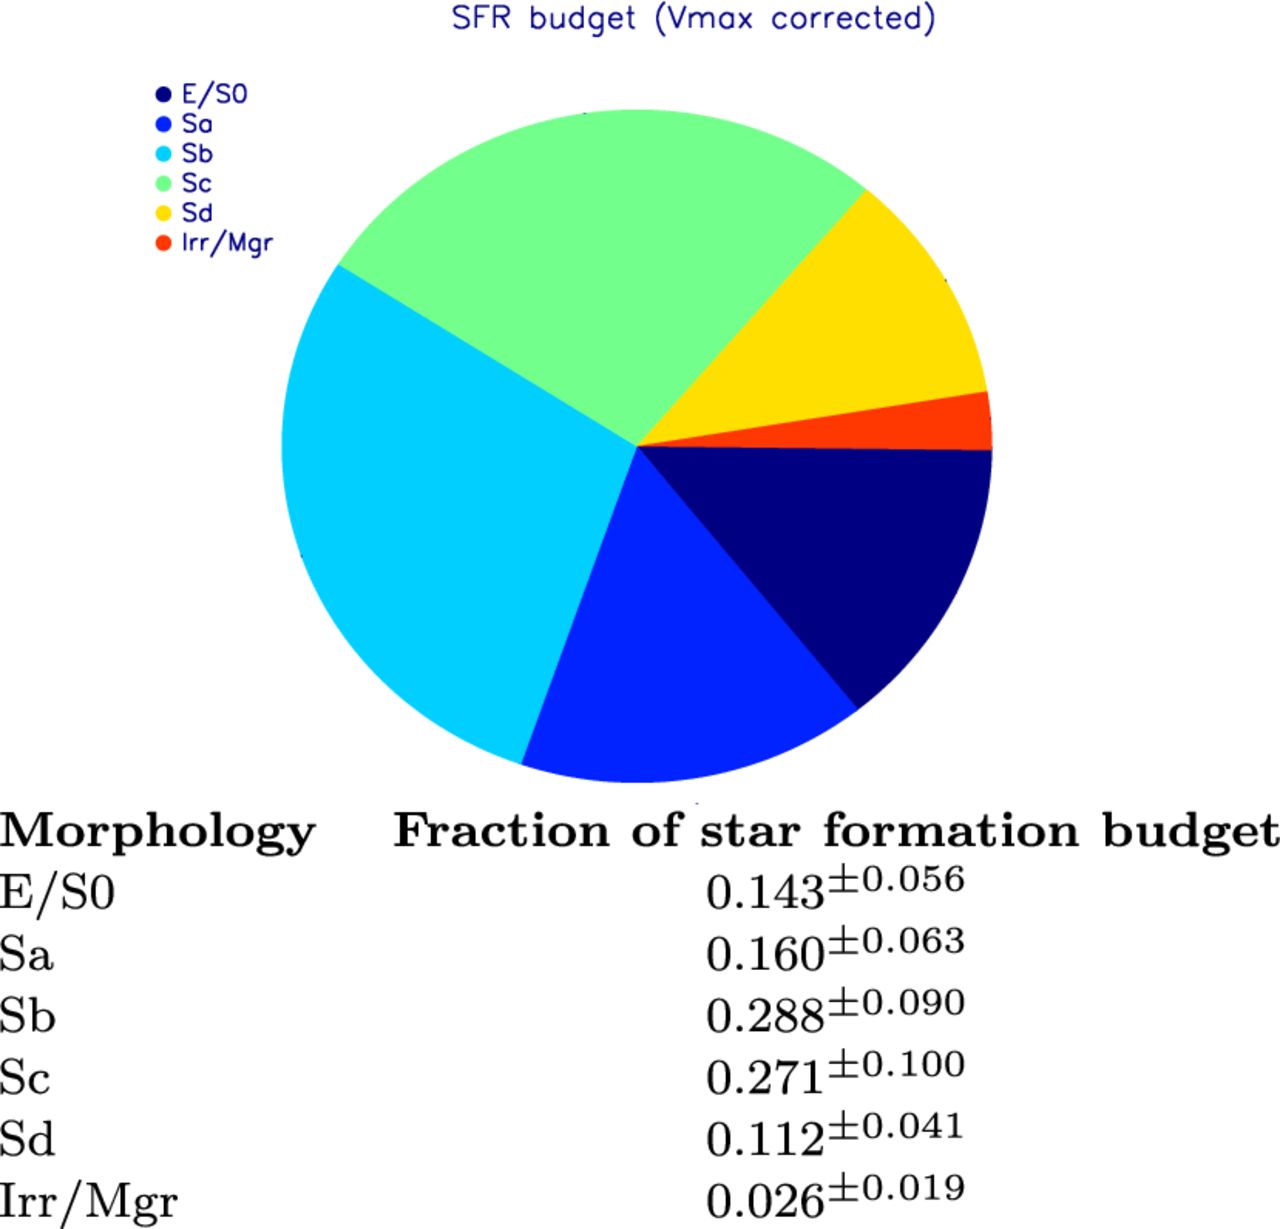
Conselice et al. (2013) study the mass growth of massive galaxies at . They estimate the evolution of stellar mass in these systems from the observed SFRs and the amount of stellar and gas mass added due to observed major and minor mergers. The measured gas mass is insufficient to maintain the inferred star formation history, and the needed additional gas mass cannot be accounted for by gas delivered through minor and major mergers or by recycling of stellar ejecta. The estimates show that during this epoch, and for these massive galaxies, 50 % of the baryonic mass assembly results from gas accretion and unresolved mergers, 25 % is put into place through existing stars from mergers, with the remainder of the mass in the form of gas brought in with these mergers. As for SF during this epoch, 66 % is the result of gas accretion.
Brisbin & Harwit (2012) model the FMR (Sect. 5.1) assuming that external gas infall produces the observed star formation. All galaxies with and many with masses above this threshold follow the model. They conclude that most of the star-forming galaxies with stellar masses , and many with appear to be fed by low-metallicity gas infall.
8 What we understand, and what we do not, and pathways to follow up
Numerical simulations predict that the accretion of metal-poor gas from the cosmic web drives the growth of disk galaxies. They describe galaxies as open systems where gas inflows and outflows determine the gas available to form stars and therefore the global properties of the stellar populations. Observational evidence for gas accretion in galaxies is also numerous although indirect. The gas that falls in or goes out is tenuous, patchy, partly ionized, multi-temperature, and large scale; therefore, it is hard to show in a single observation. A multi-wavelength multi-technique approach is often needed to formulate a compelling case for gas flows associated with SF. Among the many examples given in this paper, we have selected three cases for the sake of illustration: (1) the short gas consumption time-scale compared to the long SF record in most galaxies (Sect. 3.1), (2) the metallicity-SFR relationship, so that at a given stellar mass, the larger the current SFR the lower the metallicity of the gas producing stars (Sect. 5.1), and (3) the large amount of gas hundreds of kpc away from galaxies but with properties related to the closest neighboring galaxy (Sects. 3.1 and 6.3).
The global picture of the interplay between cosmic gas accretion and star formation seems to be understood at a basic level (Sect. 2). In the long term, the gas accretion rate has to balance the SFR since the gas available to form stars is consumed quickly. This balance is self-adjusted by the galaxy modifying the mass of gas available to form stars which, through the KS relation, sets the SFR. The details of the process remain to be worked out, though. They depend on the coupling between physical processes that involve completely different physical scales: from cosmic web structures to molecular clouds and AGN engines.
Many ingredients needed to complete the observational picture remain to be gathered and understood. For example, the large-scale of the gas in the cosmic web should be imaged. Emission has been detected with 10-m class telescopes in Ly at high redshift, but it may also be observable in H in the local universe. Using SFR as a proxy for gas accretion rate, star-forming galaxies can be used to map the gas accretion rate in the universe, near and far. The FMR provides a diagnostic potential that has not been fully exploited yet. Assuming that it is set by cosmic gas infall triggering SF (Sect. 5.1), it allows us to measure various key parameters in galaxy formation including mass loading factors and metallicity of the accreted gas. This is a venue to be explored very much in the vein of the work by Forbes et al. (2013). The neutral gas inflow rate directly observed as HVCs in the MW is one order of magnitude smaller than that required to maintain the SFR (Sect. 3.1). This poses a problem. Several possibilities have been explored (e.g., Sancisi et al. 2008; Joung et al. 2012) but the issue has not been settled yet. Details of the interaction between a cold metal-poor gas stream and a galaxy disk remain to be modeled. Predictions on how this interplay excites starbursts and their metallicities are needed to secure our understand of the FMR (Sect. 5.1). Outflows from dwarfs seem to be the main source of metals in the IGM. However the mixing processes of these outflows with the IGM are poorly captured by numerical simulations. The cooling of halo gas onto supernova debris in galactic fountains has also been suggested as a source of the metal-poor gas driving SF in the MW and other galaxies (Sect. 2.3). Can this possibility be proved or disproved? Cosmic web gas might also be detected through the Sunyaev-Zeldovich effect imprinted on the Cosmic Microwave Background; this is a promising technique under development now (e.g., Génova-Santos et al. 2013, and references therein).
These and other future research programs will contribute to our understanding of cosmic accretion. They will eventually complete the picture that has been emerging over the last few years, in which cosmic gas accretion plays a fundamental role in sustaining star formation in disk galaxies.
| Acronym | Expansion |
|---|---|
| AGN | Active galactic nucleus |
| BCD | Blue compact dwarf |
| BH | Black hole |
| CGM | Circum galactic medium |
| DM | Dark matter |
| DLA | Damped Lyman- absorbers |
| FMR | Fundamental metallicity relationship |
| HVC | High velocity clouds |
| IGM | Intergalactic medium |
| ISM | Interstellar medium |
| IMF | Initial mass function |
| KS | Kennicutt-Schmidt |
| cold dark matter | |
| LAB | Lyman blobs |
| LLS | Lyman limit systems |
| Stellar mass | |
| Gas mass | |
| Dark matter halo mass | |
| MW | Milky Way |
| QBCD | Quiescent blue compact dwarf |
| QSO | Quasar |
| SF | Star formation |
| SFR | Star formation rate |
| SN, SNe | Supernova, Supernovae |
| SPH | Smoothed particle hydrodynamics |
| UV | Ultraviolet |
| Mass loading factor | |
| XMP | Extremely metal poor |
| Redshift | |
| Metallicity |
Acknowledgements.
Daniel Ceverino helped us in dissecting the predictions of the cosmological numerical simulations, and Sects. 2.2 and 2.4 owe much to his patience. Discussions with Claudio Dalla Vecchia were also fundamental for the development of many aspects of the work. Thanks are due to Mercedes Filho for discussions and clarifications on the HI content of galaxies, and to Practika Dayal, Martin Harwit, and Simon Lilly for discussions on modeling the FMR. Fernando Atrio pointed out the work to image the cosmic web through the Sunyaev-Zeldovich effect. We are grateful to Joss Bland-Hawthorn, Filippo Fraternali, Jairo Méndez-Abreu, and Max Pettini for comments on the manuscript. We acknowledge the intensive use of the NASA Astrophysics Data System (ADS), including Private Libraries.The work has been partly funded by the Spanish MINECO, project AYA 2010-21887-C04-04 and Severo Ochoa program SEV-2011-0187. Figures 6 and 7 have been reproduced with permission of the AAS, and Figs. 5 and 8 with permission of ESO.References
- Abazajian et al. (2009) Abazajian, K. N., Adelman-McCarthy, J. K., Agüeros, M. A., et al. 2009, ApJS, 182, 543
- Abraham et al. (1996a) Abraham, R. G., Tanvir, N. R., Santiago, B. X., et al. 1996a, MNRAS, 279, L47
- Abraham et al. (1996b) Abraham, R. G., van den Bergh, S., Glazebrook, K., et al. 1996b, ApJS, 107, 1
- Algorry et al. (2014) Algorry, D. G., Navarro, J. F., Abadi, M. G., et al. 2014, MNRAS, 437, 3596
- Aloisi et al. (2007) Aloisi, A., Clementini, G., Tosi, M., et al. 2007, ApJ, 667, L151
- Altay et al. (2013) Altay, G., Theuns, T., Schaye, J., Booth, C. M., & Dalla Vecchia, C. 2013, MNRAS, 436, 2689
- Amorín et al. (2009) Amorín, R., Aguerri, J. A. L., Muñoz-Tuñón, C., & Cairós, L. M. 2009, A&A, 501, 75
- Amorín et al. (2012a) Amorín, R., Pérez-Montero, E., Vílchez, J. M., & Papaderos, P. 2012a, ApJ, 749, 185
- Amorín et al. (2012b) Amorín, R., Vílchez, J. M., Hägele, G. F., et al. 2012b, ApJ, 754, L22
- Amorín et al. (2007) Amorín, R. O., Muñoz-Tuñón, C., Aguerri, J. A. L., Cairós, L. M., & Caon, N. 2007, A&A, 467, 541
- Amorín et al. (2010) Amorín, R. O., Pérez-Montero, E., & Vílchez, J. M. 2010, ApJ, 715, L128
- Andrews & Martini (2013) Andrews, B. H. & Martini, P. 2013, ApJ, 765, 140
- Angus et al. (2011) Angus, G. W., Diaferio, A., & Kroupa, P. 2011, MNRAS, 416, 1401
- Ashley et al. (2013) Ashley, T., Simpson, C. E., & Elmegreen, B. G. 2013, AJ, 146, 42
- Audouze & Silk (1995) Audouze, J. & Silk, J. 1995, ApJ, 451, L49
- Balcells & Quinn (1990) Balcells, M. & Quinn, P. J. 1990, ApJ, 361, 381
- Baldwin et al. (1980) Baldwin, J. E., Lynden-Bell, D., & Sancisi, R. 1980, MNRAS, 193, 313
- Bauer et al. (2011) Bauer, A. E., Conselice, C. J., Pérez-González, P. G., et al. 2011, MNRAS, 417, 289
- Bellazzini et al. (2013) Bellazzini, M., Oosterloo, T., Fraternali, F., & Beccari, G. 2013, A&A, 559, L11
- Benson (2010) Benson, A. J. 2010, Physics Reports, 495, 33
- Bi et al. (1992) Bi, H. G., Boerner, G., & Chu, Y. 1992, A&A, 266, 1
- Binney (1977) Binney, J. 1977, ApJ, 215, 483
- Binney (2013) Binney, J. 2013, NewAR, 57, 29
- Birnboim & Dekel (2003) Birnboim, Y. & Dekel, A. 2003, MNRAS, 345, 349
- Bland-Hawthorn et al. (2007) Bland-Hawthorn, J., Sutherland, R., Agertz, O., & Moore, B. 2007, ApJ, 670, L109
- Blasco-Herrera et al. (2013) Blasco-Herrera, J., Fathi, K., Östlin, G., Font, J., & Beckman, J. E. 2013, MNRAS, 435, 1958
- Blitz et al. (1999) Blitz, L., Spergel, D. N., Teuben, P. J., Hartmann, D., & Burton, W. B. 1999, ApJ, 514, 818
- Borde et al. (2014) Borde, A., Palanque-Delabrouille, N., Rossi, G., et al. 2014, ArXiv e-prints
- Bothwell et al. (2013) Bothwell, M. S., Maiolino, R., Kennicutt, R., et al. 2013, MNRAS, 433, 1425
- Bouché et al. (2013) Bouché, N., Murphy, M. T., Kacprzak, G. G., et al. 2013, Science, 341, 50
- Bournaud et al. (2005) Bournaud, F., Combes, F., Jog, C. J., & Puerari, I. 2005, A&A, 438, 507
- Bournaud et al. (2008) Bournaud, F., Daddi, E., Elmegreen, B. G., et al. 2008, A&A, 486, 741
- Bournaud & Elmegreen (2009) Bournaud, F. & Elmegreen, B. G. 2009, ApJ, 694, L158
- Bouwens et al. (2009) Bouwens, R. J., Illingworth, G. D., Franx, M., et al. 2009, ApJ, 705, 936
- Bouwens et al. (2011) Bouwens, R. J., Illingworth, G. D., Labbe, I., et al. 2011, Nature, 469, 504
- Bouwens et al. (2010) Bouwens, R. J., Illingworth, G. D., Oesch, P. A., et al. 2010, ApJ, 709, L133
- Bregman et al. (2013) Bregman, J. N., Miller, E. D., Seitzer, P., Cowley, C. R., & Miller, M. J. 2013, ApJ, 766, 57
- Bresolin et al. (2012) Bresolin, F., Kennicutt, R. C., & Ryan-Weber, E. 2012, ApJ, 750, 122
- Brisbin & Harwit (2012) Brisbin, D. & Harwit, M. 2012, ApJ, 750, 142
- Bromm & Larson (2004) Bromm, V. & Larson, R. B. 2004, ARA&A, 42, 79
- Brook et al. (2013) Brook, C. B., Stinson, G., Gibson, B. K., et al. 2013, ArXiv e-prints
- Brooks et al. (2009) Brooks, A. M., Governato, F., Quinn, T., Brook, C. B., & Wadsley, J. 2009, ApJ, 694, 396
- Burchett et al. (2013) Burchett, J. N., Tripp, T. M., Werk, J. K., et al. 2013, ApJ, 779, L17
- Caimmi (2008) Caimmi, R. 2008, NewA, 13, 314
- Cairós et al. (2003) Cairós, L. M., Caon, N., Papaderos, P., et al. 2003, ApJ, 593, 312
- Cantalupo et al. (2014) Cantalupo, S., Arrigoni-Battaia, F., Prochaska, J. X., Hennawi, J. F., & Madau, P. 2014, Nature, 506, 63
- Cantalupo et al. (2012) Cantalupo, S., Lilly, S. J., & Haehnelt, M. G. 2012, MNRAS, 425, 1992
- Cardamone et al. (2009) Cardamone, C., Schawinski, K., Sarzi, M., et al. 2009, MNRAS, 399, 1191
- Ceverino et al. (2010) Ceverino, D., Dekel, A., & Bournaud, F. 2010, MNRAS, 404, 2151
- Ceverino et al. (2012) Ceverino, D., Dekel, A., Mandelker, N., et al. 2012, MNRAS, 420, 3490
- Chen et al. (2013) Chen, C.-T. J., Hickox, R. C., Alberts, S., et al. 2013, ApJ, 773, 3
- Chen et al. (2014) Chen, H.-W., Gauthier, J.-R., Sharon, K., et al. 2014, MNRAS, 438, 1435
- Choi & Nagamine (2009) Choi, J.-H. & Nagamine, K. 2009, MNRAS, 393, 1595
- Chung et al. (2012) Chung, A., Bureau, M., van Gorkom, J. H., & Koribalski, B. 2012, MNRAS, 422, 1083
- Churchill et al. (2012) Churchill, C. W., Kacprzak, G. G., Steidel, C. C., et al. 2012, ApJ, 760, 68
- Churchill et al. (2013) Churchill, C. W., Trujillo-Gomez, S., Nielsen, N. M., & Kacprzak, G. G. 2013, ApJ, 779, 87
- Cid Fernandes (2007) Cid Fernandes, R. 2007, in IAU Symposium, Vol. 241, IAU Symposium, ed. A. Vazdekis & R. Peletier, 461–469
- Coccato et al. (2011) Coccato, L., Morelli, L., Corsini, E. M., et al. 2011, MNRAS, 412, L113
- Codis et al. (2012) Codis, S., Pichon, C., Devriendt, J., et al. 2012, MNRAS, 427, 3320
- Combes (2008) Combes, F. 2008, in IAU Symposium, Vol. 245, IAU Symposium, ed. M. Bureau, E. Athanassoula, & B. Barbuy, 151–160
- Combes (2013) Combes, F. 2013, Memorie della Societa Astronomica Italiana Supplementi, 25, 45
- Combes (2014) Combes, F. 2014, in Astronomical Society of the Pacific Conference Series, Vol. 480, Astronomical Society of the Pacific Conference Series, ed. M. S. Seigar & P. Treuthardt, 211
- Combes et al. (2013) Combes, F., Moiseev, A., & Reshetnikov, V. 2013, A&A, 554, A11
- Conselice et al. (2013) Conselice, C. J., Mortlock, A., Bluck, A. F. L., Grützbauch, R., & Duncan, K. 2013, MNRAS, 430, 1051
- Cooke et al. (2011a) Cooke, R., Pettini, M., Steidel, C. C., Rudie, G. C., & Jorgenson, R. A. 2011a, MNRAS, 412, 1047
- Cooke et al. (2011b) Cooke, R., Pettini, M., Steidel, C. C., Rudie, G. C., & Nissen, P. E. 2011b, MNRAS, 417, 1534
- Corbin et al. (2006) Corbin, M. R., Vacca, W. D., Cid Fernandes, R., et al. 2006, ApJ, 651, 861
- Corsini et al. (2012) Corsini, E. M., Méndez-Abreu, J., Pastorello, N., et al. 2012, MNRAS, 423, L79
- Cowie et al. (1995) Cowie, L. L., Hu, E. M., & Songaila, A. 1995, AJ, 110, 1576
- Crain et al. (2009) Crain, R. A., Theuns, T., Dalla Vecchia, C., et al. 2009, MNRAS, 399, 1773
- Cresci et al. (2010) Cresci, G., Mannucci, F., Maiolino, R., et al. 2010, Nature, 467, 811
- Crighton et al. (2013) Crighton, N. H. M., Hennawi, J. F., & Prochaska, J. X. 2013, ApJ, 776, L18
- Cullen et al. (2014) Cullen, F., Cirasuolo, M., McLure, R. J., Dunlop, J. S., & Bowler, R. A. A. 2014, MNRAS, 440, 2300
- Davé et al. (2012) Davé, R., Finlator, K., & Oppenheimer, B. D. 2012, MNRAS, 421, 98
- Davé et al. (2013) Davé, R., Katz, N., Oppenheimer, B. D., Kollmeier, J. A., & Weinberg, D. H. 2013, MNRAS, 434, 2645
- Davidson et al. (1989) Davidson, K., Kinman, T. D., & Friedman, S. D. 1989, AJ, 97, 1591
- Dayal et al. (2013) Dayal, P., Ferrara, A., & Dunlop, J. S. 2013, MNRAS, 430, 2891
- de Avillez & Mac Low (2002) de Avillez, M. A. & Mac Low, M.-M. 2002, ApJ, 581, 1047
- Dekel & Birnboim (2006) Dekel, A. & Birnboim, Y. 2006, MNRAS, 368, 2
- Dekel et al. (2009) Dekel, A., Birnboim, Y., Engel, G., et al. 2009, Nature, 457, 451
- Dekel et al. (2013) Dekel, A., Zolotov, A., Tweed, D., et al. 2013, MNRAS, 435, 999
- Diaz & Bekki (2012) Diaz, J. D. & Bekki, K. 2012, ApJ, 750, 36
- Dickey & Lockman (1990) Dickey, J. M. & Lockman, F. J. 1990, ARA&A, 28, 215
- Dohm-Palmer et al. (1998) Dohm-Palmer, R. C., Skillman, E. D., Gallagher, J., et al. 1998, AJ, 116, 1227
- Dubois et al. (2014) Dubois, Y., Pichon, C., Welker, C., et al. 2014, ArXiv e-prints
- Edmunds (2005) Edmunds, M. 2005, Astronomy and Geophysics, 46, 040000
- Edmunds (1990) Edmunds, M. G. 1990, MNRAS, 246, 678
- Edmunds & Greenhow (1995) Edmunds, M. G. & Greenhow, R. M. 1995, MNRAS, 272, 241
- Ekta et al. (2006) Ekta, Chengalur, J. N., & Pustilnik, S. A. 2006, MNRAS, 372, 853
- Ekta & Chengalur (2010) Ekta, B. & Chengalur, J. N. 2010, MNRAS, 403, 295
- Ellison et al. (2008) Ellison, S. L., Patton, D. R., Simard, L., & McConnachie, A. W. 2008, ApJ, 672, L107
- Elmegreen et al. (2008) Elmegreen, B. G., Bournaud, F., & Elmegreen, D. M. 2008, ApJ, 688, 67
- Elmegreen & Elmegreen (2010) Elmegreen, B. G. & Elmegreen, D. M. 2010, ApJ, 722, 1895
- Elmegreen et al. (2012a) Elmegreen, B. G., Zhang, H.-X., & Hunter, D. A. 2012a, ApJ, 747, 105
- Elmegreen et al. (2007a) Elmegreen, D. M., Elmegreen, B. G., Ferguson, T., & Mullan, B. 2007a, ApJ, 663, 734
- Elmegreen et al. (2009) Elmegreen, D. M., Elmegreen, B. G., Marcus, M. T., et al. 2009, ApJ, 701, 306
- Elmegreen et al. (2007b) Elmegreen, D. M., Elmegreen, B. G., Ravindranath, S., & Coe, D. A. 2007b, ApJ, 658, 763
- Elmegreen et al. (2005) Elmegreen, D. M., Elmegreen, B. G., Rubin, D. S., & Schaffer, M. A. 2005, ApJ, 631, 85
- Elmegreen et al. (2012b) Elmegreen, D. M., Elmegreen, B. G., Sánchez Almeida, J., et al. 2012b, ApJ, 750, 95
- Elmegreen et al. (2004) Elmegreen, D. M., Elmegreen, B. G., & Sheets, C. M. 2004, ApJ, 603, 74
- Fardal et al. (2001) Fardal, M. A., Katz, N., Gardner, J. P., et al. 2001, ApJ, 562, 605
- Faucher-Giguère & Kereš (2011) Faucher-Giguère, C.-A. & Kereš, D. 2011, MNRAS, 412, L118
- Faucher-Giguère et al. (2011) Faucher-Giguère, C.-A., Kereš, D., & Ma, C.-P. 2011, MNRAS, 417, 2982
- Feldmann (2013) Feldmann, R. 2013, MNRAS, 433, 1910
- Filho et al. (2013) Filho, M. E., Winkel, B., Sánchez Almeida, J., et al. 2013, A&A, 558, A18
- Finkelman et al. (2011) Finkelman, I., Moiseev, A., Brosch, N., & Katkov, I. 2011, MNRAS, 418, 1834
- Finlator & Davé (2008) Finlator, K. & Davé, R. 2008, MNRAS, 385, 2181
- Font et al. (2011) Font, A. S., McCarthy, I. G., Crain, R. A., et al. 2011, MNRAS, 416, 2802
- Fontanot et al. (2009) Fontanot, F., De Lucia, G., Monaco, P., Somerville, R. S., & Santini, P. 2009, MNRAS, 397, 1776
- Forbes et al. (2013) Forbes, J. C., Krumholz, M. R., Burkert, A., & Dekel, A. 2013, ArXiv e-prints
- Forbes et al. (2014) Forbes, J. C., Krumholz, M. R., Burkert, A., & Dekel, A. 2014, MNRAS, 438, 1552
- Ford et al. (2013) Ford, A. B., Davé, R., Oppenheimer, B. D., et al. 2013, ArXiv e-prints
- Förster Schreiber et al. (2009) Förster Schreiber, N. M., Genzel, R., Bouché, N., et al. 2009, ApJ, 706, 1364
- Fox et al. (2014) Fox, A. J., Wakker, B. P., Barger, K. A., et al. 2014, ArXiv e-prints
- Francis & McDonnell (2006) Francis, P. J. & McDonnell, S. 2006, MNRAS, 370, 1372
- Fraternali (2014) Fraternali, F. 2014, in IAU Symposium, Vol. 298, IAU Symposium, ed. S. Feltzing, G. Zhao, N. A. Walton, & P. Whitelock, 228–239
- Fraternali & Tomassetti (2012) Fraternali, F. & Tomassetti, M. 2012, MNRAS, 426, 2166
- Fu et al. (2013) Fu, J., Kauffmann, G., Huang, M.-l., et al. 2013, MNRAS, 434, 1531
- Fukugita & Peebles (2004) Fukugita, M. & Peebles, P. J. E. 2004, ApJ, 616, 643
- Fumagalli et al. (2011a) Fumagalli, M., O’Meara, J. M., & Prochaska, J. X. 2011a, Science, 334, 1245
- Fumagalli et al. (2011b) Fumagalli, M., Prochaska, J. X., Kasen, D., et al. 2011b, MNRAS, 418, 1796
- Gallazzi et al. (2005) Gallazzi, A., Charlot, S., Brinchmann, J., White, S. D. M., & Tremonti, C. A. 2005, MNRAS, 362, 41
- Garnett (2002) Garnett, D. R. 2002, ApJ, 581, 1019
- Genel et al. (2012a) Genel, S., Dekel, A., & Cacciato, M. 2012a, MNRAS, 425, 788
- Genel et al. (2012b) Genel, S., Naab, T., Genzel, R., et al. 2012b, ApJ, 745, 11
- Génova-Santos et al. (2013) Génova-Santos, R., Suárez-Velásquez, I., Atrio-Barandela, F., & Mücket, J. P. 2013, MNRAS, 432, 2480
- Genzel et al. (2011) Genzel, R., Newman, S., Jones, T., et al. 2011, ApJ, 733, 101
- Genzel et al. (2010) Genzel, R., Tacconi, L. J., Gracia-Carpio, J., et al. 2010, MNRAS, 407, 2091
- Giavalisco et al. (2011) Giavalisco, M., Vanzella, E., Salimbeni, S., et al. 2011, ApJ, 743, 95
- Glazebrook et al. (1995) Glazebrook, K., Ellis, R., Santiago, B., & Griffiths, R. 1995, MNRAS, 275, L19
- Gnedin et al. (2014) Gnedin, N. Y., Tasker, E. J., & Fujimoto, Y. 2014, ApJ, 787, L7
- Goerdt & Burkert (2013) Goerdt, T. & Burkert, A. 2013, ArXiv e-prints
- Goerdt et al. (2010) Goerdt, T., Dekel, A., Sternberg, A., et al. 2010, MNRAS, 407, 613
- Guo et al. (2011) Guo, Q., White, S., Boylan-Kolchin, M., et al. 2011, MNRAS, 413, 101
- Gupta et al. (2012) Gupta, A., Mathur, S., Krongold, Y., Nicastro, F., & Galeazzi, M. 2012, ApJ, 756, L8
- Hallenbeck et al. (2012) Hallenbeck, G., Papastergis, E., Huang, S., et al. 2012, AJ, 144, 87
- Harris et al. (2004) Harris, J., Calzetti, D., Gallagher, III, J. S., Smith, D. A., & Conselice, C. J. 2004, ApJ, 603, 503
- Haurberg et al. (2013) Haurberg, N. C., Rosenberg, J., & Salzer, J. J. 2013, ApJ, 765, 66
- Haynes (2007) Haynes, M. P. 2007, Nuovo Cimento B Serie, 122, 1109
- Haynes (2008) Haynes, M. P. 2008, in IAU Symposium, Vol. 244, IAU Symposium, ed. J. I. Davies & M. J. Disney, 83–92
- Haynes et al. (1984) Haynes, M. P., Giovanelli, R., & Chincarini, G. L. 1984, ARA&A, 22, 445
- Heald et al. (2011) Heald, G., Józsa, G., Serra, P., et al. 2011, A&A, 526, A118
- Heavens et al. (2004) Heavens, A., Panter, B., Jimenez, R., & Dunlop, J. 2004, Nature, 428, 625
- Hernandez et al. (2013) Hernandez, A. K., Wakker, B. P., Benjamin, R. A., et al. 2013, ApJ, 777, 19
- Hernquist et al. (1996) Hernquist, L., Katz, N., Weinberg, D. H., & Miralda-Escudé, J. 1996, ApJ, 457, L51
- Hernquist & Springel (2003) Hernquist, L. & Springel, V. 2003, MNRAS, 341, 1253
- Hidalgo et al. (2011) Hidalgo, S. L., Aparicio, A., Skillman, E., et al. 2011, ApJ, 730, 14
- Hobbs et al. (2013) Hobbs, A., Read, J., Power, C., & Cole, D. 2013, MNRAS, 434, 1849
- Hopkins et al. (2013a) Hopkins, P. F., Keres, D., Onorbe, J., et al. 2013a, ArXiv e-prints
- Hopkins et al. (2013b) Hopkins, P. F., Kereš, D., & Murray, N. 2013b, MNRAS, 432, 2639
- Hughes et al. (2013) Hughes, T. M., Cortese, L., Boselli, A., Gavazzi, G., & Davies, J. I. 2013, A&A, 550, A115
- Husemann et al. (2011) Husemann, B., Wisotzki, L., Jahnke, K., & Sánchez, S. F. 2011, A&A, 535, A72
- Im et al. (1999) Im, M., Griffiths, R. E., Naim, A., et al. 1999, ApJ, 510, 82
- Immeli et al. (2004) Immeli, A., Samland, M., Westera, P., & Gerhard, O. 2004, ApJ, 611, 20
- Izotov et al. (1999) Izotov, Y. I., Chaffee, F. H., Foltz, C. B., et al. 1999, ApJ, 527, 757
- Izotov et al. (2009) Izotov, Y. I., Guseva, N. G., Fricke, K. J., & Papaderos, P. 2009, A&A, 503, 61
- Izotov et al. (2011) Izotov, Y. I., Guseva, N. G., & Thuan, T. X. 2011, ApJ, 728, 161
- Izotov et al. (2005) Izotov, Y. I., Thuan, T. X., & Guseva, N. G. 2005, ApJ, 632, 210
- Jia Liang & Chen (2014) Jia Liang, C. & Chen, H.-W. 2014, ArXiv e-prints
- Johnson et al. (2012) Johnson, M., Hunter, D. A., Oh, S.-H., et al. 2012, AJ, 144, 152
- Jones et al. (2013) Jones, T., Ellis, R. S., Richard, J., & Jullo, E. 2013, ApJ, 765, 48
- Joung et al. (2012) Joung, M. R., Putman, M. E., Bryan, G. L., Fernández, X., & Peek, J. E. G. 2012, ApJ, 759, 137
- Kacprzak & Churchill (2011) Kacprzak, G. G. & Churchill, C. W. 2011, ApJ, 743, L34
- Kacprzak et al. (2012a) Kacprzak, G. G., Churchill, C. W., & Nielsen, N. M. 2012a, ApJ, 760, L7
- Kacprzak et al. (2012b) Kacprzak, G. G., Churchill, C. W., Steidel, C. C., Spitler, L. R., & Holtzman, J. A. 2012b, MNRAS, 427, 3029
- Kamphuis et al. (2013) Kamphuis, P., Rand, R. J., Józsa, G. I. G., et al. 2013, MNRAS, 434, 2069
- Kannappan (2004) Kannappan, S. J. 2004, ApJ, 611, L89
- Kannappan et al. (2013) Kannappan, S. J., Stark, D. V., Eckert, K. D., et al. 2013, ApJ, 777, 42
- Kaviraj (2014) Kaviraj, S. 2014, MNRAS, 437, L41
- Kaviraj et al. (2013) Kaviraj, S., Cohen, S., Windhorst, R. A., et al. 2013, MNRAS, 429, L40
- Keel et al. (1999) Keel, W. C., Cohen, S. H., Windhorst, R. A., & Waddington, I. 1999, AJ, 118, 2547
- Kennicutt & Evans (2012) Kennicutt, R. C. & Evans, N. J. 2012, ARA&A, 50, 531
- Kennicutt (1983) Kennicutt, Jr., R. C. 1983, ApJ, 272, 54
- Kennicutt (1998) Kennicutt, Jr., R. C. 1998, ApJ, 498, 541
- Kereš et al. (2009) Kereš, D., Katz, N., Fardal, M., Davé, R., & Weinberg, D. H. 2009, MNRAS, 395, 160
- Kereš et al. (2005) Kereš, D., Katz, N., Weinberg, D. H., & Davé, R. 2005, MNRAS, 363, 2
- Kereš et al. (2012) Kereš, D., Vogelsberger, M., Sijacki, D., Springel, V., & Hernquist, L. 2012, MNRAS, 425, 2027
- Kim et al. (2013) Kim, T.-S., Partl, A. M., Carswell, R. F., & Müller, V. 2013, A&A, 552, A77
- Koleva et al. (2014) Koleva, M., De Rijcke, S., Zeilinger, W. W., et al. 2014, MNRAS, 441, 452
- Köppen & Hensler (2005) Köppen, J. & Hensler, G. 2005, A&A, 434, 531
- Kormendy (2013) Kormendy, J. 2013, Secular Evolution in Disk Galaxies, ed. J. Falcón-Barroso & J. H. Knapen, 1
- Kravtsov (2013) Kravtsov, A. V. 2013, ApJ, 764, L31
- Kravtsov & Borgani (2012) Kravtsov, A. V. & Borgani, S. 2012, ARA&A, 50, 353
- Kreckel et al. (2011) Kreckel, K., Peebles, P. J. E., van Gorkom, J. H., van de Weygaert, R., & van der Hulst, J. M. 2011, AJ, 141, 204
- Krumholz et al. (2012) Krumholz, M. R., Dekel, A., & McKee, C. F. 2012, ApJ, 745, 69
- Kunth & Lebouteiller (2011) Kunth, D. & Lebouteiller, V. 2011, in EAS Publications Series, Vol. 48, EAS Publications Series, ed. M. Koleva, P. Prugniel, & I. Vauglin, 95–96
- Kunth & Östlin (2000) Kunth, D. & Östlin, G. 2000, A&ARev, 10, 1
- Kunth & Sargent (1986) Kunth, D. & Sargent, W. L. W. 1986, ApJ, 300, 496
- Lackner et al. (2012) Lackner, C. N., Cen, R., Ostriker, J. P., & Joung, M. R. 2012, MNRAS, 425, 641
- Laigle et al. (2013) Laigle, C., Pichon, C., Codis, S., et al. 2013, ArXiv e-prints
- Lara-López et al. (2010) Lara-López, M. A., Cepa, J., Bongiovanni, A., et al. 2010, A&A, 521, L53
- Larson (1972) Larson, R. B. 1972, Nature Physical Science, 236, 7
- Latif et al. (2011) Latif, M. A., Schleicher, D. R. G., Spaans, M., & Zaroubi, S. 2011, MNRAS, 413, L33
- Lebouteiller et al. (2013) Lebouteiller, V., Heap, S., Hubeny, I., & Kunth, D. 2013, A&A, 553, A16
- Lebouteiller et al. (2009) Lebouteiller, V., Kunth, D., Thuan, T. X., & Désert, J. M. 2009, A&A, 494, 915
- Lee et al. (2008) Lee, H., Bell, E. F., & Somerville, R. S. 2008, in IAU Symposium, Vol. 255, IAU Symposium, ed. L. K. Hunt, S. C. Madden, & R. Schneider, 100–105
- Lehner & Howk (2011) Lehner, N. & Howk, J. C. 2011, Science, 334, 955
- Lehner et al. (2013) Lehner, N., Howk, J. C., Tripp, T. M., et al. 2013, ApJ, 770, 138
- Leitner & Kravtsov (2011) Leitner, S. N. & Kravtsov, A. V. 2011, ApJ, 734, 48
- Lelli et al. (2012a) Lelli, F., Verheijen, M., Fraternali, F., & Sancisi, R. 2012a, A&A, 537, A72
- Lelli et al. (2012b) Lelli, F., Verheijen, M., Fraternali, F., & Sancisi, R. 2012b, A&A, 544, A145
- Lemonias et al. (2011) Lemonias, J. J., Schiminovich, D., Thilker, D., et al. 2011, ApJ, 733, 74
- Levesque et al. (2011) Levesque, E. M., Berger, E., Soderberg, A. M., & Chornock, R. 2011, ApJ, 739, 23
- L’Huillier et al. (2012) L’Huillier, B., Combes, F., & Semelin, B. 2012, A&A, 544, A68
- Li et al. (2013) Li, Y., Bresolin, F., & Kennicutt, Jr., R. C. 2013, ApJ, 766, 17
- Li & Helmi (2008) Li, Y.-S. & Helmi, A. 2008, MNRAS, 385, 1365
- Libeskind et al. (2011) Libeskind, N. I., Knebe, A., Hoffman, Y., et al. 2011, MNRAS, 411, 1525
- Lilly et al. (2013) Lilly, S. J., Carollo, C. M., Pipino, A., Renzini, A., & Peng, Y. 2013, ApJ, 772, 119
- Lilly et al. (1996) Lilly, S. J., Le Fevre, O., Hammer, F., & Crampton, D. 1996, ApJ, 460, L1
- López-Corredoira et al. (2002) López-Corredoira, M., Betancort-Rijo, J., & Beckman, J. E. 2002, A&A, 386, 169
- López-Sánchez et al. (2012) López-Sánchez, Á. R., Koribalski, B. S., van Eymeren, J., et al. 2012, MNRAS, 419, 1051
- Lovell et al. (2011) Lovell, M. R., Eke, V. R., Frenk, C. S., & Jenkins, A. 2011, MNRAS, 413, 3013
- Ly et al. (2014) Ly, C., Malkan, M. A., Nagao, T., et al. 2014, ApJ, 780, 122
- Lynden-Bell (1975) Lynden-Bell, D. 1975, Vistas in Astronomy, 19, 299
- Lynden-Bell (1983) Lynden-Bell, D. 1983, in IAU Symposium, Vol. 100, Internal Kinematics and Dynamics of Galaxies, ed. E. Athanassoula, 89–91
- Madau & Dickinson (2014) Madau, P. & Dickinson, M. 2014, ArXiv e-prints
- Madau et al. (1996) Madau, P., Ferguson, H. C., Dickinson, M. E., et al. 1996, MNRAS, 283, 1388
- Magrini et al. (2007) Magrini, L., Corbelli, E., & Galli, D. 2007, A&A, 470, 843
- Mannucci et al. (2010) Mannucci, F., Cresci, G., Maiolino, R., Marconi, A., & Gnerucci, A. 2010, MNRAS, 408, 2115
- Marasco & Fraternali (2011) Marasco, A. & Fraternali, F. 2011, A&A, 525, A134
- Marasco et al. (2012) Marasco, A., Fraternali, F., & Binney, J. J. 2012, MNRAS, 419, 1107
- Marasco et al. (2013) Marasco, A., Marinacci, F., & Fraternali, F. 2013, MNRAS, 433, 1634
- Marinacci et al. (2010) Marinacci, F., Binney, J., Fraternali, F., et al. 2010, MNRAS, 404, 1464
- Martínez-Delgado et al. (2010) Martínez-Delgado, D., Gabany, R. J., Crawford, K., et al. 2010, AJ, 140, 962
- Martinkus et al. (2014) Martinkus, C., Cannon, J. M., Adams, E. A., et al. 2014, in American Astronomical Society Meeting Abstracts, Vol. 223, American Astronomical Society Meeting Abstracts, 246.51
- Mas-Hesse & Kunth (1999) Mas-Hesse, J. M. & Kunth, D. 1999, A&A, 349, 765
- Mastropietro et al. (2005) Mastropietro, C., Moore, B., Mayer, L., Wadsley, J., & Stadel, J. 2005, MNRAS, 363, 509
- Mathewson et al. (1974) Mathewson, D. S., Cleary, M. N., & Murray, J. D. 1974, ApJ, 190, 291
- Matsuda et al. (2011) Matsuda, Y., Yamada, T., Hayashino, T., et al. 2011, MNRAS, 410, L13
- Matthews et al. (1998) Matthews, L. D., van Driel, W., & Gallagher, III, J. S. 1998, AJ, 116, 1169
- McQuinn et al. (2010a) McQuinn, K. B. W., Skillman, E. D., Cannon, J. M., et al. 2010a, ApJ, 721, 297
- McQuinn et al. (2010b) McQuinn, K. B. W., Skillman, E. D., Cannon, J. M., et al. 2010b, ApJ, 724, 49
- Melioli et al. (2008) Melioli, C., Brighenti, F., D’Ercole, A., & de Gouveia Dal Pino, E. M. 2008, MNRAS, 388, 573
- Miskolczi et al. (2011) Miskolczi, A., Bomans, D. J., & Dettmar, R.-J. 2011, A&A, 536, A66
- Moffett et al. (2012) Moffett, A. J., Kannappan, S. J., Baker, A. J., & Laine, S. 2012, ApJ, 745, 34
- Moiseev et al. (2011) Moiseev, A. V., Smirnova, K. I., Smirnova, A. A., & Reshetnikov, V. P. 2011, MNRAS, 418, 244
- Morales-Luis et al. (2011) Morales-Luis, A. B., Sánchez Almeida, J., Aguerri, J. A. L., & Muñoz-Tuñón, C. 2011, ApJ, 743, 77
- Moran et al. (2012) Moran, S. M., Heckman, T. M., Kauffmann, G., et al. 2012, ApJ, 745, 66
- Muller & Oort (1951) Muller, C. A. & Oort, J. H. 1951, Nature, 168, 357
- Munoz-Tunon et al. (2014) Munoz-Tunon, C., Sanchez Almeida, J., Elmegreen, D. M., & Elmegreen, B. G. 2014, ArXiv e-prints
- Muratov et al. (2013) Muratov, A. L., Gnedin, O. Y., Gnedin, N. Y., & Zemp, M. 2013, ApJ, 772, 106
- Nelson et al. (2013) Nelson, D., Vogelsberger, M., Genel, S., et al. 2013, MNRAS, 429, 3353
- Nichols et al. (2011) Nichols, M., Colless, J., Colless, M., & Bland-Hawthorn, J. 2011, ApJ, 742, 110
- Nidever et al. (2013) Nidever, D. L., Ashley, T., Slater, C. T., et al. 2013, ApJ, 779, L15
- Noguchi (1999) Noguchi, M. 1999, ApJ, 514, 77
- Ocvirk et al. (2008) Ocvirk, P., Pichon, C., & Teyssier, R. 2008, MNRAS, 390, 1326
- Oesch et al. (2010) Oesch, P. A., Bouwens, R. J., Illingworth, G. D., et al. 2010, ApJ, 709, L16
- Oort (1966) Oort, J. H. 1966, BAIN, 18, 421
- Oosterloo et al. (2013) Oosterloo, T. A., Heald, G. H., & de Blok, W. J. G. 2013, A&A, 555, L7
- Oppenheimer et al. (2012) Oppenheimer, B. D., Davé, R., Katz, N., Kollmeier, J. A., & Weinberg, D. H. 2012, MNRAS, 420, 829
- Ouchi et al. (2009) Ouchi, M., Ono, Y., Egami, E., et al. 2009, ApJ, 696, 1164
- Ouchi et al. (2004) Ouchi, M., Shimasaku, K., Okamura, S., et al. 2004, ApJ, 611, 685
- Papaderos et al. (2008) Papaderos, P., Guseva, N. G., Izotov, Y. I., & Fricke, K. J. 2008, A&A, 491, 113
- Papaderos et al. (1996) Papaderos, P., Loose, H.-H., Thuan, T. X., & Fricke, K. J. 1996, A&AS, 120, 207
- Peeples & Shankar (2011) Peeples, M. S. & Shankar, F. 2011, MNRAS, 417, 2962
- Peng & Maiolino (2014) Peng, Y.-j. & Maiolino, R. 2014, MNRAS, 438, 262
- Pérez-Montero et al. (2013) Pérez-Montero, E., Contini, T., Lamareille, F., et al. 2013, A&A, 549, A25
- Pettini et al. (2003) Pettini, M., Madau, P., Bolte, M., et al. 2003, ApJ, 594, 695
- Pichon et al. (2011) Pichon, C., Pogosyan, D., Kimm, T., et al. 2011, MNRAS, 418, 2493
- Pilyugin et al. (2004) Pilyugin, L. S., Vílchez, J. M., & Contini, T. 2004, A&A, 425, 849
- Pisano (2014) Pisano, D. J. 2014, AJ, 147, 48
- Pisano et al. (1998) Pisano, D. J., Wilcots, E. M., & Elmegreen, B. G. 1998, AJ, 115, 975
- Pizzella et al. (2013) Pizzella, A., Morelli, L., Corsini, E. M., Dalla Bontà, E., & Cesetti, M. 2013, A&A, 560, A14
- Popping & Braun (2011a) Popping, A. & Braun, R. 2011a, A&A, 533, A122
- Popping & Braun (2011b) Popping, A. & Braun, R. 2011b, A&A, 527, A90
- Powell et al. (2011) Powell, L. C., Slyz, A., & Devriendt, J. 2011, MNRAS, 414, 3671
- Prada et al. (1996) Prada, F., Gutierrez, C. M., Peletier, R. F., & McKeith, C. D. 1996, ApJ, 463, L9
- Queyrel et al. (2012) Queyrel, J., Contini, T., Kissler-Patig, M., et al. 2012, A&A, 539, A93
- Rafelski et al. (2014) Rafelski, M., Neeleman, M., Fumagalli, M., Wolfe, A. M., & Prochaska, J. X. 2014, ApJ, 782, L29
- Rafelski et al. (2011) Rafelski, M., Wolfe, A. M., & Chen, H.-W. 2011, ApJ, 736, 48
- Rafelski et al. (2012) Rafelski, M., Wolfe, A. M., Prochaska, J. X., Neeleman, M., & Mendez, A. J. 2012, ApJ, 755, 89
- Rauch et al. (2011) Rauch, M., Becker, G. D., Haehnelt, M. G., et al. 2011, MNRAS, 418, 1115
- Reddy et al. (2012) Reddy, N. A., Pettini, M., Steidel, C. C., et al. 2012, ApJ, 754, 25
- Rees & Ostriker (1977) Rees, M. J. & Ostriker, J. P. 1977, MNRAS, 179, 541
- Reichard et al. (2009) Reichard, T. A., Heckman, T. M., Rudnick, G., et al. 2009, ApJ, 691, 1005
- Ribaudo et al. (2011) Ribaudo, J., Lehner, N., Howk, J. C., et al. 2011, ApJ, 743, 207
- Richter (2012) Richter, P. 2012, ApJ, 750, 165
- Robertson et al. (2013) Robertson, P., Shields, G. A., Davé, R., Blanc, G. A., & Wright, A. 2013, ApJ, 773, 4
- Rosdahl & Blaizot (2012) Rosdahl, J. & Blaizot, J. 2012, MNRAS, 423, 344
- Roškar et al. (2010) Roškar, R., Debattista, V. P., Brooks, A. M., et al. 2010, MNRAS, 408, 783
- Rubin et al. (2012) Rubin, K. H. R., Prochaska, J. X., Koo, D. C., & Phillips, A. C. 2012, ApJ, 747, L26
- Ryan-Weber et al. (2009) Ryan-Weber, E. V., Pettini, M., Madau, P., & Zych, B. J. 2009, MNRAS, 395, 1476
- Sadoun et al. (2013) Sadoun, R., Mohayaee, R., & Colin, J. 2013, ArXiv e-prints
- Sánchez et al. (2014) Sánchez, S. F., Rosales-Ortega, F. F., Iglesias-Páramo, J., et al. 2014, A&A, 563, A49
- Sánchez Almeida et al. (2009) Sánchez Almeida, J., Aguerri, J. A. L., Muñoz-Tuñón, C., & Vazdekis, A. 2009, ApJ, 698, 1497
- Sánchez Almeida et al. (2014) Sánchez Almeida, J., Morales-Luis, A. B., Muñoz-Tuñón, C., et al. 2014, ApJ, 783, 45
- Sánchez Almeida et al. (2008) Sánchez Almeida, J., Muñoz-Tuñón, C., Amorín, R., et al. 2008, ApJ, 685, 194
- Sánchez Almeida et al. (2013) Sánchez Almeida, J., Muñoz-Tuñón, C., Elmegreen, D. M., Elmegreen, B. G., & Méndez-Abreu, J. 2013, ApJ, 767, 74
- Sánchez Almeida et al. (2012) Sánchez Almeida, J., Terlevich, R., Terlevich, E., Cid Fernandes, R., & Morales-Luis, A. B. 2012, ApJ, 756, 163
- Sancisi et al. (2008) Sancisi, R., Fraternali, F., Oosterloo, T., & van der Hulst, T. 2008, A&ARev, 15, 189
- Santini (2011) Santini, P. 2011, Journal of Physics Conference Series, 280, 012007
- Sargent & Searle (1970) Sargent, W. L. W. & Searle, L. 1970, ApJ, 162, L155
- Schaye (2001) Schaye, J. 2001, ApJ, 559, 507
- Schaye et al. (2010) Schaye, J., Dalla Vecchia, C., Booth, C. M., et al. 2010, MNRAS, 402, 1536
- Schechter (1976) Schechter, P. 1976, ApJ, 203, 297
- Schmidt (1959) Schmidt, M. 1959, ApJ, 129, 243
- Schmidt (1963) Schmidt, M. 1963, ApJ, 137, 758
- Schmidt et al. (2014) Schmidt, P., Józsa, G. I. G., Gentile, G., et al. 2014, A&A, 561, A28
- Schönrich & Binney (2009) Schönrich, R. & Binney, J. 2009, MNRAS, 396, 203
- Semelin & Combes (2005) Semelin, B. & Combes, F. 2005, A&A, 441, 55
- Shen et al. (2012) Shen, S., Madau, P., Aguirre, A., et al. 2012, ApJ, 760, 50
- Shim et al. (2013) Shim, H., Chary, R.-R., Dickinson, M., et al. 2013, in Astronomical Society of the Pacific Conference Series, Vol. 477, Astronomical Society of the Pacific Conference Series, ed. W.-H. Sun, C. K. Xu, N. Z. Scoville, & D. B. Sanders, 185
- Shlosman (2013) Shlosman, I. 2013, Cosmological Evolution of Galaxies, ed. J. Falcón-Barroso & J. H. Knapen, 555
- Sijacki et al. (2012) Sijacki, D., Vogelsberger, M., Kereš, D., Springel, V., & Hernquist, L. 2012, MNRAS, 424, 2999
- Sil’chenko & Moiseev (2014) Sil’chenko, O. K. & Moiseev, A. V. 2014, ArXiv e-prints
- Silich et al. (2010) Silich, S., Tenorio-Tagle, G., Muñoz-Tuñón, C., et al. 2010, ApJ, 711, 25
- Silk (1977) Silk, J. 1977, ApJ, 211, 638
- Silk & Mamon (2012) Silk, J. & Mamon, G. A. 2012, Research in Astronomy and Astrophysics, 12, 917
- Simcoe et al. (2012) Simcoe, R. A., Sullivan, P. W., Cooksey, K. L., et al. 2012, Nature, 492, 79
- Skillman et al. (1989) Skillman, E. D., Kennicutt, R. C., & Hodge, P. W. 1989, ApJ, 347, 875
- Somerville et al. (2008) Somerville, R. S., Hopkins, P. F., Cox, T. J., Robertson, B. E., & Hernquist, L. 2008, MNRAS, 391, 481
- Spavone & Iodice (2013) Spavone, M. & Iodice, E. 2013, MNRAS, 434, 3310
- Spavone et al. (2011) Spavone, M., Iodice, E., Arnaboldi, M., Longo, G., & Gerhard, O. 2011, A&A, 531, A21
- Spitoni et al. (2008) Spitoni, E., Recchi, S., & Matteucci, F. 2008, A&A, 484, 743
- Steidel et al. (1999) Steidel, C. C., Adelberger, K. L., Giavalisco, M., Dickinson, M., & Pettini, M. 1999, ApJ, 519, 1
- Steidel et al. (2000) Steidel, C. C., Adelberger, K. L., Shapley, A. E., et al. 2000, ApJ, 532, 170
- Stewart et al. (2011a) Stewart, K. R., Kaufmann, T., Bullock, J. S., et al. 2011a, ApJ, 735, L1
- Stewart et al. (2011b) Stewart, K. R., Kaufmann, T., Bullock, J. S., et al. 2011b, ApJ, 738, 39
- Stringer et al. (2009) Stringer, M. J., Benson, A. J., Bundy, K., Ellis, R. S., & Quetin, E. L. 2009, MNRAS, 393, 1127
- Swinbank et al. (2009) Swinbank, A. M., Webb, T. M., Richard, J., et al. 2009, MNRAS, 400, 1121
- Tenorio-Tagle (1996) Tenorio-Tagle, G. 1996, AJ, 111, 1641
- Tenorio-Tagle & Muñoz-Tuñón (1997) Tenorio-Tagle, G. & Muñoz-Tuñón, C. 1997, ApJ, 478, 134
- Tenorio-Tagle & Munoz-Tunon (1998) Tenorio-Tagle, G. & Munoz-Tunon, C. 1998, MNRAS, 293, 299
- Terlevich et al. (1991) Terlevich, R., Melnick, J., Masegosa, J., Moles, M., & Copetti, M. V. F. 1991, A&AS, 91, 285
- Thöne et al. (2014) Thöne, C. C., Christensen, L., Prochaska, J. X., et al. 2014, ArXiv e-prints
- Thuan & Izotov (2005) Thuan, T. X. & Izotov, Y. I. 2005, ApJS, 161, 240
- Tornatore et al. (2010) Tornatore, L., Borgani, S., Viel, M., & Springel, V. 2010, MNRAS, 402, 1911
- Torrey et al. (2012) Torrey, P., Cox, T. J., Kewley, L., & Hernquist, L. 2012, ApJ, 746, 108
- Tremonti et al. (2004) Tremonti, C. A., Heckman, T. M., Kauffmann, G., et al. 2004, ApJ, 613, 898
- Troncoso et al. (2014) Troncoso, P., Maiolino, R., Sommariva, V., et al. 2014, A&A, 563, A58
- Trujillo-Gomez et al. (2013) Trujillo-Gomez, S., Klypin, A., Colin, P., et al. 2013, ArXiv e-prints
- Tsujimoto (2011) Tsujimoto, T. 2011, MNRAS, 410, 2540
- Tumlinson et al. (2013) Tumlinson, J., Thom, C., Werk, J. K., et al. 2013, ApJ, 777, 59
- Tumlinson et al. (2011) Tumlinson, J., Werk, J. K., Thom, C., et al. 2011, ApJ, 733, 111
- van de Voort & Schaye (2012) van de Voort, F. & Schaye, J. 2012, MNRAS, 423, 2991
- van de Voort et al. (2012) van de Voort, F., Schaye, J., Altay, G., & Theuns, T. 2012, MNRAS, 421, 2809
- van de Voort et al. (2011) van de Voort, F., Schaye, J., Booth, C. M., Haas, M. R., & Dalla Vecchia, C. 2011, MNRAS, 414, 2458
- van den Bergh (1962) van den Bergh, S. 1962, AJ, 67, 486
- van den Bergh et al. (1996) van den Bergh, S., Abraham, R. G., Ellis, R. S., et al. 1996, AJ, 112, 359
- van Dokkum et al. (2013) van Dokkum, P. G., Leja, J., Nelson, E. J., et al. 2013, ApJ, 771, L35
- van Woerden et al. (2004) van Woerden, H., Wakker, B. P., Schwarz, U. J., & de Boer, K. S., eds. 2004, Astrophysics and Space Science Library, Vol. 312, High Velocity Clouds
- van Zee et al. (1998) van Zee, L., Salzer, J. J., Haynes, M. P., O’Donoghue, A. A., & Balonek, T. J. 1998, AJ, 116, 2805
- Vergani et al. (2007) Vergani, D., Pizzella, A., Corsini, E. M., et al. 2007, A&A, 463, 883
- Vilchez et al. (1988) Vilchez, J. M., Pagel, B. E. J., Diaz, A. I., Terlevich, E., & Edmunds, M. G. 1988, MNRAS, 235, 633
- Vogelsberger et al. (2012) Vogelsberger, M., Sijacki, D., Kereš, D., Springel, V., & Hernquist, L. 2012, MNRAS, 425, 3024
- Wakker et al. (2007) Wakker, B. P., York, D. G., Howk, J. C., et al. 2007, ApJ, 670, L113
- Wakker et al. (2008) Wakker, B. P., York, D. G., Wilhelm, R., et al. 2008, ApJ, 672, 298
- Wang et al. (2011) Wang, J., Navarro, J. F., Frenk, C. S., et al. 2011, MNRAS, 413, 1373
- Wannier & Wrixon (1972) Wannier, P. & Wrixon, G. T. 1972, ApJ, 173, L119
- Werk et al. (2010) Werk, J. K., Putman, M. E., Meurer, G. R., et al. 2010, ApJ, 715, 656
- White & Frenk (1991) White, S. D. M. & Frenk, C. S. 1991, ApJ, 379, 52
- White & Rees (1978) White, S. D. M. & Rees, M. J. 1978, MNRAS, 183, 341
- Whitmore et al. (1990) Whitmore, B. C., Lucas, R. A., McElroy, D. B., et al. 1990, AJ, 100, 1489
- Wiersma et al. (2009) Wiersma, R. P. C., Schaye, J., & Smith, B. D. 2009, MNRAS, 393, 99
- Wisnioski et al. (2012) Wisnioski, E., Glazebrook, K., Blake, C., et al. 2012, MNRAS, 422, 3339
- Wolfe et al. (2005) Wolfe, A. M., Gawiser, E., & Prochaska, J. X. 2005, ARA&A, 43, 861
- Worthey et al. (1996) Worthey, G., Dorman, B., & Jones, L. A. 1996, AJ, 112, 948
- Yabe et al. (2012) Yabe, K., Ohta, K., Iwamuro, F., et al. 2012, PASJ, 64, 60
- Yang & Krumholz (2012) Yang, C.-C. & Krumholz, M. 2012, ApJ, 758, 48
- Yates et al. (2012) Yates, R. M., Kauffmann, G., & Guo, Q. 2012, MNRAS, 422, 215
- Yuan et al. (2013) Yuan, T.-T., Kewley, L. J., & Rich, J. 2013, ApJ, 767, 106
- Zafar et al. (2013) Zafar, T., Péroux, C., Popping, A., et al. 2013, A&A, 556, A141
- Zahid et al. (2012) Zahid, H. J., Dima, G. I., Kewley, L. J., Erb, D. K., & Davé, R. 2012, ApJ, 757, 54
- Zahid et al. (2013) Zahid, H. J., Kashino, D., Silverman, J. D., et al. 2013, ArXiv e-prints
- Zhao et al. (2013) Zhao, Y., Gao, Y., & Gu, Q. 2013, ApJ, 764, 44
- Zhu & Ménard (2013) Zhu, G. & Ménard, B. 2013, ApJ, 773, 16
- Zschaechner et al. (2012) Zschaechner, L. K., Rand, R. J., Heald, G. H., Gentile, G., & Józsa, G. 2012, ApJ, 760, 37