Phonon-drag effect in FeGa3
Abstract
The thermoelectric properties of single- and polycrystalline FeGa3 are systematically investigated over a wide temperature range. At low temperatures, below 20 K, previously not known pronounced peaks in the thermal conductivity (400-800 W K-1 m-1) with corresponding maxima in the thermopower (in the order of -16000 V K-1) were found in single crystalline samples. Measurements in single crystals along [100] and [001] directions indicate only a slight anisotropy in both the electrical and thermal transport. From susceptibility and heat capacity measurements, a magnetic or structural phase transition was excluded. Using density functional theory-based calculations, we have revisited the electronic structure of FeGa3 and compared the magnetic (including correlations) and non-magnetic electronic densities of states. Thermopower at fixed carrier concentrations are calculated using semi-classical Boltzmann transport theory, and the calculated results match fairly with our experimental data. The inclusion of strong electron correlations treated in a mean-field manner (by LSDA+) does not improve this comparison, rendering strong correlations as the sole explanation for the low temperature enhancement unlikely. Eventually, after a careful review, we assign the peaks in the thermopower as a manifestation of the phonon-drag effect, which is supported by thermopower measurements in a magnetic field.
I introduction
Fe-based semiconductors like FeSi, FeSb2 and FeGa3 have attracted much attention in the past years due to their interesting physical properties. The hybridization of the transition metal orbitals with the main group metal orbitals opens up small band gaps of the order of 0.1 eV for FeSi,Sales et al. (1994) 0.03 eV for FeSb2Petrovic et al. (2003) and 0.47 eV for FeGa3.Hadano et al. (2009) Unusual transport properties and their origins are strongly debated within the community for the past two decades. For example, no clear consensus has been reached on the origin of the extremely high Seebeck coefficient of -45000 V K-1 around 10 K in FeSb2 single crystals.Bentien et al. (2007) Until now the community is split between two main schools of thought, one favoring the presence of strong electron-electron correlationsBentien et al. (2007); Sun et al. (2009, 2011) while the other proposes phonon-drag mechanismTakahashi et al. (2011); Pokharel et al. (2013) as the source for the colossal value of Seebeck effect. Herein, we present for the first time huge thermopower values in the order of -16000 V K-1 below 20 K for single crystals of FeGa3. The experimental results are based on especially good quality single crystals whose chemical compositions have been carefully checked by X-ray powder diffraction and metallographic analysis. Among the various reasons that can rationalize such a large Seebeck coefficient, the main candidates are (i) the presence of strong electronic correlations, (ii) structural phase transitions, (iii) magnetic phase transitions, and (iv) the interaction of the phonons with the mobile charge carriers via the phonon-drag effect. For example, most of the low-temperature anomalies including the enhanced low temperature thermopower in FeSi are explained upon including the electronic correlations in realistic many-body calculations.Tomczak et al. (2012) The onset of a magnetic phase transition has been demonstrated as the reason for the presence of distinct features in thermopower in Mn2-xCrxSb.Wijngaard et al. (1992) Unusual jumps in Seebeck coefficient data have been measured in the parent compound of the Fe-based superconductor LaFeAsO,McGuire et al. (2008) Zn4Sb3Souma et al. (2002) and La1.85-xNdxSr0.15CuO4,Büchner et al. (1993) all of which have been explained in terms of structural phase transitions. Recently, the observation of a large negative Seebeck coefficient of -4500 V K-1 at 18 K in single crystalline CrSb2 has been suggested to emerge from the dominating phonon-drag effect at low temperatures.Sales et al. (2012)
The intermetallic compound FeGa3 was first found during the systematic studies in the binary system Fe-Ga. The crystal structure was originally ascribed to a non-centrosymmetric structure type IrIn3.Schubert et al. (1959, 1958); Dasarathy and Hume-Rothery (1965) On the contrary, a centrosymmetric space group 4 was suggested later for the description of the symmetry for the crystal structure of FeGa3.Lu and Liang (1965) More recent studies confirmed the centrosymmetric crystal structure and reported the first observation of semiconducting behavior.Häussermann et al. (2002) Thermoelectric properties (TE) at temperatures from 300 to 950 K with negative thermopower values were later determined on polycrystalline samples.Amagai et al. (2004) The first characterization on FeGa3 single crystals depending on the crystallographic orientation was reported in Ref. Hadano et al., 2009 but the authors observe the appearance of gallium inclusions of approximately 3 % in their samples. FeGa3 was found to be diamagnetic, which was later validated.Tsujii et al. (2008) Presence of an energy gap was established using magnetic susceptibility measurements (0.29-0.45 eV) and as well as by valence band X-ray photoemission spectroscopy ( 0.8 eV), while 57Fe Mössbauer spectroscopy revealed the absence of magnetic ordering.Tsujii et al. (2008) Nevertheless, considering the narrow 3 bands, Yin and PickettYin and Pickett (2010a) explored the option of a magnetically ordered ground state in FeGa3 using total energy calculations and obtained an antiferromagnetically ordered spin-singlet state upon inclusion of correlation effects. Though no verifiable experimental evidence for a magnetic transition in FeGa3 exists, muon spin rotation spectraStorchak et al. (2012) show the existence of a spin-polaron band, which is consistent with the presence of an antiferromagnetic spin-singlet scenario. Photoemission and inverse photoemission spectroscopic experimentsArita et al. (2011) have also been performed on single crystals of FeGa3 to probe its electronic structure and provide an estimate for the amount of correlation effects in this material. The measured band dispersions were comparable to calculations based on density functional theory (DFT) which included a Coulomb repulsion parameter 3 eV. Nonetheless, the authors conclude that the correlation effects in FeGa3 is not as significant as in FeSi. Recently, another study on doped Fe(Ga,Ge)3 systems using total energy calculations reports an itinerant mechanism ( suggesting a minor role of the electron correlations implicitly) for the experimentally observed ferromagnetism in the -type samples.Umeo et al. (2012); Singh (2013)
In our opinion, the presence/absence of magnetism and/or correlations for the stoichiometric FeGa3 systems is still an open question. Until now, there have been no reports of anomalous transport behavior at low temperatures in FeGa3. We have for the first time grown well-defined single crystals of FeGa3 without any Ga inclusions and with a total mass up to 25 g and performed various thermodynamic and transport measurements. Unusually large Seebeck coefficient (in the order of -16000 V K-1) and thermal conductivity (400-800 W K-1 m-1) below 20 K in single crystalline samples are observed, which disappears in the polycrystalline specimen with equivalent experimental composition. As mentioned in the opening paragraph, various scenarios could be behind these large Seebeck coefficient and thermal conductivity values. In our work, all the options are explored in detail to rationalize the observed low temperature feature.
| Experimental composition | a (Å) | c (Å) | V (Å3) | Remarks |
|---|---|---|---|---|
| Fe1.023(4)Ga2.98(1) | 6.2661(1) | 6.5597(3) | 257.56(1) | Single crystal |
| (flux-grown) | ||||
| Fe1.04(1)Ga2.96(1) | 6.2663(1) | 6.5594(3) | 257.56(1) | Polycrystalline SPS specimen |
| (flux-grown) | ||||
| Fe1.018(3)Ga2.982(4) | 6.2661(2) | 6.5596(4) | 257.57(1) | Single crystal (Czochralski, |
| oriented along [001]) | ||||
| Fe1.013(3)Ga2.987(4) | 6.2665(1) | 6.5586(2) | 257.55(1) | Single crystal (Czochralski, |
| oriented along [100]) | ||||
| FeGa3 | 6.2628(3) | 6.5546(5) | 257.09(4) | Ref. Häussermann et al.,2002 |
| Powder (flux-grown) | ||||
| FeGa3 | 6.262 | 6.556 | 257.07 | Ref. Hadano et al.,2009 |
| Single crystal (flux-grown) |
II Methods
II.1 Synthesis and chemical characterization
Single crystals of FeGa3 were grown using the two-phase region FeGa3 + melt of the Fe-Ga phase diagram (flux-growth). The elements Fe (powder, 99.99 %, ChemPur) and Ga (shots, 99.9999 %, ChemPur) in the ratio 1:20 were weighed in alumina crucibles and encapsulated in quartz ampoules under argon atmosphere with a pressure of 200 mbar. The mixture was heated at a rate of 5 K min-1 up to 1173 K and kept at this temperature for 90 hours. After slow cooling from 1173 K to 473 K the crystals were separated from the remaining solidified melt and cleaned with hydrochloric acid to remove any residual gallium from the surface. A rectangular piece, 5.8 mm in length (longest possible rectangular bar) was cut for TE characterization.
The Czochralski method was used as a second technique to grow large single crystals ( 8 mm). Starting from a homogenized melt of composition Fe16.5Ga83.5 that had been prepared from Fe (bulk, 99.995 %, Alfa Aesar) and Ga (pellets, 99.9999 %, ChemPur), in a first experiment spontaneous nucleation of FeGa3 occurred at a tapered corundum tip. The general approach has been described in Ref. Gille and Bauer, 2008. In the next crystal growth runs, use was made of [001]-oriented FeGa3 seeds to grow well-defined single crystals of a total mass up to 25 g by slowly crystallizing from a Ga-rich melt using pulling rates as low as 0.1 mm h-1 while gradually cooling down the melt according to the changing temperature of the liquid.
For polycrystalline specimens, pieces of the flux-grown crystal were ground to powder and recompacted with the spark plasma sintering (SPS) technique. Using graphite dies, a maximum temperature of 973 K with an uniaxial pressure of 90 MPa was applied for 10 minutes.
X-ray diffraction data sets of all samples were collected on an Image Plate Guinier Camera Huber G670 (Cu K radiation, = 1.54056 Å, 3 ∘ 2 100 ∘, LaB6 as internal standard, a = 4.1569(1) Å). Metallographic investigations were made on plain cross sections after embedding samples in conductive resin (PolyFast, Struers, Denmark) with additional grinding and polishing with micron-sized diamond powders. Wavelength dispersive X-ray spectroscopy (WDXS) investigations of the chemical composition were performed with a Cameca SX 100 spectrometer using FeSi and GaP as standards.
II.2 Physical measurements
Thermal diffusivity measurements of single and polycrystalline samples were performed with the laser flash technique (LFA 427, Netzsch, Germany) in the temperature range from 300 to 773 K. The thermal conductivity was derived from the relation , where is the thermal diffusivity, is the density and is the heat capacity, respectively. The density of the obtained pellet determined by the Archimedes method reaches 92 % of the theoretical value. Heat capacity data at high temperatures were determined by differential scanning calorimetry (DSC 8500, Netzsch). The electrical resistivity and the Seebeck coefficient of rectangular bars were determined simultaneously in a commercial ZEM-3 equipment (ULVAC-Riko, Japan) in the temperature range from 300 to 773 K.
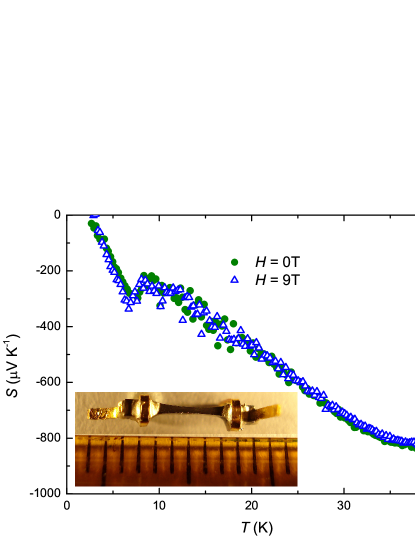
For TE properties at low temperatures from 4 to 350 K the thermal conductivity, electrical resistivity and Seebeck coefficient were measured simultaneously using a commercial system (thermal transport option of a PPMS, Quantum Design, USA). The dependence of thermopower on the magnetic field (H = 0 T, 9 T) was also measured. Given the fact that the thermal conductivity is very high at low temperatures, we additionally reduced the cross section (thinned) at the middle of the sample as depicted in the inset of Fig. 12 in order to maximize the heat flow, while reducing the temperature jumps at the contacts of the sample to the heater and to the heat sink.
Heat capacity measurements in zero-field (ZF) and in field with H = 9 T were carried out using a relaxation method (HC option, PPMS). Magnetic properties were measured on a SQUID magnetometer (MPMS-XL-7, Quantum Design). Zero-field cooling (ZFC, measured in warming) and field cooling magnetization data were taken in various fields up to H = 7 T.
II.3 Calculational details
The total energy calculations to obtain the density of states (DOS) and band structure were performed using the full potential nonorthogonal local orbital code (FPLO)Koepernik and Eschrig (1999) employing the local density approximation (LDA). The Perdew and WangPerdew and Wang (1992) exchange correlation potential was chosen for the scalar relativistic calculations. Additionally, we have explored the possibility of the presence of strong correlations in the Fe 3 shell by including an on-site Coulomb repulsion via the LSDA+ method, applying the “atomic limit” double counting term (also referred to as “fully localized limit” (FLL)). The projector on the correlated orbitals was defined such that the trace of the occupation number matrices represent the 3 gross occupation. The total energies were converged on a dense mesh with 2176 points (303030) for the conventional cell in the irreducible wedge of the Brillouin zone. The transport properties were calculated using the semiclassical Boltzmann transport theoryZiman (2001); Jones and March (1985); Madsen et al. (2003) within the constant scattering approximation as implemented in BoltzTraP.Madsen and Singh (2006) This approximation is based on the assumption that the scattering time determining the electrical conductivity does not vary with energy on the scale of . Additionally, no further assumptions are made for the dependence of on the temperature. This method has been successfully applied to many narrow band gap materials including clathrates, RuIn3 derivatives and as well as other intermetallic compounds and oxides.Madsen et al. (2003); Johnsen et al. (2006); Singh and Kasinathan (2007); Xiang and Singh (2007); Kasinathan et al. (2012) Since the evaluation of transport integrals requires an accurate estimation of band velocities, the energy bands are calculated on a fine mesh of 9126 -points in the irreducible wedge of the Brillouin zone.
III Results and discussions
III.1 Chemical characterizations
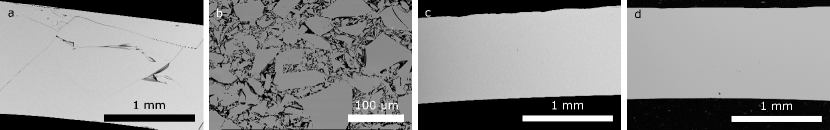
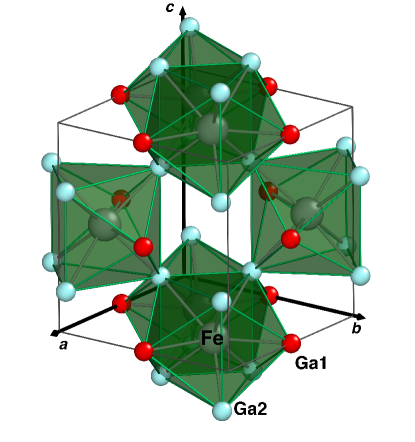
According to metallographic investigations, the obtained single crystals of FeGa3 via flux-growth and Czochralski method were free of non-reacted elemental iron or remaining gallium melt (Fig. 1). All X-ray diffraction patterns (See Supplemental material111See Supplemental Material at http://link.aps.org/Supplemental/… for the XRD pattern) of the single- and polycrystalline samples were indexed with the tetragonal FeGa3 structure type (space group , Fig. 2) without any additional phases. The refined lattice parameters and chemical compositions from WDXS analysis are collected in Table 1. The experimental composition for all samples are identical within the typical error limits of the methods. One characteristic feature is the small excess of iron atoms in comparison to the ideal composition. In the paper, thermoelectric and thermodynamic characterizations are performed mainly on single crystals obtained from Czochralski method. The results can be qualitatively inferred for all single crystalline samples, since the chemical composition of all the samples are identical. Any difference in the thermoelectric properties in polycrystalline material in comparison to the single crystals can be attributed to the changes of the microstructure.
III.2 Thermoelectric properties
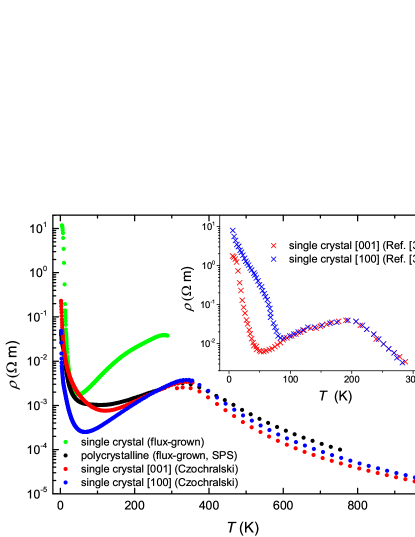
The logarithmic plot of the electrical resistivity as a function of temperature is shown in Fig. 3. For all samples, semiconducting behavior is observed. The extrinsic region at low temperatures is characterized by high resistivity values implying high-purity and high-crystallinity of our materials. The flux-grown crystal shows higher resistivity with a terminated saturation range already at 280 K, signifying the lower level of defects and impurities as compared to the other samples. This arises from the fact that the flux grown single crystals were additionally cleaned with hydrochloric acid which tend to remove extrinsic impurities. From the intrinsic region above 350 K, band gaps were calculated with the Arrhenius law (T) = exp(Eg/2kBT), giving a value of 0.50 eV.222The unoriented bar-shaped piece, which was cut from the flux-grown crystal could not be measured at high temperatures, owing to its short length For the unoriented crystal, a band gap of 0.38 eV can be estimated (calculated for the intrinsic region between 280-360 K). The experimental data are very well comparable to previously published results (0.47 eV).Hadano et al. (2009) A slight anisotropy in FeGa3 is observed below 200 K, with a reduced electrical resistivity in the [100] direction as compared to the [001] direction. A crossover becomes apparent around 250 K leading to slightly reduced resistivity values in the [001] direction above room temperature.
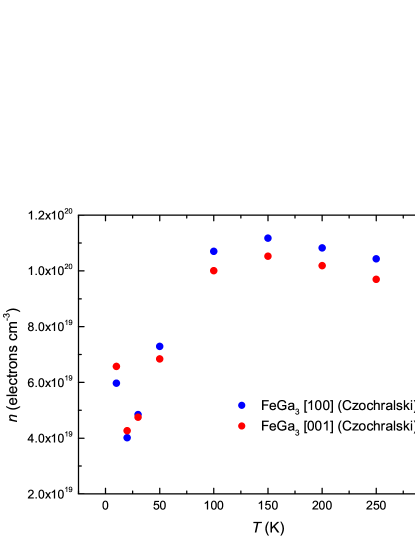
To determine the carrier concentration, we measured Hall resistivity as a function of magnetic field for selected temperatures along [100] and [001] directions for the current flow. The Hall resistivity data were fit with a linear function for both directions between 10 and 300 K. The determined are negative in the entire temperature range, indicating electrons being the main carriers. The carrier concentration calculated using = -1/, is plotted in Fig. 4 as a function of temperature (with = 1.60210-19 C). The carrier concentration does not vary significantly between 100 and 300 K, with room temperature values: = 9.521019 cm-3 and = 1.031020 cm-3. Below 50 K, we observe an abrupt decrease of with the lowest value of 41019 cm-3 at 20 K. Such a feature in is quite unusual and could arise from a low-mobility impurity band close to the conduction band edge, as was shown to be the case for Ge.Fritzche (1955) Recently, another compound where such a feature was observed is the antiferromagnetic semiconductor CrSb2Sales et al. (2012) and the authors determined an occupied low-mobility donor band at 2 K to be causing the minimum in the carrier concentration.
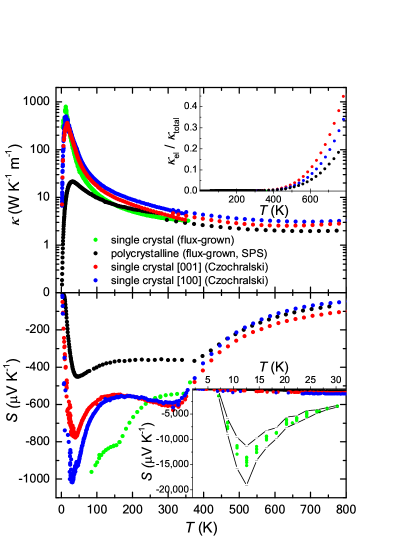
The temperature dependence of the thermal conductivity is plotted in Fig. 5(a). Remarkably huge peaks are observed for all single crystals in the temperature range from 13–16 K. Maximum values of 350 W K-1 m-1 for the single crystal (Czochralski method) with heat flow along [001] direction, 500 W K-1 m-1 for the single crystal (Czochralski method) along [100] direction and 800 W K-1 m-1 for the unoriented single crystal (flux-grown) are observed, which are in contrast to previously published data ( 17.5 W K-1 m-1) on oriented single crystals.Hadano et al. (2009) Due to the presence of grain boundaries in polycrystalline FeGa3, which act as additional scatterers for phonons, the peak collapses yielding values of only 30 W K-1 m-1 at 21 K. At high temperatures, the thermal conductivity for the single crystalline samples differ only slightly. No significant anisotropy in thermal conduction for FeGa3 is observed over the whole temperature range. As expected, the polycrystalline material shows the lowest thermal conductivity among all investigated samples at high temperatures, being consistent to already published data.Amagai et al. (2004) The inset of Fig. 5(a) shows the electronic contribution to the total thermal conductivity estimated via the Wiedemann-Franz law = T, where = 2.4510-8 W K-2 is the Lorenz number. Below 400 K the total thermal conductivity is mainly determined by the lattice thermal conductivity, having nearly no contribution from the electronic part.
The results of the thermopower measurements are depicted in Fig. 5(b). In general, n-type behavior with electrons as majority carriers is observed over the whole temperature range, which is in contrast to the isostructural compounds RuIn3 Wagner et al. (2011) and RuGa3,Wagner-Reetz et al. (2014) where a crossover behavior from to type is observed above room temperature. This is in line with the observed small Fe excess in our synthesized samples (see Table I.).333According to our DFT calculations, Fe carries a small negative charge. At high temperatures, above 400 K similar behavior is observed for all samples independent from the crystallographic orientation. Below 400 K, distinct differences in absolute values are observed. The polycrystalline specimen with the highest defect concentration (e.g. grain boundaries) exhibits the lowest minimum Seebeck coefficient, comparable to published data.Amagai et al. (2004); Haldolaarachchige et al. (2011) The slight anisotropy is presumably electronically driven with an intersection point of the [100] and [001] curves around 200-250 K, as already observed in the electrical resistivity. Analogous to the sequence of the phonon peaks in the thermal conductivity, maximum thermopower values of -750 V K-1 (single crystal via Czochralski method in [001] direction) and -1000 V K-1 (single crystal via Czochralski method in [100] direction) appear. The inset of Fig. 5(b) shows the maximum thermopower value in the order of -16000 V K-1 measured for the unoriented single crystal (flux-grown). Though the low temperature maximum in the thermopower occurs at the same temperature ( 12 K) for all single crystalline samples, the magnitude of for the flux-grown crystal is 16-20 times larger than of the Czochralski single crystals. One main reason for this feature is the non standardized nature of the thermal gradient arising from the length difference between the samples: 6 mm (flux-grown) vs. 8 mm (Czochralski). The obtained values of thermopower are comparable to published data on single crystals of intermetallic CrSb2Sales et al. (2012) or FeSb2,Sun et al. (2009) but differ significantly to orientation-dependent measurements on FeGa3.Hadano et al. (2009) The authors of Ref. Hadano et al., 2009 report gallium inclusions of up to 3% in their single crystalline samples, which could explain the difference between their data and our experimental thermopower.
The enhancement of thermopower at low temperatures in certain narrow band gap semiconductors has been shown to arise from increased electron-electron correlations, i.e. correlated semiconductors like Kondo insulators. Specifically, for iron-based semiconductors like FeSi and FeSb2 large Seebeck coefficients at low temperatures (+500 V K-1 at 50 K in FeSi,Sales et al. (1994) -45000 V K-1 at 10 K in FeSb2Bentien et al. (2007)) have been reported. This feature has been argued to arise due to the presence of strong electronic correlations in these two systems.Aeppli and Fisk (1992); Sun et al. (2011) Though no static magnetic ordering has been observed in pure FeGa3 until now, weak ferromagnetic order has been observedUmeo et al. (2012) for the Ge-doped FeGa3-xGex with = 0.13 and weakly coupled local moments have been observed for Co-doped Fe1-xCoxGa3 with = 0.05.Bittar et al. (2010) These attributes in FeGa3 are also similar to FeSi and FeSb2 where no static magnetic order is observed in the pure compounds, but ferromagnetic metallic states are discerned in FeSi0.75Ge0.25, FeSb2-xTex and Fe1-xCoxSb2.Yeo et al. (2003); Hu et al. (2009, 2006)
III.3 DFT calculations
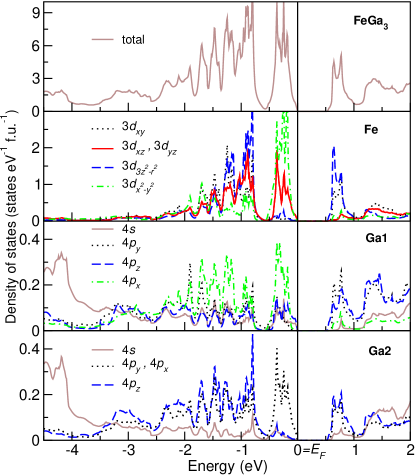
Previously, two works have addressed the eventuality of strong electronic correlations in FeGa3 using DFT-based calculations, but resulted in contradictory scenarios with one paper suggesting the presence of strong electronic correlations in the Fe 3 orbital,Yin and Pickett (2010b) while the other refutes this scenario.Osorio-Guillén et al. (2012) In both these papers, the authors only consider the band structure of non-magnetic or magnetic FeGa3, but not the band structure-derived thermoelectric coefficients. Calculation of Seebeck coefficients involve the calculation of the band velocities, which are quite sensitive to the underlying band dispersions. Since there are no other additional parameters involved in the calculation of the Seebeck coefficients, the results are directly comparable to the experimental measurements, thus this could be used to identify the presence of strong correlations in FeGa3. To that end, we have first calculated the non-magnetic LDA density of states for FeGa3 and the results are collected in Fig. 6. Consistent with previous calculations and as well as our experiments, we obtain a semiconductor with a band gap of 0.52 eV. The valence and conduction band edges of FeGa3 are derived primarily from Fe states with only a small mixing of Ga. This feature is more clearly visible in the site projected DOS in Fig. 6. Note the large difference in the -axis values between Fe and Ga site projected DOS. The valence band maximum is comprised mainly of Fe-3 orbital character, while the conduction band minimum consists mainly of Fe-3 orbital character. There are sharp peak-like features in the DOS on either side of the Fermi level arising from flat bands. These sharp features are conducive for enhanced thermoelectric properties.Mahan and Sofo (1996); Freericks et al. (2003)
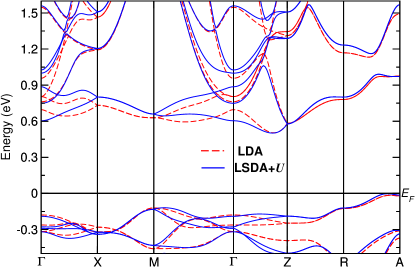
As mentioned previously, though no magnetism has been observed for FeGa3 in experiments, recently there has been some discussion about the presence of strong Coulomb correlations emerging from the narrow 3 bands of this semiconducting system using DFT based calculations. Using LSDA+ with FLL double counting scheme, a structure wherein the nearest neighbor Fe sites are coupled antiferromagnetically with local moments on Fe of the order of 0.6 was found to be stable.Yin and Pickett (2010b) Additionally a semiconducting gap of the order of 0.5 eV was obtained, similar to the experiments. To the contrary, using an optimized double counting scheme (screened by the Yukawa screening length ) no magnetic moment on the iron ions was obtained.Osorio-Guillén et al. (2012) Recently, another DFT work discusses the possibility of itinerant magnetism for both Ge (on the Ga- site) and Co (on the Fe site) doped systems.Singh (2013) Itinerant Stoner ferromagnetism for the doped systems was readily obtained without invoking the need for preexisting moments in the parent semiconducting state, as well as without the need for correlation terms. Furthermore, the Seebeck coefficients was calculated as a function of doping, though only for the non-magnetic ground state. In our work, we calculate the Seebeck coefficients of FeGa3 for both the un-correlated (LDA) and correlated (LSDA+) scenarios to shed more light on the proceeding discussions. Collected in Fig. 7 are the results of the LSDA+ calculation (with FLL double counting scheme) for = 2 eV, with a Hund’s exchange = 0.625 eV. The magnetic pattern used for this calculation is similar to that proposed in Ref. Yin and Pickett, 2010b with the two nearest Fe neighbors ordering antiferromagnetically (AFM). Surprisingly, the resulting AFM LSDA+ band structure close to the Fermi edge, including the size of the semiconducting gap is quite similar to that of the non-magnetic LDA calculations. Moving away from the Fermi edge we observe some differences between the LDA and LSDA+ bands in both the valence and conduction channels. These small differences could in turn alter the transport coefficients since they depend on the band velocities. Significant changes in the calculated Seebeck coefficients between LDA and LSDA+ calculations could provide an alternative view for identifying the presence or absence of magnetism and correlations (described in a mean-field manner) in FeGa3.
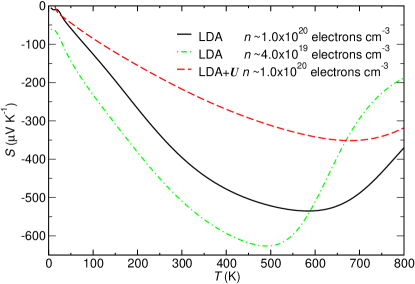
To that end, we have calculated the transport coefficients using the semiclassical Boltzmann theory. The similarity of the band gaps between LDA and AFM LSDA+ calculations permits a direct comparison between the two scenarios. 444We make a note about plotting the experimental and calculated Seebeck coefficients in separate plots: In DFT, it is instructive to calculate the Seebeck coefficient for a fixed carrier concentration, while in reality the carrier concentration may vary as a function of temperature during experimental measurements (see Fig. 4). Hence, a combined plot of the experimental and calculated Seebeck coefficients would be misleading. For cases where the carrier concentration is temperature dependent, comparison between experiment and calculation is more qualitative than quantitative. Collected in Fig. 8 are calculated data of the Seebeck coefficient as a function of temperature within LDA and LSDA+ for a carrier concentration 1.01020 electrons cm-3, obtained from Hall effect measurements for a temperature range 100-300 K. The low temperature enhancement in the Seebeck coefficient observed in the experiments around 20 K is not observed in either of the calculated curves. Decreasing the carrier concentration to 4.01019 electrons cm-3 also does not produce the low temperature feature. The Seebeck coefficient increases monotonically up to 500 K for LDA and up to 700 K for LSDA+, after which it starts to decrease. Above 150 K, the absolute values and the shape of within LDA are more in accordance with the experimental observations and is larger than within LSDA+ by a factor of two. Though the low temperature feature is absent in our calculations, we can nevertheless infer that strong correlations, treated in a mean-field manner do not improve the description of the Seebeck coefficient in FeGa3. More sophisticated calculations that treat Coulomb correlation beyond a mean-field approximation are necessary to obtain a more in-depth understanding of the role of correlations in FeGa3.Grenzeback et al. (2006); Freericks and Zlatić (2001)
III.4 Heat capacity and susceptibility measurements
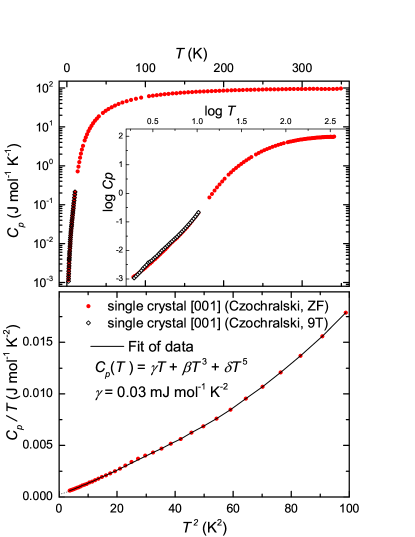
We proceed to investigate the likelihood of a phase transition as a source for the low temperature features in and . To this end, we have measured the heat capacity and magnetic susceptibility for FeGa3. The results of the heat capacity measurement is collected in Fig. 9(a). The zero field measurement does not show any jumps or kinks over the entire temperature range. Moreover the data for 9 T and low temperatures are also coinciding with the zero-field data. This implies that there are no structural phase transitions in FeGa3. The value of the electronic specific heat coefficient is obtained by plotting / versus (Fig. 9(b)) and fitting the data to = . We obtained a better fit when including the term, which is associated to both the higher order terms of the Fourier series of a harmonic oscillator and as well as to anharmonic terms.Pässler (2013) This results in = 0.03 mJ mol-1 K-2, close to zero as expected for a semiconductor and consistent with previously published values.Hadano et al. (2009); Umeo et al. (2012) The Sommerfeld constant in the electronic specific heat can be compared to the bare value determined from the bare reference density of states at the Fermi level, (), where is in states/(eV f.u.) and is in mJ mol-1 K-2. From Hall effect measurements, for a carrier concentration of 1.0 electrons cm-3 (100-300 K) and 4.0 electrons cm-3 (< 100 K), we use the from our band structure calculations and obtain = 0.06 mJ mol-1 K-2 and 0.01 mJ mol-1 K-2 respectively, consistent with the experimental observation.
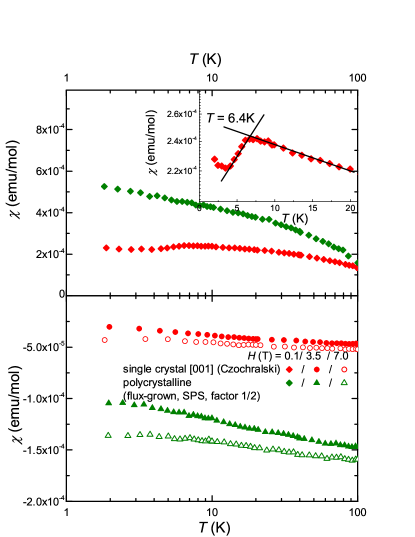
The temperature dependence of the magnetic susceptibility measured at various fields is displayed in Fig. 10. For fields of 3.5 T and 7 T, the measured for the [001] oriented single crystal (Czochralski method) is negative for the entire temperature range up to 300 K and diamagnetic. The slight upturn at low temperatures originates from the tiny amounts of Fe impurities in the system. This fact is clearly visible in the low field 0.1 T data where the susceptibility values at low temperatures are positive. For the [001] oriented single crystal (Czochralski method), in 0.1 T field, we observe a sharp downward turn around 6.4 K. We were able to correlate this feature to the onset of superconductivity from tiny amounts of Ga inclusions in thin film form ( = 7.6 K).Kieselmann (1985) The gallium inclusions were removed by grinding the sample and washing it with diluted hydrochloric acid (H2O:HCl = 1:1). The susceptibility measurements on the so obtained polycrystalline sample did not show any downturn at low temperatures. Consistent with the heat capacity measurements, we do not observe any other anomalous features in that could point towards the possibility of a magnetic phase transition.
III.5 Phonon-drag mechanism
Having excluded both structural and magnetic phase transition at low temperatures, and as well as the presence of strong electronic correlations in FeGa3, another possible explanation for the unusually strong signal below 20 K in the thermopower and the thermal conductivity is a phonon-drag mechanism. The peaks in the thermal conductivity and Seebeck coefficient for all the single-crystalline samples always occur at the same temperature, 20 K. Moreover, the trend in the peak intensity between and are similar: < < < and < < < . The peak in the low temperature thermal conductivity for the flux-grown single crystal is more than 25 times larger than for the polycrystalline sample. Similarly, the peak in the Seebeck coefficients for the flux-grown single crystal is also larger than the powder sample (prepared from the flux-grown sample) by a factor of 30. Such features have been observed in other semiconductors including single crystals of Ge,Geballe and Hull (1954) SiGeballe and Hull (1955) and CrSb2,Sales et al. (2012) nano-composite FeSb2,Pokharel et al. (2013) reduced TiO2,Thurber and Mante (1965); Tang et al. (2009) ultra-thin films of FeSi2 and MnSi1.7/FeSi2,Hou et al. (2011) which have subsequently been demonstrated to arise from phonon-drag effects. Phonon drag can be defined as the effect arising from a preferential scattering of the charge carriers by the phonons in the direction of the flow (, the drag on the charge carriers exerted by the phonons streaming from hot to cold end in thermal conduction) and mostly evidenced at low temperatures. With increasing temperatures, the magnitude of the phonon-drag influenced Seebeck coefficient decreases rapidly. This is due to the reduced relaxation time for the long wavelength phonons, which interact with the electrons/holes, as a result of the increase in the carrier concentration. Due to this electron-phonon coupling at reduced temperatures, the Seebeck coefficient can now be written as a sum of the conventional electron-diffusion part and another term arising from the phonon-electron interaction , the so-called phonon-drag contribution.
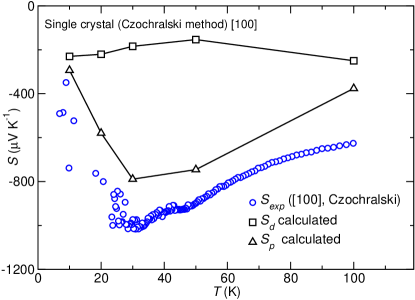
Though an accurate quantitative calculation for a phonon-drag contribution is difficult to obtain, one can realize an estimate by calculating the electron-diffusion part and subtracting it from the measured total Seebeck coefficient. For a semiconductor with a complex band structure and whose spin-orbit splitting is negligible (), the electron-diffusion part as suggested by Herring,Herring (1954) can be written as
where, the minus and plus signs are for the and -type carriers respectively, is the charge carrier density denoted in cm-3, and are the bare and inertial effective masses of the electron, respectively, || refers to the average energy of the transported electrons relative to the band edge, is the Boltzmann constant. Usually, || is of the order of , and in the diffusive limit (, lattice scattering by phonons of long wavelength), HerringHerring (1954) proposes an additional approximation of || = 5/2 + with = -1/2. Fig. 11 displays the values obtained from the above equation using = and from Hall resistivity measurements (Fig. 4). Subsequently, was calculated by subtracting from the total . We note that the contribution to the total is dominant over the electron-diffusive term in the low temperature regime and thus indicative of a significant phonon-drag effect in FeGa3.
Another method to eliminate the possibility of an electronic origin to the colossal low-temperature Seebeck coefficient is to measure in high magnetic fields.Sales et al. (2012) If the system is dominated by the phonon-drag mechanism, only a small response in the magnetic field is expected. To confirm this scenario, we measured the Seebeck coefficient for a [100] oriented FeGa3 single crystal (Czochralski method) at 9 T and the results are displayed in Fig. 12. The lack of difference between the 0 and 9 T data up to 40 K is apparent and upholds the non-electronic origin of the pronounced peak in Seebeck coefficient.
IV Summary
We have synthesized single crystalline and polycrystalline samples of the narrow band gap semiconductor FeGa3. A band gap of 0.5 eV is obtained from electrical resistivity measurements. Systematic investigation of the thermoelectric properties of the single- and polycrystalline samples reveal pronounced peaks around 20 K in the thermal conductivity (400-800 W K-1 m-1) and the Seebeck coefficient (in the order of -16000 V K-1). Such large values have previously not been reported for FeGa3. To identify the origin of the low temperature enhancement, we investigated various possibilities. DFT-based band structure calculations and subsequent modeling of the Seebeck coefficient using semiclassical Boltzmann transport theory yielded a Seebeck coefficient of the same order as the experiment above 300 K with LDA. Inclusion of strong electronic correlations arising from the narrow Fe- bands treated in a mean-field manner (LSDA+) does not improve this comparison, rendering strong correlations as an explanation for the low temperature enhancement in Seebeck unlikely. Heat capacity and magnetic susceptibility measurements under different applied magnetic fields do not show any kinks or jumps around 20 K and thus excludes a magnetic or structural phase transition as a reason for the low-temperature peak in Seebeck coefficient. Comparing the trend in Seebeck coefficient and thermal conductivity among the various samples, and based on estimates of the phonon-drag contribution to the Seebeck coefficient and the negligible response in a high magnetic field, we conclude that the low-temperature enhancements in FeGa3 are due to a phonon-drag effect.
During the submission of this draft, we became aware of another recent work on the binary FeGa3 and the hole doped variants Fe1-xMnxGa3 and FeGa3-yZny.Gamża et al. (2014) In contrast to our work which focusses on the anomalous thermoelectric properties of FeGa3 at very low temperatures (below 50 K), Gamża et. al. focus on the magnetic properties of both the binary and the hole doped variants up to very high temperatures ( 800 K).Gamża et al. (2014) Comparison of the lattice parameters, electrical resistivity and thermodynamic measurements of our flux-grown single crystals with that of Gamża et. al.Gamża et al. (2014) demonstrates the similarity between our samples. A fit to the Arrhenius law for the intrinsic region (> 350 K) of the resistivity gave a band gap of 0.5 eV in our work for the single crystals grown using the Czochralski method, while Gamża et. al. obtain a value of 0.4 eV for their flux-grown samples.Gamża et al. (2014) Signatures of a complex magnetic ordering is presented based on neutron diffraction measurements. In contrast, LDA+DMFT (dynamical mean field theory) calculations do not show any hint of long-range antiferromagnetic ordering.Gamża et al. (2014) However, in our work, applying LSDA+ as a simple mean-field treatement of electronic correlations, we could stabilize a simple AFM order. Nevertheless, this approximation did not improve the description of the thermopower.555The neutron diffraction pattern of Gamża et. al. (Ref. Gamża et al., 2014) shows a complex magnetic ordering in FeGa3. Using LSDA+, we have stabilized only a simple AFM order wherein nearest neighbor Fe sites are ordered antiferromagnetically. The discrepancy between the measured and calculated Seebeck coefficient could then arise for two possible reasons: the treatement of correlations in a mean-field manner is insufficient or the simple AFM order we consider is not a good approximation for the complex magnetic order observed in the experiments.
Acknowledgements.
The authors acknowledge X-ray powder diffraction measurements and WDXS analysis by the competence groups Structure and Metallography at the MPI CPfS. We also thank Ralf Koban for help with physical properties measurements. D.K., H.R. and Yu.G. acknowledge funding by the DFG within SPP 1386.References
- Sales et al. (1994) B. Sales, E. C. Jones, B. C. Chakoumakos, J. A. Fernandez-Baca, H. E. Harmon, J. W. Sharp, and E. H. Volckmann, Phys. Rev. B 50, 8207 (1994).
- Petrovic et al. (2003) C. Petrovic, J. W. Kim, S. L. Bud’ko, A. I. Goldman, P. Canfield, W. Choe, and G. J. Miller, Phys. Rev. B 67, 155205 (2003).
- Hadano et al. (2009) Y. Hadano, S. Narazu, M. A. Avila, T. Onimaru, and T. Takabatake, J. Phys. Soc. Jpn. 78, 013702 (2009).
- Bentien et al. (2007) A. Bentien, S. Johnsen, G. K. H. Madsen, B. B. Iversen, and F. Steglich, Euro. Phys. Lett. 80, 17008 (2007).
- Sun et al. (2009) P. Sun, N. Oeschler, S. Johnsen, B. B. Iversen, and F. Steglich, Dalton Trans. 39, 1012 (2009).
- Sun et al. (2011) P. Sun, M. Søndergaard, B. B. Iversen, and F. Steglich, Ann. Phys. (Berlin) 523, 612 (2011).
- Takahashi et al. (2011) H. Takahashi, R. Okazaki, Y. Yasui, and I. Terasaki, Phys. Rev. B 84, 205215 (2011).
- Pokharel et al. (2013) M. Pokharel, H. Zhao, K. Lukas, Z. Ren, C. Opeil, and B. Mihaila, Mat. Res. Soc. Comm. 3, 31 (2013).
- Tomczak et al. (2012) J. M. Tomczak, K. Haule, and G. Kotliar, PNAS 109, 3243 (2012).
- Wijngaard et al. (1992) J. H. Wijngaard, C. Haas, and R. A. de Groot, Phys. Rev. B 45, 5395 (1992).
- McGuire et al. (2008) M. A. McGuire, A. D. Christianson, A. S. Sefat, B. C. Sales, M. D. Lumsden, R. Jin, E. A. Payzant, M. D., Y. Luan, V. Keppens, V. Varadarajan, J. W. Brill, R. P. Hermann, M. T. Sougrati, F. Grandjean, and G. J. Long, Phys. Rev. B 78, 094517 (2008).
- Souma et al. (2002) T. Souma, G. Nakamoto, and M. Kurisu, J. Alloys Compd. 340, 275 (2002).
- Büchner et al. (1993) B. Büchner, M. Cramm, M. Braden, W. Braunisch, O. Hoffels, W. Schnelle, R. Müller, A. Freimuth, W. Schlabitz, G. Heger, D. Khomskii, and D. Wohlleben, Europhys. Lett. 21, 953 (1993).
- Sales et al. (2012) B. Sales, A. F. May, M. A. McGuire, M. B. Stone, D. J. Singh, and D. Mandrus, Phys. Rev. B 86, 235136 (2012).
- Schubert et al. (1959) K. Schubert, H. L. Lukas, H.-G. Meissner, and S. Bhan, Z. Metallkd. 50, 534 (1959).
- Schubert et al. (1958) K. Schubert, H. Breimer, R. Göhle, H. L. Lukas, H.-G. Meissner, and E. Stolz, Naturwissenschaften 45, 360 (1958).
- Dasarathy and Hume-Rothery (1965) C. Dasarathy and W. Hume-Rothery, Proc. Royal Soc. A 286, 141 (1965).
- Lu and Liang (1965) S. S. Lu and C.-K. Liang, Acta Phys. Sin. 21, 849 (1965).
- Häussermann et al. (2002) U. Häussermann, M. Boström, P. Viklund, Ö. Rapp, and T. Björnängen, J. Sol. Stat. Chem. 165, 94 (2002).
- Amagai et al. (2004) Y. Amagai, A. Yamamoto, T. Iida, and Y. Takanashi, J. Appl. Phys. 96, 5644 (2004).
- Tsujii et al. (2008) N. Tsujii, H. Yamaoka, M. Matsunami, R. Eguchi, Y. Ishida, Y. Senba, H. Ohashi, S. Shin, T. Furubayashi, H. Abe, and H. Kitazawa, J. Phys. Soc. Jpn. 77, 024705 (2008).
- Yin and Pickett (2010a) Z. P. Yin and W. E. Pickett, Phys. Rev. B 82, 155202 (2010a).
- Storchak et al. (2012) V. G. Storchak, J. H. Brewer, R. L. Lichti, R. Hu, and C. Petrovic, J. Phys.: Condens. Matter 24 (2012), 10.1088/0953-8984/24/18/185601.
- Arita et al. (2011) M. Arita, K. Shimada, Y. Utsumi, O. Morimoto, H. Sato, H. Namatame, M. Taniguchi, Y. Hadano, and T. Takabatake, Phys. Rev. B 83, 245116 (2011).
- Umeo et al. (2012) K. Umeo, Y. Hadano, S. Narazu, T. Onimaru, M. A. Avila, and T. Takabatake, Phys. Rev. B 86, 144421 (2012).
- Singh (2013) D. J. Singh, Phys. Rev. B 88, 064422 (2013).
- Gille and Bauer (2008) P. Gille and B. Bauer, Cryst. Res. Tech. 43, 1161 (2008).
- Koepernik and Eschrig (1999) K. Koepernik and H. Eschrig, Phys. Rev. B 59, 1743 (1999).
- Perdew and Wang (1992) J. P. Perdew and Y. Wang, Phys. Rev. B 45, 13244 (1992).
- Ziman (2001) J. M. Ziman, Electrons and Phonons (Oxford University Press, New York, 2001).
- Jones and March (1985) W. Jones and N. H. March, Theoretical Solid State Physics (Courier Dover, New York, 1985).
- Madsen et al. (2003) G. K. H. Madsen, K. Schwarz, P. Blaha, and D. J. Singh, Phys. Rev. B 68, 125212 (2003).
- Madsen and Singh (2006) G. K. H. Madsen and D. J. Singh, Comput. Phys. Commun. 175, 67 (2006).
- Johnsen et al. (2006) S. Johnsen, A. Bentien, G. K. H. Madsen, B. B. Iversen, and M. Nygren, Chem. Mater. 18, 4633 (2006).
- Singh and Kasinathan (2007) D. J. Singh and D. Kasinathan, J. Electron. Mater. 36, 736 (2007).
- Xiang and Singh (2007) H. J. Xiang and D. Singh, Phys. Rev. B 76, 195111 (2007).
- Kasinathan et al. (2012) D. Kasinathan, M. Wagner, K. Koepernik, R. Cardoso-Gil, Y. Grin, and H. Rosner, Phys. Rev. B 85, 035207 (2012).
- Note (1) See Supplemental Material at http://link.aps.org/Supplemental/… for the XRD pattern.
- Note (2) The unoriented bar-shaped piece, which was cut from the flux-grown crystal could not be measured at high temperatures, owing to its short length For the unoriented crystal, a band gap of 0.38\tmspace+.1667emeV can be estimated (calculated for the intrinsic region between 280-360\tmspace+.1667emK).
- Fritzche (1955) H. Fritzche, Phys. Rev. B 99, 406 (1955).
- Wagner et al. (2011) M. Wagner, R. Cardoso-Gil, N. Oeschler, H. Rosner, and Y. Grin, J. Mater. Res. 26, 1886 (2011).
- Wagner-Reetz et al. (2014) M. Wagner-Reetz, R. Cardoso-Gil, W. Schnelle, and Y. Grin, (2014).
- Note (3) According to our DFT calculations, Fe carries a small negative charge.
- Haldolaarachchige et al. (2011) N. Haldolaarachchige, A. B. Karki, W. A. Phelan, Y. M. Xiong, R. Jin, J. Y. Chan, S. Stadler, and D. P. Young, J. Appl. Phys. 109, 103712 (2011).
- Aeppli and Fisk (1992) G. Aeppli and Z. Fisk, Comments Condens. Matter Phys. 16, 155 (1992).
- Bittar et al. (2010) E. M. Bittar, C. Capan, G. Seyfarth, P. G. Pagliuso, and Z. Fisk, J. Phys.: Conf. Series 200, 012014 (2010).
- Yeo et al. (2003) S. Yeo, N. Nakatsuji, A. D. Bianchi, P. Schlottmann, Z. Fisk, L. Balicas, P. A. Stampe, and R. J. Kennedy, Phys. Rev. Lett. 91, 046401 (2003).
- Hu et al. (2009) R. Hu, V. F. Mitrović, and C. Petrovic, Phys. Rev. B 79, 064510 (2009).
- Hu et al. (2006) R. Hu, V. F. Mitrović, and C. Petrovic, Phys. Rev. B 74, 195130 (2006).
- Yin and Pickett (2010b) Z. Yin and W. E. Pickett, Phys. Rev. B 82, 155202 (2010b).
- Osorio-Guillén et al. (2012) J. M. Osorio-Guillén, Y. D. Larrauri-Pizarro, and G. M. Dalpian, Phys. Rev. B 86, 235202 (2012).
- Mahan and Sofo (1996) G. D. Mahan and J. O. Sofo, Proc. Natl. Acad. Sci. USA 93, 7436 (1996).
- Freericks et al. (2003) J. K. Freericks, D. O. Demchenko, A. V. Joura, and V. Zlatić, Phys. Rev. B 68, 195120 (2003).
- Note (4) We make a note about plotting the experimental and calculated Seebeck coefficients in separate plots: In DFT, it is instructive to calculate the Seebeck coefficient for a fixed carrier concentration, while in reality the carrier concentration may vary as a function of temperature during experimental measurements (see Fig.\tmspace+.1667em4). Hence, a combined plot of the experimental and calculated Seebeck coefficients would be misleading. For cases where the carrier concentration is temperature dependent, comparison between experiment and calculation is more qualitative than quantitative.
- Grenzeback et al. (2006) C. Grenzeback, F. B. Anders, G. Czycholl, and T. Pruschke, Phys. Rev. B 74, 195119 (2006).
- Freericks and Zlatić (2001) J. K. Freericks and V. Zlatić, Phys. Rev. B 64, 245118 (2001).
- Pässler (2013) R. Pässler, AIP Advances 3, 082108 (2013).
- Kieselmann (1985) G. Kieselmann, Ga elements, Ga films, Ga/X junctions. In R. Flükiger and W. Klose (eds.) Ac - Na, vol. 21a of Landolt-Börnstein - Group III Condensed Matter, 249 - 258 (Springer, Berlin-Heidelberg-New York, 1985).
- Geballe and Hull (1954) T. H. Geballe and G. W. Hull, Phys. Rev. 94, 1134 (1954).
- Geballe and Hull (1955) T. H. Geballe and G. W. Hull, Phys. Rev. 98, 940 (1955).
- Thurber and Mante (1965) W. R. Thurber and J. H. Mante, Phys. Rev. 139, A1655 (1965).
- Tang et al. (2009) J. Tang, W. Wang, G.-L. Zhao, and Q. Li, J. Phys.: Condens. Matter 21, 205703 (2009).
- Hou et al. (2011) Q. R. Hou, B. F. Gu, Y. B. Chen, and Y. J. He, Modern Phys. Lett. B 25, 1829 (2011).
- Herring (1954) C. Herring, Phys. Rev. 96, 1163 (1954).
- Gamża et al. (2014) M. Gamża, J. M. Tomczak, C. Brown, G. Puri, A. Kotliar, and M. C. Aronson, Phys. Rev. B 89, 195102 (2014).
- Note (5) The neutron diffraction pattern of Gamża et. al. (Ref.\tmspace+.1667em\rev@citealpnumGamza_2014) shows a complex magnetic ordering in FeGa3. Using LSDA+, we have stabilized only a simple AFM order wherein nearest neighbor Fe sites are ordered antiferromagnetically. The discrepancy between the measured and calculated Seebeck coefficient could then arise for two possible reasons: the treatement of correlations in a mean-field manner is insufficient or the simple AFM order we consider is not a good approximation for the complex magnetic order observed in the experiments.