GREEND: An Energy Consumption Dataset of Households in Italy and Austria
Abstract
Home energy management systems can be used to monitor and optimize consumption and local production from renewable energy.
To assess solutions before their deployment, researchers and designers of those systems demand for energy consumption datasets.
In this paper, we present the GREEND dataset, containing detailed power usage information obtained through a measurement campaign in households in Austria and Italy.
We provide a description of consumption scenarios and discuss design choices for the sensing infrastructure.
Finally, we benchmark the dataset with state-of-the-art techniques in load disaggregation, occupancy detection and appliance usage mining.
Keywords: Energy demand modeling, demand forecasting, home energy management, smart home, energy consumption dataset, smart appliance
1 Introduction
Stability issues arise from the progressive installation of renewable energy generation and the diffusion of electric vehicles. Demand response exploits a price signal to reflect fluctuations in the availability of energy in the grid. This incentives the coordination of electrical devices in order to optimize running costs, fostering awareness to increase conservation and efficiency [1, 2] or to automatically schedule the operation of selected devices to off-peak periods [3]. Nevertheless, control strategies might somehow disrupt user’s daily life routines. Collecting information of reoccurring activities can increase the effectiveness of control strategies, as they can consider necessities of inhabitants to minimize the discomfort produced. Problems such as load detection and occupancy modeling for HVAC optimization can be solved using well-established data mining and machine learning techniques, which demand suitable datasets.
In order to enable research on energy and sustainability problems, it is necessary to build upon publicly available data in order to elaborate solutions that work in the real world. In this paper we discuss available energy consumption datasets and present a new publicly available dataset that we name GREEND111GREEND: GREEND Electrical ENergy Dataset., containing power usage information at device level being obtained through a measurement campaign in households in Austria and Italy. We describe the hardware and software setup of the measurement campaign and elaborate the modeling of loads for energy management applications. The paper focuses on the dataset and it is meant to provide metadata describing the involved consumption scenarios. Along with the dataset we are also releasing our code base for the measurement campaign as a Sourceforge project. Moreover, we benchmark the dataset by presenting experiences with load disaggregation, occupancy detection and appliance usage mining using state-of-the-art techniques.
The remainder of the paper is as follows. To identify the main requirements of an energy consumption dataset, we survey existing datasets in Section 2. In Section 3, we report the design of the measurement campaign. We describe our measurement infrastructure and provide a characterization of the deployed scenarios, in terms of both residents and monitored electrical devices. In Section 4.1, we apply a state-of-the art load disaggregation technique based on particle filtering to show a possible application of the dataset. Similarly, in section 4.2 and 4.3 we apply the dataset respectively to observe occupancy patterns and mine appliance usage patterns. Section 5 concludes the paper and anticipates future directions.
2 Other consumption datasets
To overcome the previously introduced challenges, researchers and designers of Home Energy Management System (HEMS) require consumption datasets where solutions can be assessed beforehand. A widely used dataset in the load disaggregation community is the reference dataset (REDD), publically released by MIT in 2011 [4]. Moved by a similar aim, various other datasets have been shared. As shown in Table 1, the main classification attributes are sampling frequency and characteristics of the signal being measured, active power (P), reactive power (Q), apparent power (S), energy (E), frequency (f), phase angle (), voltage (V) and current (I). Certain datasets, such as REDD and BLUED [5] monitor a small number of households at a high sampling frequency. This depends on the requirements of load disaggregation, where a higher frequency allows for extraction of more representative features capturing the transient behavior [1]. As noticeable in the table, most of datasets were collected in the USA, under a voltage while European countries commonly work under . Moreover, certain peculiarities such as the weather and climate depend on the location of the measurement campaign. To the best of our knowledge, GREEND is the first 1Hz consumption dataset for Austria and Italy. The type and number of devices, as well as the number of monitored households significantly constraints the final application of the dataset. A statistical analysis of consumption behavior of residents would require a high number of households, such as in HES and OCTES. Besides, seasonal consumption behaviors cannot be captured by a short-term measurement campaign, for instance lasting days or months. Also, some datasets monitor different households over different time windows, which makes a comparison of the dwellings impossible. Moreover, the context under which appliances are used over the day is an essential factor determining the complexity of the demand. Therefore, collection should take place in real environments and not in a lab or on a device testbench. For example TraceBase [6] and ACS-F1 [7] provide consumption tracks from appliances collected in households and offices. While they constitutes a great source of device signatures, they currently do not provide information of consumption scenarios, which results in the impossibility to analyze device interdependence. GREEND is meant to overcome these limitations as it will be explained in the following section.
[b] Dataset Location Duration #Houses #Sensors (per house) Features Resolution ACS-F1 [7] Switzerland 1 hour session (2 sessions) N/A 100 devices in total (10 types) I, V, Q, f, 10 secs AMPds [8] Greater Vancouver 1 year 1 19 I, V, pf, F, P, Q, S 1 min BLUED [5] Pittsburg, PA 8 days 1 Aggregated I, V, switch events 12 Khz GREEND Austria, Italy 1 year (3-6 months completed) 9 9 P 1 Hz HES UK 1 month (255 houses) - 1 year (26 houses) 251 13-51 P 2 min iAWE [9] India 73 days 1 33 sensors (10 appliance level) V, I, f, P, S, E, 1 Hz IHEPCDS1 France 4 years 1 3 circuits I, V, P, Q 1 min OCTES2 Finland, Iceland, Scotland 4-13 months 33 Aggregated P, Energy price 7 secs REDD [4] Boston, MA 3 - 19 days 6 9-24 Aggregate: V, P; Sub-metered: P 15 Khz (aggr.), 3 sec (sub) Sample dataset3 Austin, TX 7 days 10 12 S 1 min Smart* [10] Western Massachussets 3 months 1 Sub-metered +2 (Aggregated + Sub-metered) 25 circuits, 29 appliance monitors P, S (circuits), P (sub-metered) 1 Hz Tracebase [6] Germany N/A 15 158 devices in total (43 types) P 1-10 sec UK-DALE [11] UK 499 days 4 5 (house 3) - 53 (house 1) Aggregated P, Sub P, switch-status 16 Khz (aggr.), 6 sec (sub.)
-
1
http://tinyurl.com/IHEPCDS
-
2
http://octes.oamk.fi/final/
-
3
http://www.pecanstreet.org/projects/consortium/
3 Dataset for Italy and Austria
3.1 The consumption dataset
The measurement campaign is carried out within the MONERGY222http://www.monergy-project.eu project, in which we aim at proposing solutions to reduce energy consumption in the Austrian (AT) region of Carinthia and the Italian (IT) region of Friuli-Venezia Giulia. In particular, we identified the following requirements:
-
•
Features: For the selection of the features of interest we considered the requirements of load disaggregation applications, as they are generally stricter than user and appliance modeling [12]. Accordingly, we decided to collect active power measurements at 1Hz, as this allows the identification of more than 8 devices through load disaggregation algorithms [1]. Each entry is associated to a UTC Unix timestamp so that measurements can be matched to contextual data such as weather.
-
•
Device selection: The selection of devices followed the energy hogs identified in [2]. We favored diversity in the dataset to promote multiple applications. However, we faced issues in accessing certain devices in Austria. For instance, electric boilers are commonly connected to a separated meter to be charged with a reduced energy tariff.
- •
-
•
Campaign duration: The campaign was designed to last one year, in order to observe and be able to model seasonal consumption behavior of inhabitants. The first household is being monitored (#0) since the end of December 2013. Most of other households followed in January 2014, while the last two platforms (house #7 and #8) were deployed in April.
3.2 Deployment
At the time of writing, we are collecting consumption data in the following scenarios:
-
•
House #0 a detached house with 2 floors in Spittal an der Drau (AT). The residents are a retired couple, spending most of time at home.
-
•
House #1 a detached house with 2 floors in Villach (AT). The residents are 3 university students, having irregular working-like days.
-
•
House #2 an apartment with 1 floor in Klagenfurt (AT). The residents are a young couple, spending most of daylight time at work during weekdays, mostly being at home in evenings and weekend.
-
•
House #3 a detached house with 2 floors in Spittal an der Drau (AT). The residents are a mature couple (1 housewife and 1 employed) and an employed adult son (28 years).
-
•
House #4 a detached house with 2 floors in Klagenfurt (AT). The residents are a mature couple (1 working part-time and 1 full time), living with two young kids.
-
•
House #5 an apartment with 2 floors in Udine (IT). The residents are a young couple, spending most of daylight time at work during weekdays, although being at home in evenings and weekend.
-
•
House #6 a detached house with 2 floors in Colloredo di Prato (IT). The residents are a mature couple (1 housewife and 1 employed) and an employed adult son (30 years).
-
•
House #7 a terraced house with 3 floors in Udine, (IT). The residents are a mature couple (1 working part-time and 1 full time), living with two young children.
-
•
House #8 a detached house with 2 floors in Basiliano (IT). The residents are a retired couple, spending most of time at home.
The device configurations for the selected households are shown in Table 2.
| House | Devices |
|---|---|
| 0 | Coffee machine, washing machine, radio, water kettle, fridge w/ freezer, dishwasher, kitchen lamp, TV, vacuum cleaner |
| 1 | Radio, freezer, dishwasher, fridge, washing machine, water kettle, blender, network router |
| 2 | Fridge, dishwasher, microwave, water kettle, washing machine, radio w/ amplifier, dryier, kitchenware (mixer and fruit juicer), bedside light |
| 3 | TV, NAS, washing machine, drier, dishwasher, notebook, kitchenware, coffee machine, bread machine |
| 4 | Entrance outlet, Dishwasher, water kettle, fridge w/o freezer, washing machine, hairdrier, computer, coffee machine, TV |
| 5 | Total outlets, total lights, kitchen TV, living room TV, fridge w/ freezer, electric oven, computer w/ scanner and printer, washing machine, hood |
| 6 | Plasma TV, lamp, toaster, hob, iron, computer w/ scanner and printer, LCD TV, washing machine, fridge w/ freezer |
| 7 | Hair dryer, washing machine, videogame console and radio, dryer, TV w/ decoder and computer in living room, kitchen TV, dishwasher, total outlets, total lights |
| 8 | Kitchen TV, dishwasher, living room TV, desktop computer w/ screen, washing machine, bedroom TV, total outlets, total lights |
3.3 Measurement setting
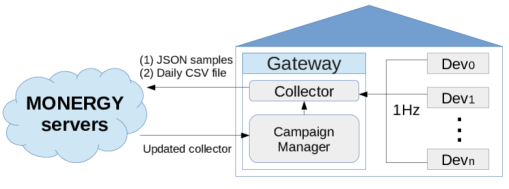
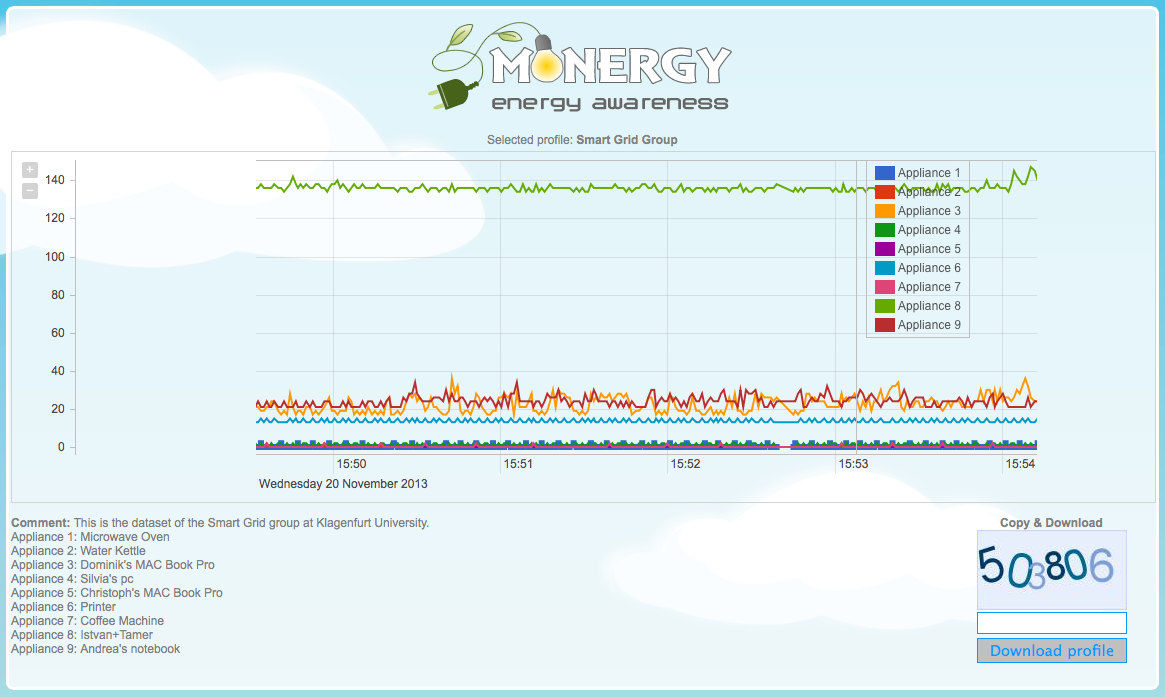
Our deployment consists of an ARM-based platform (e.g., Raspberry Pi or BeagleBone) connected to an Anker Astro E5 15000mAh external battery333http://www.ianker.com/support-c1-g228.html, as well as a Plugwise Basic kit444http://www.plugwise.com. The Plugwise kit consists of a Zigbee network of 9 sensing outlets, each collecting active power measurements from the connected load. The collection takes place in epochs. At each epoch, the system collects power measurements from each node and sleeps for the remaining time. To provide periodicity, in presence of failures such as mispelled packets, nodes are skipped and retried at the end of the epoch if there is time. In addition, a backoff time is used to manage faults, such as the ones resulting from temporary erroneous states or disconnection of nodes from the network. The developed daemon uses the open source python-plugwise library and it is freely available both as a sourcecode and as a ready-to-use SD image555http://sourceforge.net/projects/monergy. The daemon is based on a collector script and a manager script. The manager is started at boot up by crontab. Its task is to make sure that a collection script is running and that the running version is the latest available. To this end, the manager periodically checks (default is 5 hours) the presence of new versions on the Monergy servers, and if needed, it replaces the current version with the newest available. In this way we can push updates to all households without needing to access each and every unit (see Fig.1). As for the data storage, the current version of the daemon implements 4 different modalities: i) local storage as a daily comma separated value (CSV) file, ii) remote storage on a mysql server with visualization and quick download (See Fig. 2), iii) a combination of i and ii for double backup, iv) daily csv file uploaded via sftp to the Monergy server (selected method).
4 Case studies
The introduction of smart metering produces fine-grained energy consumption data allowing for the extraction of more valuable information of energy production and demand compared to having only an energy balance over an extended period of time. Energy management systems (EMS) can be used to better manage local consumption and production from renewable sources. Beside providing consumers with feedback regarding used appliances and their operational costs, this might also support appliance scheduling in order to minimize costs. In this section, we report 3 case studies dealing with consumption information: i) load disaggregation, ii) occupancy detection, and iii) appliance usage modeling.
4.1 Non-Intrusive appliance load monitoring
Non-intrusive load monitoring (NILM), also known as load disaggregation, is the problem to detect and to classify appliances from the total household power draw, based on specific characteristics of electrical devices. Specifically, NILM tries to solve the disaggregation of aggregated appliance power loads under the influence of noise in measurements and models. NILM was initially presented by Hart [13], although various approaches were later presented. It is generally possible to distinguish between supervised and unsupervised techniques, depending on the necessity of labeled data to train the classifier. Nevertheless, there exists no NILM algorithm able to solve the problem in all its aspects.
Our evaluation is based on the load disaggregator presented in [14], which uses particle filtering (PF) to estimate the appliance state of all used appliances. In detail, appliances are model as a hidden Markov model (HMM), whose states define device states and are associated to the respective power demand. Furthermore, the appliance models are combined into a fractional hidden Markov model (FHMM) modeling the total household power demand. The PF is used to estimate the household power demand according to the given appliance models. Thereafter, a simple decision marker determines the appliance condition and operational state, based on thresholding and the given appliance models. For the evaluation we used the data of house with ID #0 and #2 for consecutive days. As the PF is mainly dependent the number of used particles, we empirically identified as the appropriate number. The aggregated power draw is composed by 6 different appliances which are listed in Table 3. Beside the used appliances also the reached accuracy of the proposed load disaggregator is presented. In this context, the accuracy (ACC) is defined as:
| (1) |
where (true positives) is the number of times an appliance is correctly detected as ON, (true negatives) is the number of times an appliance is correctly detected as OFF, while is the number of samples in the observation window. The results in Table 3 show that the presented dataset can be applied as a reference dataset to load disaggregation problems. The complexity of the problem can be adjusted according to the used appliances and corresponding appliance model (on/off device such as the water kettle or multi-state devices such as the dishwasher) and the number of aggregated power loads.
| House ID 0 | House ID 2 | ||
|---|---|---|---|
| Type | ACC | Type | ACC |
| TV | 0.91 | hair dryer | 0.99 |
| coffee machine | 0.99 | light | 0.97 |
| dishwasher | 0.96 | dishwasher | 0.46 |
| fridge | 0.93 | fridge | 0.90 |
| vacuum cleaner | 0.99 | water kettle | 0.99 |
| water kettle | 0.99 | washing machine | 0.80 |
4.2 Occupancy detection
Occupancy detection is the problem of inferring presence of people in environments. Many different approaches have been considered in the literature: motion detection, doors opening, use of acoustic sensors and/or cameras, use of GPS and localization systems through smart phones. Nevertheless, only a few works propose to use energy consumption data to develop occupancy detection techniques [15, 16]. To this end, the assessment of occupancy detection requires suitable datasets, offering either an aggregated or a disaggregated power draw, along with a description of consumption scenarios. In particular, the presence of user-driven devices is relevant to assume presence in the environment. It is important to specify whether residents can postpone the operation of user-driven devices, as this will condition consumption-based approaches. A simple approach based on the use of energy consumption data to detect occupancy was presented in [15]. Therein, the authors developed an algorithm called non-intrusive occupancy monitoring (NIOM). In particular, NIOM guesses the presence of people at home by comparing the average, the variance and the maximum value of the current power consumption with threshold values. The threshold values are computed during inactivity periods, namely when the activity of residents does not add power consumption to the baseline consumption, e.g., the consumption of devices such as fridge, HVAC systems etc. Accordingly, the thresholds are computed every night when people are supposed to sleep. As both power values and threshold values are computed over time slots of fixed duration, the duration of the slot is an important parameter affecting the estimation. Although occupancy detection through energy consumption observation is a cheap and non-intrusive solution, it is shown being rather inaccurate in determining the occupancy during periods of inactivity.
In order to give an example on the use of the GREEND dataset to study occupancy, we consider the house #5. We chose this scenario because we have measured the total power consumption, which allows for better estimating the baseline during inactivity periods. We consider two months of measurements (February and March 2014) and we apply the NIOM algorithm as described in [15]. The time slot duration is chosen equal to 15 minutes. We consider two cases, the weekdays (WDs) and the weekend days (WEs). This is because the analyzed power consumption greatly differs in these two circumstances as it can be seen in Fig. 3c and Fig. 4b, where the 99th percentile of the energy consumption during WDs and WEs are shown. The baseline, within which the baseline threshold values are computed, was chosen at night between midnight and 6.30 AM. Fig. 3a reports the occupancy obtained applying the NIOM algorithm over three consecutive days. Fig. 3b and Fig. 4a respectively show the probability of occupancy obtained for WDs and WEs. We first notice that, as expected, the results obtained between midnight and 6.30 AM do not indicate any activity.We notice a good agreement between the derived probability of occupancy and the habits of residents. Residents stated that during WDs, they usually wake up at 6.45 AM, leave around 8.00 AM to go to work and are back home around 6.00 PM. During WEs residents tend to spend more time at home during the day and they go out at night coming back home around midnight.
4.3 Appliance usage modeling
Mining appliance usage patterns concerns the extraction of models describing how appliances are used by residents, given a sequence describing changes on their operational state. Given log data describing status changes of electrical devices, the extraction of models describing the usage of devices can be achieved using different approaches, such as association rule mining [17], artificial neural networks (ANNs) [18], episode-generating Hidden Markov models (EGH) [19] and Bayesian networks [20]. To show a possible application of the dataset, we propose to use a Bayesian network (BN) to predict the usage of user-driven devices. A BN is a probabilistic graphical model encoding the joint probability distribution of a set of random variables. A BN is a directed acyclic graph (DAG) whose nodes are random variables, while dependency between variable is represented by edges such as , and quantified by the conditional probability . In particular, each node is associated to a conditional probability distribution (CPD) quantifying the effect the parents have on the node, that is [21].
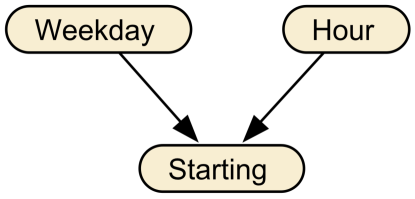
The approach undertaken follows the work presented in [22, 23] from which we derived the network structure. Because of the limited length of the dataset at time of writing we decided to omit seasonal information expressed through the month (see Fig. 5). As a first step, we processed the daily CSV files collected in the household ID#0 and extracted starting events for each monitored device. The BN was implemented using the Netica666https://www.norsys.com tool. In particular, we used expectation maximization (EM) to perform parameter learning for the given network and we used the junction tree (JT) algorithm to perform exact inference. Netica provides APIs for various programming languages, making the learned model applicable in working solutions. The plot in Fig.6 reports the posterior probability of starting the coffee machine of household ID#0, given the observations day of the week (i.e. weekday, Saturday and Sunday) and hour of the day. As noticeable, the patterns of coffee making tend to be regular over the day. The modeled couple tends to wake up earlier during weekdays, which was confirmed by an interview with the householders.
5 Conclusions and future work
We have presented the GREEND consumption dataset, obtained through a measurement campaign in households in Austria and Italy. The dataset is available for open use and consists of consumption data of selected devices. Along with the dataset we have also released our code base for the campaign as a Sourceforge project. This includes the scripts to collect consumption data and a ready-to-use SD image for the Raspberry Pi, as well as processing scripts that can be used to extract edges and consumption events, based on configurable device-specific thresholds. We expect our contribution to be of value for researchers and engineers dealing with domestic energy management systems. To this end, we showed the use of GREEND to develop and assess techniques for load disaggregation, occupancy detection and appliance usage mining. We expect to extend the monitoring campaign to collect aggregated consumption data, as this allows for modeling the whole demand, which is a valuable information when emulating microgrids and assessing control strategies at a wider scope. Similarly, we plan to include data concerning production from renewable energy, as it can be of value to forecast energy generation. The presence of temporal information, along with the locality and therefore the weather, will allow for the extraction of seasonal consumption patterns. The long term measurement campaign carried out within MONERGY will provide the time span to allow this type of studies. We expect to ultimately provide ready-to-use models of the regions, that can be imported in current simulation tools for smart grid applications.
References
- [1] K. C. Armel, A. Gupta, G. Shrimali, and A. Albert, “Is disaggregation the holy grail of energy efficiency? The case of electricity,” Energy Policy, vol. 52, no. 0, pp. 213 – 234, 2013.
- [2] A. Monacchi, W. Elmenreich, S. D’Alessandro, and A. M. Tonello, “Strategies for Domestic Energy Conservation in Carinthia and Friuli-Venezia Giulia,” in Proc. of the 39th Annual Conference of the IEEE Industrial Electronics Society, Vienna, Austria, 2013.
- [3] P. Palensky and D. Dietrich, “Demand side management: Demand response, intelligent energy systems, and smart loads,” IEEE Trans. on Ind. Informat., vol. 7, no. 3, pp. 381–388, Aug 2011.
- [4] J. Z. Kolter and M. J. Johnson, “REDD: A Public Data Set for Energy Disaggregation Research,” in Proceddings of the SustKDD Workshop on Data Mining Applications in Sustainability, 2011.
- [5] K. Anderson, A. Ocneanu, D. Benitez, D. Carlson, A. Rowe, and M. Berges, “BLUED: a fully labeled public dataset for Event-Based Non-Intrusive load monitoring research,” in Proc. of the 2nd KDD Workshop on Data Mining Applications in Sustainability (SustKDD), 2012.
- [6] A. Reinhardt, P. Baumann, D. Burgstahler, M. Hollick, H. Chonov, M. Werner, and R. Steinmetz, “On the Accuracy of Appliance Identification Based on Distributed Load Metering Data,” in Proc. of the 2nd IFIP Conference on Sustainable Internet and ICT for Sustainability (SustainIT), 2012.
- [7] C. Gisler, A. Ridi, D. Zujferey, O. Khaled, and J. Hennebert, “Appliance consumption signature database and recognition test protocols,” in 8th International Workshop on Systems, Signal Processing and their Applications (WoSSPA), May 2013.
- [8] S. Makonin, F. Popowich, L. Bartram, B. Gill, and I. V. Bajic, “AMPds: A Public Dataset for Load Disaggregation and Eco-Feedback Research,” in Proceeding of the IEEE Conference on Electrical Power and Energy (EPEC), 2013.
- [9] N. Batra, M. Gulati, A. Singh, and M. B. Srivastava, “It’s Different: Insights into Home Energy Consumption in India,” in Proc. of the 5th ACM Workshop on Embedded Systems For Energy-Efficient Buildings, ser. BuildSys’13. New York, NY, USA: ACM, 2013.
- [10] S. Barker, A. Mishra, D. Irwin, E. Cecchet, P. Shenoy, and J. Albrecht, “Smart*: An open data set and tools for enabling research in sustainable homes,” SustKDD, August, 2012.
- [11] J. Kelly and W. Knottenbelt, “”UK-DALE”: A dataset recording UK Domestic Appliance-Level Electricity demand and whole-house demand,” ArXiv e-prints, Apr. 2014.
- [12] M. Zeifman, “Disaggregation of home energy display data using probabilistic approach,” IEEE Trans. Consum. Electron., vol. 58, no. 1, pp. 23–31, 2012.
- [13] G. Hart, “Nonintrusive appliance load monitoring,” Proc. of the IEEE, vol. 80, no. 12, pp. 1870–1891, 1992.
- [14] D. Egarter, V. P. Bhuvana, and W. Elmenreich, “Appliance State Estimation Based on Particle Filtering,” in Proc. of the 5th ACM Workshop on Embedded Systems For Energy-Efficient Buildings, ser. BuildSys’13, 2013.
- [15] D. Chen, S. Barker, A. Subbaswamy, D. Irwin, and P. Shenoy, “Non-intrusive occupancy monitoring using smart meters,” in Proc. of the 5th ACM Workshop on Embedded Systems For Energy-Efficient Buildings, ser. BuildSys’13, 2013.
- [16] W. Kleiminger, C. Beckel, T. Staake, and S. Santini, “Occupancy detection from electricity consumption data,” in Proc. of the 5th ACM Workshop on Embedded Systems For Energy-Efficient Buildings, ser. BuildSys’13, 2013.
- [17] K. J. Kang, B. Ka, and S. J. Kim, “A service scenario generation scheme based on association rule mining for elderly surveillance system in a smart home environment,” Engineering Applications of Artificial Intelligence, vol. 25, no. 7, pp. 1355 – 1364, 2012, advanced issues in Artificial Intelligence and Pattern Recognition for Intelligent Surveillance System in Smart Home Environment.
- [18] M. Aydinalp, V. I. Ugursal, and A. S. Fung, “Modeling of the appliance, lighting, and space-cooling energy consumptions in the residential sector using neural networks,” Applied Energy, vol. 71, no. 2, pp. 87 – 110, 2002.
- [19] N. C. Truong, L. Tran-Thanh, E. Costanza, and D. S. Ramchurn, “Activity prediction for agent-based home energy management,” in Agent Technologies for Energy Systems (ATES 2013), May 2013.
- [20] P. Aguilera, A. Fernández, R. Fernández, R. Rumí, and A. Salmerón, “Bayesian networks in environmental modelling,” Environmental Modelling & Software, vol. 26, no. 12, pp. 1376 – 1388, 2011.
- [21] D. Koller and N. Friedman, Probabilistic Graphical Models: Principles and Techniques - Adaptive Computation and Machine Learning. The MIT Press, 2009.
- [22] L. Hawarah, S. Ploix, and M. Jacomino, “User behavior prediction in energy consumption in housing using bayesian networks,” in Artificial Intelligence and Soft Computing, ser. Lecture Notes in Computer Science. Springer Berlin Heidelberg, 2010, vol. 6113, pp. 372–379.
- [23] C. Chang, P.-A. Verhaegen, J. R. Duflou, M. M. Drugan, and A. Nowe, “Finding Days-of-week Representation for Intelligent Machine Usage Profiling,” Journal of Industrial and Intelligent Information, vol. 1, no. 3, pp. 148–154, 2010.