Influence of the ESR saturation on the power sensitivity of cryogenic sapphire resonators
Abstract
Here, we study the paramagnetic ions behavior in presence of a strong microwave electromagnetic field sustained inside a cryogenic sapphire whispering gallery mode resonator. The high frequency measurement resolution that can be now achieved by comparing two CSOs permit for the first time to observe clearly the non-linearity of the resonator power sensitivity. These observations that in turn allow us to optimize the CSO operation, are well explained by the Electron Spin Resonance (ESR) saturation of the paramagnetic impurities contained in the sapphire crystal.
I Introduction
Sapphire single crystal is a key material for numbers of very demanding scientific and technological applications.
Even in its purest form, the sapphire single crystal always contains some paramagnetic impurities, which come from the raw material or are result of contamination during the growth process Barish et al. (2002); Benmessai et al. (2013).
Despite their low concentration these accidental dopants turn out to be very useful in some innovative systems intended for high resolution measurements.
The Cryogenic Sapphire Oscillator (CSO) incorporating a cryogenic sapphire whispering gallery mode resonator is currently the most stable frequency source. It achieves in an autonomous and reliable version
a relative frequency stability better than for integration times s, with at long term a frequency drift of day Grop et al. (2011); Giordano et al. (2012).
The thermal compensation induced by the accidental paramagnetic impurities that substitute to Al3+ is essential for the achievement of the highest frequency stability Mann et al. (1992); Luiten et al. (1996).
A high Q-factor microwave cryogenic resonator containing a small amount of Fe3+ can also be used as the amplifying medium to design a zero-field solid-state 12 GHz Maser Bourgeois et al. (2005); Benmessai et al. (2008) or as the non-linear element for microwave third harmonic generation Creedon et al. (2012, 2012)
Paramagnetic impurities in sapphire are also good candidates for the realization of quantum electrodynamics measurementsFarr et al. (2013).
In this paper we study the behavior of paramagnetic dopants diluted in a sapphire high-Q microwave resonator in which a strong electromagnetic field is sustained. The Van-Vleck model is applied to calculate the dc-magnetic susceptibility induced at low power by the different paramagnetic species that can be found in the high quality sapphire crystal. The interaction between the paramagnetic dopants and the RF electromagnetic field is described through the classical two-levels Bloch equations. We show how the saturation of the Electron Spin Resonances (ESR) leads to a non-linear power sensitivity of the resonator frequency. Eventually the stabilisation of the injected power to the resonator turnover point allow us to optimise the oscillator frequency stability, which reaches a flicker floor of extending until 10,000 s.
II Paramagnetic ions description
II.1 Standard magnetic susceptibility model
The presence of paramagnetic dopants in the crystal matrice and its impact on the propagation of an electromagnetic wave at the frequency is accounted for through the magnetic susceptibility . and represent respectively the phase shift and the power absorption induced by the Electron Spin Resonance (ESR) Siegman (1964). Let us assume that the sapphire crystal contains a density of a paramagnetic ion presenting in its ground state two energy levels and separated by the ion ESR frequency . Solving the Bloch equations for such a two levels system interacting with the wave at the frequency leads for the real part of the susceptibility to a dispersive lonrentzian function that nulls at Vanier and Audoin (1989):
| (1) |
where and are the ion spin-lattice and spin-spin relaxation times, respectively. is the Rabi frequency and is the dc-susceptibility. Similarly, we found an absorption lorentzian lineshape for , whose linewidth at low power is .
is proportional to the ESR transition probability and to the RF magnetic field :
| (2) |
where is the Landé factor, the Bohr Magneton and the reduced Planck constant. The term in the denominator of the equation 1 is the saturation parameter proportional to the electromagnetic power felt by the ions. This term is generally neglected in the analysis of the paramagnetic ion behavior in the CSO sapphire resonator. However, as we will see later, when the electromagnetic wave is confinded in a high-Q factor cryogenic sapphire resonator the saturation of the ESR can no longer be neglected.
The dc-susceptibility results from the distribution of the ions on their energy levels through the effect of the thermal agitation. The derivation of at a given absolute temperature is straightforward by assuming i) the energy separation between the ion ground state and excited state is large compared to , ii) the ion orbital momentum is totally quenched by the crystal field and thus the ion in the crystal lattice behaves like a free spin . With these assumptions, follows the Curie law Buschow and de Boer (2003):
| (3) |
where is the permeability of free space and the Boltzmann constant.
II.2 On the validity of the ESR description
The Curie law has been derived for a free system of spin , which consists in levels equally spaced. Departures from the Curie law are well known for Sm3+ and Eu3+ as for these two rare-earth ions the first excited multiplet populations can not be neglected. Even for less exotic ions, in a real crystal the ground state is splitted by the crystal field in multiple degenerated Kramer’s doublets separated by a Zero Field Splitting (ZFS)Majlis (2007). The table 1 gives the characteristics of the dominant paramagnetic species that can be found in high purity sapphire crystals.
| Ion | Ground state | Ref. | |||||
|---|---|---|---|---|---|---|---|
| transitions | (GHz) | (ms) | (ns) | ||||
| Cr3+ | 3/2 | 11.4 | 1.00 | 200 | 7 | Standley and Vaughan (1965); Siegman (1964) | |
| Mo3+ | 3/2 | 165.0 | 2.00 | 0.1 | 12 | Sharoyan et al. (1974); Kocharyan et al. (1979) | |
| Fe3+ | 5/2 | 12.0 | 2.00 | 10 | 20 | Benmessai et al. (2013); Bogle and Symmons (1959) | |
| 19.3 | 1.25 | ||||||
| 31.3 | 0.0024 |
Strictly speaking, for these ions the dc-susceptibility should be calculated by using the Van Vleck equation Vleck (1978):
| (4) |
providing we know a Taylor expansion as a function of the applied magnetic field of each populated energy levels,
i.e. . In a number of situations, the cumbersome calculation of the Van Vleck
coefficients is avoided and the dc-susceptibitily is assumed to follow the Curie law. However the current measurement resolution is such as it is
necessary to know the degree of validity of this assumption. In Boc̆a (2004), R. Boc̆a uses the spin-hamiltonian formalism to derive the Van Vleck coefficients,
and thus the dc-susceptibility expression for various systems presenting a ZFS. From his results we calculated for Cr3+, Fe3+
and Mo3+ in Al2O3 neglecting the rhombic zero-field splitting parameter.
The figure 1 shows the comparison between the Curie Law and the Van Vleck model.
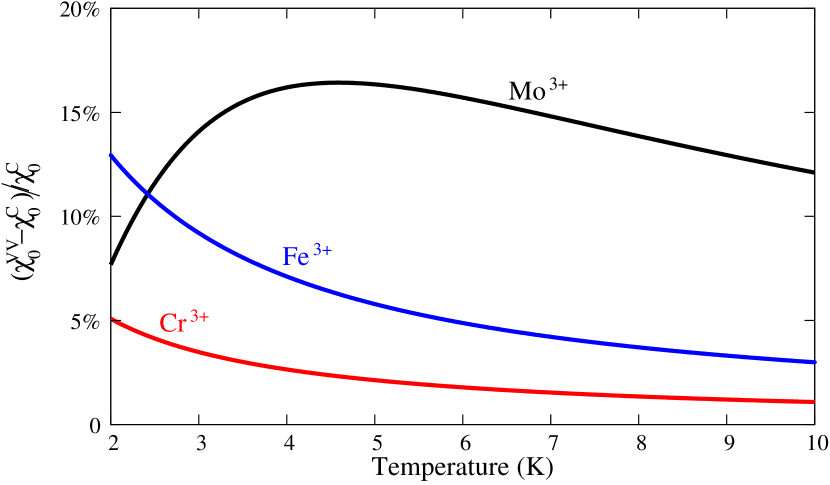
In the range of temperatures reachable with a modern two-stages cryocooler ( K), the difference in the two dc-susceptibility values is less than 20 percent.
A second issue in the standard model arises from the case of Fe3+ ion. The equation 1 is valid for a two levels system. Fe3+ has a spin and thus, its ground state is splitted in three Kramer’s doublets: and . In the absence of a static magnetic field, there are thus three ESR at the frequencies GHz, GHz and GHz. When dealing with a low power, the level populations stay almost those imposed by the thermal agitation. The susceptibility thermal behavior will be thus well represented by the Van Vleck model. At a high power, the differential saturation of these three transitions makes complexe the derivation of the equations. The transition at GHz is only allowed owing the state-mixing induced by the crystal field. For a frequency near 10 GHz, it is thus justified to neglect this transition when calculating the evolution of overall magnetic susceptibility. About one third of the Fe3+ ion population is on the level and is not affected by the RF magnetic field. We can reasonably conclude that the two levels model will lead to an overestimation of the impact of the ESR saturation on the magnetic susceptibility. We did not go further in the description of the Fe3+ ion behavior as the current uncertainties in the impurities concentration and in the ions relaxation times and make illusive a better quantitative analysis.
III Whispering Gallery Mode Resonator: low power operation.
Due to its high-Q factor at low temperature the sapphire whispering gallery mode resonator constitutes a powerful tool to observe the behavior of the paramagnetic ions diluted in the crystal. The typical resonator geometry is shown in the figure 2.
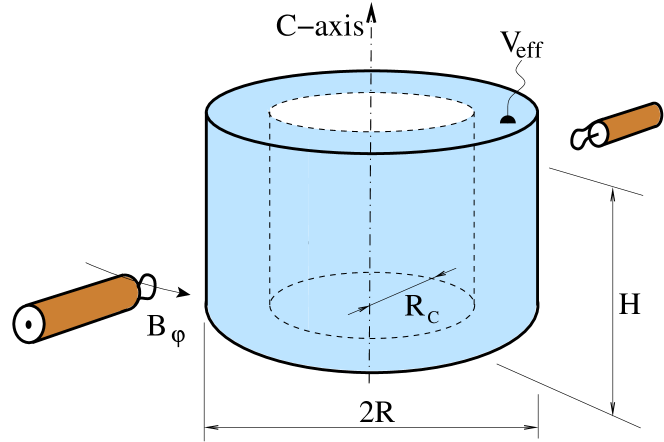
For an operation in X-band, the sapphire cylinder has a diameter mm and a thickness mm. Its axis is parallel to the crystal C-axis within degree. The resonator is placed in the center of a cylindrical gold plated copper cavity and can be easily cooled down to about 3K inside a two-stages cryocooler developping a power of 0.5 W at 4K. Two diametrically opposed small magnetic loops excite the electromagnetic resonance modes of the structure. Among them, the high order hybrid modes called whispering gallery modes are characterized by a high degree of confinement of the electromagnetic fields inside the dielectric medium. In that case the resonator quality factor is only limited by the sapphire dielectric losses which are very low at acryogenic temperature Branginsky et al. (1987). For a 10 GHz resonance mode the typical unloaded Q-factor is one billion at K. For a whispering gallery mode, the energy density is confined between the cylindrical dielectric–air boundary and the inner caustic surface (see Fig. 2). Elsewhere the waves are evanescent. The resonator can thus be seen like a bent waveguide forming a ring Bourgeois and Giordano (2005). The volume of this ring is . In the configuration shown in the figure 2, the magnetic field generated by the loops is perpendicular to the cylindrical axis allowing to excite the quasi-transverse magnetic whispering gallery modes such as mode. The three integers and represent the electromagnetic field components variations along the azimuthal , radial and axial directions respectively Cros and Guillon (1990). We consider only the resonant modes with low radial and axial variations, i.e. those corresponding to as they present the more efficient confinement inside the dielectric medium.
At low power, the temperature dependance of a given mode frequency is Mann et al. (1992):
| (5) |
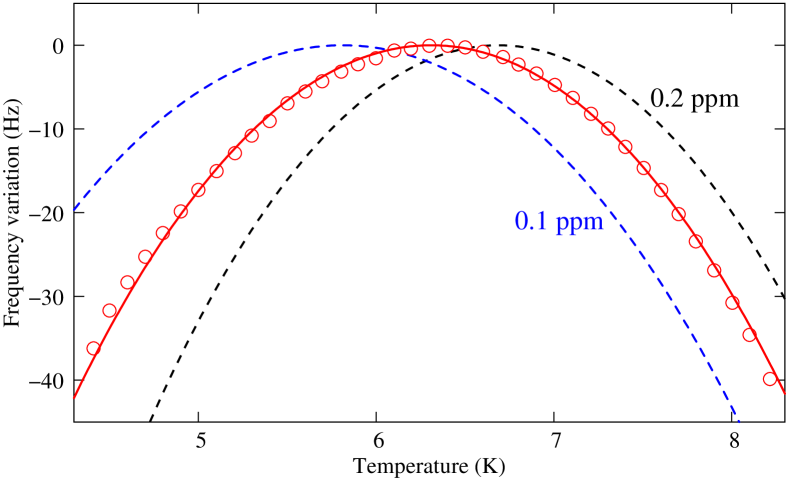
would be the mode frequency for a negligible circulating power, at K and in the absence of any paramagnetic dopant. K-4 Luiten et al. (1996) combines the temperature dependance of the dielectric constant and the thermal dilatation of the sapphire. The filling factor for a high order whispering gallery mode. is the real part of the ac susceptibility for a RF magnetic field perpendicular to the crystal C-axis. It is the sum of the contributions of all ion species contained into the crystal. The low power assumption means that the thermal distribution of the population on the energy levels of the paramagnetic impurities is not modified by the RF magnetic field, i.e. . For a mode frequency below the ESR of the dominant paramagnetic specie, the dependance of will compensate for the intrinsic sapphire thermal sensitivity. The mode frequency passes through a maximum at a temperature , which depends on the nature and concentration of the dopants. Our resonators are machined from HEMEX sapphire monocrystals provided by Crystal System Inc. Schmid and Viechnicki (1973). Such a crystal is grown with the Heat Exchanger Method allowing the growth of large sapphire boule with the lowest defects and impurities concentration. The Fig. 3 shows the turnover temperatures as a function of the whispering gallery mode frequency for a mm and mm sapphire resonator.
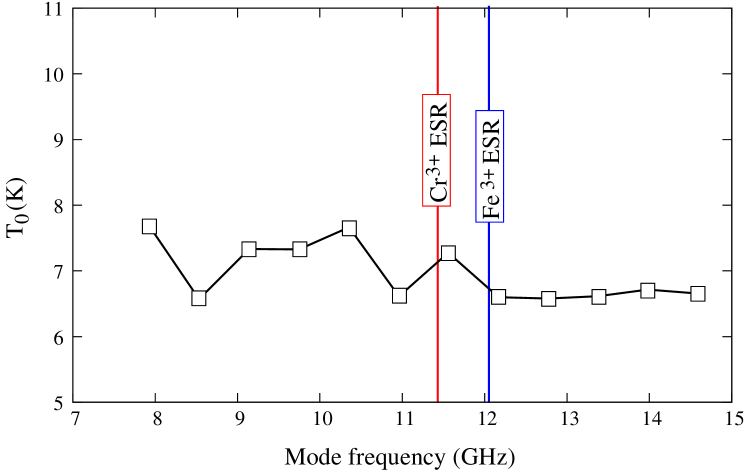
All whispering gallery modes in a large frequency range present a turnover temperature almost independent of the mode order . Luiten Luiten et al. (1996) demonstrated that it is due to the predominance of the Mo3+ ion, whose ESR frequency is 165 GHz. The Mo3+ concentration was estimated to be of the order of some ppm. The spread in turnover temperatures observed for low frequency modes ( GHz) could result from Cr3+ or/and Fe3+ residuals. The concentration of these residuals should be very low as the turnover temperature imposed by the Mo3+ ions is not greatly affected. Indeed other measurements show that Cr3+ and Fe3+ concentrations are of some tens of ppb Kovacich et al. (1997); Benmessai et al. (2013). The figure 4 shows the temperature dependance of the WGH16,0,0 mode at 11.565 GHz of the same resonator and the theoretical predictions. The equation 5 evaluated with and ppm of Mo3+ representes well the experimental frequency variation shown in the figure 4
IV Resonator power sensitivity
In the CSO the sapphire whispering gallery mode resonator is simply inserted in the positive feedback loop of an electronic amplifier to form an oscillator as schematised in the figure 5.
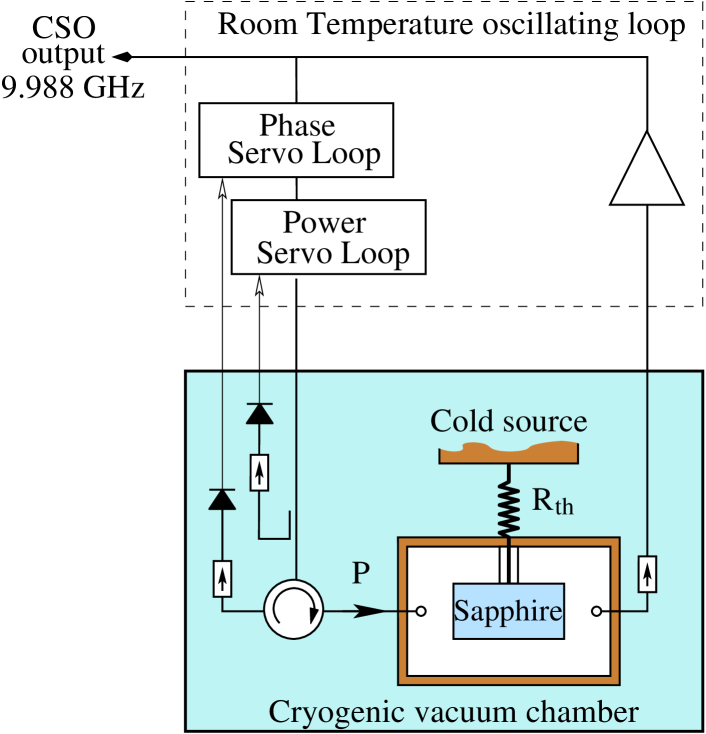
The CSO is completed by two servos to stabilize the power injected into the resonator and the phase lag along the sustaining loop Grop et al. (2010). The error signals needed for these two servos are derived from the low frequency voltages generated by two tunnel diodes placed near the resonator input port (see figure 5). We build two identical oscillators: CSO-1 and CSO-2, a third unit being under construction. These three instruments are intended to serve as references for ultra high resolution short term frequency stability measurements in the frame of the OSCILLATOR-IMP project www . The two CSOs are based on a mm and mm HEMEX resonator designed to operate on the quasi-transverse magnetic whispering gallery mode WGH15,0,0 near GHz. For this resonator, the electromagnetic field is confined inside a volume cm3. The table 2 gives the current resonators characteristics as measured with a network analyzer using a dBm probe signal.
| at | ||||||
|---|---|---|---|---|---|---|
| high power | ||||||
| (K) | (W) | (Hz/W) | ||||
| CSO-1 | 6.23 | 1 | 0.1 | 120 | -91 | |
| CSO-2 | 6.18 | 1 | 0.1 | 300 | -39 |
The Q-factor depends of the crystal quality but also of its cleaness. It can be affected by spurious modes and by some geometrical imperfections in the cavity symmetry or in the coupling probes alignement. Generally multiple cooldowns and fine step-by-step adjustments are required to get the highest unloaded Q-factor only limited by the sapphire dielectric losses. This was realized for CSO-1, still not for CSO-2 what explains its relative low Q-factor. For each resonator the coupling coefficients have been set near their optimal value, i.e. and . The injected power is almost entirely dissipated into the resonator. When the resonator is stabilized at its turnover temperature its thermal sensitivity nulls at first order and the CSO frequency stability is no longer limited by the cold source temperature fluctuations. The current limitation in the frequency instability is not clearly established. The resonator power to frequency conversion constitutes one possible limitation Nand et al. (2013) and needs thus to be investigated. To measure the CSO frequency sensitivity to the injected power, we follow the beatnote frequency changes when the power is varied in one CSO, while all other parameters being kept constant. Tunnel diodes placed at a low temperature turn out to be very sensitive and can be dammaged if the incident power is too high. In the current resonator implementation the maximal injected power has been limited to about 1 mW. The figure 6 shows the relative frequency variation as a function of the injected power for CSO-1 and CSO-2.
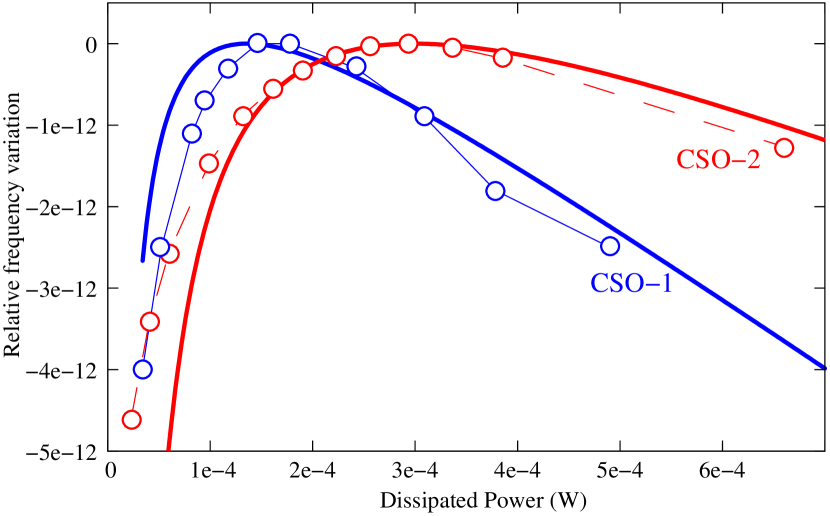
The mode frequency passes through a maximum at a given power and exhibits for a linear negative sensitivity. The slope at high power and , which depend on the resonator, are given in the table 2.
When the injected power is increased the resonator frequency will vary through different processes:
-
Thermal effect: the resonator is linked by a thermal resistance to the cold source stabilized at the temperature . The resonator temperature is . In the current design KW-1. Thus for mW the increase in the resonator temperature is only mK, which around the turnover temperature induces a relative frequency shift less than . This effect will give a negligible contribution in the experimentaly accessible range of power.
-
Radiation pressure: the stress induced by the stored energy results in a resonator expansion and a decrease in the dielectric constant. The resulting resonator linear frequency to power sensitivity has been previously evaluated and can be written as Chang et al. (1997); Nand et al. (2013):
(6) with Pa-1.
In the preceeding works, the radiation pressure effect was assumed to be the major cause of the resonator power sensitivity. Indeed at a high power, this linear power dependance dominates the resonator frequency power sensibility. Equation 6 gives a sensitivity of HzW-1 and HzW-1 for CSO-1 and CSO-2 respectively, which are compatible with the experimental observations (see table 2).
-
ESR saturation: the third effect arises from the saturation of the ESR. To get an approximation of the RF magnetic field seen by the ions we neglect its space variations. Over the effective volume , we take it as a constant and equals to its mean value defined as :
(7) The stored energy is proportionnal to the power dissipated inside the resonator:
(8) The amplitude of the ac-magnetic field can be thus written as:
(9) With the typical resonator parameters, i.e. , mW, GHz and cm3, we find mT, which is about three orders of magnitude higher than the transverse magnetic field existing inside a 50 coaxial cable where a 1 mW microwave signal is propagating. For a signal frequency not too far from the ESR frequency, i.e. , the saturation of the ESR arises very rapidly when the injected power is increased. The ion energy level populations tend to balance themselves and the induced magnetic susceptibility goes to zero. For a signal power higher than only remains the linear power sensitivity imposed by the radiation pressure effect.
The equation 5 is now adapted to represent the resonator sensitivity to the injected power :
| (10) |
This equation has been used to compute the relative frequency variation as a function of the dissipated power. The result is given in the figure 6 (bold lines) assuming a concentration of 0.2 ppm of Mo3+ and 10 ppb of Cr3+ for both resonators. We found about the same shape in the power dependances by replacing chromium by 1 ppb of Fe3+. As previously mentionned, the model overestimates the saturation of the ESR for Fe3+, whose concentration has been measured of the order of 10 ppb in similar sapphire crystals. It should also be pointed out that the value of is greatly dependant of the relaxation times and , which are not known with accuracy. Nevertheless our model explains qualitatively well the power sensitivity of the sapphire resonator.
V Application to the realization of an ultra stable oscillator
We can conclude from the previous observations (see figure 6) that it exists for each resonator a value of the injected power, i.e. for which the sensitivity to the power fluctuations nulls to the first order. At that point the CSO frequency stability would not any more be limited by the fluctuations of the injected power. To verify this assumption, we conducted the following measurement: CSO-2 was operated in a degraded mode with its power servo in open loop. A laboratory DC-power supply was used to bias the voltage controlled attenuator (VCA) placed in the oscillator loop and that controls the level of the injected power. The DC voltage generated by the power supply fluctuates with time following a random walk process. We observed that its standard deviation when averaged over s is of the order of V. At longer integration time, i.e. s, is degraded proportionally to , typical of a random walk process. Through the VCA the power injected in the resonator and thus the CSO frequency are modulated by this voltage noise. The figure 7 shows the relative frequency stability (Allan standard deviation) mesured by beating the two CSOs for different values of the power injected in CSO-2 imposed by the DC-voltage . CSO-1 was nominally running with its power servo on.
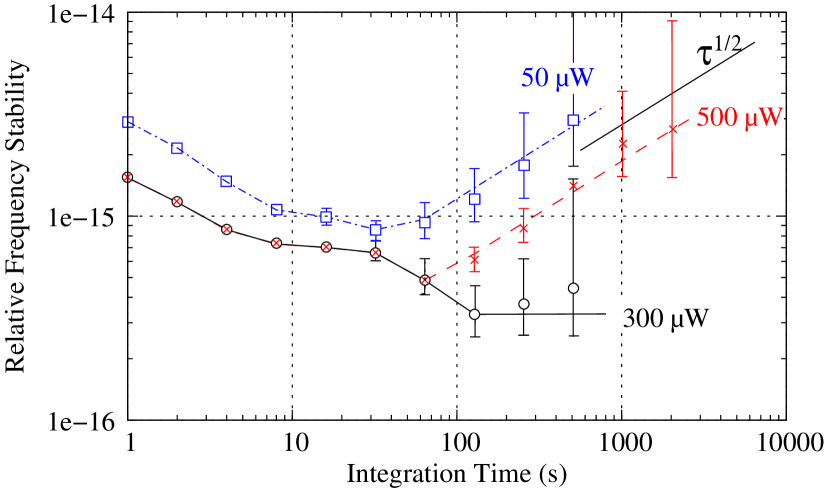
When the injected power is tuned to W, the gain of the phase servo is optimal and the measured short term frequency stability at s is , which includes the contributions of both CSOs. At this level of power the CSO frequency stability would not be limited by the fluctuations of the injected power. Indeed, the relative frequency stability improves as is increased to reach a flicker floor of . At a high power, i.e. W, the short frequency stability remains unaltered. Then for s, the frequency stability is clearly limited by random walk process. The measured frequency noise level is compatible with the DC-voltage noise and the resonator sensitivity at such a high injected power. At low injected power, W, the short term frequency stability for s is degraded as the gain of the phase servo, which is proportional to , is decreased. At longer integration time s, the measured frequency stability is degraded proportionally to with a frequency noise level higher than for W as the power sensitivity at low injected power is higher.
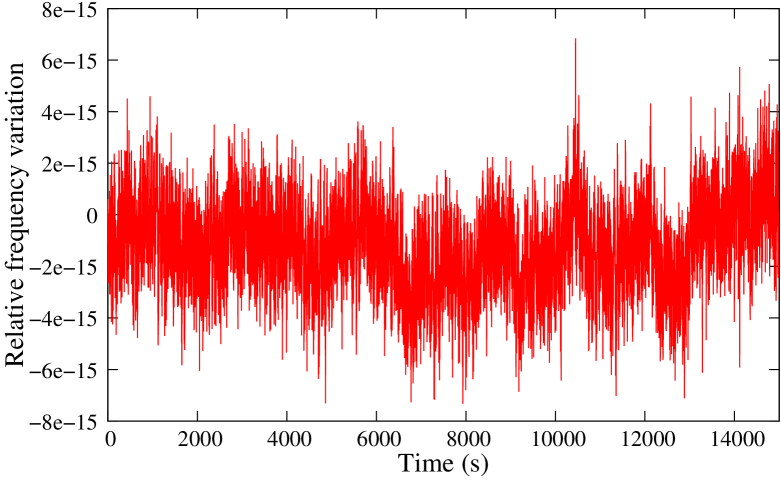
Eventually, in both oscillators, the resonator temperature and the injected power were stabilized at their inversion point, i.e. and respectively. The relative frequency stability is measured by beating the signals of the two identical CSOs, separated by 7.029 MHz, with a frequency counter without dead time. The next figure shows the raw data recorded for a quiet period of four hours.
The relative frequency stability (Allan standard deviation) of one CSO is presented in the figure 9: 3 dB was substracted considering that the total measured noise is the sum of the contribution of two identical oscillators.
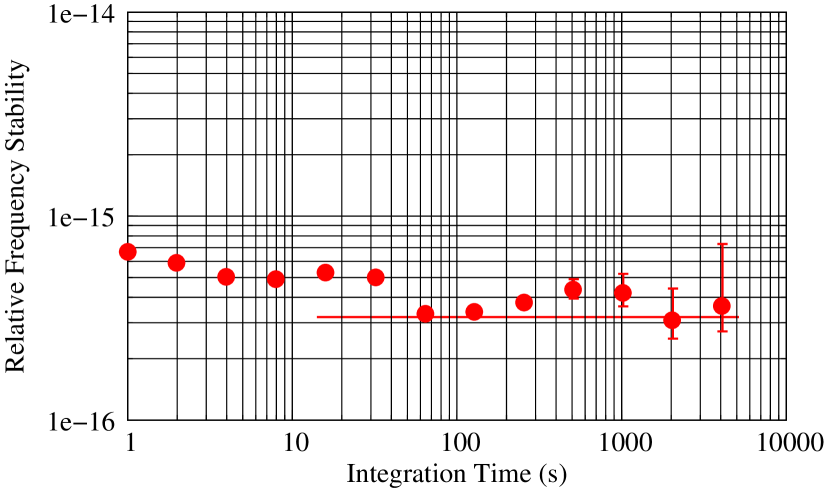
For s s the relative frequency stability is better than . A flicker floor of 3 is reached at 100 s. The first small hump appearing around s could be due to a residual pumping we have detected in the temperature servo of one resonator. The second hump around s comes from the pumping of the laboratory climatisation. This second hump could be due to the frequency stability measurement instrument sensitivity to the room temperature.
VI Conclusion
In summary we exploited the Van Vleck model to describe the saturation of the electron spin resonance of the paramagentic species contained in a high quality sapphire resonator. The proposed model explains qualitatively well the frequency-to-power sensitivity of the sapphire resonator. The ESR saturation and the sapphire intrinsic sensitivity compensate themselves at a given injected power, leading to a turnover in the frequency-vs-power curve. It is thus demonstrated than the CSO stabilized at this power value presents an exceptional short term frequency stability better than for s.
VII Acknowledgements
The work has been realized in the frame of the ANR projects: Equipex Oscillator-Imp and Emergence ULISS-2G. The authors would like to thank the Council of the Région de Franche-Comté for its support to the Projets d’Investissements d’Avenir and the FEDER for funding one CSO.
References
- Barish et al. (2002) B. C. Barish, G. Billingsley, J. Camp, W. P. Kells, G. H. Sanders, S. E. Whitcomb, L. Y. Zhang, R.-Y. Zhu, P. Z. Deng, J. Xu, G. Q. Zhou, and Y. Z. Zhou, IEEE Transactions on Nuclear Science, 49, 1233 (2002).
- Benmessai et al. (2013) K. Benmessai, W. G. Farr, D. L. Creedon, Y. Reshitnyk, J.-M. L. Floch, T. Duty, and M. E. Tobar, Physical Review B, 094412 (2013).
- Grop et al. (2011) S. Grop, W. Schäfer, P.-Y. Bourgeois, Y. Kersalé, M. Oxborrow, E. Rubiola, and V. Giordano, IEEE Transactions on Ultrasonics, Ferroelectrics and Frequency Control, 58 (2011).
- Giordano et al. (2012) V. Giordano, S. Grop, B. Dubois, P.-Y. Bourgeois, Y. Kersalé, E. Rubiola, G. Haye, V. Dolgovskiy, N. Bucalovicy, G. D. Domenico, S. Schilt, J. Chauvin, and D. Valat, Review of Scientific Instruments, 83 (2012).
- Mann et al. (1992) A. Mann, A. Giles, D. Blair, and M. Buckingham, J. Phys. D: Appl. Phys., 25, 1105 (1992).
- Luiten et al. (1996) A. N. Luiten, A. Mann, and D. Blair, J. Phys. D: Appl. Phys., 29, 2082 (1996).
- Bourgeois et al. (2005) P. Bourgeois, N. Bazin, Y. Kersalé, V. Giordano, M. Tobar, and M. Oxborrow, Applied Physics Letters, 87 (2005), 224104(3 pages).
- Benmessai et al. (2008) K. Benmessai, D. Creedon, M. Tobar, P. Bourgeois, Y. Kersalé, and V. Giordano, Physical Review Letters, 100 (2008).
- Creedon et al. (2012) D. L. Creedon, K. Benmessai, W. P. Bowen, and M. E. Tobar, Physical Review Letters, 108, 093902 (2012a).
- Creedon et al. (2012) D. L. Creedon, K. Benmessai, and M. E. Tobar, Physical Review Letters, 109, 143902 (2012b).
- Farr et al. (2013) W. G. Farr, D. L. Creedon, M. Goryachev, K. Benmessai, and M. E. Tobar, Physical Review B, 88, 224426 (2013).
- Siegman (1964) A. E. Siegman, Microwave Solid-state Maser (McGraw-Hill, New York, 1964).
- Vanier and Audoin (1989) J. Vanier and C. Audoin, The Quantum Physics of Atomic Frequency Standards, Vol I (Adam Hilger, Bristol, UK, 1989).
- Buschow and de Boer (2003) K. H. J. Buschow and F. R. de Boer, Physics of Magnetism and Magnetic Materials (Kluwer academic publishers, New York, 2003).
- Majlis (2007) N. Majlis, Quantum Theory of Magnetism (World Scientific Publishing, 2007).
- Standley and Vaughan (1965) K. J. Standley and R. A. Vaughan, Physical Review, 139, 355 (1965).
- Sharoyan et al. (1974) E. G. Sharoyan, O. S. Torosyan, E. A. Markosyan, and V. T. Gabrielyan, Physica Status Solidi (b), 65 (1974).
- Kocharyan et al. (1979) K. N. Kocharyan, A. A. Mirzakhanyan, and E. G. Sharoyan, Physica Status Solidi (b), 94, 129 (1979).
- Bogle and Symmons (1959) G. S. Bogle and H. F. Symmons, Proc. Phys. Soc., 73, 531 (1959).
- Vleck (1978) J. H. V. Vleck, Science, 201, 113 (1978).
- Boc̆a (2004) R. Boc̆a, Coordination Chemistry Reviews, 248, 757 (2004).
- Branginsky et al. (1987) V. Branginsky, V.S.Ilchenko, and K. Bagdassarov, Phys. Letters A, 120, 300 (1987).
- Bourgeois and Giordano (2005) P. Bourgeois and V. Giordano, IEEE Trans. on Microwave Theory and Techniques, 53, 3185 (2005).
- Cros and Guillon (1990) D. Cros and P. Guillon, IEEE Transactions on Microwave Theory and Techniques, 38, 1667 (1990).
- Schmid and Viechnicki (1973) F. Schmid and D. Viechnicki, Solid State Technology, 9 (1973).
- Kovacich et al. (1997) R. Kovacich, A. Mann, and D. Blair, J. Phys. D: Appl. Phys., 30, 3146 (1997).
- Grop et al. (2010) S. Grop, P.-Y. Bourgeois, N. Bazin, Y. Kersalé, E. Rubiola, C. Langham, M. Oxborrow, D. Clapton, S. Walker, J. D. Vicente, and V. Giordano, Review of Scientific Instruments, 81, 025102 (2010).
- (28) http://www.oscillator-imp.com/ (a).
- Nand et al. (2013) N. R. Nand, S. R. Parker, E. N. Ivanov, J.-M. Le Floch, J. G. Hartnett, and M. E. Tobar, Applied Physics Letters, 103, 043502 (2013).
- Chang et al. (1997) S. Chang, A. G. Mann, A. N. Luiten, and D. G. Blair, Physical Review Letters, 79, 2141 (1997).
- Vernotte and Lantz (2012) F. Vernotte and E. Lantz, IEEE Transactions on Ultrasonics, Ferroelectrics and Frequency Control, 59, 523 (2012).
- (32) http://theta.obs-besancon.fr/spip.php?article103&lang=fr (b).