Centre for Astrophysics Research, University of Hertfordshire, College Lane, Hatfield, AL10 9AB, UK
Korea Astronomy and Space Science Institute, 776, Daedeokdae–ro, Yuseong–gu, Daejeon, 305-348, Republic of Korea
Aix Marseille Université CNRS, LAM (Laboratoire d’Astrophysique de Marseille) UMR 7326, 13388, Marseille, France
Joint ALMA Observatory (ALMA/ESO), Alonso de Córdova 3107, Vitacura, 763-0355, Santiago, Chile
National Astronomical Observatory of Japan (NAOJ), 2-21-1 Osawa, Mitaka, 181-8588, Tokyo, Japan
The Graduate University for Advanced Studies (SOKENDAI), 2-21-1 Osawa, Mitaka, 181-8588, Tokyo, Japan
Department of Astronomy, University of Massachusetts, 710 North Pleasant Street, Amherst, MA 01003, USA
A 12 kpc H i extension and other Hi asymmetries in the isolated galaxy CIG 340 (IC 2487)
Abstract
Context. H i kinematic asymmetries are common in late–type galaxies irrespective of environment, although the amplitudes are strikingly low in isolated galaxies. As part of our studies of the H i morphology and kinematics in isolated late–type galaxies we have chosen several very isolated galaxies from the AMIGA sample for H i mapping. We present here the results of H i mapping of CIG 340 (IC 2487) which was selected because its integrated H i spectrum has a very symmetric profile (Aflux = 1.03 0.02).
Aims. Optical images of the galaxy hinted at a warped disk in contrast to the symmetric integrated H i spectrum profile. Our aim is to determine the extent to which the optical asymmetry is reflected in the resolved H i morphology and kinematics.
Methods. Resolved 21-cm H i line mapping has been carried out using the Giant Metrewave Radio Telescope (GMRT). The H i morphology and kinematics from this mapping together with other multi-wavelength data have been used to study the relationship between the H i and stellar components of CIG 340.
Results. GMRT observations reveal significant H i morphological asymmetries in CIG 340 despite it’s overall symmetric optical form and highly symmetric H i spectrum. The most notable H i features are: 1) a warp in the H i disk (with an optical counterpart), 2) the H i north/south flux ratio = 1.32 is much larger than expected from the integrated H i spectrum profile and 3) a 45′′ (12 kpc) H i extension, containing 6% of the detected H i mass on the northern side of the disk.
Conclusions. Overall we conclude that in isolated galaxies a highly symmetric H i spectrum can mask significant H i morphological asymmetries which can be revealed by H i interferometric mapping. The northern H i extension appears to be the result of a recent perturbation (108 yr), possibly by a satellite which is now disrupted or projected within the disk. But, we cannot rule out that the H i extension and the other observed asymmetries are the result of a long lived dark matter halo asymmetry. This study provides an important step in our ongoing program to determine the predominant source of H i asymmetries in isolated galaxies. For CIG 340 the isolation from major companions, symmetric H i spectrum, optical morphology and interaction timescales have allowed us to narrow the possible causes the H i asymmetries and identify tests to further constrain the source of the asymmetries.
Key Words.:
galaxies:ISM – galaxies:individual CIG 340 (IC 2487) – radio lines:galaxies1 Introduction
A galaxy’s evolution and its properties at z = 0 are the result of both internal processes and its environment. The AMIGA (Analysis of the Interstellar Medium of Isolated GAlaxies (http://amiga.iaa.es) project’s principal aim is to provide quantitative benchmarks, from its strictly defined sample of isolated galaxies (the AMIGA sample, Verdes-Montenegro et al., 2005), with which to assess the impact of dense environments on galaxy properties. The AMIGA project has clearly established that variables expected to be enhanced by interactions are lower in isolated galaxies than in any other sample (Verley et al. 2007a,b; Lisenfeld et al., 2007; Leon et al., 2008; Sabater et al., 2008; Durbala et al., 2008; Lisenfeld et al., 2011; Fernández Lorenzo et al., 2012, 2013). Galaxies in the AMIGA sample have remained free of major tidal interactions for at least the last 3 Gyr (Verdes-Montenegro et al., 2005) and most spirals in the sample likely host pseudo–bulges rather than classical bulges (Durbala et al., 2008).
A key finding from our studies of isolated galaxies was that they have smaller H i spectral asymmetries than galaxies in denser environments (Espada et al., 2011b). Espada et al. studied the H i single dish spectral profiles of a sample of 166 AMIGA galaxies using an H i asymmetry parameter Aflux, defined as the ratio of the H i flux between the receding and approaching sides of the spectrum. They find that the distribution of this parameter is well described by a half Gaussian distribution, with only 2% of the sample having an asymmetry parameter in excess of 3 (Aflux = 1.39), i.e., a flux excess 39% in one half of the spectrum. In contrast, field galaxy samples deviate from a Gaussian distribution and have a higher fraction (10-20%) of asymmetric galaxies (Espada et al., 2011b).
It is well known that the environment affects galaxy evolution: tidal interactions can perturb both the stellar and gas disks, ram pressure is able to perturb H i disks (Vollmer et al., 2008) and major mergers can destroy the structure of both the gas and stellar disks (Struck, 1999). The presence of asymmetric H i profiles in isolated galaxies and the Gaussian distribution of their Aflux parameters (Espada et al., 2011b) implies that process(es) other than interactions with major companions are operating to maintain long lived or frequent shorter lived perturbations in isolated late–type galaxies.
Several secular perturbation processes have been proposed as the cause of the observed H i and stellar asymmetries in isolated galaxies: accretion of cold gas from the surrounding environment, intermittent accretion of satellite galaxies and internal bar, disk or retarded SF driven perturbations (Bergvall & Ronnback, 1995; Bournaud & Combes, 2002; Bournaud et al., 2005; Sancisi et al., 2008). To date very few detailed observational studies have been carried out to determine the causes of such asymmetries in isolated galaxies, although the Pisano et al. (2002) H i study found 25% of their isolated galaxy sample had gas rich minor companions.
We are therefore carrying out a programme of resolved H i studies for a sample of AMIGA galaxies to determine the dominant mechanism(s) that gives rise to the observed H i spectral asymmetries in isolated galaxies. The Aflux spectral asymmetry parameters of the AMIGA galaxies for which we have carried out resolved H i studies so far, i.e., CIG 96 (Espada et al., 2005, 2011a), CIG 292 (Portas et al., 2011) and CIG 85 (Sengupta et al., 2012), are 1.16, 1.23 and 1.27 respectively. As part of this study we present Giant Metrewave Radio Telescope (GMRT) interferometric H i observations of the AMIGA late–type galaxy CIG 340, which has one of the most symmetric single dish H i spectra in the Espada et al. (2011b) AMIGA sample. Its Aflux = 1.03 0.02 from the single dish spectrum raised the expectation of an H i disk with a highly symmetric morphology at high angular resolution .
.
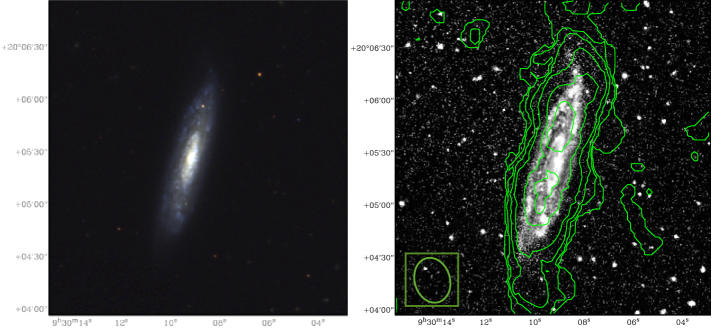
CIG 340 (Figure 1) is a mid–sized spiral with an AMIGA RC3111Third Reference Catalog of Bright Galaxies. morphology classification of 4 (Sbc), and both its LFIR (Lisenfeld et al., 2007) and SDSS g – r colour (Fernández Lorenzo et al., 2012) are consistent with a Sbc spiral but it is over–luminous in LB for an Sbc galaxy. Hernández-Toledo et al. (2008) classify CIG 340 as an Sc spiral. Table 1 gives some further properties of the galaxy.
The highly symmetric H i spectrum and other properties typical of AMIGA galaxies makes this well isolated galaxy a particularly good candidate for an H i morphology study. This paper presents the results of our GMRT CIG 340 observations as well as utilising SDSS222Sloan Digital Sky Survey. and GALEX333The Galaxy Evolution Explorer. public archive images. Section 2 sets out details of our observations, and the results are given in section 3. We briefly discuss the isolation of CIG 340 and the mechanisms which may be responsible for the observed H i asymmetries in section 4. Concluding remarks are set out in section 5. J2000 coordinates are used throughout the paper, including the figure coordinates.
| Property | Value | Reference |
|---|---|---|
| Voptical | 4339 6 km s-1 | Fernández Lorenzo et al. (2012) |
| RA | 09h30m09.09s | Leon & Verdes- |
| Montenegro (2003) | ||
| DEC | +20d05m24.3s | ” ” |
| Distance | 54.8 Mpc | Fernández Lorenzo et al. (2012) |
| Spatial scale | 15.9 kpc/arcmin | ” ” |
| D25 major /minor | 1.84 x 0.46 arcmin | ” ” |
| D25 major /minor | 29.3 x 7.4 kpc | ” ” |
| Inclination | 83.7∘ | ” ” |
| Morphology | 4 (Sbc) | ” ” |
| H i Aflux | 1.033 0.02 | Espada et al. (2011b) |
| log() | 10.23 L⊙ | Fernández Lorenzo et al. (2012) |
| B | 12.989 | ” ” |
| log() | 10.36 M⊙ | Fernández Lorenzo et al. (2013) |
| log(LFIR) | 9.53444From Lisenfeld et al. (2007) adjusted for currently estimated distance. L⊙ | Lisenfeld et al. (2007) |
2 Observations
21–cm H i line emission from CIG 340 has been observed for 10 hours with the GMRT in November, 2009. The full width at half maximum (FWHM) of the GMRT primary beam at 1.4 GHz is 24′. The baseband bandwidth used for the observations was 8 MHz giving a velocity resolution of 13.7 km s-1 within the velocity range 3650 km s-1 to 5150 km s-1. Observational parameters, including the rms noise and beam sizes used to produce the integrated H i maps are presented in Table 2.
Our GMRT data was reduced using the Astronomical Image Processing System (AIPS) software package. Bad data due to malfunctioning antennas, antennas with abnormally low gain and/or radio frequency interference (RFI) were flagged. The primary flux density calibrator used in the observations was 3C147, and the phase calibrators were 0842+185 and 1111+199. The flux densities are on the scale from Baars et al. (1977), with flux density uncertainties of 5 per cent. Continuum subtraction in the uv domain was carried out with the AIPS tasks uvsub and uvlin. The continuum subtracted uv data was transformed into the image plane using the AIPS task imagr and integrated H i and H i velocity field maps were then extracted using the task momnt. To analyse the H i structures in CIG 340 we produced image cubes and maps at different resolutions by tapering the data with different uv limits. For this paper we present maps from cubes with beam sizes of 26.08′′ x 19.97′′ (high resolution) and 45.57′′ x 41.35′′ (low resolution). It should be noted that the shortest spacing between GMRT antennas is 60 m which in L band results in the observations being insensitive to smooth structures with angular sizes 6′ to 7′ ( 100 kpc), i.e. is of little concern for the observed source.
| High | Low | ||
| resolution | resolution | ||
| cube | cube | ||
| Observation Date | 13 November 2009 | ||
| Primary Calibrator | 3C147 | ||
| Phase Calibrators | 0842+185, 1111+199 | ||
| Phase Calibrator – flux density [Jy] | 1.4, 1.3 | ||
| Integration time [hr] | 10 | ||
| Channel width [km s-1] | 27 | 13 | |
| rms (per channel) [ mJy beam-1] | 1.0 | 1.4 | |
| Beam (major axis)[′′] | 26.08 | 45.57 | |
| Beam (minor axis)[′′] | 19.97 | 41.35 | |
| Beam PA [∘] | 15.5 | -59.73 |
3 Observational Results
3.1 HI morphology and content
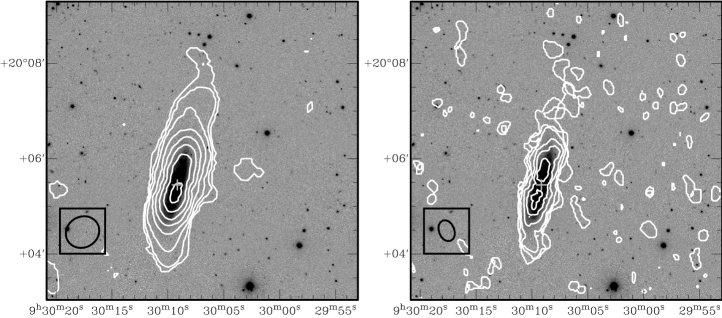
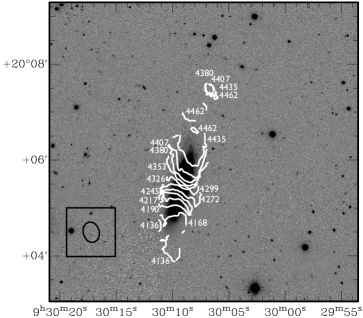
Figure 2 shows the contours from the GMRT low and high resolution integrated H i maps overlaid on an SDSS r–band image. The low resolution ( 45′′) H i map contours (left panel) show the H i extending 170′′ (45 kpc) north of the optical centre but only 125′′ (33 kpc) to the south, as measured at the 3 noise level (a column density of 5 x 10¹⁹ atoms cm-2). The high resolution map – right panel ( 25′′) also shows an an “S” shape extension continuing 44′′ (12 kpc) from northern edge of the optical disk, although with a clumpier morphology than at low resolution. In both the high and low resolution maps this H i extension is projected 45 ′′ (12 kpc) further north of the optical centre than the H i extends in the south. We use this north/south extent difference as an estimate of the H i extension’s length and its H i mass is 4 x 10⁸ M⊙, i.e., 6% of the total H i mass. This mass is about twice the H i mass asymmetry implied from the Aflux = 1.03 0.02, although within the order of the H i mass inferred from the Aflux uncertainty. The high resolution integrated H i map contours, Figure 2 – right panel, shows that the highest H i column densities (), 2.5 x 10²¹ atoms cm-2, are located in two maxima 12′′ (3.1 kpc) south and 17′′ (4.5 kpc) north of the optical centre. [atoms cm-2] is calculated from the equation:
| (1) |
Where, = flux density [mJy beam-1 km s-1] and = beam size [arcmin]. The right panel of Figure 2 shows the H i column density at the optical centre is 1.9 x 10²¹ atoms cm−2, slightly less than at the maxima, but there is no clear indication of an H i hole at the galaxy center as is often the case for spirals with a strong classical bulge.
The integrated H i flux density obtained by Lewis et al. (1985) from single dish observations was 9.61 Jy km s-1 which compares to 7.86 Jy km s-1 from our the GMRT observations, i.e., 82% of single dish H i flux density. Conversion of the single dish flux density to an H i mass gives = 6.8 x 10⁹ M⊙ and we use this value for all calculations requiring the galaxy’s H i mass. [M⊙] is calculated using the equation:
| (2) |
Where, D = distance [Mpc] and = flux density [Jy km s-1].
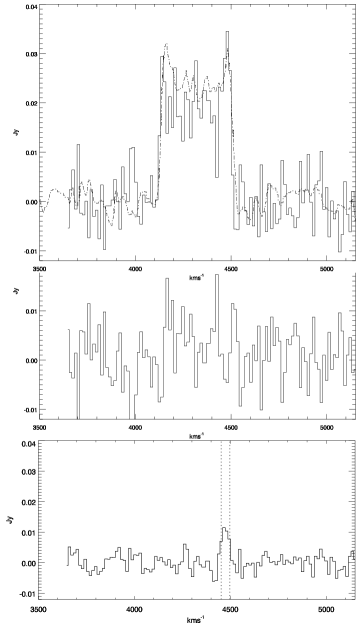
Figure 3 (top panel) compares the GMRT H i spectrum (solid line) with the manually digitized single dish spectrum (dashed line) from Lewis et al. (1985). The single dish spectrum displays a double horn profile, with the H i flux in the low velocity horn ( 4150 km s-1) being quite similar to that in the high velocity horn ( 4475km s-1). The middle panel of Figure 3 shows that, within the noise, the profile of our lower velocity resolution (13.7 km s-1) GMRT spectrum is in good agreement with the single dish spectrum. This conclusion is supported by the 0.93 ratio between the sum of the residuals in the velocity range over which H i was detected, above ( 4336 km s-1 4542 km s-1) and below ( 4110 km s-1 4336 km s-1) the H i systemic velocity.
Taking the major axis diameter as 1.84′ (Table 1) gives a log value 555 = M⊙ and = in kpc of 6.89. A comparison with the H i surface densities of isolated field galaxies of a similar morphological type (Haynes & Giovanelli, 1984) shows that CIG 340 has a normal H i content. The AMIGA sample is more isolated than the Haynes & Giovanelli (1984) sample so we compared the single dish H i mass with our AMIGA sample as well. The comparison with the AMIGA sample confirms the H i content of CIG 340 is similar to that of an isolated galaxy of its morphological type and size (Espada private communication).
The AMIGA isolation parameters based on either the (Verley et al., 2007b) or SDSS photometric data may not include optically faint gas rich companions. Therefore, the H i cube was searched for previously undetected companions over the entire GMRT primary beam, (the L band FWHM is 24′ which is 380 kpc at the distance of CIG 340), and covering a velocity range of 1500 km s-1. Although the signal to noise ratio (SNR) falls considerably beyond the primary beam FWHM, an area twice the FWHM diameter of (0.75 Mpc) was also searched but no H i companions were detected in either search. The H i mass detection limit for the low resolution cube inside the FWHM of the GMRT primary beam, assuming a 3 channel line width and 3 SNR, is 1.2 x 10⁸ M⊙.
3.2 HI velocity field and rotation
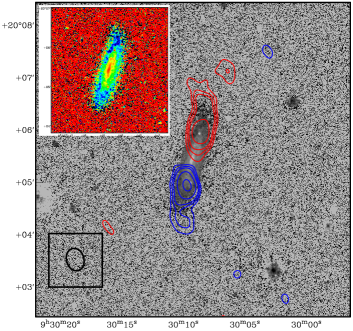
Systemic velocities derived from H i (4336 km s-1, Lewis et al., 1985) and optical (4339 6 km s-1, Fernández Lorenzo et al., 2012) observations are in good agreement. H i emission was detected in the high resolution cube at velocities between 4136 km s-1 and 4489 km s-1 (V =353 km s-1) and between 4109 km s-1 and 4489 km s-1 (V =380 km s-1) in the low resolution cube. Figure 4 shows the H i velocity field from the high resolution cube. Contours in the velocity field at the northern edge of the disk are unreliable because of low SNR artefacts. The changing angle of the H i iso–velocity contours in the velocity field, from PA = 104∘ at 4168 km s-1 to PA = 51∘at 4435 km s-1, indicate a warped H i disk (Bosma, 1978). The warp is also clearly seen in Figure 5 which shows the H i contours from the 4163 km s-1 (blue) and 4462 km s-1 (red) channels from the high resolution cube overlaid on an SDSS g – i band image.
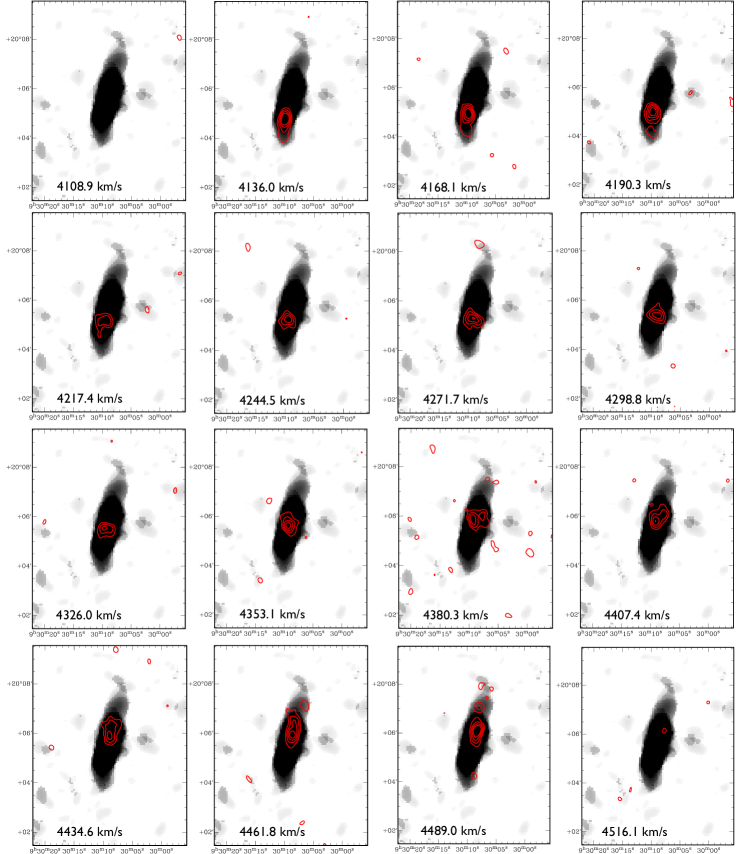
In Figure 8 we display the channel maps from the high resolution cube which shows the H i emission at the indicated heliocentric velocities (channel width of 27 km s-1) with rms noise of 1.0 mJy/ beam in each channel, implying a 3 detection threshold level of 1.7 x 1020 cm-2. The H i contours are overlaid on the H i integrated low resolution greyscale image. The spectrum of the 12 kpc H i extension, referred to in the previous section, is shown in the Figure 3 – lower panel and is also visible in the 4462 km s-1 and 4489 km s-1 channel maps. Evidence of the warped H i disk also comes from comparing the CIG 340 channel maps to those from warp models in Swaters et al. (1997); Gentile et al. (2003). In those warp models several intermediate channel maps between the systemic and extreme velocities display asymmetric bifurcations, approximately aligned with the galaxy major axis. In CIG 340 we see indications of asymmetric bifurcations in the 4244.5 km s-1, 4271.7km s-1, 4380.3 km s-1, and 4407.4 km s-1 channel maps. The Aflux parameter derived from the GMRT spectrum was = 1.01 and deducting H i extension spectrum from the GMRT spectrum increased the Aflux parameter to 1.10 ( 3 from Table 1). This increase in kinematic asymmetry, on removal of the H i extension spectrum, suggests that the H i extension is a morphological distortion within a kinematically symmetric H i disk.
3.3 Position – Velocity (PV) diagrams
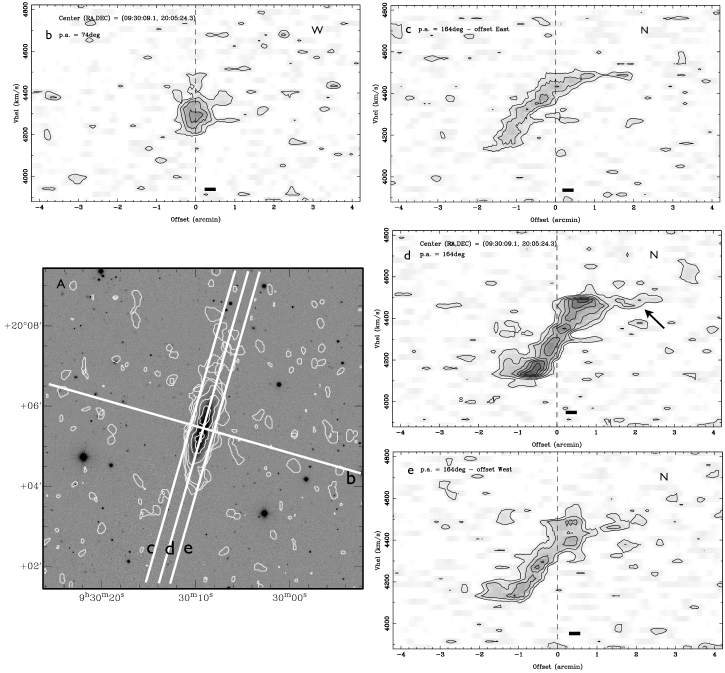
H i PV diagrams from the high resolution cube for cuts along the major (PA =164∘) and minor (PA = 74∘) axes centred at the galaxy’s optical centre are shown in Figure 6 – panels d and b. Additionally the Figure shows cuts parallel to the major axis cut, 20 arcsec to the east (panel c) and 20 arcsec to the west (panel e). Overall the major axis PV diagram is consistent with a rotating edge–on H i disk, although there are differences in velocity structure north and south of the optical center. For example north of the optical center the velocity range between offsets from the optical center of +1.3 arcmin and +2.7 arcmin is 50 km s-1. This contrasts to the south where the corresponding value between offsets at -1.3 and -1.7 arcsec is 100 km s-1. Whatever the mechanism producing the larger H i velocity range in south it could also have dispersed the H i there to column densities below the GMRT detection threshold, but, within the noise, the residuals in Figure 3 do not confirm this. The H i extension, marked with an arrow in Figure 6 – d, is kinematically clearly a continuation of the rotation curve.
For two small edge–on spirals Kamphuis et al. (2013) were able to use PV diagrams perpendicular to the major axis from deep H i observations of two edge–on spirals together with models to differentiate between a warped disk with spiral arms and an un–warped disk containing asymmetric H i distributions. Unfortunately our CIG 340 observation lacks the sensitivity and velocity resolution to detect the faint features required to make the comparison with models, although Figure 6 – b shows H i is detected up to 1.2 arcmin (19 kpc) above (west) of the optical centre. The lack of symmetry between the PV diagrams for the cuts parallel to major axis provides further evidence of the warped H i disk.
3.4 H i and stellar morphologies
The warp in the stellar disk is quite evident at the northern edge of the optical disk (Figure 1 – right panel). Warping at both northern and southern edges of the UV disk is also seen in the GALEX FUV and NUV images (not shown). But the warp is much more apparent and extensive in H i (Figures 2 and 5) and it seems likely that at least a galactic rotation ( 0.5 Gyr) would be required for the warp to become a disk wide phenomenon.
A bright lens is visible at the galaxy centre in both the SDSS (Figure 1) and 2MASS images, however lenses are unusual in a galaxy with a morphological type as late as Sbc. There is no indication from the optical images that a central classical bulge, primarily consisting of old stellar populations, extends above the optical disk, This is consistent with the absence of clear evidence for a central H i hole, however we do see a depression in the H i at the optical centre.
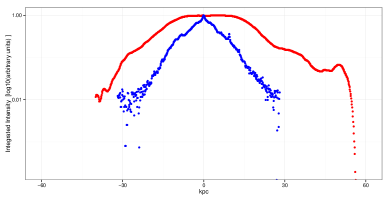
To further investigate the symmetry of H i and stellar disks we integrated the SDSS i – band emission (as a proxy for the older stellar population) and H i emission along the galaxy’s major axis (PA = 164∘). This analysis confirms the stellar emission is quite symmetrically distributed north and south of the optical centre (north/south emission ratio =0.95). In contrast the H i north/south emission ratio is 1.32. Figure 7 shows the log of the normalised integrated H i emission (red) compared to the normalised integrated SDSS i – band emission (blue) along the optical major axis, south (left) and north (right) of the optical centre. From Figure 7 the difference between the symmetrically distributed i – band light and the lopsided H i distribution favouring the north is clearly apparent. Moreover the H i in the figure shows a clear departure from an exponential decline with distance from the optical centre, starting 106′′ (28 kpc) north of the optical centre. This departure from the general distribution of H i in the disk suggests that the H i extension could be up to 64′′ (17 kpc) in length.
4 Discussion
First we discuss the isolation of CIG 340 then briefly consider several possible causes of the observed H i asymmetries focusing primarily on the most unexpected feature, the H i extension.
Isolation CIG 340 (mag=14.1g, 4339 km s-1) is part of the low–density-contrast group, LDCE 0651, identified in the Two Micron All-Sky Redshift Survey by Crook et al. (2008). The other group members are CGCG 91–099 (mag = 15.3, 4362 km s-1) and CGCG 92–005 (mag = 14.8g, 4456 km s-1). Of these neighbours, CGCG 91–099 is projected nearest to CIG 340, at a distance of 37.438′ (0.6 Mpc). To cover this projected distance at a velocity typical of group members (200 km s-1) would take 2.9 Gyrs, which is 6 times longer than the 0.5 Gyr for a single galaxy rotation666Trot [Gyr]= 6.1478 r/ Vrot, where r = the optical radius [kpc] and Vrot= 0.5 V [km s-1]/ sin(i)., based on VHI = 395.9 km s-1 (Lewis et al., 1985). It is generally considered that both stellar and H i asymmetries arising from tidal interactions will dissipate within a single galactic rotation. More particularly H i asymmetries caused by major merger interactions remain detectable for only 0.4 Gyr to 0.7 Gyr (Holwerda et al., 2011), i.e., approximately a single rotation period for CIG 340. Applying the density and tidal force parameters from Argudo-Fernández et al. (2013) to neighbouring galaxies777which includes both LDCE 0651 neighbours within a 1 Mpc radius, with optical diameters between 0.25 and 4 times that of the CIG 340, we conclude there have been no major interactions with currently observed major companions within at least the last 5.2 Gyr. So a recent major interaction with a known neighbour of similar size can safely be ruled out as the cause of any of the stellar or H i asymmetries observed in CIG 340.
While H i lopsidedness and warps in late–type galaxies are common and have been observed in other isolated galaxies, the 12 kpc H i extension is unexpected in an isolated galaxy. Below we summarise several possible causes of the H i extension:
A minor companion which is now disrupted or projected within the disk. There are no indications from the 2MASS J,H,K – band images of a minor companion. The northern outer disk perturbation in the SDSS g, r, i – band image (Figure 1 – right panel), the H i extension in Figure 2, and the larger H i velocity range (100 km s-1) at the southern edge of the H i disk (Figure 6) could all conceivably be the impacts of a minor companion on an orbit which has passed through both the northern and southern edges of the H i disk. An interesting feature in the SDSS g-i image (Figure 5 – insert) is the presence of a ridge of unusually blue emission running 30 arcsec (7.5 kpc) from in the north of the optical disk which could be related to passage of such a companion.
Modelling by Weinberg (1998) and Weinberg & Blitz (2006) showed that a galaxy of the mass of LMC on a polar orbit of a Milky Way mass galaxy can warp the principal galaxy’s stellar and H i disks to produce an “integral” sign warp morphology via a halo perturbation. The stellar mass of CIG 340 is 2.29 x 10¹⁰ M⊙ (Fernández Lorenzo et al., 2013) 50% of the Milky Way’s stellar mass. Provided the warping effects of the satellite scale approximately with stellar mass then a CIG 340 satellite of mass 7.5 x 10⁸ M⊙ (apparent magnitude of 17) could have created the observed warp. Such a satellite should be easily detectable in SDSS images, but none is seen. However CIG 340 shares a number of characteristics with the edge on spiral NGC 4013 (Vradial = 831 km s-1) including a similar optical size, a warped H i disk and a one sided H i extension, together with the absence of any observable satellite. Deep optical observations ( = 27.0 mag arcsec2) by Martínez-Delgado et al. (2009) revealed that NGC 4013 has an extensive system of faint tidal streams which were interpreted as debris from multiple orbits of a now disrupted dwarf companion. From the modelling of the NGC 4013 system it was concluded that its H i morphology asymmetries were most likely caused by an interaction with the companion.
Accretion of a cold H i cloud. The H i mass 4 x 10⁸ M⊙. and diameter 12 kpc of the H i extension are orders of magnitude greater than those of high velocity and intermediate velocity clouds in the local group which have H i masses of 105 M⊙ to 106 M⊙ and H i diameters of 1–3 kpc (Wakker et al., 1999; Westmeier et al., 2008). Moreover an infalling cloud would not be expected to fall on an extension of the rotation curve (see Figure 6 – d ). This and the comparison of the Aflux, including and excluding the H i extension, in section 3.2 provides strong evidence that the H i extension was originally part the outer H i disk rather than recently accreted material.
Disk/halo misalignment. In this scenario, which is proposed as an explanation for the frequently observed lopsided H i distributions in late–type galaxies, the centres of the baryonic disks are misaligned with the dark matter potential. Modelling indicates that this misalignment would dissipate within 5 rotations (Dubinski & Kuijken, 1995), i.e. 2.5 Gyr for CIG 340. Moreover high amplitude halo asymmetries from mergers or major interactions are predicted to be detectable for up to 2 Gyr (Bournaud et al., 2005). So while the isolation parameters appear to rule out interactions with the currently observed major companions as the source of the H i extension on the basis of time scales, an asymmetry in the dark matter halo arising from a merger within the last 2 Gyr could explain both the lopsidedness of the H i distribution and lack of a kinematic signature for the extension as well as the H i warp. Moreover we cannot discount a halo perturbation originating from an interaction with a now disrupted satellite (Jog & Combes, 2009).
In common with other AMIGA isolated spirals previously mapped in H i (CIG 85, CIG 96 and CIG 292, section 1), CIG 340 has indications that at least some its H i asymmetries were generated comparatively recently ( 108 yr) and that those asymmetries were not produced by interactions with the currently observed major companions. Like the other three galaxies, the signatures of H i asymmetry are stronger in the resolved morphology than in the velocity field. The (Verley et al., 2007b) isolation parameters for CIG 85, CIG 96 and CIG 340 indicate these galaxies are well isolated even within the AMIGA sample and signatures of lopsidedness and warps are also present in CIG 85 and CIG 292.
We note the continuum flux reported from NVSS888NRAO VLA Sky Survey is 2.2 mJy implies a star formation rate of 0.46 M⊙ yr-1, although continuum flux was not detected with the GMRT, consistent with a quiescence recent SF history. The radio – FIR correlation relation (Sabater et al., 2008) parameters for CIG 340 are, log L(1.4) = 20.9 and log(L60) = 9.19, confirming that the galaxy lies on the radio – FIR correlation.
5 Concluding remarks
Unexpectedly our GMRT H i observations revealed significant morphological asymmetries despite CIG 340 having a highly symmetric H i spectrum (Aflux = 1.03 0.02). The most notable H i features are: the warped disk ( with an optical counterpart), the ratio of H i emission north and south of the optical centre (1.32), and a 45′′ (12 kpc) H i extension at the northern edge of the disk. While the H i extension is morphologically distinguishable from main body of the H i disk suggesting a recent perturbation (108), there is no unambiguous equivalent kinematic signature. Based on its distinct morphology the most likely source of the H i extension appears to be an interaction with small currently undetected satellite. This satellite may also be responsible for producing the lopsidedness and the warped stellar / H i disks. Although we cannot rule out the possibility that the H i tail lopsidedness and the warped stellar / H i disks are evidence of a halo asymmetry produced by a merger that occurred between 0.5 Gyr and 2 Gyr ago, although we have no direct evidence for such a merger. CIG 340 demonstrates that in isolated galaxies a highly symmetric H i spectrum can still mask significant H i morphological asymmetries which can be revealed by H i interferometric mapping.
Deep optical observations to determine the presence or absence of stellar trails would help constrain the minor companion and cold gas cloud accretion scenarios. These observations together with a high resolution kinematic study of the central parts of the galaxy could provide further insights into the origin of the H i asymmetries, including the warp.
6 Acknowledgements
We are grateful to the anonymous referee for his/her helpful remarks, which have improved the presentation of this paper. This work has been supported by Grant AYA2011-30491-C02-01 co-financed by MICINN and FEDER funds, and the Junta de Andalucia (Spain) grants P08-FQM-4205 and TIC-114. We also thank the AMIGA team for their comments and suggestions. We thank the staff of the GMRT who have made these observations possible. GMRT is run by the National Centre for Radio Astrophysics of the Tata Institute of Fundamental Research. The Nasa Extragalactic Database, NED, is operated by the Jet Propulsion Laboratory, California Institute of Technology, under contract with the National Aeronautics and Space Administration. We acknowledge the usage of the HyperLeda database (http://leda.univ-lyon1.fr). Funding for the SDSS and SDSS-II has been provided by the Alfred P. Sloan Foundation, the Participating Institutions, the National Science Foundation, the U.S. Department of Energy, the National Aeronautics and Space Administration, the Japanese Monbukagakusho, the Max Planck Society, and the Higher Education Funding Council for England. The SDSS Web Site is http://www.sdss.org/. The SDSS is managed by the Astrophysical Research Consortium for the Participating Institutions. The Participating Institutions are the American Museum of Natural History, Astrophysical Institute Potsdam, University of Basel, University of Cambridge, Case Western Reserve University, University of Chicago, Drexel University, Fermilab, the Institute for Advanced Study, the Japan Participation Group, Johns Hopkins University, the Joint Institute for Nuclear Astrophysics, the Kavli Institute for Particle Astrophysics and Cosmology, the Korean Scientist Group, the Chinese Academy of Sciences (LAMOST), Los Alamos National Laboratory, the Max-Planck-Institute for Astronomy (MPIA), the Max-Planck-Institute for Astrophysics (MPA), New Mexico State University, Ohio State University, University of Pittsburgh, University of Portsmouth, Princeton University, the United States Naval Observatory, and the University of Washington. Based on observations made with the NASA Galaxy
References
- Argudo-Fernández et al. (2013) Argudo-Fernández, M., Verley, S., Bergond, G., et al. 2013, A&A, 560, A9
- Baars et al. (1977) Baars, J. W. M., Genzel, R., Pauliny-Toth, I. I. K., & Witzel, A. 1977, A&A, 61, 99
- Bergvall & Ronnback (1995) Bergvall, N. & Ronnback, J. 1995, MNRAS, 273, 603
- Bosma (1978) Bosma, A. 1978, PhD thesis, PhD Thesis, Groningen Univ., (1978)
- Bournaud & Combes (2002) Bournaud, F. & Combes, F. 2002, A&A, 392, 83
- Bournaud et al. (2005) Bournaud, F., Combes, F., Jog, C. J., & Puerari, I. 2005, A&A, 438, 507
- Crook et al. (2008) Crook, A. C., Huchra, J. P., Martimbeau, N., et al. 2008, ApJ, 685, 1320
- Dubinski & Kuijken (1995) Dubinski, J. & Kuijken, K. 1995, ApJ, 442, 492
- Durbala et al. (2008) Durbala, A., Sulentic, J. W., Buta, R., & Verdes-Montenegro, L. 2008, MNRAS, 390, 881
- Espada et al. (2005) Espada, D., Bosma, A., Verdes-Montenegro, L., et al. 2005, A&A, 442, 455
- Espada et al. (2011a) Espada, D., Muñoz-Mateos, J. C., Gil de Paz, A., et al. 2011a, ApJ, 736, 20
- Espada et al. (2011b) Espada, D., Verdes-Montenegro, L., Huchtmeier, W. K., et al. 2011b, A&A, 532, A117
- Fernández Lorenzo et al. (2013) Fernández Lorenzo, M., Sulentic, J., Verdes-Montenegro, L., & Argudo-Fernández, M. 2013, MNRAS, 434, 325
- Fernández Lorenzo et al. (2012) Fernández Lorenzo, M., Sulentic, J., Verdes-Montenegro, L., et al. 2012, ArXiv e-prints
- Gentile et al. (2003) Gentile, G., Fraternali, F., Klein, U., & Salucci, P. 2003, A&A, 405, 969
- Haynes & Giovanelli (1984) Haynes, M. P. & Giovanelli, R. 1984, AJ, 89, 758
- Hernández-Toledo et al. (2008) Hernández-Toledo, H. M., Vázquez-Mata, J. A., Martínez-Vázquez, L. A., et al. 2008, AJ, 136, 2115
- Holwerda et al. (2011) Holwerda, B. W., Pirzkal, N., Cox, T. J., et al. 2011, MNRAS, 416, 2426
- Jog & Combes (2009) Jog, C. J. & Combes, F. 2009, Physics Reports, 471, 75
- Kamphuis et al. (2013) Kamphuis, P., Rand, R. J., Józsa, G. I. G., et al. 2013, MNRAS, 434, 2069
- Leon & Verdes-Montenegro (2003) Leon, S. & Verdes-Montenegro, L. 2003, A&A, 411, 391
- Leon et al. (2008) Leon, S., Verdes-Montenegro, L., Sabater, J., et al. 2008, A&A, 485, 475
- Lewis et al. (1985) Lewis, B. M., Helou, G., & Salpeter, E. E. 1985, ApJS, 59, 161
- Lisenfeld et al. (2011) Lisenfeld, U., Espada, D., Verdes-Montenegro, L., et al. 2011, A&A, 534, A102
- Lisenfeld et al. (2007) Lisenfeld, U., Verdes-Montenegro, L., Sulentic, J., et al. 2007, A&A, 462, 507
- Martínez-Delgado et al. (2009) Martínez-Delgado, D., Pohlen, M., Gabany, R. J., et al. 2009, ApJ, 692, 955
- Pisano et al. (2002) Pisano, D. J., Wilcots, E. M., & Liu, C. T. 2002, ApJS, 142, 161
- Portas et al. (2011) Portas, A., Scott, T. C., Brinks, E., et al. 2011, ApJ, 739, L27
- Sabater et al. (2008) Sabater, J., Leon, S., Verdes-Montenegro, L., et al. 2008, A&A, 486, 73
- Sancisi et al. (2008) Sancisi, R., Fraternali, F., Oosterloo, T., & van der Hulst, T. 2008, A&AR, 15, 189
- Sengupta et al. (2012) Sengupta, C., Scott, T. C., Verdes Montenegro, L., et al. 2012, A&A, 546, A95
- Struck (1999) Struck, C. 1999, Physics Reports, 321, 1
- Swaters et al. (1997) Swaters, R. A., Sancisi, R., & van der Hulst, J. M. 1997, ApJ, 491, 140
- Verdes-Montenegro et al. (2005) Verdes-Montenegro, L., Sulentic, J., Lisenfeld, U., et al. 2005, A&A, 436, 443
- Verley et al. (2007b) Verley, S., Leon, S., Verdes-Montenegro, L., et al. 2007b, A&A, 472, 121
- Verley et al. (2007a) Verley, S., Odewahn, S. C., Verdes-Montenegro, L., et al. 2007a, A&A, 470, 505
- Vollmer et al. (2008) Vollmer, B., Braine, J., Pappalardo, C., & Hily-Blant, P. 2008, A&A, 491, 455
- Wakker et al. (1999) Wakker, B. P., Howk, J. C., Savage, B. D., et al. 1999, Nature, 402, 388
- Weinberg (1998) Weinberg, M. D. 1998, MNRAS, 299, 499
- Weinberg & Blitz (2006) Weinberg, M. D. & Blitz, L. 2006, ApJL, 641, L33
- Westmeier et al. (2008) Westmeier, T., Brüns, C., & Kerp, J. 2008, MNRAS, 390, 1691