Effect of nominal substitution of transition metals for excess Fe in Fe1+xSe superconductor
Abstract
Taking cue from the increase in the superconducting transition temperature () of Fe1+xSe via nominal (2 wt%) substitution of Cr instead of excess Fe, we have now extended our study with nominal substitution (5 wt%) with other transition metals (Ni, Co, Fe, Mn, Cr, V and Ti) in place of excess iron. The is found to increase (maximum K) or get suppressed depending on the substituted transition metal. Our studies indicate that the superconducting transition temperature depends on various parameters like the ionic size of the transition metal, its magnetic moment as well as the amount of hexagonal phase present as impurity.
pacs:
74.25.Ha, 74.62.Bf, 74.62.Dh, 74.70.Xa, 81.10.Fq.I Introduction
Discovery of superconductivity in LaFeAsO1-xFx with a K in 2008 Kamihara_1 led to an outburst of research activity towards finding new Fe-based superconductors and increasing their , which resulted in the identification of at least six family Kamihara_1 ; Rottar_2 ; Wang_3 ; Hsu_4 ; Ogino_5 ; Bao_6 ; Stewart_7 of Fe-based superconductors with the highest of K reported in Gd0.8Th0.2FeAsO Wang2_8 . Among these superconductors, FeSe (Fe-11) based superconductors have the lowest . Stoichiometric Fe1.0Se1.0 has a NiAs-type hexagonal (space group ) crystal structure and does not exhibit superconductivity at ambient pressure. However, with a small excess of Fe at the Fe-site (Fe1+xSe, ), the crystal structure gets stabilized into a tetragonal structure (space group space group) which shows superconductivity with a K Hsu_4 . Even though the crystal structure of Fe-11 resembles that of the other pnictides superconductors, the structure is less complex and consists of only the alternate Fe–Se planes with no spacer layers in between, which makes them ideal materials to investigate the superconducting properties in Fe-based high superconductors in general. Application of an external pressure is found to increase the of the Fe-11 compounds Mizuguapl_9 ; Margadona_10 ; Medvedev_11 . Even for the non-superconducting stoichiometic compound Fe1.0Se1.0, superconductivity can be achieved with a as high as 27 K with an applied pressure of GPa Mizuguapl_9 . The of the non-stoichiometric tetragonal compound Fe1.01Se increases initially with the hydrostatic pressure, attaining a maximum of K for GPa and then decreases down to K at 14 GPa Margadona_10 . In all the pressure effect studies on , it is found that the non-superconducting hexagonal phase increases along with the increase in . As the crystal structure gets completely transformed into the hexagonal phase, superconductivity gets fully suppressed Medvedev_11 implying that there is an optimum ratio between the two phases for the maximum . The alternate way to increase of the Fe-11 compounds is the chemical pressure, achieved by the doping of other chemical elements at the Fe or Se site. is found to increase to a maximum of K at ambient pressure by substituting 50% Te at the Se site Fang_12 ; Yeh_13 ; Sales_14 ; Taen_15 , whereas the S substitution at the Se site is found to increase , only to a maximum of 10.5 K Mizuguchi_16 . Wu et al., Wu_17 have studied the effect of substitution (more than 10 %) at the Fe site by non transition metals (Al, Ga, In, Sm, Ba) and transition metals (Ti, V, Cr, Mn, Co, Ni and Cu) in the Fe1+xSe compound, but could not observe any enhancement in . The only other family of compounds which showed a maximum of 32 K amongst the FeSe-based compounds is the xFe2-ySe2 ( = K, Cs, Rb) family of compounds, but with a different guo18 ; Wang19 ; Kazakov20 crystal structure (ThCr2Si2 structure, space group ). We have earlier reported an increase in upto 11 K by substituting excess Cr (2%) at the Fe site, instead of excess Fe Anilprb_21 ; Anilsolid_22 . This motivated us to investigate the effect of nominal substitution of other transition metal (TM) elements at the Fe site in the Fe1+xSe compound. The substitution of TMs was started with and then subsequently increased to search for the optimal stoichiometry for the maximum and diamagnetic shielding fraction in each substitution. In this paper, we present the physical properties (structural, magnetization, electrical transport and thermal transport) only for the optimally doped FeSe, ( = Fe, Mn, Cr, V, Ti)) compounds, which show the maximum . We could not observe a clear evidence for superconductivity when Ni and Co was substituted in place of Fe. Our studies indicate that the superconducting transition temperature depends on various parameters like the ionic size of the transition metal, its magnetic moment as well as the amount of hexagonal phase present as impurity.
II Experimental Techniques
Polycrystalline samples of FexSe ( = Ni, Co, Fe, Mn, Cr, V and Ti) were prepared via conventional solid state reaction method. The starting materials of high purity element powders were taken in stoichiometric ratio and mixed in an agate mortar. The mixture was then heated in an evacuated quartz tube at 20 ∘C/hour and held at 1050 ∘C for 24 hours. After that, the samples were cooled slowly down to 360 ∘C, held at that temperature for 24 hours and then quenched from this temperature in liquid nitrogen (LN2). The quenching process was adopted to minimize the formation of -FeSe hexagonal phase, since the tetragonal -phase is known to exist above ∘C Okamoto_23 ; McQueen_24 . For studying the effect of quenching, a few samples ( = Fe, Mn, Ti and V) were also synthesized by cooling to room temperature in the final stage instead of quenching from 360 ∘C. Powder X-Ray diffraction (Cu-) patterns were obtained using a Panalytical X’Pert Pro (– scans) for the structural analysis and the phase purity determination. For the chemical identification and the stoichiometry analysis, the energy dispersive X-ray spectroscopy (EDAX) was performed. DC magnetization and ac susceptibility ( Oe and frequency Hz) measurements were carried out in a Superconducting Quantum Interference Device - Vibrating Sample Magnetometer (SVSM) (Quantum Design, USA). Electrical resistance using four probe method was measured using the resistivity option of the Physical Property Measurement System (PPMS), Quantum Design Inc., USA. Thermal conductivity and thermopower measurements were performed via the thermal relaxation method in the TTO option of the PPMS.
III Results
III.1 Structure analysis
Typical room temperature X-ray powder diffraction patterns of FexSe ( = Ni, Co, Fe, Mn, Cr, V and Ti) samples for the optimal substitution with LN2 quenching are shown in Fig. 1.
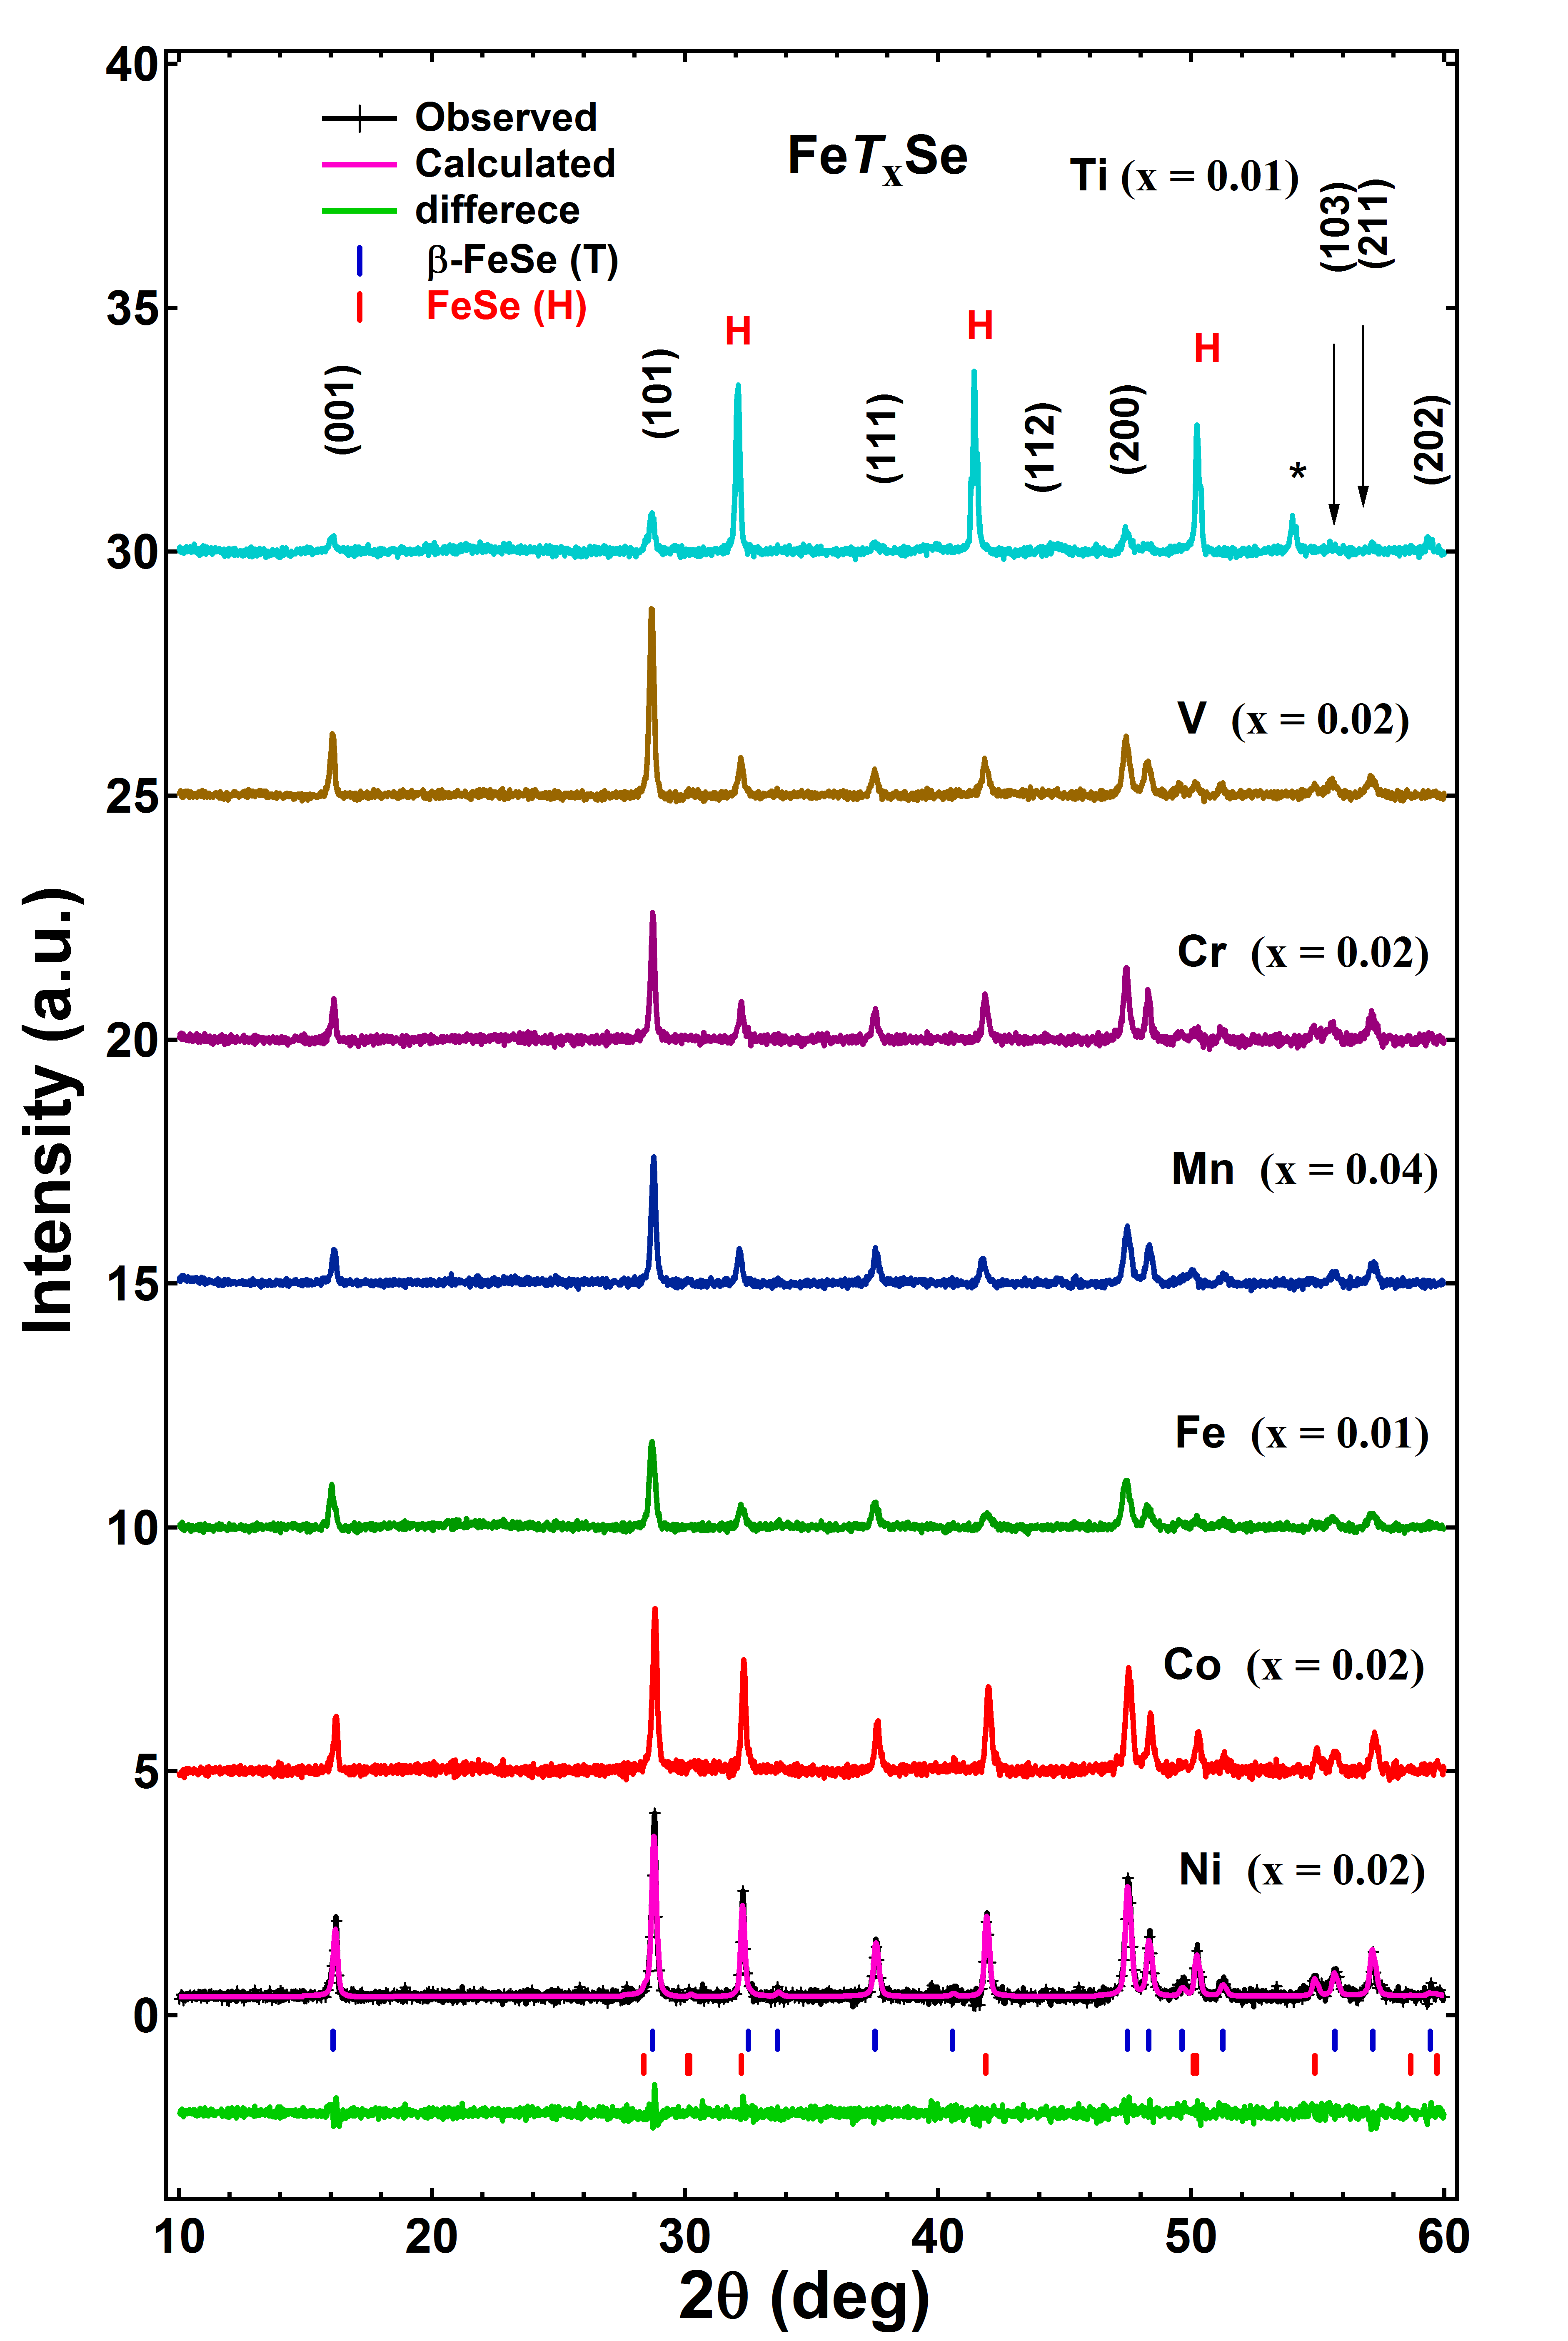
The Rietveld refinements were performed for all the samples using the FullProf software. All the observed peaks could be indexed well only if two phases, the tetragonal -FeSe ( space group) and the hexagonal -FeSe ( space group), were included in the refinement. Result of one such a refinement is also shown in Fig. 1 for FeNi0.02Se. The peaks which match with the tetragonal phase are indexed with the corresponding () values and the peaks that match with the hexagonal phase are marked with H in Fig. 1. However, if the peaks could not be indexed by either of the phases, then they are marked as impurity with an asterisk. Various parameters obtained from the refinements are given in Table 1.
| Compounds | (Å) | (Å) | () | Tet. (W%) | Hex.(W%) | (K) | |
| FeNi0.02Se (Q) | 3.774 | 5.519 | 1.462 | 78.61 | 64.1 | 35.9 | 0.0 |
| FeCo0.02Se (Q) | 3.771 | 5.522 | 1.464 | 78.53 | 49.6 | 50.4 | 0.0 |
| Fe1.01Se (RT) | 3.768 | 5.521 | 1.465 | 78.40 | 82.8 | 17.2 | 8.2 |
| Fe1.01Se (Q) | 3.771 | 5.520 | 1.465 | 78.27 | 83.7 | 16.3 | 9 |
| FeMn0.04Se (RT) | 3.770 | 5.522 | 1.464 | 78.49 | 86.1 | 13.9 | 10 |
| FeMn0.04Se (Q) | 3.775 | 5.527 | 1.464 | 78.61 | 63.3 | 36.7 | 10 |
| FeCr0.02Se(RT)Anilprb_21 | 3.773 | 5.524 | 1.464 | 78.64 | 84.6 | 15.4 | 10.5 |
| FeCr0.02Se(Q) | 3.767 | 5.519 | 1.465 | 78.31 | 50.1 | 49.9 | 11.0 |
| FeV0.02Se(RT) | 3.772 | 5.524 | 1.464 | 78.62 | 82 | 18 | 9.5 |
| FeV0.02Se(Q) | 3.772 | 5.520 | 1.463 | 78.56 | 78.5 | 21.5 | 11.2 |
| FeV0.03Se(Q) | 3.776 | 5.508 | 1.463 | 78.01 | 10 | 90 | 9.2 |
| FeV0.05Se(Q) | No tetragonal phase | 0 | 100 | 0 | |||
| FeTi0.01Se(RT) | 3.773 | 5.525 | 1.464 | 78.69 | 76.3 | 23.7 | 8 |
| FeTi0.01Se(Q) | 3.770 | 5.518 | 1.463 | 78.43 | 15.1 | 84.9 | 11.0 |
The lattice parameters were found to be unaffected by the nominal substitution of the transition metal. It is not expected that such a small percentage of substitution by various transition metal ions will vary the lattice parameters significantly. We have confirmed the incorporation of the transition metals into the stoichiometry through the EDAX spectra for all the compositions (see Table 2). The EDAX results are average value of composition that shows slight variation in stoichiometry. However stoichiometry from Rietveld refinement is very close to starting stoichiometry of samples. A curious observation is the fact that the percentage of the hexagonal phase increases significantly in some cases (Mn and Ti) due to quenching, even though the quenching process was supposed to reduce the unwanted hexagonal phase.
| S. No. | Substituted element () | Starting composition | Average composition from EDAX | Rietveld refinement stoichiometry |
|---|---|---|---|---|
| 1 | Ni | FeNi0.02Se | Fe1.1Ni0.02Se0.9 | FeNi0.02Se |
| 2 | Co | FeCo0.02Se | Fe0.98Co0.02Se0.82 | FeCo0.02Se |
| 3 | Fe | Fe1.01Se | Fe1.02Se0.96 | Fe0.99Fe0.01Se |
| 4 | Mn | FeMn0.04Se | Fe1.23Mn0.05Se0.98 | Fe0.997Mn0.04Se |
| 5 | Cr | FeCr0.02Se | Fe1.02Cr0.02Se0.9 | Fe0.99Cr0.02Se |
| 6 | V | FeV0.02Se | Fe0.95V0.02Se1.05 | Fe0.99V0.02Se |
| 7 | Ti | FeTi0.02Se | Fe0.99Ti0.02Se0.99 | Fe0.997Ti0.01Se0.99 |
III.2 Magnetization
Figures 2 (a)–(f) show the results of zero field-cooled (ZFC) and field-cooled (FC) dc magnetic susceptibility () for all the optimally doped transition metal-excess samples from 2 K to 13 K. Superconductivity as well as transition temperature () get suppressed in the Ni (2 wt %) and Co (2 wt %) excess samples (Fig. 2(a)). We see only a small dip in the magnetization in both the Ni- and Co-excess samples. Similar type of suppression of superconductivity was also observed by other groups with the doping of 1 wt% Ni and Co in FeSe Mizuguchi_16 ; Wu_17 ; Zhang_25 . Figure 2 (b) shows the measurements for the parent compound with excess Fe, but synthesized by the quenching process. There is only a slight change in ( K) as compared to the of the samples or the single crystals prepared in the usual way (slow cooling) Hsu_4 ; McQueen_24 ; Zhang(22SST)_26 ; Zhang(T@H SST)_27 . Samples with the substitution of excess iron more than 1 wt% were also prepared by the LN2 quenching method, but did not yield any enhancement in . The data for the other transition metal substitutions are shown in Figs. 2 (c)–(f), where we observe an enhancement in . The optimal substitution for the highest and the shielding fraction varies for each transition metal element; Mn – 4 wt%, Cr – 2 wt%, V – 2 wt% and Ti – 1 wt%. The ac susceptibility measurement is usually used as a better tool for a more precise measurement of the since the measurement can be performed without the application of any dc magnetic field Hein_28 . The ac susceptibility measurement (in zero dc field) with temperature for all the substituted samples are plotted along with the dc magnetization in Figs. 2(b)–(f).
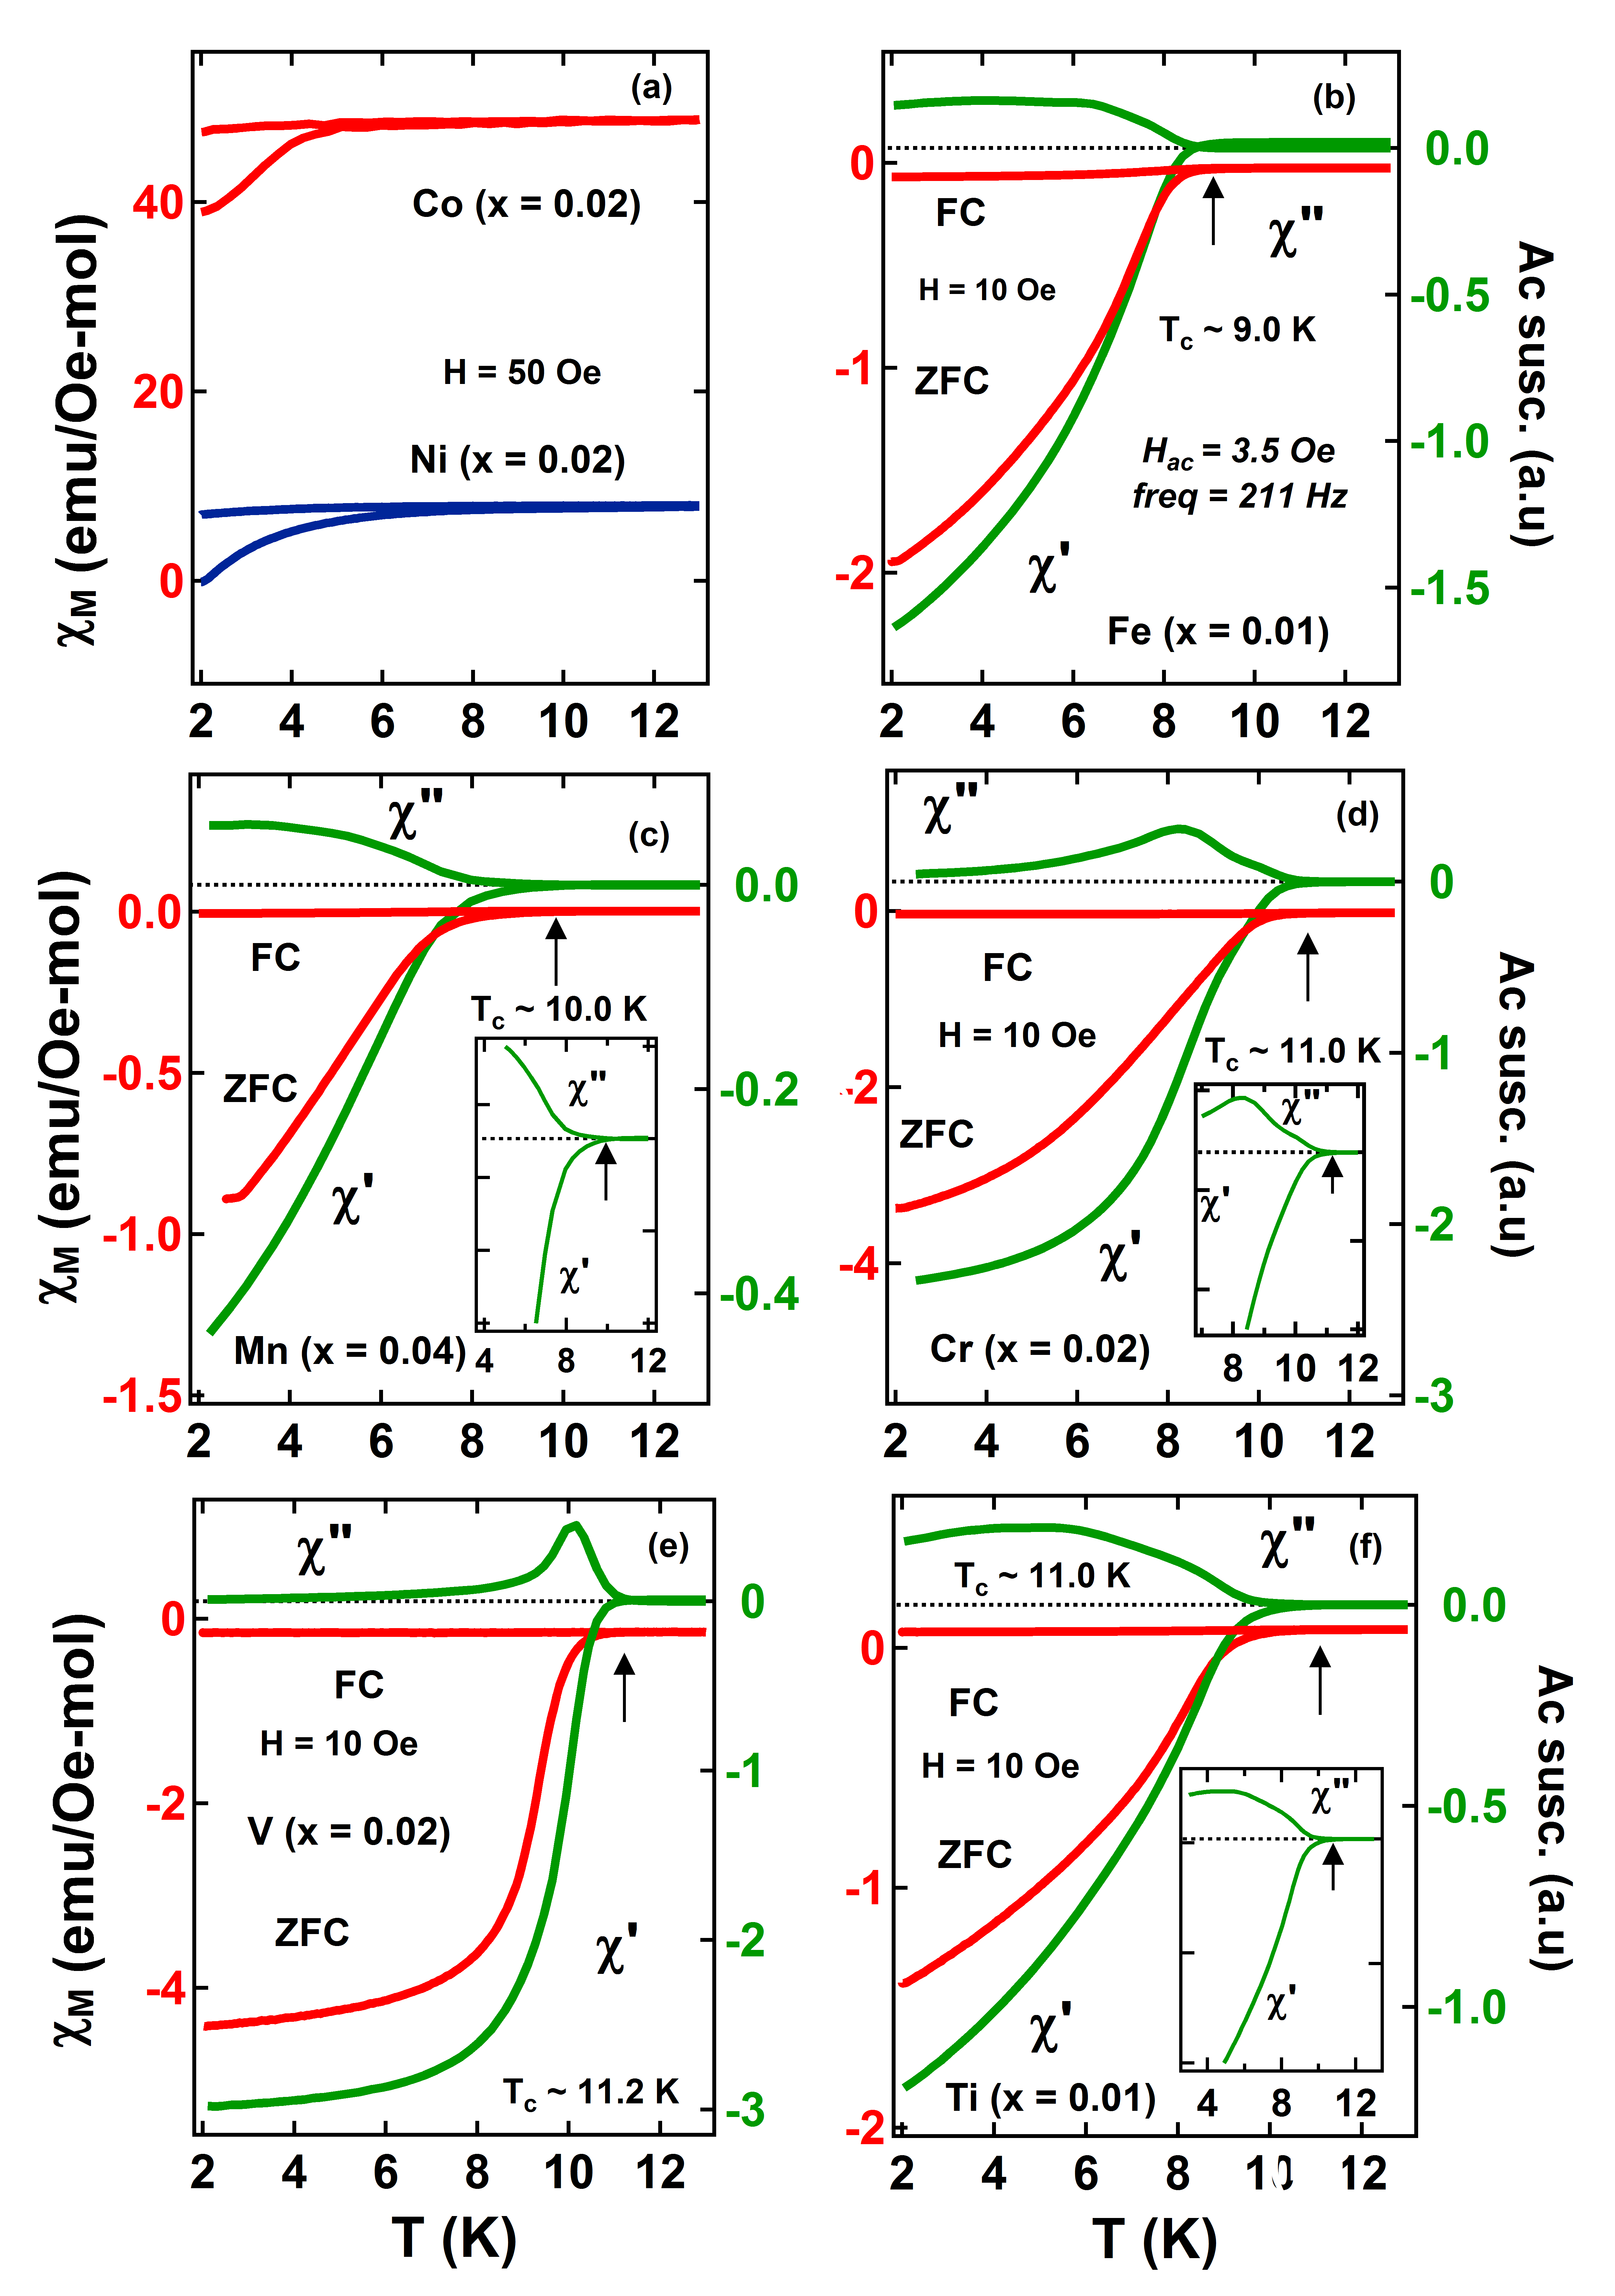
The transition temperatures are determined from the deviation of (in phase with applying ac signal) and (out of phase) from the zero line, which are listed in Table 1. The sharpness of the peak can be taken as the quality of the superconducting sample. Insets of Figs. 2(c),(d) and (f) show the expand portion of ac susceptibility where the bifurcation start in and to extract the .
III.3 Electrical transport measurement
The main panel of Fig. 3(a) shows the temperature dependence of resistivity in zero field from 2 K to 300 K for all the optimally doped FeTxSe compounds, except Ti (resistance for Ti-substituted sample could not be measured due to the brittle nature of the sample). The resistivity curves show typical ’S’ shaped curvature in the full temperature range, which may be associated with the pseudo-gap at the Fermi surface in these compounds at higher temperatures Song_29 . The Fe-excess compound is found to have the highest resistivity among all the superconducting Fe1+xSe compounds, while the non superconducting Ni-excess sample is found to have the largest resistivity amongst all the compounds. The metallic characteristic of these compounds were determined by calculating the residual resistance ratio (RRR =) which is given in Table 3. These values of RRR are smaller than the values for typical metallic conductors which suggests qualitatively that these compounds are relatively bad conductors. The behaviour of resistance near the transition temperature is highlighted in the inset of Fig. 3(a), where the expanded portion of the curves near the are shown between 2 K to 20 K. Fig. 3(b) shows the typical resistivity curves at zero field and 90 kOe for FeV0.02Se in entire temperature range. The normal state resistance differs considerably from the zero field values when the magnetic field is applied, implying a large magneto-resistance in this compound. At about K the two resistivity curves cross-over (see inset of Fig. 3(b)) such that the resistivity which was higher for 90 kOe now becomes lower compared to the zero field resistivity. This crossing-over of the curves may be associated with the structural phase transition from the tetragonal to the orthorhombic phase observed in the low temperature XRD measurements of Fe1+xSe compound Hsu_4 ; Margadona_10 ; Zhang_25 .
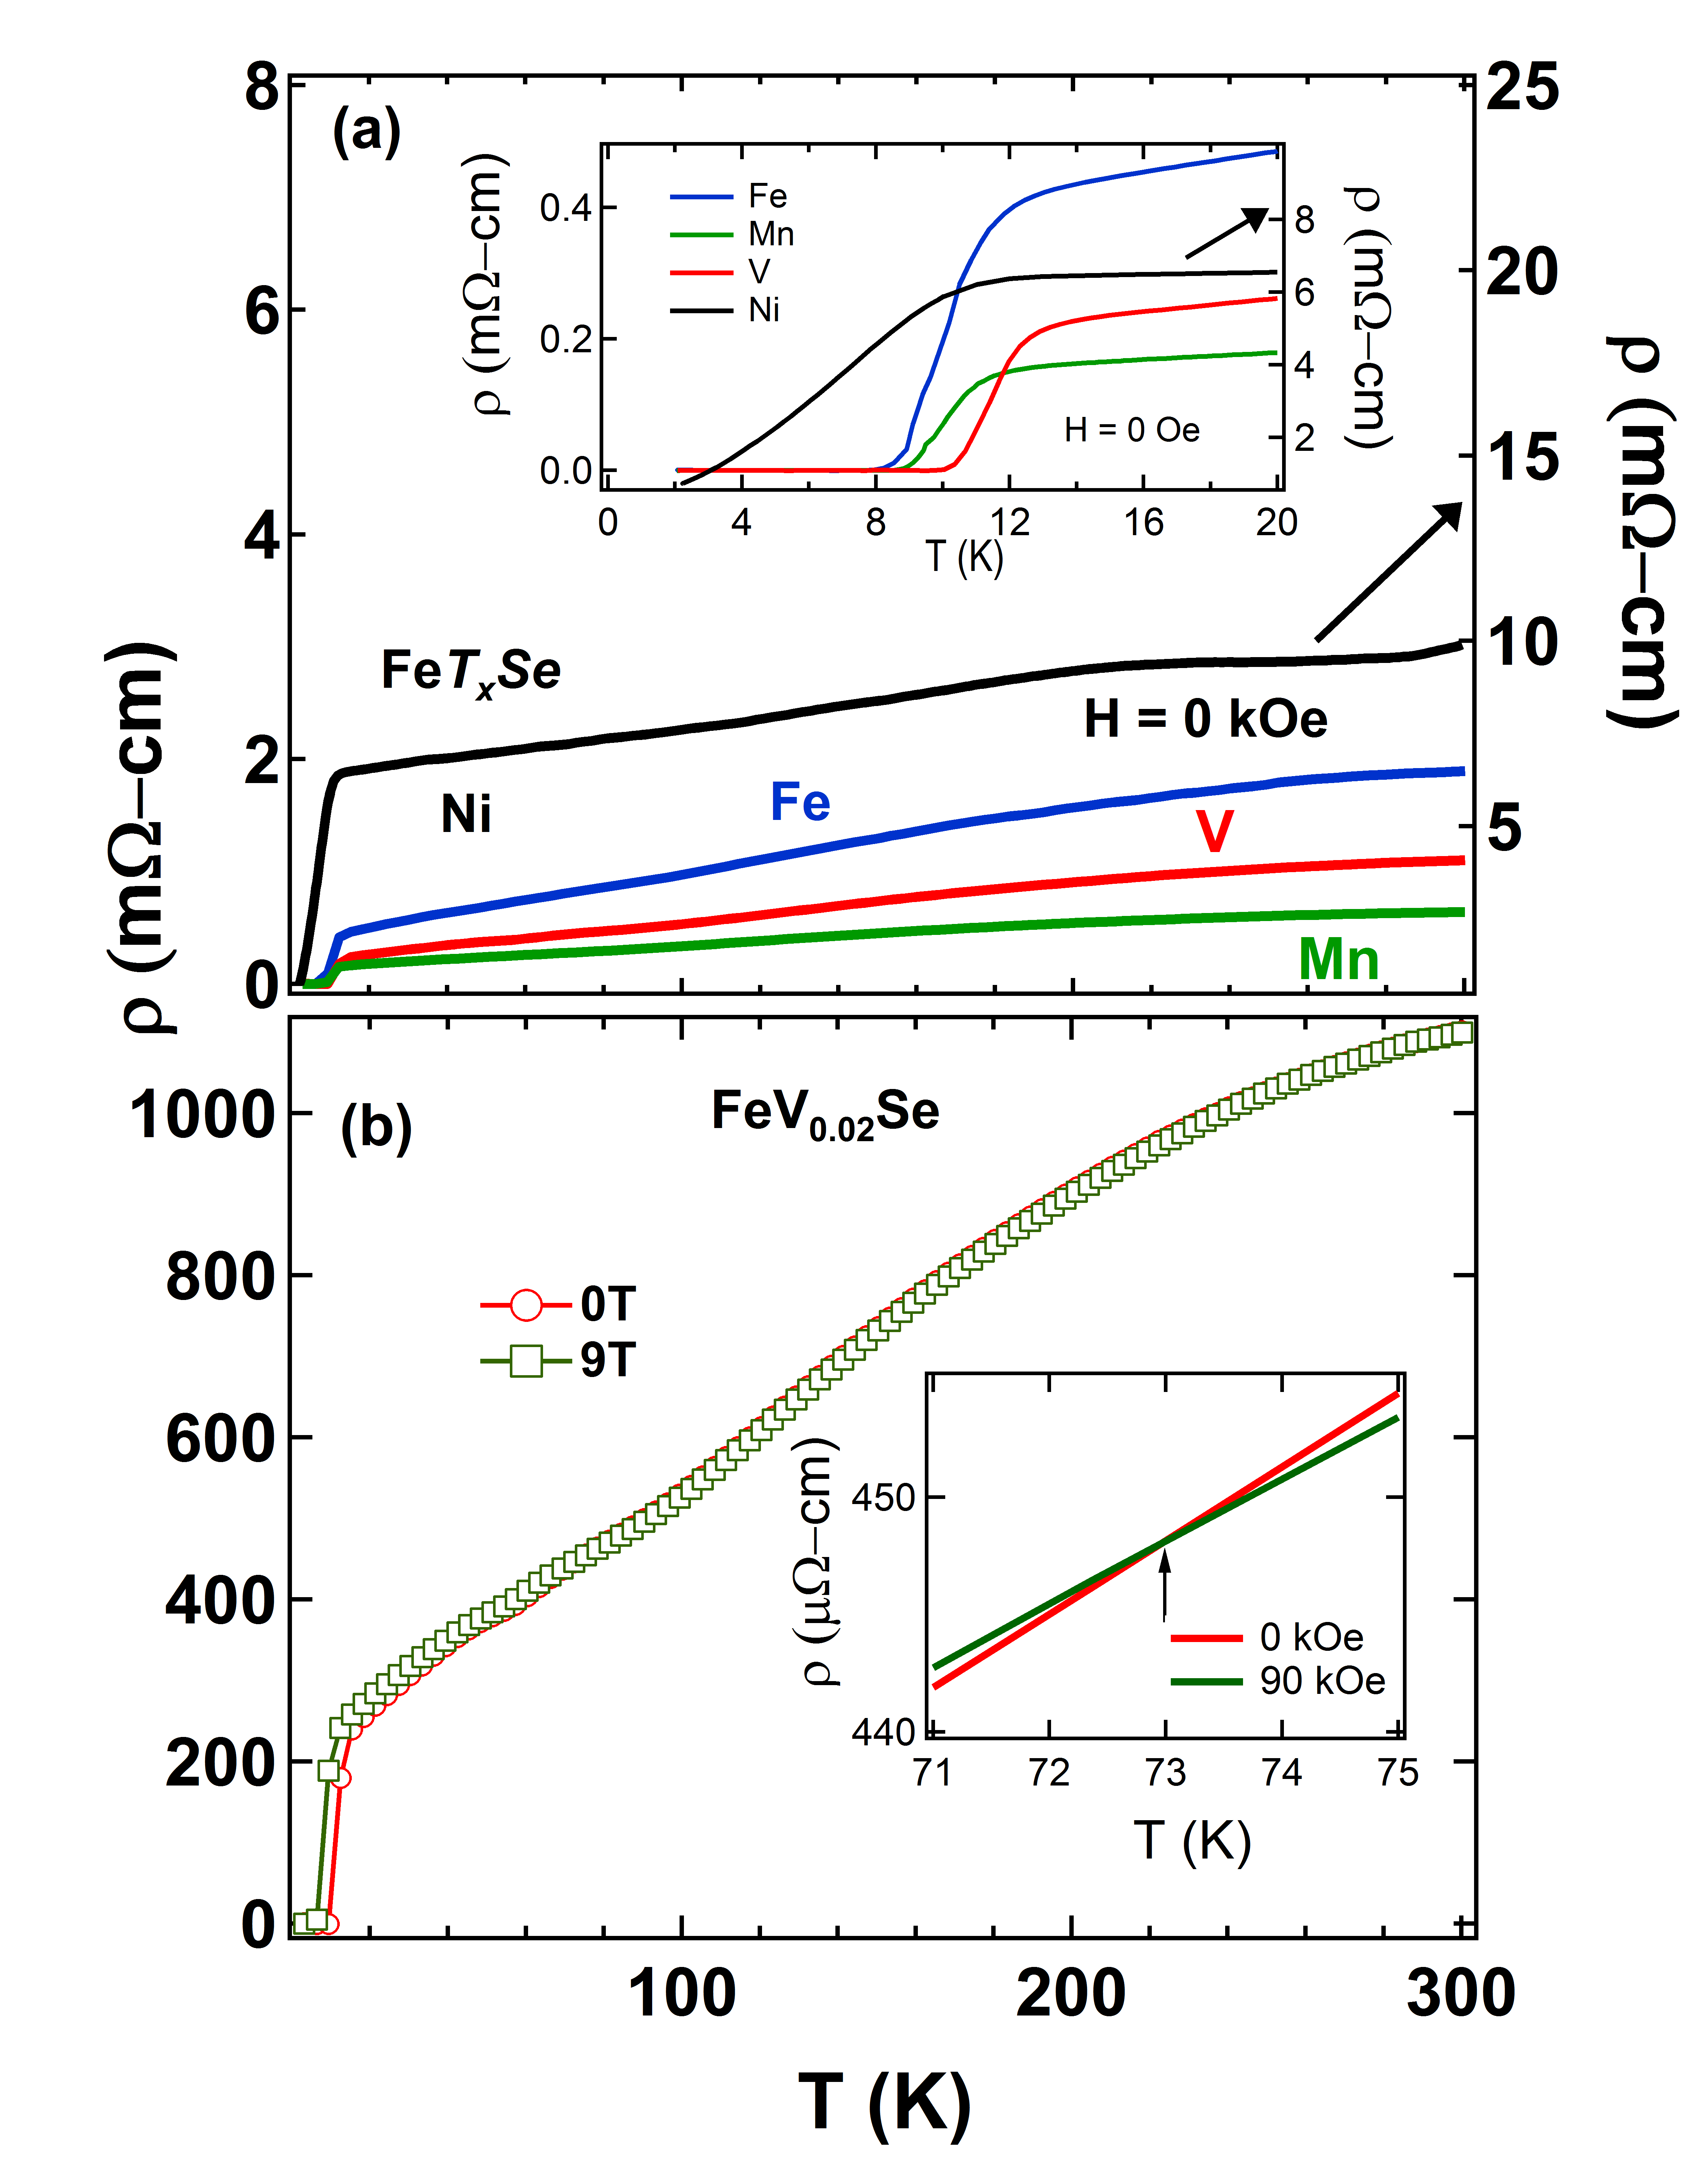
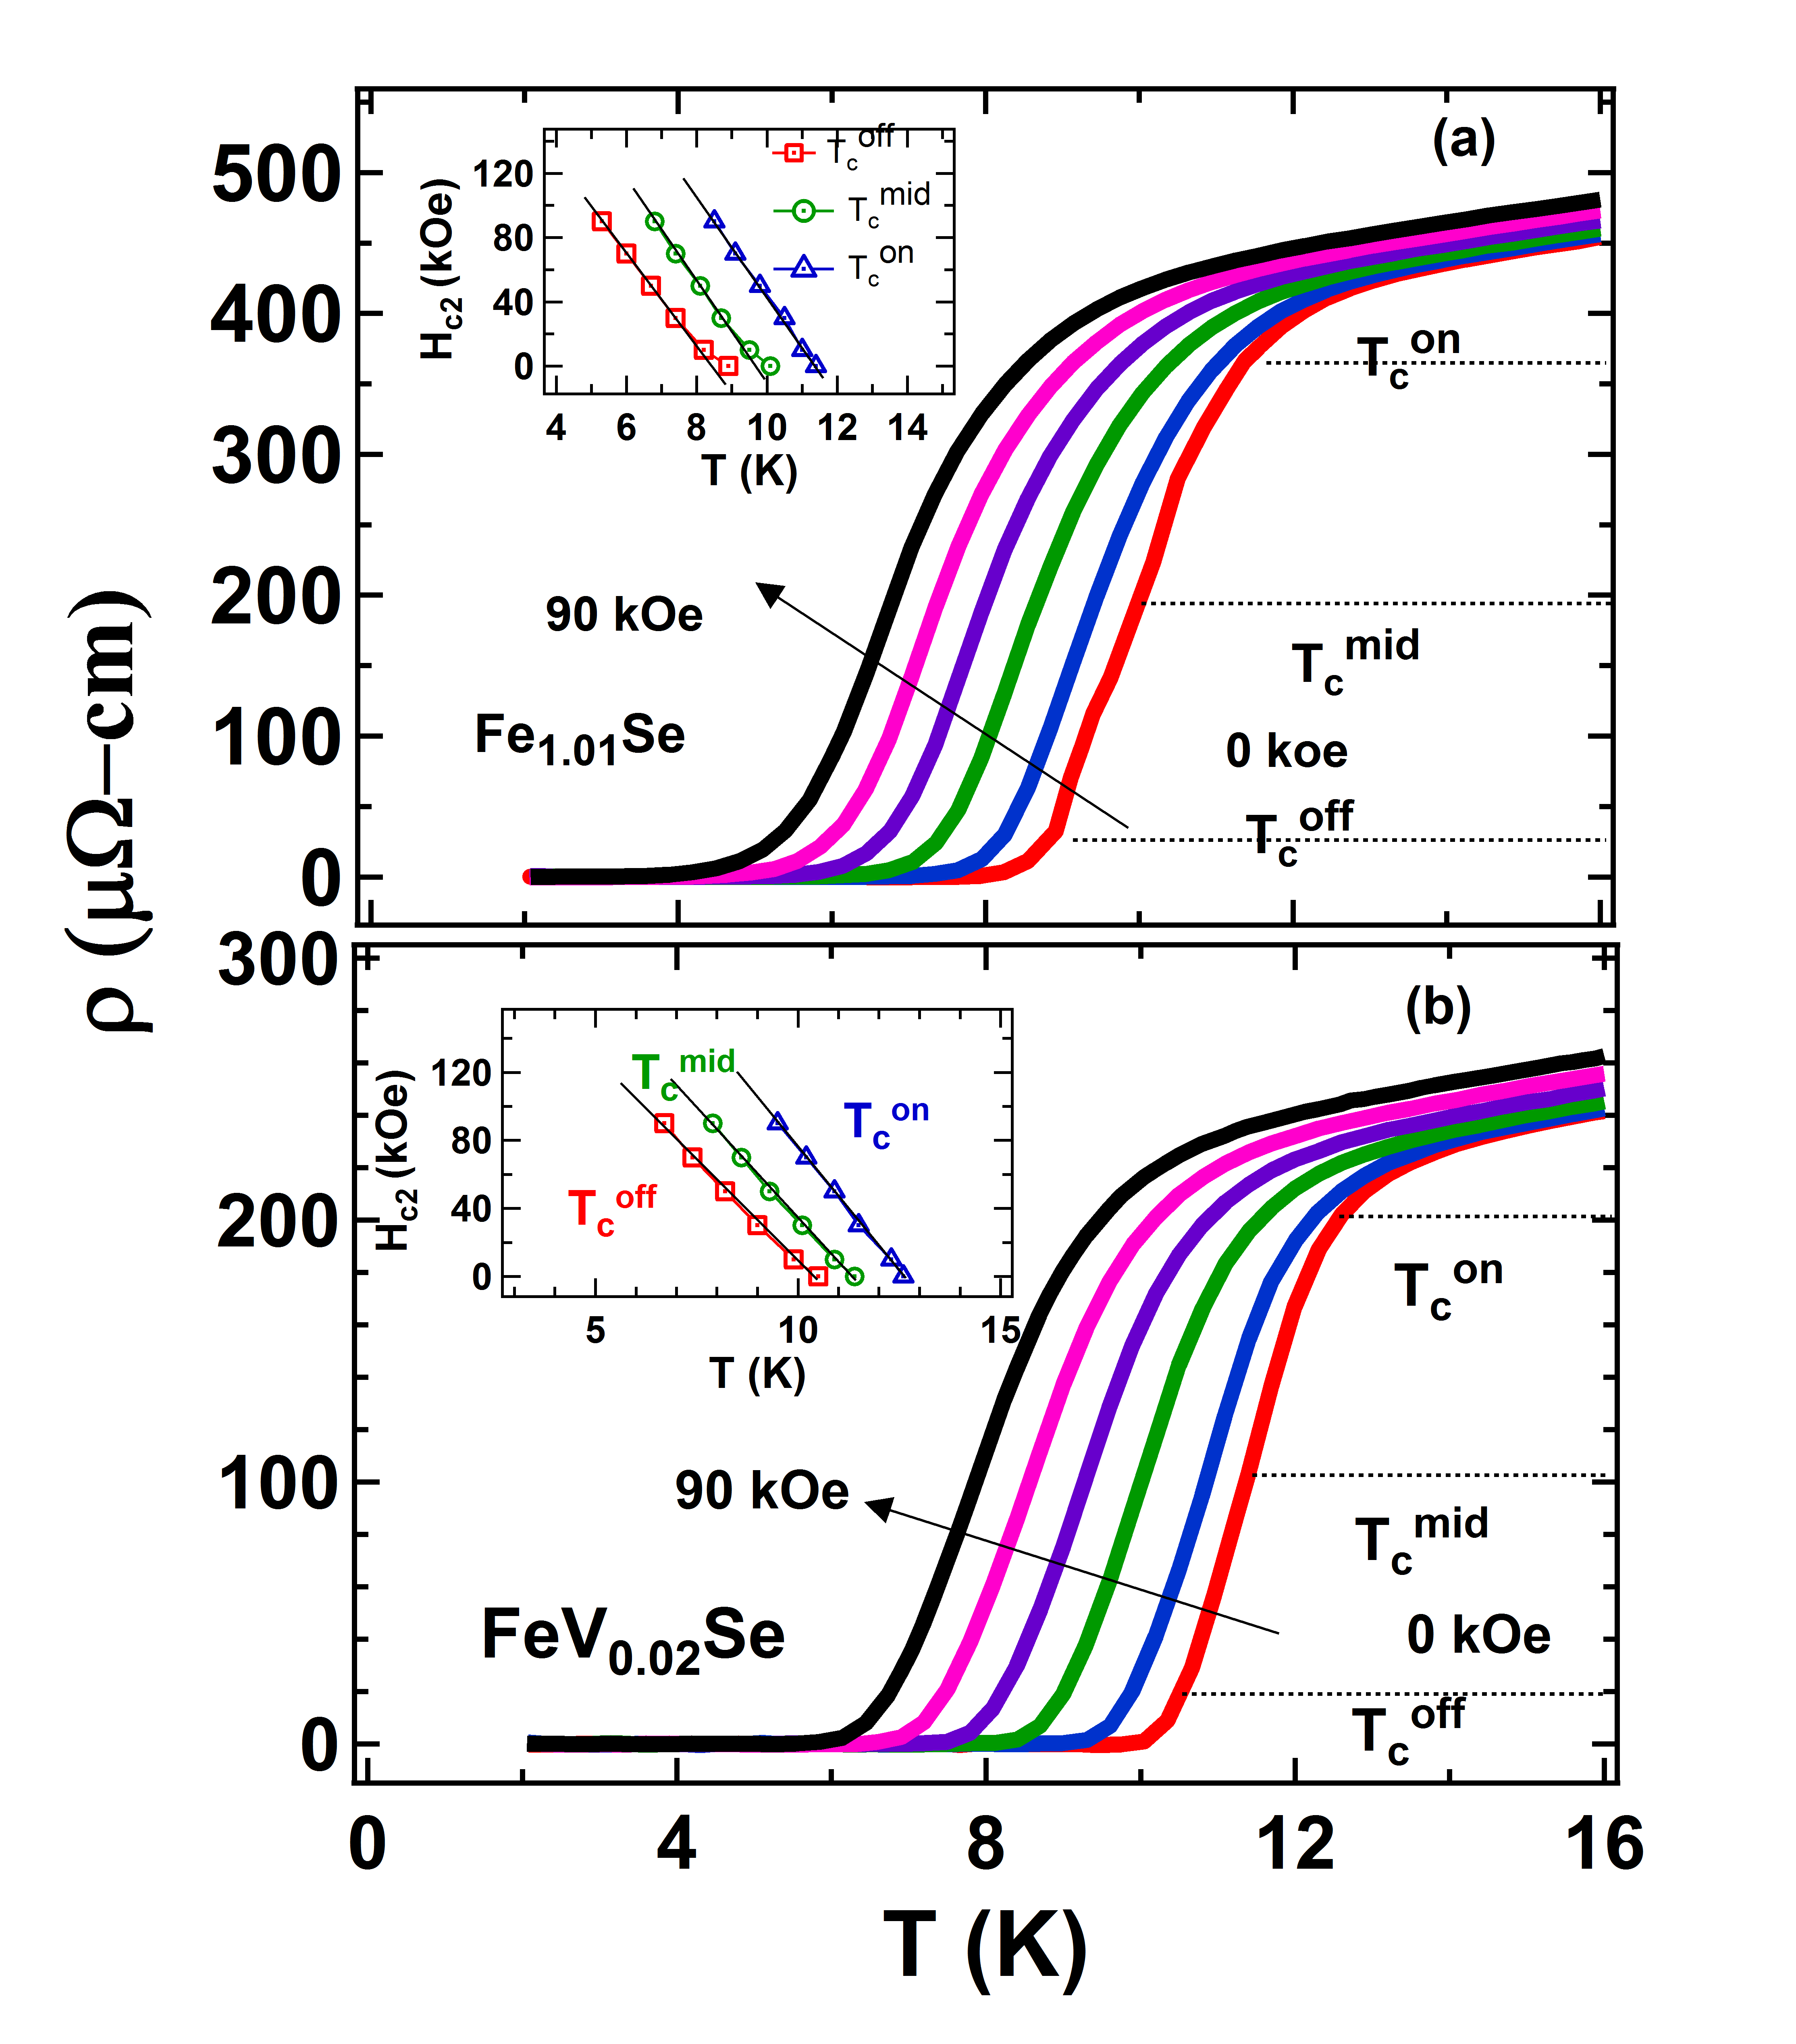
Fig. 4(a) and (b) show the temperature dependent curves at various fields ranges from 0 kOe to 90 kOe for Fe1.01Se and FeV0.02Se. We have marked three transition temperatures, , and , which are defined as 90%, 50% and 10%, respectively, of the normal state resistivity at K. The upper critical field () plots, determined at these three transition temperatures for both samples are shown in insets of Fig. 4(a) and (b). Similar, estimation of values for all the other compounds were also done and the values for each superconducting sample are listed in Table 3. The values were determined using the WHH formula Werthamer_30 , , where is the slope at the transition temperature and are given in table 3 (only for the mid transition temperature). The Mn substituted compound has the largest kOe) value whereas the other compounds have comparable kOe) values. These values are comparable to the Pauli paramagnetic limit Clogston_31 of , which are also listed in Table 3. This suggests that the spin-paramagnetic effect may be the dominant pair-breaking mechanism in FeSe samples as reported for ’Fe-11’ superconductors Mizuguapl_9 ; Lei2_32 ; Song_29 ; Chen ; Khim . The superconducting coherence lengths ((0)) were estimated using the Ginzburg-Landau formula (0) = , which are listed in Table 3. The values for these substituted compounds are larger than the Te- Lei2_32 and S-substituted compounds Mizuguchi1pl_33 .
| Compound | (K) | (kOe) | (0) (nm) | (kOe) | (Oe) | RRR | ||||
| Fe1.01Se | 11.4 | 10.1 | 8.9 | 8.9 | 9.0 | 210 | 3.96 | 185 | 9.5 | 4.1 |
| FeMn0.04Se | 11.2 | 10.1 | 9.2 | 9.8 | 10.0 | 236 | 3.73 | 185 | 10 | 3.9 |
| FeCr0.02Se | 13.2 | 12.0 | 11.0 | 10.9 | 11.0 | 222 | 3.98 | 220 | 24 | 8.1 |
| FeV0.02Se | 12.6 | 11.4 | 10.8 | 11.2 | 11.2 | 210 | 3.96 | 210 | 70 | 4.6 |
III.4 Thermal transport properties
Figure 5 shows the temperature dependence of thermal conductivity ( measured from 2 K to 300 K at zero field for FeTxSe ( = Ni, Mn and V) samples.
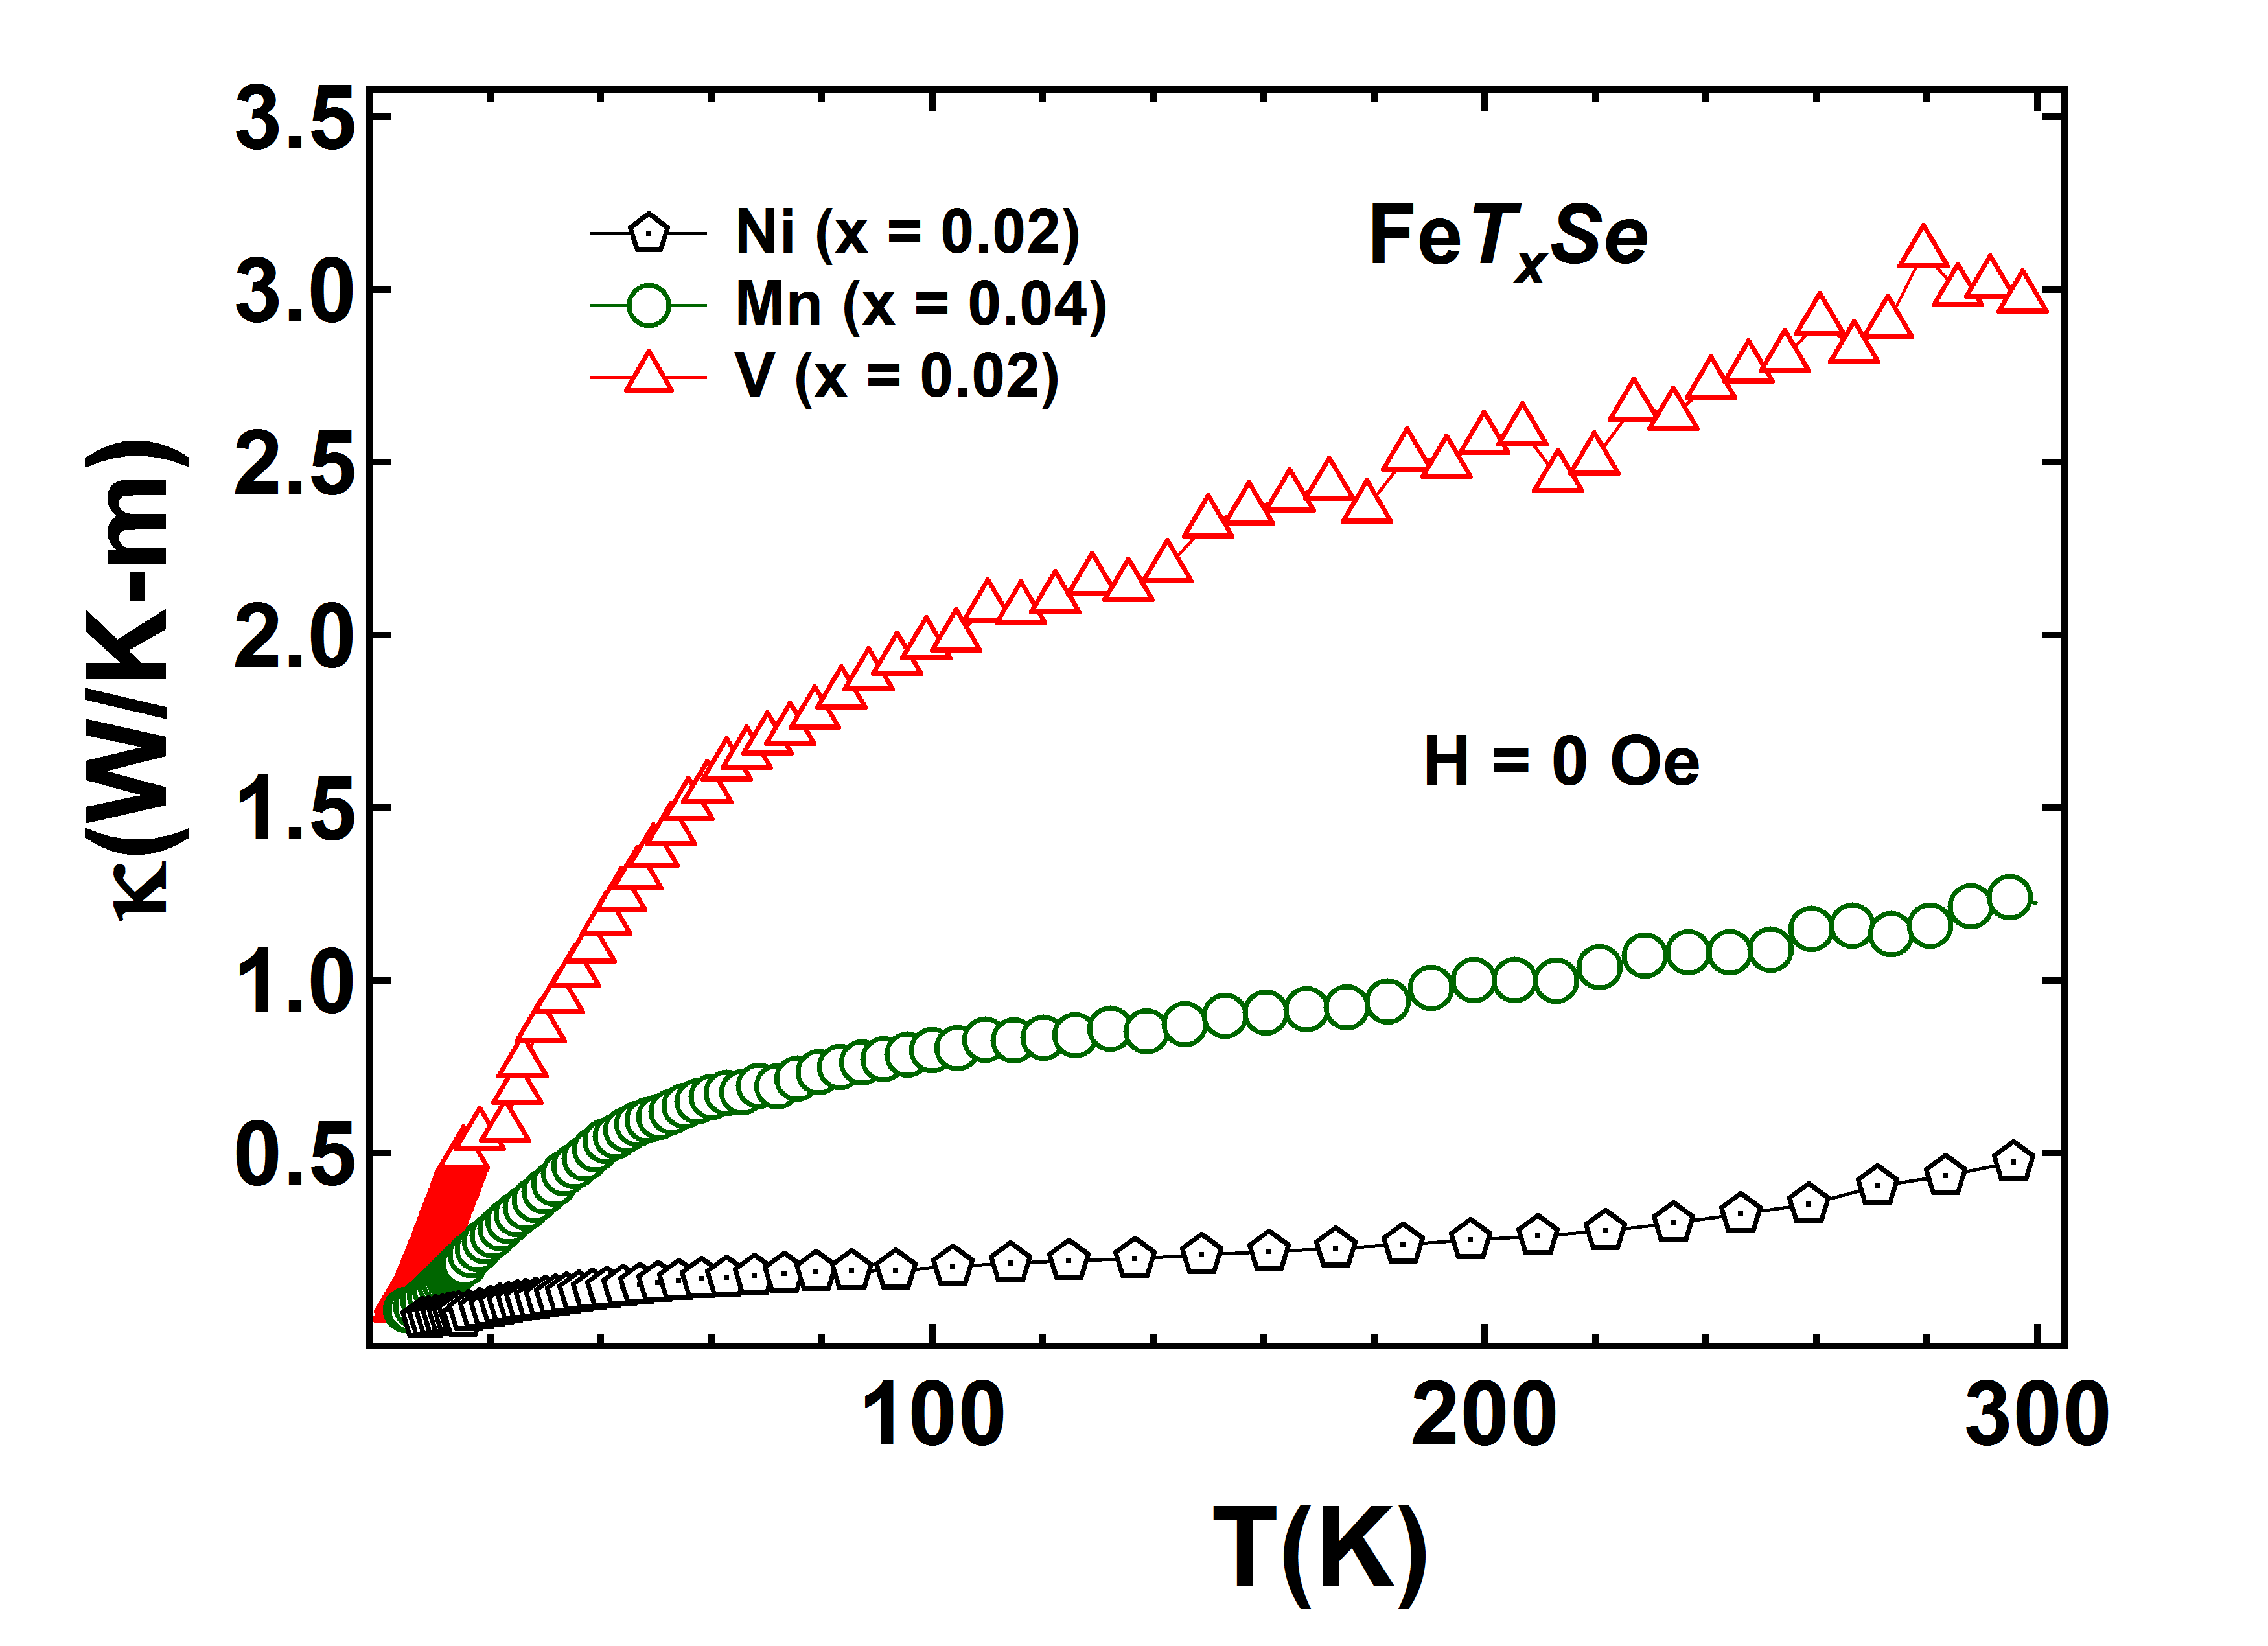
The is the highest for FeV0.02Se sample, which is almost six times larger than that of the lowest in FeNi0.02Se, however all samples have comparatively lower compared to single crystal FeCr0.02Se Anilprb_21 . If we correlate to the number of charge carriers, then the higher value of implies larger number of charge carriers as the lattice is the same for all these compounds. This indicates a correlation may be exist qualitatively between the numbers of charge carriers and in the enhancement of , if we compare the (Table 1) of these compounds which varies as . On this basis charge carriers may be also have a role in the enhancement of in Fe-11 compounds, as in the case of iron pnictide superconductors Yang_34 ; Wen_35 .
In Fig. 6 (a), we have plotted the typical thermopower () behavior as a function of temperature for the FeSe ( = Ni, Mn and V) samples. The thermopower of all the compounds show an ’S’ like curvature, typical of the Fe superconductors where decreases with decreasing temperature and goes through a minimum between 70 K–180 K. It is reported that the thermopower of Fe1.01Se changes its sign from positive to negative at K and again from negative to positive at 91 K Song_29 . Similar behaviour is seen only for the Fe1.01Se sample in our studies. We have observed a similar cross-over of in our earlier studies where Cr was substituted as excess at the Fe site Anilprb_21 . The changing of sign at K has been associated with a structural transition in Fe1.01Se. Since the sign of thermopower () indicates the type of dominant charge carriers, one can argue that the compounds, Fe1.01Se and FeCr0.02Se Anilprb_21 , have both type of charge carriers where as the compounds, FeV0.02Se, FeMn0.02Se and FeNi0.02Se, have only holes as major charge carriers since the sign of is positive throughout the temperature range in these compounds.
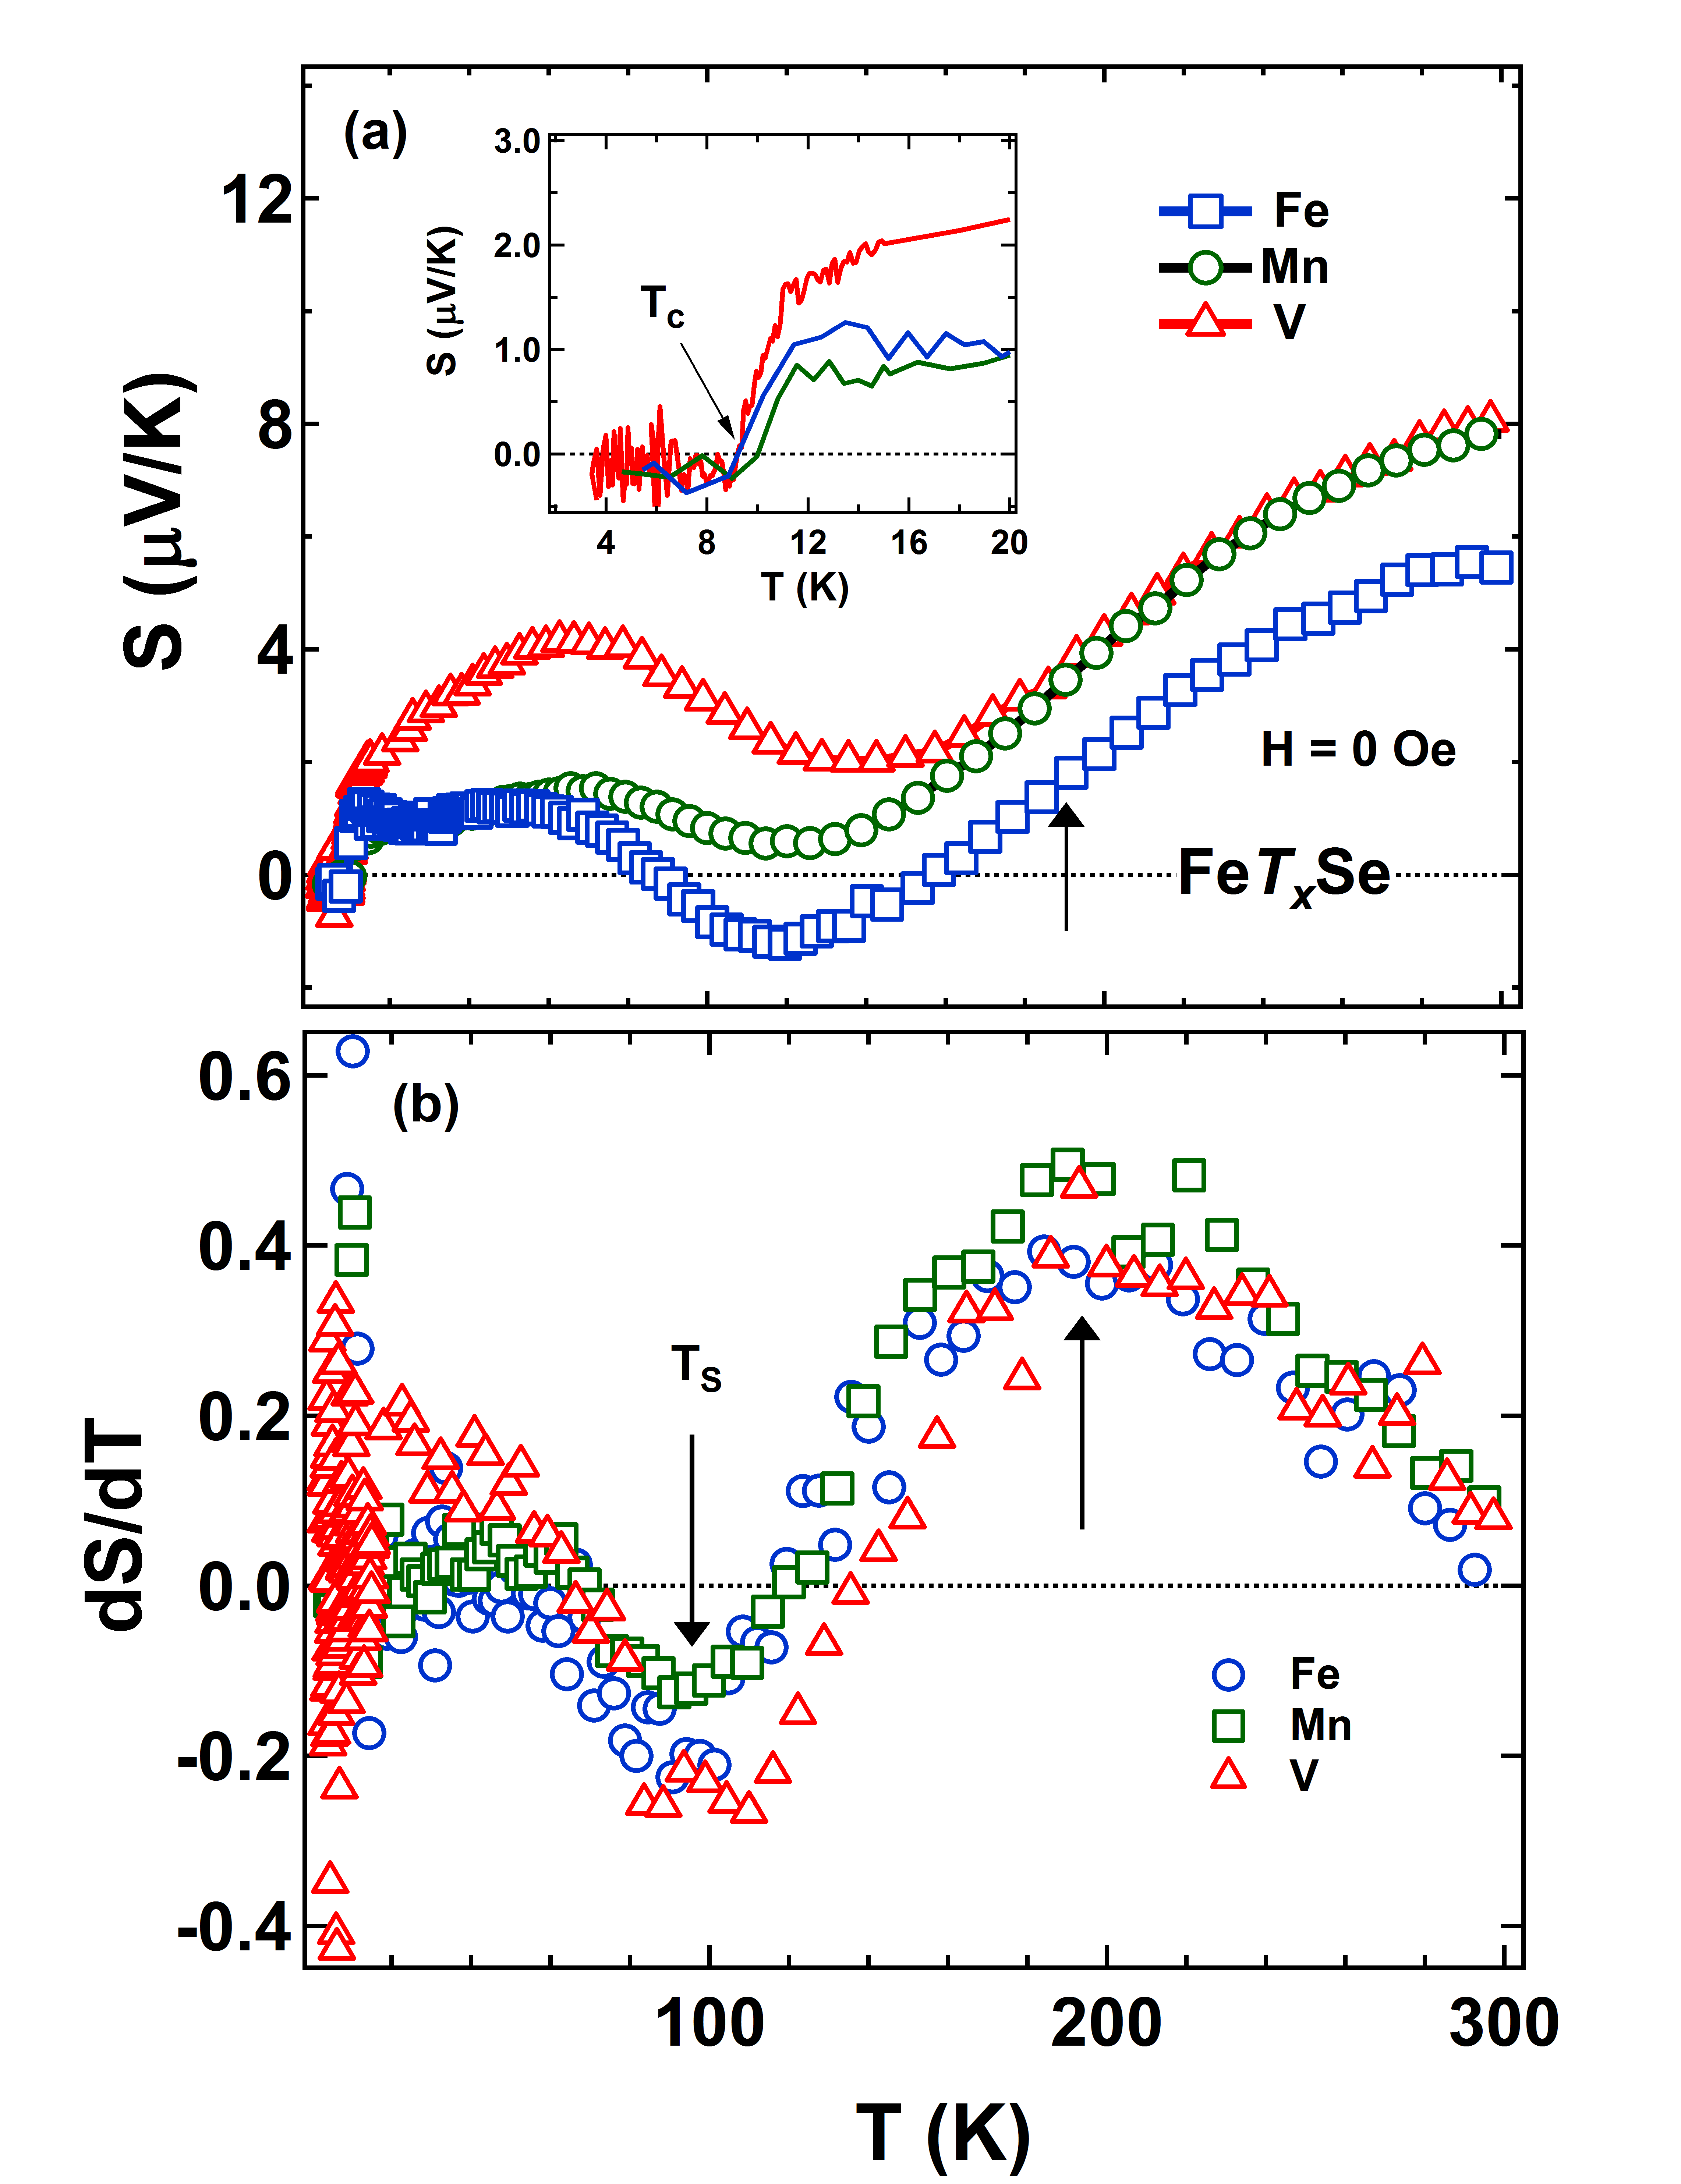
Inset of Fig. 6 (a) shows an enlarged view of from 2 K to 20 K. In the superconducting state, the Seebeck coefficient becomes zero since the charge carriers have zero entropy as they are involved in the Cooper pair formation. As the temperature increases, the thermal energy overcomes the binding energy of the Cooper pairs and the superconductor gradually enters into the normal state as shown in the inset of Fig. 6 (a). Figure 6 (b) shows the derivative plots of to highlight the similarity between compounds. Even though the Ni, V and Mn-substituted samples did not show the cross-over to the negative values, their overall behavior is the same, as evident from the derivative plots. The modulation in derivative of curves can be connect through previous studies on FeSe compounds. As it is seen in theoretical Subedi ; Johnston as well as experimental Xia studies, Fe-superconductors are semi-metal in nature and both types of charge carriers present at Fermi surface. Experimentally, we have also observed the presence of both types charge carriers in single crystals FeCr0.02Se Anilprb_21 . The slops change at higher temperature for these FeSe samples occur near same temperature 200 K) where types of charge carriers change in Hall measurement for single crystal of FeCr0.02Se Anilprb_21 . However, slop change at lower temperature 93 K is associated with structural transition (tetragonal to orthorhombic) as previous reported in many references Hsu_4 ; Margadona_10 ; McQueen_24 ; Pomjakushina .
IV Discussion
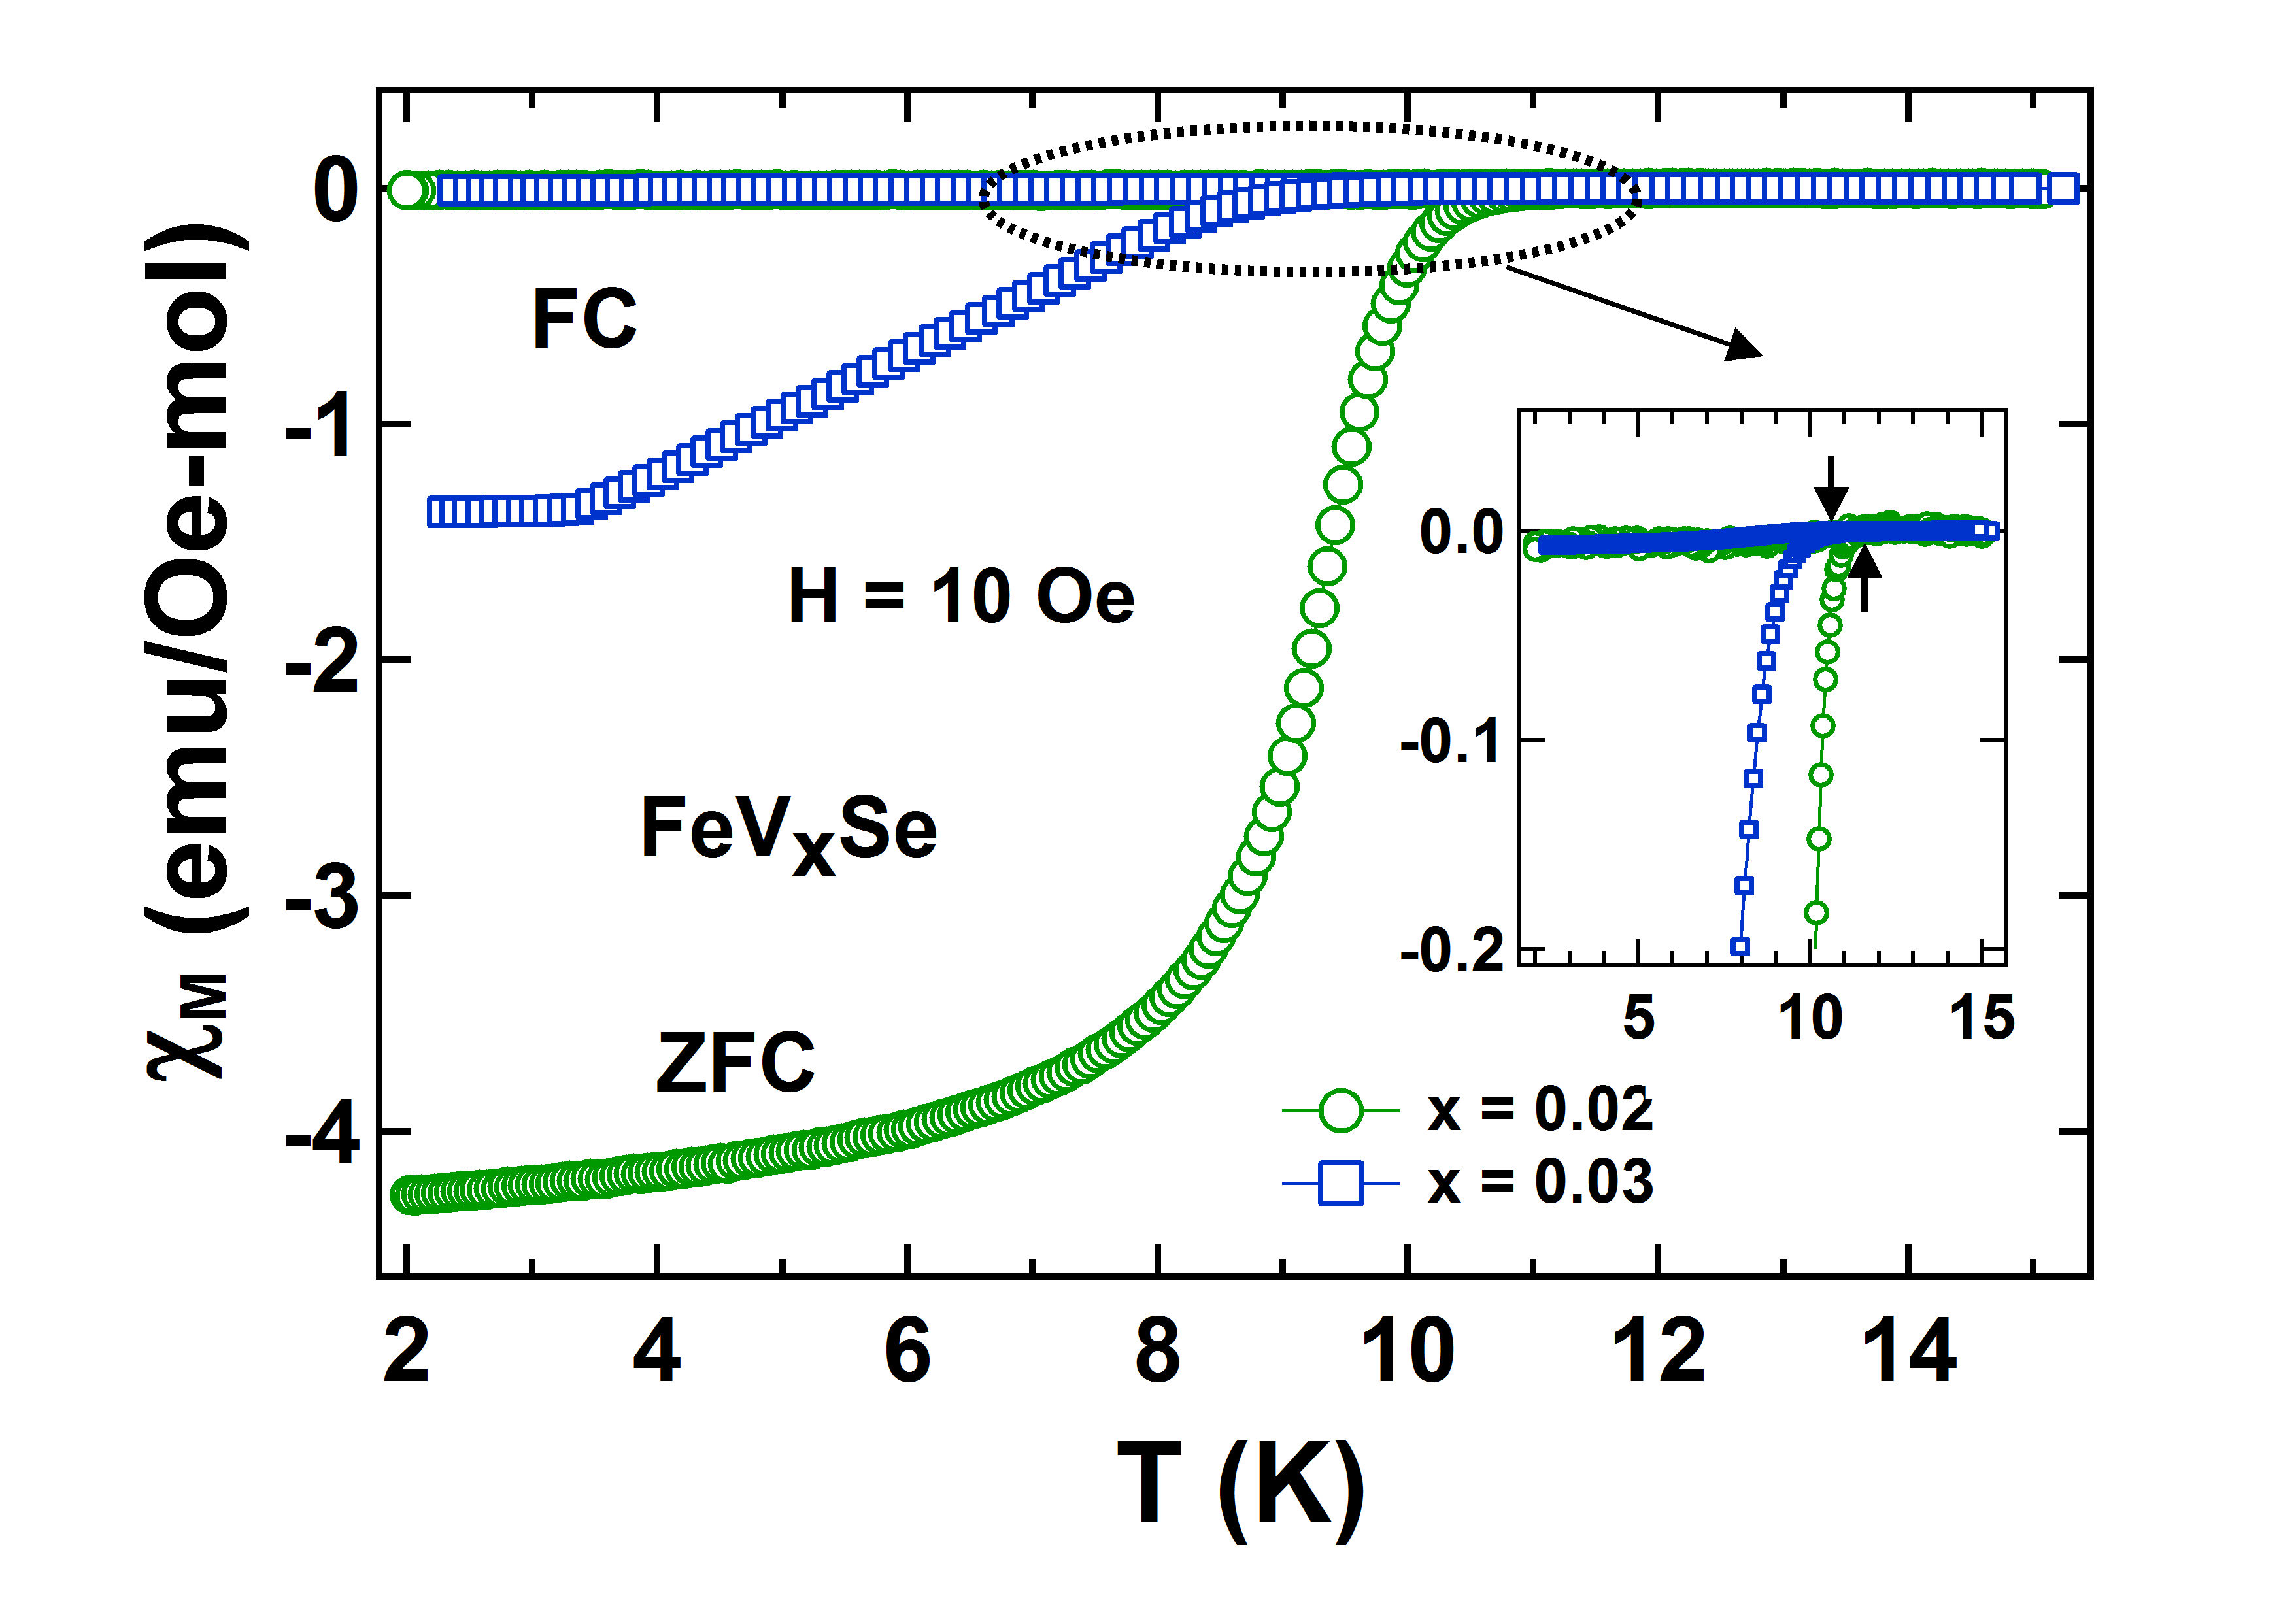
The quality of FeSe samples are always a concern and a subject of discussion since a variety of closely related phases like Fe3O4, unreacted Fe, hexagonal FeSe, Fe7Se8, etc., can form a part of the prepared samples. Many groups attempted to synthesis the pure tetragonal phase, but considerable amount of other impurities could not be avoided Zhang(22SST)_26 ; Braithwaite_36 . As per the phase diagram studied by McQueen et al. McQueen_24 , the formation of the hexagonal (non superconducting) phase occurs at temperatures below 200. In order to minimize this phase, we have quenched our samples from higher temperatures (360), but the percentage of hexagonal phase is found to increase. The interesting fact is that the impurity of hexagonal phase does not affect the of the parent compound adversely; its presence is found to enhance the in TM-substituted compounds (except Ni and Co). It is also found that the optimal substitution for the maximum in each TM substituted compound is different (Fe – 1 wt%, Mn – 4 wt%, Cr – 2 wt%, V – 2 wt%, Ti – 1 wt%). Further substitution of TM beyond the optimal value is found to increase the hexagonal phase and decrease the tetragonal phase. The value of wt% substitution for the complete conversion into the hexagonal phase is different for different substitutions (Mn, Cr 7 wt%, V 5 wt%, Ti 2 wt%). It looks as if the higher the ionic radius of the substituted TM metal, the less wt% of the dopant is required for the conversion into the complete hexagonal phase. It is also found that the as well as the diamagnetic shielding fraction decreases with increasing hexagonal phase. As an example, we show in Fig. 7, the magnetic susceptibility data for the V-substituted samples (prepared by LN2 quenched method). The diamagnetic shielding fraction drastically gets decreased along with a decrease in as the V-substitution increases beyond 2 wt%. For the V substitution beyond 5 wt% or more, the XRD patterns indicate the presence only the hexagonal phase (see Table 1).
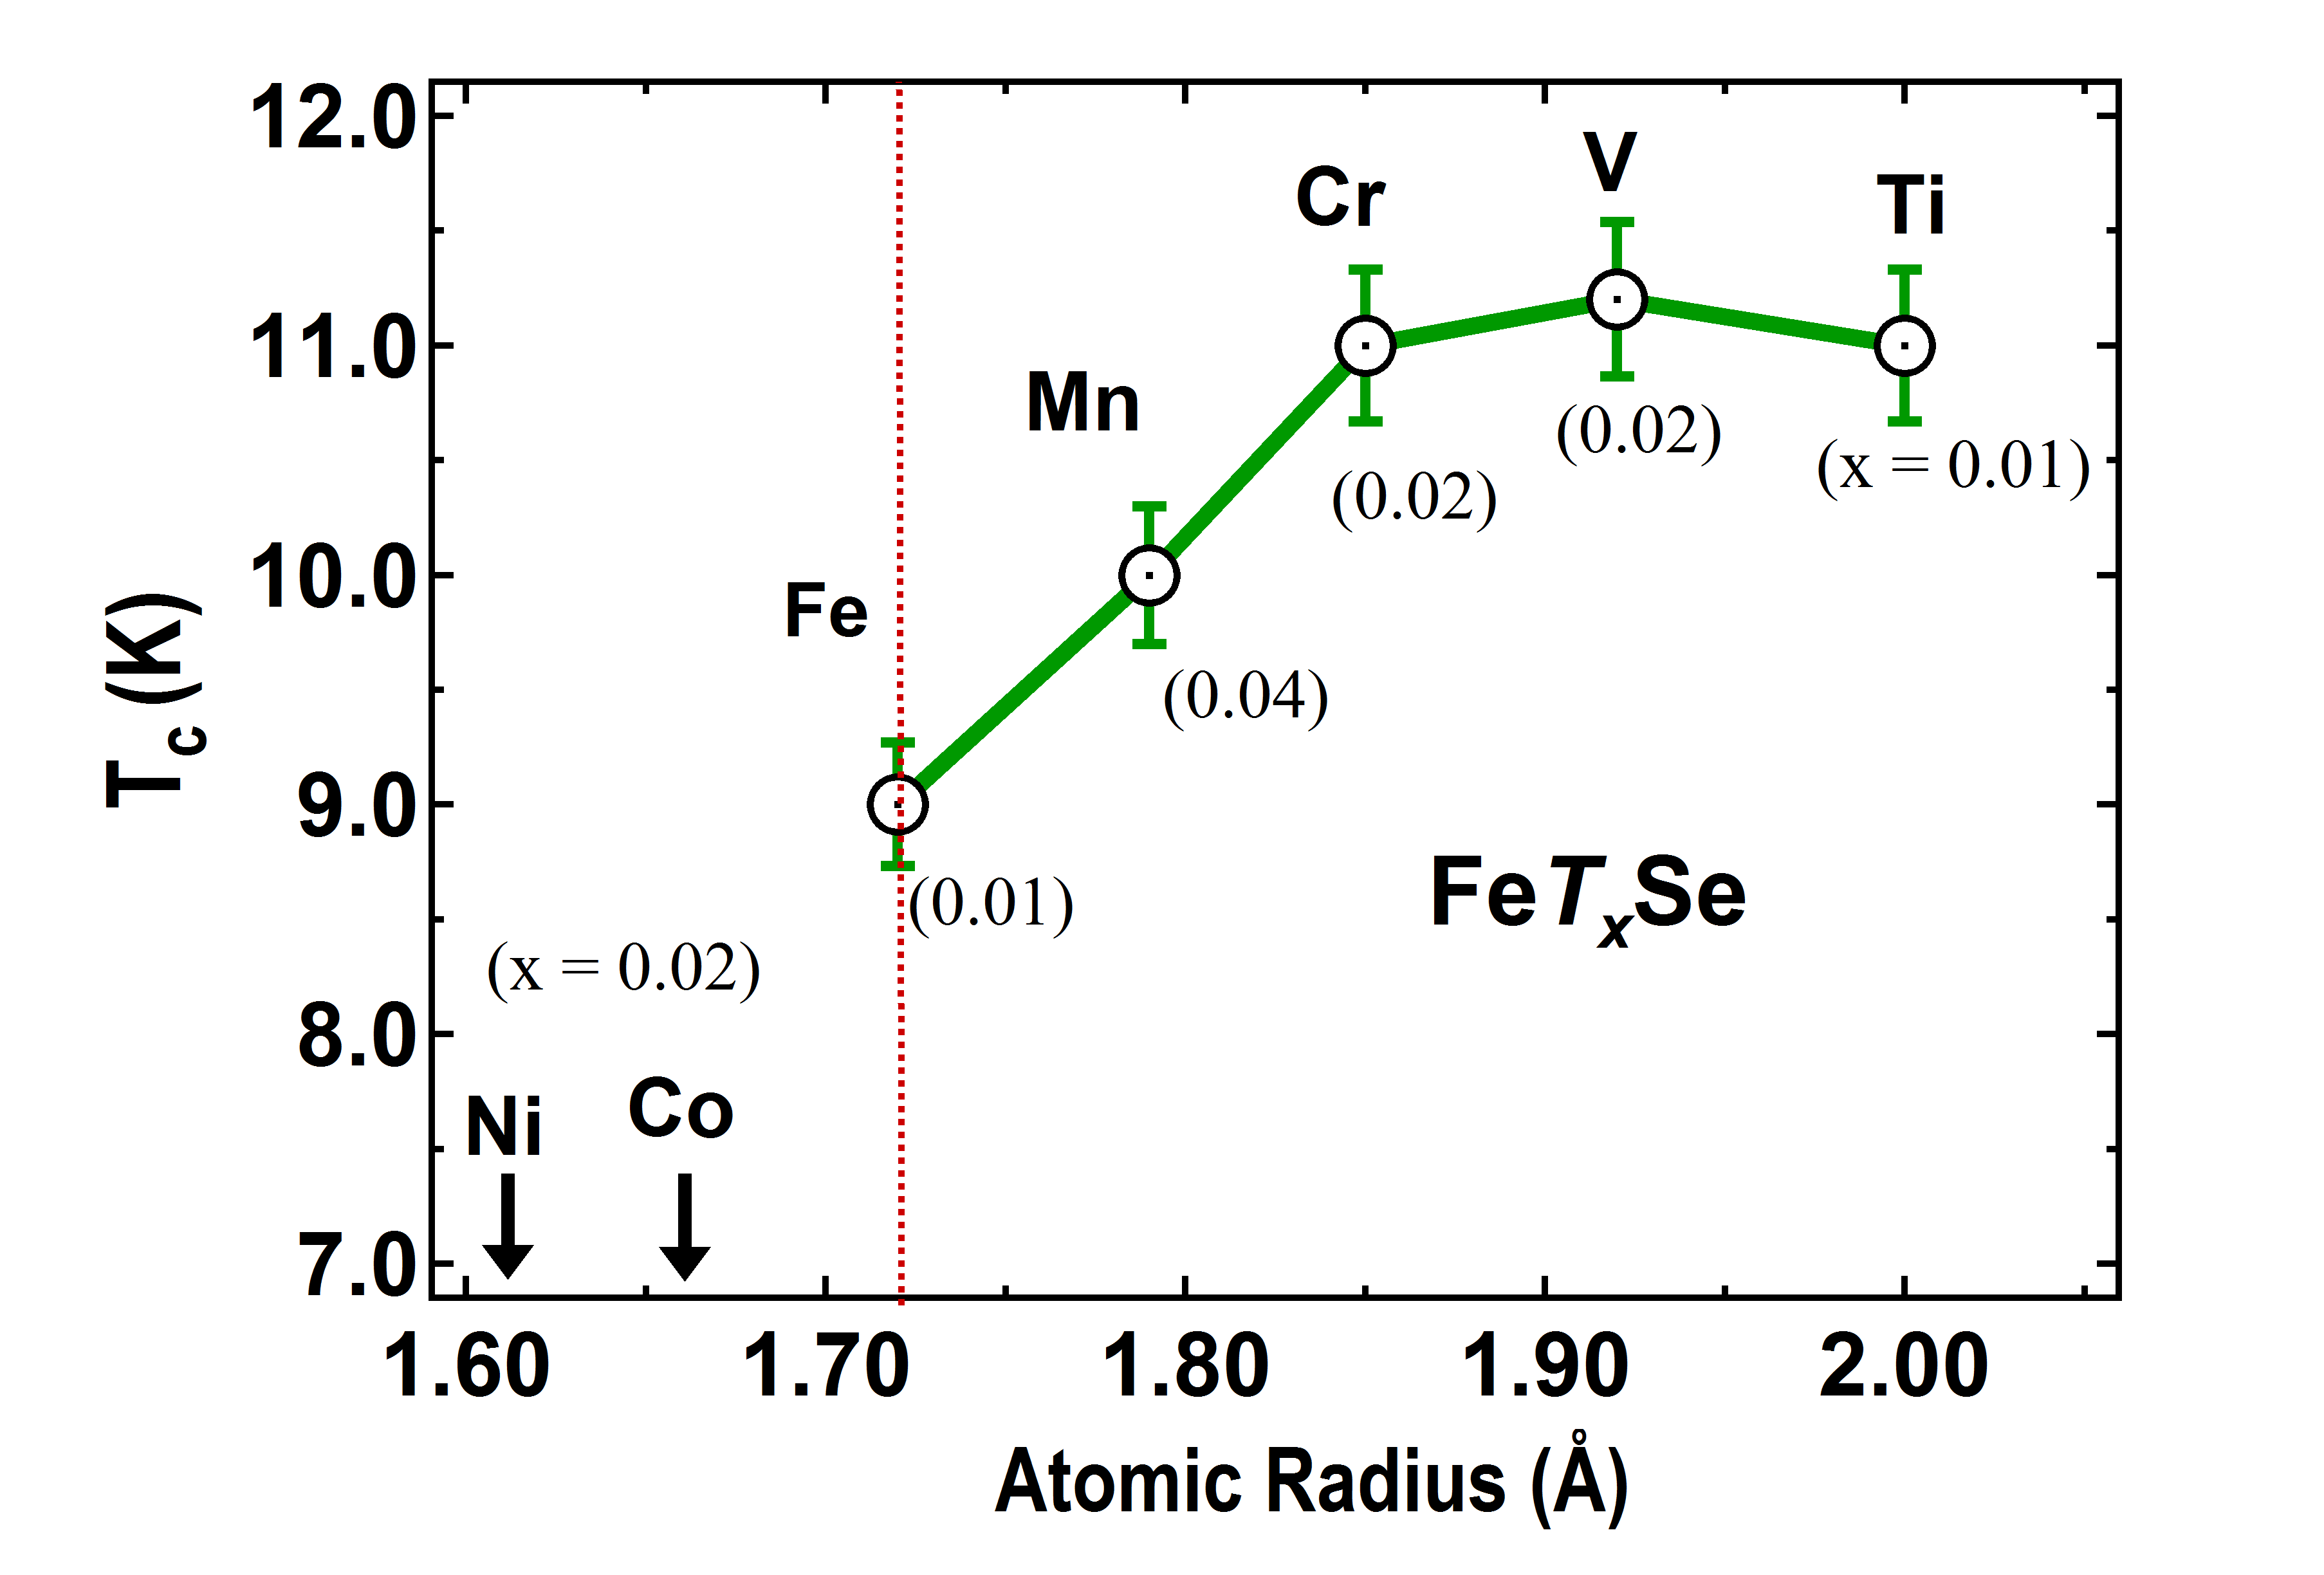
The variation of with atomic radius of the excess substituted transition metal in Fe1+xSe is shown in Fig. 8. There is a clear indication that the of the compound gets suppressed or destroyed when the transition metal with atomic radius less than that of Fe is substituted as excess, where as the gets enhanced when TM atoms with radius higher than the Fe atom are substituted. It is reported that the application of external pressure increases the in FeSe compounds Medvedev_11 ; Mizuguchi_16 . If we correlate the increase in in our substituted compounds, then we can assign a chemical pressure which will be equivalent to an external pressure of GPa Mizuguchi_16 . If we compare the maximum obtained for various TM metal substitutions (Fig. 8), we can bring in a correlation between the enhancement of and the magnetic moment of the TM ion. is found to increase as the moment decreases. The absence of superconductivity in Co and Ni substituted compounds may be associated with the dependence of ionic radius of the TM on the . Since they have ionic radius less than that of the Fe, it is possible that they do not exert enough chemical pressure for the appearance of superconductivity. Thus we can conclude that all the three effects, the amount of hexagonal phase (chemical pressure), ionic radius and magnetic moment of the substituted TM, may play a role in the enhancement/suppression of and hence the superconducting properties.
V Conclusions
We have studied the effect of nominal substitution of the transition metal ( = Ti, V, Cr, Mn, Fe, Co and Ni) in place of excess Fe in Fe1+xSe superconductor. All the FeSe samples were synthesized successfully via a single step solid state reaction method, followed by quenching in LN2 from 360 ∘C. All the presented transition metal (TM) substituted samples have tetragonal and hexagonal phases. The superconducting transition temperature is enhanced by 10% to 30% when TMs with higher ionic radius compared to that of the Fe is substituted. However, the substitution of the lower ionic radius TM suppresses the . The optimal concentration for the highest is found to be different for different TM substitutions. Both type of charge carriers were found to be present in the Fe- and Cr-excess samples, however, other TM substituted samples show positive sign of Seebeck coefficient throughout temperature range that indicates holes as majority charge carriers. In brief, we can conclude that the amount of hexagonal phase (chemical pressure), ionic radius as well as the magnetic moment of the substituted TM may play a role in the enhancement of and hence the superconducting properties in the Fe-11 compound.
Acknowledgements.
CVT would like to acknowledge the Department of Science and Technology for partial support through the project IR/S2/PU-10/2006. AKY would like to thank CSIR, India for SRF grant. ADT acknowledges the Indian Institute of Technology, Bombay for partial financial support during part of this work and the Indian Institute of Technology, Patna for seed grant.References
- (1) Y. Kamihara, T. Watanabe, M. Hirano, and H. Hosono, J. Am. Chem. Soc 130 (2008) 3296.
- (2) M. Rotter, M. Tegel, and D. Johrendt, Phys. Rev. Lett. 101 (2008)107006.
- (3) X. C. Wang, Q. Q. Liu, Y. X. Lv, W. B. Gao,X. L. Yang, R. C. Yu, F. Y. Li, and C. Q. Jin, Solid State Commun. 148 (2008) 538.
- (4) F. C. Hsu et al. Proc. Natl Acad. Sci. 105 (2008) 14262.
- (5) H. Ogino, Y. Matsumara, Y. Katsura, K. Ushiyama, S. Horii, K. Kishio, and J. I. Shimoyama, Supercond. Sci. Technol. 22 (2009) 075008.
- (6) W. Bao, Q. Huang, G. F. Chen, M. A. Green, D. M. Wang, J. B. He, X. Q. Wang, and Y. Qiu, Chin. Phys. Lett. 28 (2011a) 086104.
- (7) G. R. Stewart, Rev. Mod. Phys. 83 (2011) 1589.
- (8) C. Wang et al., Europhys. Lett. 83 (2008 ) 67006.
- (9) Y. Mizuguchi et al., Appl. Phys. Lett. 93 (2008) 152505.
- (10) S. Margadonna, Y. Takabayashi, Y. Ohishi, Y. Mizuguchi, Y. Takano, T. Kagayama, T. Nakagawa, M. Takata and K. Prassides, Phys. Rev. B 80 (2009) 064506.
- (11) S. Medvedev et al., Nature Mater. 8 ( 2009) 630.
- (12) M. H. Fang, H. M. Pham, B. Qian, T. J. Liu, E. K. Vehstedt, Y. Liu, L. Spinu, and Z. Q. Mao, Phys. Rev. B 78 ( 2008) 224503.
- (13) K. W. Yeh, et al., Europhys. Lett. 84 (2008) 37002.
- (14) B. C. Sales, A. S. Sefat, M. A. McGuire, R. Y. Jin and D. Mandrus, Phys. Rev. B 79 ( 2009) 094521.
- (15) T. Taen, Y. Tsuchiya, Y. Nakajima and T. Tamegai, Phys. Rev. B 80 (2009) 092502.
- (16) Y. Mizuguchi, F. Tomioka, S. Tsuda, T. Yamaguchi and Y. Takano, J. Phys. Soc. Japan 78 (2009) 074712.
- (17) M. K. Wu, et al., Physica C 469 (2009) 340.
- (18) J. Guo, S. Jin, G. Wang, S. Wang, K. Zhu, T. Zhou, M. He, and X. Chen, Phys. Rev. B 82 (2010) 180520.
- (19) A. F. Wang et al., Phys. Rev. B 83 (2011) 060512.
- (20) S. M. Kazakov, et al., Chem. Mater. 23 (2011) 4311.
- (21) A. K. Yadav, A. D. Thakur and C. V. Tomy, Phys. Rev. B 87 (2013) 174524.
- (22) A. K. Yadav, A. D. Thakur, C. V. Tomy, Solid State Commun. 151 (2011) 557.
- (23) H. Okamoto, J. Phase Equilib. 12 (1991) 383.
- (24) T. M. McQueen et al., Phys. Rev. B 79 (2009) 014522.
- (25) S. B. Zhang, H. C. Lei, X. D. Zhu, G. Li, B. S. Wang, L. J. Li, X. B. Zhu, W. H. Song, Z. R. Yang, Y. P. Sun, Physica C 469 (2009) 1958.
- (26) S. B. Zhang, et al., Supercond. Sci. Technol. 22 (2009) 015020.
- (27) S. B. Zhang et al., Supercond. Sci. Technol. 22 (2009) 075016.
- (28) R. H. Hein, Phys. Rev. B 33 (1986) 7539.
- (29) Y. J. Song, J. B. Hong, B. H. Min, K. J. Lee, M. H. Jung, J. S. Rhyee, Y. S. Kwon, J. Korean, Phys. Soc. 59 (2011) 312.
- (30) N. R. Werthamer, E. Helfand and P. C. Hohenberg, Phys. Rev. 147 (1966) 295.
- (31) A. M. Clogston, Phys. Rev. Lett. 9 (1962) 266.
- (32) G. F. Chen, Z. G.Chen, J. Dong, W. Z. Hu, G. Li, X. D. Zhang, P. Zheng, J. L. Luo and N. L. Wang, Phys. Rev. B 79 (2009) 140509.
- (33) S. Khim, J. W. Kim, E. S. Choi, Y. Bang, M. Nohara, H. Takagi, K. H. Kim, Phys. Rev. B. 81 (2010) 184511.
- (34) H. C. Lei, R. W. Hu, E. S. Choi, J. B. Warren and C. Petrovic, Phys. Rev. B 81 (2010) 184522.
- (35) Y. Mizuguchi, F. Tomioka, S. Tsuda, T. Yamaguchi, Y. Takano, Appl. Phys. Lett. 94 (2009) 012503.
- (36) X. Zhu, H. Yang, L. Fang, G. Mu, H. H. Wen, Supercond. Sci. Technol. 21 (2008) 105001.
- (37) H. H. Wen, G. Mu, L. Fang, H. Yang, X. Y. Zhu, Europhys. Lett. 82 (2008) 17009.
- (38) A. Subedi, L. Zhang, D. J. Singh, M. H. Du, Phys. Rev. B 78 (2008) 134514.
- (39) D. C. Johnston, Advances in Physics 6 (2010) 803.
- (40) Y. Xia, D. Qian, L. Wray, D. Hsieh, G. F. Chen, J. L. Luo, N. L. Wang, M. Z. Hasan, Phys. Rev. Lett.103 (2009) 037002.
- (41) E. Pomjakushina, K. Conder, V. Pomjakushin, M. Bendele, R. Khasanov, Phys. Rev. B 80 (2009) 024517.
- (42) D. Braithwaite, B. Salce, G. Lapertot, F. Bourdarot, C. Marin, D. Aoki, M. Hanfland, J. Phys.: Condens. Matter 21 (2009) 232202.