22institutetext: National Research Council, Herzberg Programs in Astronomy & Astrophysics, Dominion Radio Astrophysical Observatory, P.O. Box 248, Penticton BC, V2A 6J9, Canada
33institutetext: Department of Physics & Astronomy, Brandon University, 270-18th Street, Brandon, MB R7A 6A9, Canada
The Search for Faint Radio Supernova Remnants in the Outer Galaxy: Five New Discoveries
Abstract
Context. High resolution and sensitivity large-scale radio surveys of the Milky Way are critical in the discovery of very low surface brightness supernova remnants (SNRs), which may constitute a significant portion of the Galactic SNRs still unaccounted for (ostensibly the “Missing SNR problem”).
Aims. The overall purpose here is to present the results of a systematic, deep data-mining of the Canadian Galactic Plane Survey (CGPS) for faint, extended non-thermal and polarized emission structures that are likely the shells of uncatalogued supernova remnants.
Methods. We examine 55 degree mosaics from the entire 1420 MHz continuum and polarization dataset of the CGPS after removing unresolved “point” sources and subsequently smoothing them. Newly revealed extended emission objects are compared to similarly-prepared CGPS 408 MHz continuum mosaics, as well as to source-removed mosaics from various existing radio surveys at 4.8 GHz, 2.7 GHz, and 327 MHz, to identify candidates with non-thermal emission characteristics. We integrate flux densities at each frequency to characterise the radio spectra behaviour of these candidates. We further look for mid- and high-frequency (1420 MHz, 4.8 GHz) ordered polarized emission from the limb brightened “shell”-like continuum features that the candidates sport. Finally, we use IR and optical maps to provide additional backing evidence.
Results. Here we present evidence that five new objects, identified as filling all or some of the criteria above, are strong candidates for new SNRs. These five are designated by their Galactic coordinate names G108.5+11.0, G128.5+2.6, G149.5+3.2, G150.8+3.8, and G160.11.1. The radio spectrum of each is presented, highlighting their steepness which is characteristic of synchrotron radiation. CGPS 1420 MHz polarization data and 4.8 GHz polarization data also provide evidence that these objects are newly discovered SNRs. These discoveries represent a significant increase in the number of SNRs known in the outer Galaxy second quadrant of longitude (90 180), and suggests that deep mining of other current and future Milky Way surveys will find even more objects and help to reconcile the difference between expected numbers of Galactic SNRs and the smaller number of currently known SNRs.
Key Words.:
supernova remnants, interstellar medium, outer Galaxy, synchrotron radiation1 Introduction
The presence of supernovae in the Milky Way Galaxy represents one of our most critical keys to understanding the evolution of our Galaxy’s interstellar medium (ISM). Supernovae are the most significant source of chemical enrichment in the ISM and the resulting high velocities of their remnants ensure far-reaching distribution of heavy elements. As such, supernova remnants (SNRs) are both the source of and the means by which metal-enriched material is distributed throughout the Galaxy. Shock waves from supernova explosions in the Galaxy produce hot ionized tunnels in the ISM, sweep up an ever-increasing collection of dust and gas, ionizing the gas and bending and warping the Galactic magnetic field in the process. Supernova shock waves compress gas clouds triggering star formation, and generate a vast amount of cosmic rays that play an important role in pressure balance in the Milky Way ISM. Padmanabhan (2001) estimates that more than half of the material in the Galaxy has been processed by supernova remnants.
Therefore, to better our understanding of the ISM and our Galaxy, we require not only a detailed study of the individual physical properties of SNRs but also an accurate count of their numbers. If we assume a mean lifetime of radio shell-type SNRs of yrs (Frail et al., 1994) and a supernova rate of one per 30-50 years in spiral galaxies like the Milky Way (Tammann et al., 1994), the Galactic ISM is expected to host one to two-thousand radio supernova remnants at any given time. Models of the angular distribution of Galactic H ii regions and SNRs also predict about 1000 Galactic radio SNRs (Li et al., 1991). However, in 2009 only 274 confirmed radio SNRs were catalogued in the Milky Way (Green, 2009), with a few more added since (e.g. Kothes et al., 2014; Foster et al., 2013; Roy & Pal, 2013; Gao et al., 2011, see catalogue of Ferrand & Safi-Harb (2012) for a somewhat more up-to-date list). But there are still many “missing” SNRs, likely due (in part) to difficulties in identifying low surface brightness objects that may be confused by the emission of other Galactic sources and compact background objects, or due to the appearance of very distant SNRs as non-conspiuous unresolved “point”-like sources in current radio surveys of the Milky Way.
The Canadian Galactic Plane Survey (CGPS) 1420 MHz continuum data has an unprecedented spatial dynamic range (Taylor et al., 2003), allowing for detection of never-before-seen faint emission. Since 2001, the CGPS dataset has spawned the discovery of 10 new SNRs in the first, second, and third quadrants of the Milky Way: G85.40.7 and G85.90.6 (Kothes et al., 2001); G107.51.5 (Kothes, 2003); G96.02.0 and G113.00.2 (Kothes et al., 2005); G108.20.6 (Tian et al., 2007); G151.22.9 (Kerton et al., 2007); G152.42.1 and G190.92.2 (Foster et al., 2013), and very recently G141.25.0 (a pulsar wind nebula, Kothes et al., 2014). This paper presents evidence for the addition of five new faint SNRs to this growing list, and outlines their spectral and continuum properties.
2 Survey Data
2.1 21 cm & 74 cm
Both the 21 cm Stokes I,Q,U continuum and 74 cm Stokes I continuum data were obtained from the Canadian Galactic Plane Survey (CGPS) dataset, which is described in detail by Taylor et al. (2003). The release of the CGPS 21 cm linear polarization data is described by Landecker et al. (2010). The data were obtained with the Dominion Radio Astrophysical Observatory’s Synthesis Telescope (ST, Landecker et al., 2000). The radio continuum survey provides images of the ISM with a resolution of about for 1420 MHz and 2828 at 408 MHz. The three phases of the CGPS cover a longitude range of 53 193 and a latitude range of , with a high latitude extension in the range of 100 117, extending up to . All data are made publicly available via the Canadian Astronomy Data Centre.
2.2 11 cm
The 11 cm data were obtained from a radio continuum survey of the Galactic plane taken with the Effelsberg 100-m telescope. The survey at 2695 MHz has a 43 angular resolution and a sensitivity of 50 mK (Fürst et al., 1990).
2.3 6 cm
Data at GHz (Stokes IQU) are from the Sino-German 6 cm polarization survey of the Galactic plane (Xiao et al., 2011; Gao et al., 2010; Sun et al., 2007), made with the Urumqi 25 m telescope, at a resolution of 95. For the high latitude candidate G108.511.0, 6cm data are taken from the 4850 MHz survey data (GB6) made with the former Green Bank 91 m dish, with a resolution of 3733 (Condon et al., 1989). Due to the method of observation, structures 20 in declination are expected to be missed (Condon et al., 1989).
2.4 92 cm
2.5 Optical & 60 m Infrared
Optical data was obtained from the Space Telescope Science Institute (STScI) Digitized Sky Survey (DSS2 Red) (McLean et al., 2000). The 60m infrared data were obtained from the Improved Reprocessing of the IRAS (Infrared Astronomical Satellite) Survey (IRIS) (Miville-Deschênes et al., 2005).
| Flux (Stokes I) | G108.511.0 | G128.52.6 | G149.53.2 | G150.83.8 | G150-S-shell | G160.11.1 | ||||||
| S4812/4850[mJy] | 380 | 70 | 140 | 40 | 150 | 30 | 300 | 60 | 50 | 15 | 60 | 15 |
| S2695[mJy] | 180 | 50 | 390 | 100 | 560 | 120 | 110 | 25 | 145 | 30 | ||
| S1420[mJy] | 660 | 200 | 190 | 40 | 500 | 60 | 630 | 100 | 160 | 20 | 165 | 20 |
| S408[mJy] | 1030 | 400 | 350 | 100 | 1060 | 110 | 800 | 150 | 310 | 40 | 615 | 100 |
| S327[mJy] | 530 | 180 | 1350 | 300 | 1200 | 380 | 370 | 85 | 845 | 185 | ||
| (S) | 0.41 | 0.22 | 0.44 | 0.08 | 0.71 | 0.08 | 0.38 | 0.10 | 0.62 | 0.07 | 0.94 | 0.10 |
| S[mJy] | 734 | 24 | 255 | 20 | 590 | 44 | 665 | 64 | 185 | 11 | 265 | 24 |
| Centre () | 10851,1104 | 12847,259 | 14948,320 | 15078,375 | 15055,346 | 16011,108 | ||||||
| Size angle | 64939020 | 39621530 | 55649340 | 64118850 | 35913241 | |||||||
3 Method
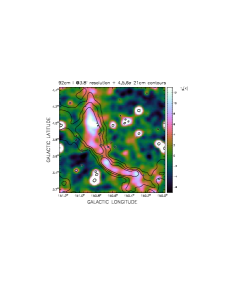
To best represent extended continuum emission, unresolved “point” sources in the 84 individual 21 cm CGPS mosaics (each 55 degrees in size) are modelled and removed. We first locate these sources using a program in the DRAO export software package called findsrc. To enhance the point-like sources, findsrc examines an image using a matched point source wavelet filter. It then removes point-like source responses from the filtered image utilizing a method similar to a Clark-style ”clean”. All point source components found are fed to a source box file which is passed to a program called fluxfit, which then fits each point source with an elliptical Gaussian, and subsequently removes it. Occasional sources are missed by the automated passes, and each source-removed mosaic was subjected to a final visual search by eye to locate and manually model and subtract unremoved sources. Each final source-removed mosaic was then smoothed to a circular beam of FWHM 38 in the UV plane using FFT techniques. Smoothing the source-removed map increases the signal-to-noise (S/N) ratio of extended emission while levelling the artefacts left by imperfect point-source subtraction. The final prepared mosaics contain S/N-enhanced shell-like or round, filled-centre extended structures which were previously undetected. After source removal and smoothing, mosaics were tiled together to produce a single source-removed 3.8-arcminute resolution supermosaic of the entire 21 cm CGPS continuum survey. This supermosaic prepared as described above has 327684096 19 pixels, and is available as a single large FITS file from T. Foster and R. Kothes by request.
Candidate objects were sought by visual inspection of the prepared 21 cm supermosaic. Many hidden structures such as crescents, complete or partial shells, filaments, and filled-centre objects that appeared round-ish or elliptical were identified in the smoothed, source-removed supermosaic. For each candidate we next make smaller individual 21 cm maps centred on them. Along with 21 cm, complementary maps from other radio surveys at 6 cm (Urumqi), 11 cm (Effelsberg), 74 cm (CGPS) and 92 cm (WENSS) were also made, for a total of 5 maps at 5 frequencies. 21 cm contour boundaries are overlaid on the other frequency maps, and all point sources within them were removed. All maps at complementary frequencies were then smoothed to at least 3.8 arcminutes unless their original resolution was lower. By comparing the emission in all five frequencies we get an initial impression of the steepness of the radio spectrum, and can identify and separate thermal from non-thermal sources. For promising non-thermal candidates we then measure the integrated flux density and its uncertainty with the following method. For a given frequency, a polygon that encloses the emission of each object is defined by eye on the map, and the flux density within the polygon is measured. This same polygon defined at this reference frequency is then used to measure the integrated flux density in each of the other four frequencies. We then repeat this procedure with the other four frequencies as reference, until we have 5 individual integrated flux density measurements per frequency. For 21 cm and 74 cm maps, which have emission on spatial scales much larger than the candidates sizes, a twisted plane is fitted to the polygon’s vertices to determine a model-background map which is subtracted.
We then weight each flux density measurement by 1/error2 and obtain the spectral index for each candidate by fitting a power-law S to the five-frequency spectrum (note: only three frequencies were available for G108.511.0: 6 cm, 21 cm, and 74 cm). The flux densities and spectral index for each SNR are tabulated in Table 1, including the flux density estimated at 1 GHz.
Errors in measurements reflect the variation in flux density across the five different polygons. These errors were summed in quadrature with errors in the total intensity calibration , which are 4, 10, 5, 10 and 20% for 6, 11, 21, 74, and 92 cm, respectively. For G108.511.0, calibration errors intrinsic to the 4850 MHz survey reference 2% of the Baars et al. (1977) flux-density scale (Condon et al., 1989), which indicates an absolute accuracy of about 5% (Baars et al., 1977).
The angular size of each SNR (each 1) is determined by measurements of the brightest emission regions (shells) by eye, and not extrapolated to the ill-determined full size of each faint candidate. Since the newly discovered SNRs in this paper are all seen as incomplete shells that are confused with unrelated Galactic foreground/background emission and H ii regions, we do not estimate surface brightnesses.
4 Notes on Individual Objects
We discuss each candidate in the context of our criteria for identification of supernova remnants lurking within our extensive source-removed and smoothed 21 cm mosaic. For each object, several criteria have been fulfilled, in order for the object to be considered a SNR. These criteria are (in order of importance): a non-thermal radio spectrum, a roundish limb-brightened (aka “shell”-like) appearance in several frequencies, presence of 6 cm and/or 21 cm polarized emission within the continuum contours of the shell(s), the lack of correlated IR emission, and the possible appearance of filamentary optical emission.
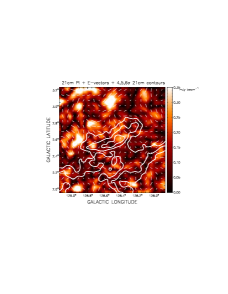
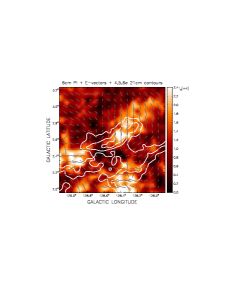
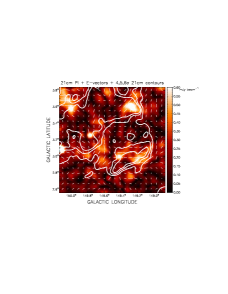
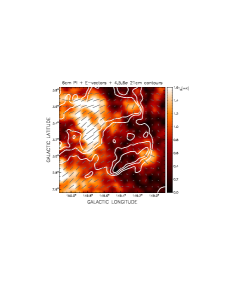
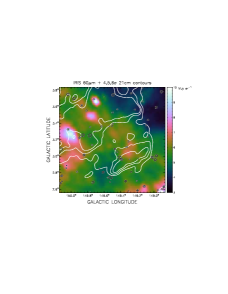
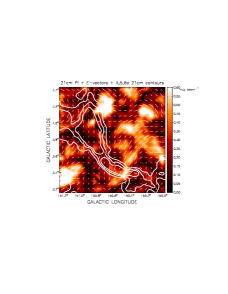
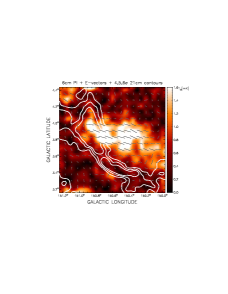
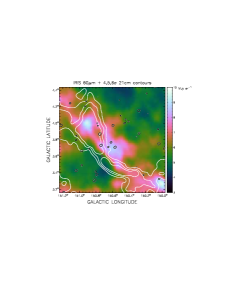
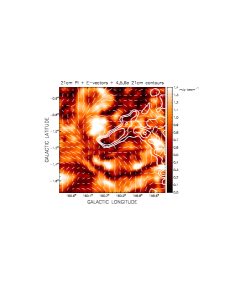
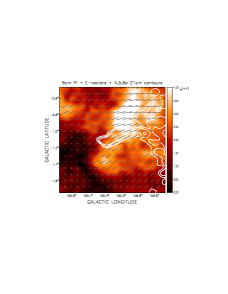
In the following discussion of the individual candidates, the appearance and spectral features of each SNR candidate reference Figures 1 and 7-10, presented mainly in the “cubehelix” colour scheme of Green (2011). All Stokes I radio maps are presented in their native resolution except as where noted in the text label above each figure panel, and point-sources in and around the vicinity of the candidate have been subtracted to emphasize the structure of the extended emission. 21 cm continuum contour levels overlaid on each of the maps in these figures are at the 4,5 and 6-sigma levels above the background (values given in the text label above each 21 cm I map). Spectra are presented in Figures 2 and 3-6 with comparable -axis scaling for direct comparison of their steepness’. We note that the polarization of an object’s shell will appear different at the two wavelengths for which we have polarization data (6 cm and 21 cm). At 6 cm Faraday rotation by the intervening ISM is low and polarized shell emission should be highly visible; however the resolution of these data is 9.5, so that small-scale highly polarized emission such as is found in SNR shells is likely to be diluted away by foreground/background emission in the beam solid angle. As well, 21 cm data presented here do not have short spacings added, and due to the 12 higher Faraday rotation as compared to 6 cm, 21 cm polarization structures in shells suffer much more from depolarization and confusion with foreground structures and also may not appear at all. In our discussion, North/South refer to the Galactic plane and not to the equatorial coordinate system. 21 cm Polarized Intensity (PI) maps shown in the corresponding figures are at 3.8-arcminute resolution, and PI maps at both frequencies are overlaid with -field vectors. 60m IRIS (re-processed IRAS) maps presented are all scaled to the same brightness levels for relative comparison.
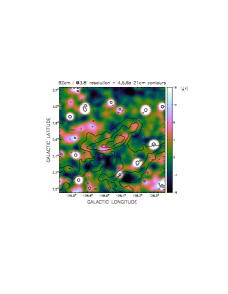
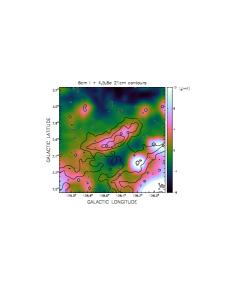
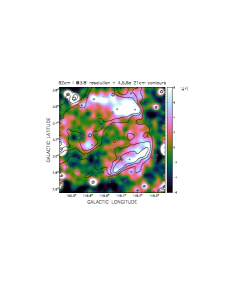
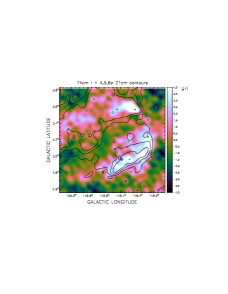
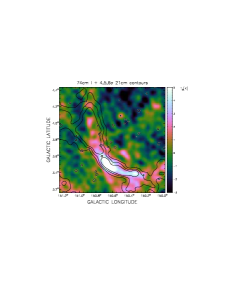
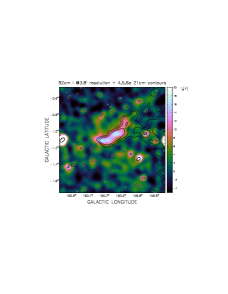
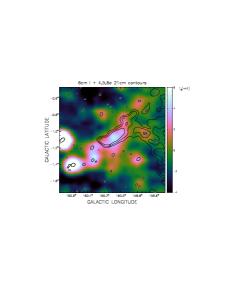
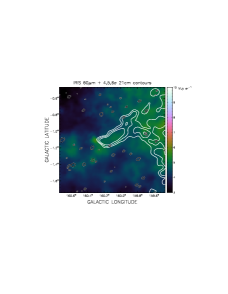
4.1 G108.5+11.0
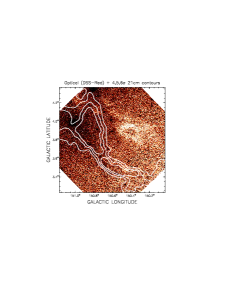
Total power maps at 4.85 GHz, 1420 MHz, and 408 MHz are shown in Figure 1. G108.511.0 is beyond the observed limits of the 327 MHz survey data. The object has a prominent shell on top of a diffuse emission plateau. The integration area chosen for G108.511.0 included the well-defined Northern shell half and a less defined shell mixed with diffuse emission in the south. If these are both the top and bottom shell-halves of a single SNR, then G108.511.0 has an angular size of 6539 and an angle between the bilateral symmetry axis of the SNR and the Galactic plane of 20. G108.511.0 has a moderately steep spectral index of 0.410.22, obtained with only three frequencies (see Figure 2; uncertainty from min-max slope). Due to missing large angular structures in the GB6 survey, we might expect a slightly lower integrated flux density measurement at 6 cm, resulting in an artificially steeper spectrum using three frequencies. However, taking the 21 cm and 74 cm data alone we obtain 0.360.58 (min-max slope), similar to the three-frequency spectrum, albeit with a large uncertainty.
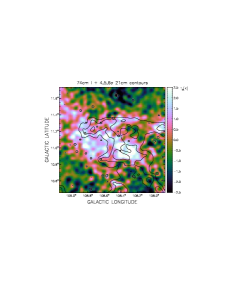
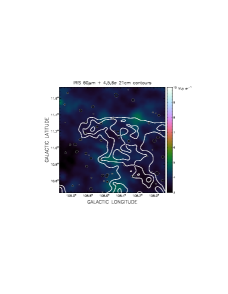
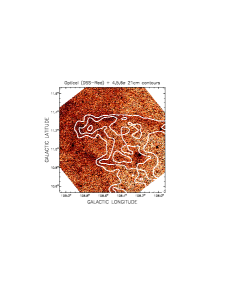

The optical map (see Figure 1) shows an elongated filament of red emission within the 21 cm contours, with a well-delineated Northern edge tracing the North radio shell. The filament-like edge is indicative of an older SNR, which over time, has swept up increasing amounts of ISM dust and gas. As shown in Figure 1, there are insignificant infrared emission patches in the field, none of which are spatially correlated with the well-defined N shell.
No obvious 21 cm polarized emission is seen associated with the shells, but any such emission could easily be depolarized by Faraday rotation from an intervening foreground. G108.511.0 is not seen as a depolarizing object either, since there is very little 21 cm polarized emission in its field to compare to. Since G108.511.0 is a higher latitude remnant, there is no Urumqi 6 cm polarization data available. Along with only three frequencies to determine its spectrum, the presence of optical emission and absence of infrared emission, we classify G108.511.0 as a good, but not strong candidate SNR. We hope that further, deeper observations will be performed to confirm our proposed classification of G108.511.0 as an SNR. Given its high latitude location and the very nice alignment of its N and S shells with the Galactic plane (and hence with the large-scale Galactic magnetic field), further study may also provide new insight to our understanding of SNRs and their evolution in the Galactic halo.
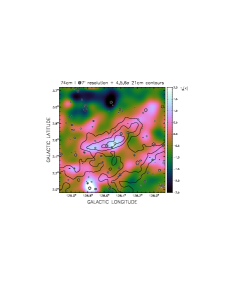
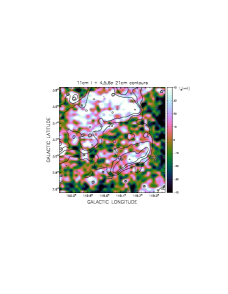
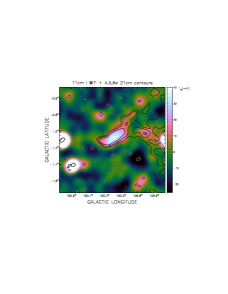
4.2 G128.5+2.6
Total power maps at 4.8 GHz, 2.7 GHz, 1420 MHz, 408 MHz, and 327 MHz are shown in Figure 7. In total power, G128.52.6 has a shell-like morphology with only one crescent-like limb detectable, appearing concave northwards. G128.52.6 is among the smaller of the five candidates, primarily because there is no complete shell to be seen. The angular extent of the S shell limb is 4022 with a 30 angle between the symmetry axis of the SNR and the Galactic Plane.
G128.52.6 has a moderately steep spectral index of = 0.440.08 (see Figure 3), typical of shell-type SNRs in the plane (Kothes et al., 2006). The SNR is fairly well defined in all five radio frequencies that we use, appearing isolated in the direction of minimal confusing foreground/background emission; therefore we deem our flux density measurements quite reliable. There is no optical or IR emission associated with the shell. Some isolated 21 cm polarized emission appears within the shell’s Western side, and the -field vectors (perpendicular to the -field vectors shown in Figure 7) with this emission run tangent to the shell and roughly parallel to the Galactic plane. In the 9-resolution 6 cm map (the complete data for which are described by Xiao et al., 2011), a similar bright patch of PI appears in the shell’s Western side; however this emission may or may not be related to the SNR since it appears connected to extended PI emission appearing outside the shell to the North and West. Because of the shell’s small size, any emission belonging to it as shown in the 6 cm polarization map in Figure 7 appears confused within the larger structure. Despite the inconclusive evidence of polarizaton in the 6 cm map, the object’s well-determined radio spectrum, its shell-like appearance with some moderately well-defined 21 cm PI emission, and an absence of IR emission make G128.52.6 a strong candidate SNR.
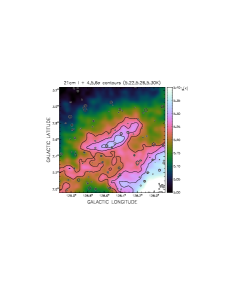
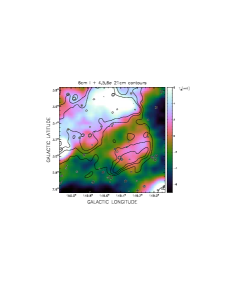
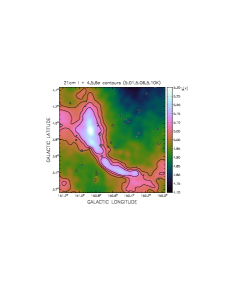
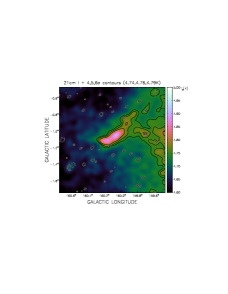
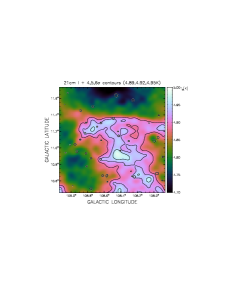
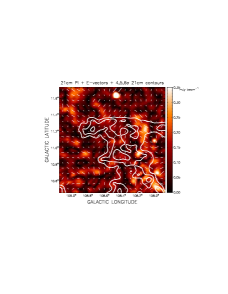
4.3 G149.5+3.2
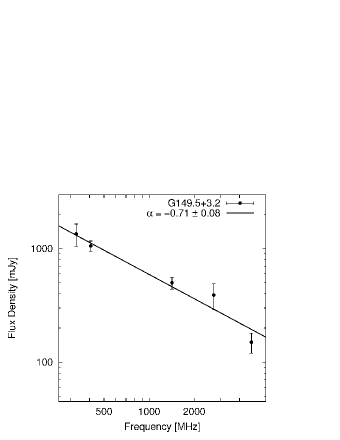
Total Power maps at 4.8 GHz, 2.7 GHz, 1420 MHz, 408 MHz, and 327 MHz, are shown in Figure 8. In total power, G149.53.2 shows a bilateral structure with a N and S shell limb, the southern portion of which is better defined and isolated from large-scale diffuse field emission. Among the five SNR candidates described in this paper, G149.53.2 is one of the larger in angular size at 556493, with an angle between the symmetry axis of the SNR’s Southern shell and Galactic plane of roughly 40.
All total power maps show emission well correlated to the 21 cm contours of the object’s limb. The integration area chosen to determine the spectral index included the brightened S limb and the well-delineated central round portion of the object, but we exclude the bright emission in the N edge where the extent of the shell is ambiguous and possibly confused with extended diffuse Galactic emission. The flux measurements taken included variations on the size and shape of the area to quantify the uncertainty in the flux due to the ambiguity in extent of emission. The spectral index is steep: = 0.710.08 (see Figure 4), typical of a young SNR.
There is isolated 21 cm PI emission appearing confined within the well-defined S shell half with none outside, having vectors parallel with the Plane and therefore vectors almost radial with respect to the shell. This 21 cm map is to be compared with the 6 cm PI map (the complete data for which is described by Gao et al., 2010), which also indicates PI emission within the S shell’s boundary. the 6 cm PI emission is somewhat correlated with the 21 cm PI, but only roughly due to the lower 9-resolution. The 6 cm PI emission shows projected vectors parallel to the shell (i.e. a tangentially oriented field) and nearly parallel to the Plane. Clearly this emission has suffered more rotation at 21 cm by the intervening foreground. There is no IR emission in and around G149.53.2, and no apparent optical (red) emission. The well determined radio spectrum, its limb-brightened appearance in several frequencies, and the presence of spatially correlated PI at both 6 and 21 cm wavelengths make this a strong SNR candidate.
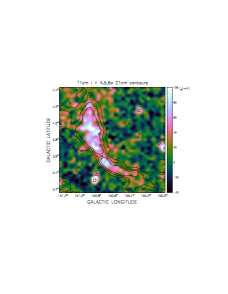
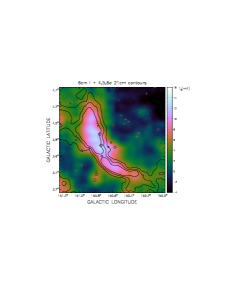
4.4 G150.8+3.8
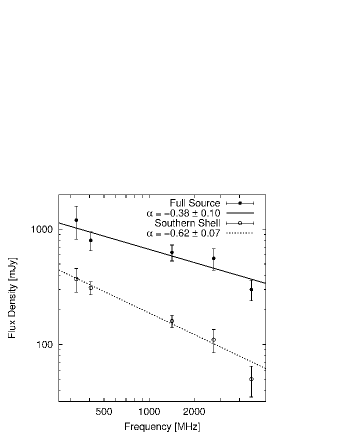
Total Power maps at 4.8 GHz, 2.7 GHz, 1420 MHz, 408 MHz, and 327 MHz, are shown in Figure 9. In 1420 MHz total power, G150.83.8 appears as two tenuously connected crescents of emission: one in the North (centre 150.9, 3.9) elongated 90 to the plane and one in the South (centre 150.5, 3.4) elongated more-or-less along the Plane. It is unclear if these crescents form part of the same Eastern shell-edge of a single large object, or are two separate adjacent objects. In the DSS optical map (see Fig. 9) the S shell encloses strikingly thin red filaments stretching parallel to the radio shell, while in the N shell similar red filaments are also seen within the shell; however, N shell filaments appear atop some very diffuse red nebulosity that extends beyond the shell’s radio contours and does not seem to be correlated. Both shells seem to show possible post-shock optical emission from an SNR shock, with the N shell strands seen towards unrelated thermal emission along the same line-of-sight. The 60 m infrared map (see Figure 9) indicates some emission towards the most Northern portion of the 1420 MHz contours, although the overall IR emission does not appear related to the shell-shaped contours. Indeed, taken together the overall integrated spectral index for G150.83.8 is the least steep of all five candidates, at = 0.380.10 (see Figure 5), but the thin S shell integrated alone shows a steeper spectrum at 0.620.07. Polarized emission in the 6 cm map appears to be associated with the large-scale foreground/background, as does the polarized emission in the 1420 MHz map (see maps Figure 9). Therefore, we cannot conclude that any of the polarized emission belongs to the observed shells. If the large-scale thermal emission observed in the optical and IR maps is in the foreground, it may be depolarizing any ordered PI emission from the shell.
The presence of thin filamentary strands of red optical emission combined with the semi-circular shell-like appearance and distinctly non-thermal radio spectrum make G150.83.8 a strong SNR candidate.
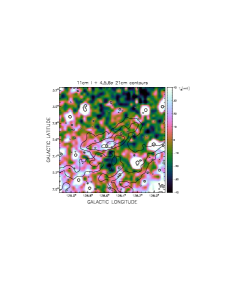
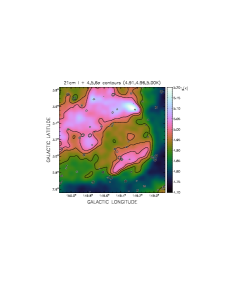
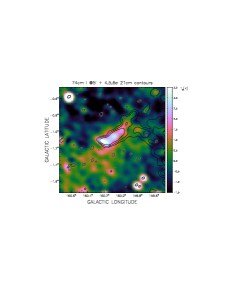
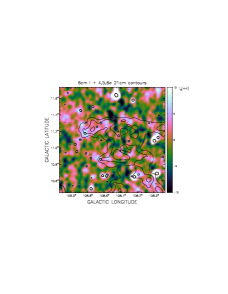
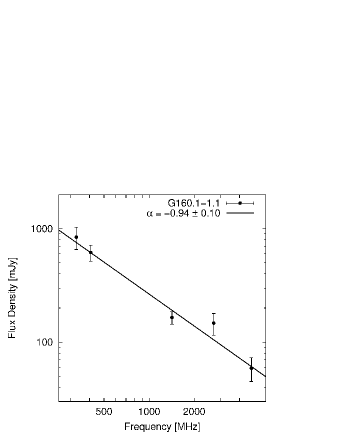
4.5 G160.11.1
Total power maps at 4.8 GHz, 2.7 GHz, 1420 MHz, 408 MHz, are 327 MHz are shown in Figure 10. In total power, G160.11.1 has a shell-like shape with only one limb detectable, and is best depicted in 1420 MHz total power. The long, thin kidney-bean shaped shell is about 36 long elongated SE-NW making an angle of 40 with the Galactic Plane. G160.11.1 has the steepest spectral index of our five candidates at = 0.940.10 (see Figure 6). The spectral index remains at least 0.9 whether or not the 92 cm and/or the 6 cm data end-points of the spectrum are excluded from the fit. G160.11.1 is the smallest of the five candidates with an angular size of 3613.
G160.11.1 is not significantly polarized at intermediate (1420 MHz) or high (4.8 GHz) radio frequencies. The 6 cm polarization emission which falls partially within the 21 cm contours appears to be associated with polarized emission beyond the contours, indicating that either the polarized emission associated with the object is confused with the larger background emission or the polarized emission shown is exclusively associated with large-scale, unrelated structure (see map in Figure 10). Thus, any polarization evidence for G160.11.1 is inconclusive.
There is no significant 60 m infrared emission (see map in Figure 10) within the 1420 MHz contours, and no optical emission at all in the field of G160.11.1. While G160.11.1 does meet our most important criterion of a steep non-thermal radio spectrum, its remarkable steepness is hard to explain with the electron energies found in supernova shocks. Nonetheless, there are other steep-spectrum SNRs (e.g. Cas A; 0.77 Green, 2009) for which G160.11.1 comes within the uncertainties. Like Cas A, G160.11.1 may be a very young SNR. Based on the unmistakeable synchrotron emission spectrum, we thus propose that G160.11.1 is a strong SNR candidate.

5 Conclusions & Future
The purpose of this paper is two-fold. Firstly, we introduce five extended, faint discrete objects discovered in the CGPS 21 cm dataset and show evidence (mainly through their radio appearance, spectra and polarization properties) that these are to be classified as SNRs. Secondly, we provide a basic qualitative interpretation and quantitative observed properties (fluxes and sizes) that will aid the community in planning future new observations of them at radio wavelengths and especially at other wavelengths (e.g. X-ray, optical). The objects were discovered through systematically mining the entire CGPS 21 cm dataset after it had been point-source subtracted and smoothed. This data processing method increased the signal-to-noise of faint extended emission and revealed never-before-seen objects. Their identity as SNRs was then ascertained spectrally through comparison with other radio wavelengths (e.g. 74 cm component of the CGPS; the Sino-German 6 cm polarization survey, etc.), and by comparison to other simple criteria (e.g. shape, polarization properties, optical and IR appearance).
Found within the outer Galaxy second quadrant (90270) these five newly discovered radio SNRs represent a significant increase in the known and suspected Galactic radio SNRs of quadrants II and III of the outer Galaxy (see catalogues by Green (2009) and Kothes et al. (2006)) which now number 50. In terms of areal density this is 0.65 SNRs kpc-2 which, extrapolated across the entire Milky Way stellar disk (14 kpc) suggests 400 SNRs in the Galaxy, many less than the 1000-2000 expected. As such, we surmise that many more such faint SNRs can be potentially discovered with our approach by mining new high-resolution radio surveys of the Milky Way (e.g. GALFACTS Taylor & Salter, 2010) in order to further our understanding of the ISM.
Acknowledgements.
We wish to thank the referee for constructive help that improved our paper prior to publication. The Dominion Radio Astrophysical Observatory is a national facility operated by the National Research Council Canada. The Canadian Galactic Plane Survey is a Canadian project with international partners, and is supported by the Natural Sciences and Engineering Research Council (NSERC). TF would like to thank Dr. Sean Dougherty (Group Leader, DRAO) and the NRCC for their hospitality and support during his sabbatical stay of 2012-13.References
- Baars et al. (1977) Baars, J. W. M., Genzel, I. I., Pauliny-Toth, K., & Witzel, A. 1977, A&A, vol. 61, 99
- Condon et al. (1989) Condon, J. J., Broderick, J. J., & Seielstad, G. A. 1989, AJ, vol. 97, 1070 & 1064
- Ferrand & Safi-Harb (2012) Ferrand, G., & Safi-Harb, S. 2012, Advances in Space Research, 49, 1313 (also arXiv:1202.0245)
- Frail et al. (1994) Frail, D. A., Goss, W. M., & Whiteoak, J. B. Z. 1994, ApJ, 437, 781
- Fürst et al. (1990) Fürst, E., Reich, W., Reich, P., & Reif, K., 1990, A&A, Suppl. 85, 691
- Foster et al. (2013) Foster, T. J., Cooper, B., Reich, W., Kothes, R., & West, J. 2013, A&A, vol.549
- Gao et al. (2011) Gao, X. Y., Sun, X., Han, J. L., Reich, W., Reich, P., & Wielebinski, R. 2011, A&A, 532, 144
- Gao et al. (2010) Gao, X. Y., Reich, W., Han, J. L., Sun, X. H., Wielebinski, R., Shi, W. B., Xiao, L., Reich, P., Fürst, E., Chen, M. Z., & Ma, J. 2010, A&A, 515, 64
- Geisbüsch et al. (2014) Geisbüsch, J., Tung, A., & Kothes, R. 2014, in prep
- Green (2011) Green, D. A. 2011, Bulletin of the Astronomical Society of India, 39, 289
- Green (2009) Green, D. A. 2009, Bull. Astron. Soc. India, 37, 45
- Kerton et al. (2007) Kerton, C. R., Murphy, J., & Patterson, J. 2007, MNRAS, 379, 295
- Kothes et al. (2014) Kothes, R., Sun, X. H., Reich, W., & Foster, T. J. 2014, ApJ, 784, L26
- Kothes et al. (2006) Kothes, R., Fedotov, K., Foster, T. J., & Uyaniker, B. 2006, A&A, 457, 1081
- Kothes et al. (2005) Kothes, R., Uyaniker, B., & Reid, R. 2005, A&A, 444, 871
- Kothes (2003) Kothes, R. 2003, A&A, 408, 187
- Kothes et al. (2001) Kothes, R., Landecker, T. L., Foster, T., & Leahy, D. A. 2001, A&A, 376, 641
- Landecker et al. (2010) Landecker, T. L., Reich, W., Reid, R. I. et al. 2010, A&A, 520, 80
- Landecker et al. (2000) Landecker, T. L., Dewdney, P. E., Burgess, T. A. et al. 2000, A&A, 145, 509 (also arXiv:astro-ph/0006415)
- Li et al. (1991) Li, Z., Wheeler, J. C., Bash, F. N., & Jefferys, W. H. 1991, ApJ, 378, 93
- Lozinskaya (1992) Lozinskaya, T. A. 1992, Supernovae and Stellar Wind in the Interstellar Medium (American Institute of Physics), 366
- McLean et al. (2000) McLean, B. J., Greene, G. R., Lattanzi, M. G., & Pirenne, B. 2000, ASP Conference Series, 216, 145
- Miville-Deschênes et al. (2005) Miville-Deschênes, M-A. & Lagache, G. 2005, ApJ, 157, 302
- Padmanabhan (2001) Padmanabhan, T. 2001, Theoretical Astrophysics, Vol. II: Stars and Stellar Systems (Cambridge University Press), 21
- Rengelink et al. (1997) Rengelink, R. B., Tang, Y., de Bruyn, A. G., Miley, G. K., Bremer, M. N., Roettgering, H. J. A., & Bremer, M. A. R. 1997, A&AS, Suppl. 124, 259
- Roy & Pal (2013) Roy, S. & Pal, S. 2013, ApJ, 774, 150
- Sun et al. (2007) Sun, X. H., Han, J. L., Reich, W., Reich, P., Shi, W. B., Wielebinski, R., & Fürst, E. 2007, A&A, 463, 993
- Tammann et al. (1994) Tammann, G. A., Löffler, W., & Schröder, A. 1994, ApJ, 92, 487
- Taylor & Salter (2010) Taylor, A. R. & Salter, C. J. 2010, in Astronomical Society of the Pacific Conference Series, Vol. 438, ed. R. Kothes, T. L. Landecker, & A. G. Willis, 402
- Taylor et al. (2003) Taylor, A. R., Gibson, S. J., Peracaula, M. et al. 2003, AJ, 125, 3145
- Tian et al. (2007) Tian, W. W., Leahy, D. A., & Foster, T. J. 2007, A&A, 465, 907
- Xiao et al. (2011) Xiao, L., Han, J. L., Reich, W., Sun, X. H., Wielebinski, R., Reich, P., Shi, H., & Lochner, O. 2011, A&A, 529, 15