Discovery of a red quasar with recurrent activity
Abstract
We report a new double-double radio quasar, DDRQ, J07464526 which exhibits two cycles of episodic activity. From radio continuum observations at 607 MHz using the GMRT and 1400 MHz from the FIRST survey we confirm its episodic nature. We examine the SDSS optical spectrum and estimate the black hole mass to be (8.20.3)107M⊙ from its observed MgII emission line, and the Eddington ratio to be 0.03. The black hole mass is significantly smaller than for the other reported DDRQ, J0935+0204, while the Eddington ratios are comparable. The SDSS spectrum is significantly red continuum dominated suggesting that it is highly obscured with mag. This high obscuration further indicates the existence of a large quantity of dust and gas along the line of sight, which may have a key role in triggering the recurrent jet activity in such objects.
Subject headings:
galaxies: active galaxies: individual (J0746+4526) galaxies: nuclei radio continuum: galaxies1. introduction
It is well established that many active galactic nuclei (AGN) may go through two or more cycles of episodic activity (Subrahmanyan et al., 1996; Lara et al., 1999). This is most clearly seen in extended radio galaxies and quasars, where there may be a new pair of radio lobes with well-defined hot-spots closer to the nucleus, in addition to the more distant and diffuse, extended lobes from an earlier cycle of activity. The sources with a second pair of lobes have been classified as double-double radio galaxies (DDRGs) by Schoenmakers et al. (2000), and their properties have been summarized by Saikia & Jamrozy (2009). Although most DDRGs were believed initially to be giant radio sources with sizes of over about a Mpc, a significant number of smaller sized DDRGs have also been identified in recent years (Nandi & Saikia, 2012). In most of the cases double-double radio sources are associated with galaxies but it is also possible for a quasar to appear as a radio-source exhibiting episodic activity. However, the number of DDRQs reported so far is very limited (Jamrozy et al., 2009), and it is important to identify more of these to make the physical scenario of this class statistically robust. J09350204 (4C02.27) located at the redshift of 0.65, is one promising DDRQ reported by Jamrozy et al. (2009), has a blue-continuum dominated spectrum, with projected linear sizes of 70 and 470 kpc for the inner and outer radio lobes respectively. Although in optical surveys, the widely popular “Color selection technique” already identified a large number of quasars having blue-continuum dominated spectra, recent studies found a huge dust accumulation around many new similar objects which make them optically redder (Urrutia et al., 2009). These red quasars are usually believed to represent an early stage of AGN evolution, which is going through a merging process leading to presence of large amounts of gas and dust (Glikman et al., 2012).
Based on only radio structural information Proctor (2011) classified 811,117 radio sources or entries from the FIRST (Faint Images of the Radio Sky at Twenty-cm; Becker et al. 1995) survey into different categories and listed 242 sources as candidate DDRGs. Further detailed investigation of these sources along with optical data from SDSS111http://www.sdss3.org/dr9/ and DSS222http://archive.eso.org/dss/dss catalogues showed only 23 of these sources to be promising examples of DDRGs (Nandi & Saikia, 2012). In this paper we report the discovery of a red DDRQ J0746+4526, discuss some of its properties and also compare these with J09350204. J07464526 which was classified from this survey to show evidence of episodic activity, has been identified as a quasar at a redshift 0.550210.00005 in Data Release 9 of SDSS. However, to confirm that neither of the inner compact components is a compact flat-spectrum nuclear component, as appeared to be the case in many of the candidate DDRGs identified by Proctor (2011), we observed this source with the Giant Metrewave Radio Telescope (GMRT) at 607 MHz.
We present the results of these observations of J07464526, which confirm the source to be a DDRQ, and then discuss the nature of the source using the results of our observations and archival FIRST data at radio wavelengths, and optical data from SDSS. The observations and radio data reduction procedures are described in §2. In §3, we present the observational results. The black hole mass determination is described in §4. The discussion and concluding remarks are summarized in §5.

2. Observations and data reduction
We made the 607 MHz GMRT observations of J07464526 on 2012 Nov 29. The observations were made in the standard manner, with each observation of the target source interspersed with observations of the phase calibrator, J0713+438. After each of several 20 min exposures of the target source the phase calibrator was observed for 5 min. The total observing time on the target source is about 190 min. We observed 3C147 for flux density as well as bandpass calibration. All flux densities are on the Baars et al. (1977) scale using the latest VLA values. These data were edited and reduced with the NRAO AIPS package. Several rounds of self calibration were done to produce the best possible images.
| Freq. | Beam size | PA | rms | Cmp. | Sp | St | |
|---|---|---|---|---|---|---|---|
| (MHz) | (′′) | (′′) | (∘) | (mJy/b) | (mJy/b) | (mJy) | |
| (1) | (2) | (3) | (4) | (5) | (6) | (7) | (8) |
| 607 | 6.83 | 4.71 | 73 | 0.05 | NW | 3 | 93 |
| NW | 17 | 24 | |||||
| SE | 24 | 30 | |||||
| SE | 24 | 319 | |||||
| 1400 | 5.40 | 5.40 | 0 | 0.14 | NW | 1 | 24 |
| NW | 8 | 11 | |||||
| SE | 12 | 13 | |||||
| SE | 10 | 119 | |||||
†Arrangement of the Table is as follows. Column 1: frequencies of observations; columns 23: the angular sizes of major and minor axes of the restoring beam; column 4: The Position angle; column 5: the rms noise; column 6: component designation; column 7: the peak flux density; column 8: the total flux density of each component. The error in the flux density is approximately 7% at 607 MHz and 5% at 1400 MHz.
3. Observational results
3.1. Radio data
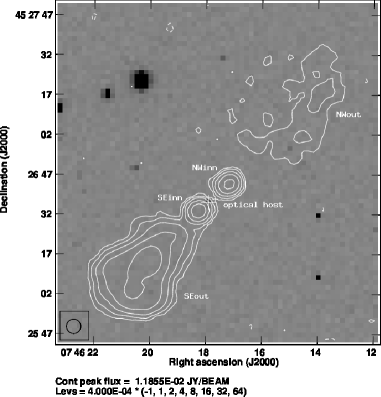
The full-resolution radio image obtained from FIRST at 1400 MHz and that from GMRT at 607 MHz are presented in Figure 1. The diffuse north-western outer lobe is imaged better at the lower-frequency GMRT image. The observational parameters and the flux densities estimated from these images are presented in Table 1. The spectral indices (defined as ) between 607 and 1400 MHz for the NW (north-west outer) and SE (south-east outer) lobes are 1.62 and 1.18 respectively. The corresponding two-point spectral indices for the NW (north-west inner) and SE (south-east inner) components are 0.930.13 and 1.000.13 respectively.
The outer-doubles of this DDRQ appear reasonably well aligned with the inner-ones and collinear with the parent optical host galaxy. The radio core has not been detected at either frequency. The projected linear size between the outer radio lobes is 630 kpc whereas the separation between two inner lobes is 95 kpc 333We have assumed a Universe with H0=71 km s-1 Mpc-1, =0.27 and =0.73. The outer lobes are highly asymmetric in intensity and do not show any evidence of hot-spots at the ends of the lobes. The flux density ratio of the outer components at 1400 MHz is 4.96, while for the inner lobes it is 1.18, with the south-eastern component being brighter in both cases. The log luminosity at an emitted frequency of 1400 MHz for the inner and outer doubles are 25.41 and 26.17 W/Hz respectively (Nandi & Saikia, 2012).
3.2. Optical data
The optical analysis is based on archival spectra obtained from the SDSS DR9 catalog for both the DDRQs J0746+4526 and J0935+0204. The Galactic reddening , adopted from the NASA Extragalactic Database (NED), towards J0746+4526 and J0935+0204 are respectively 0.056 and 0.042 mag.
The Galactic extinction and redshift corrected optical spectrum of J0746+4526 is presented in Figure 2, along with the spectrum of J0935+0204. The spectrum of J0935+0204 is similar to the typical spectra of normal quasars, while the spectrum of J0746+4526 is typical of red quasars. For both quasars, the [O iii] lines at 4960Å and 5008Å associated with the narrow-line-region (NLR) clouds, are quite prominent, while there is a striking difference in the strength of the hydrogen Balmer lines which are weaker in J0746+4526. It should be noted that the spectra of both the quasars are of moderate signal to noise ratio (S/N). For J0746+4526 and J0935+0204 it is 13.6 and 26.5 respectively, measured around mid portion of the SDSS spectral range coverage.
We have estimated the reddening for the object J0746+4526 in two different ways. First we use the empirical relation, developed from the study of spectra of nearby supernovae (e.g. Barbon et al., 1990; Turatto et al., 2003; Roy et al., 2011; Poznanski et al., 2012), between the width of the Na i D absorption dip and the host reddening. This has been used widely to determine the host galaxy extinction directly from the observed spectrum. The presence of the Na i D lines (5890, 5896Å) in the spectrum of J0746+4526, for which we obtain an equivalent width of 3.45 Å, enables us to estimate the plausible host extinction directly from the observed spectrum. Using the relation prescribed by Turatto et al. (2003), this corresponds to a host reddening of approximately 0.54 mag. On the other hand, according to the relation proposed by Barbon et al. (1990), the reddening of the host is mag. We therefore assume that the mean host reddening along the line of sight is mag.
We have alternatively estimated the amount of foreground extinction by comparing the de-reddened spectrum of J0746+4526 with an appropriate template (composite spectrum obtained from Brotherton et al. (2001)444http ://sundog.stsci.edu/Ðrst/QSOComposites/.). To do so we have adopted the Small Magellanic Cloud extinction curve, and we have de-reddened our observed spectrum by considering dust distributed in front of the QSO in a uniform screen geometry. We have searched for the best value of the color excess that minimizes the differences between the template and our QSO spectrum. We find that the host reddening is 0.79 mag. This result is consistent with the result obtained from the Na i D absorption dip. This is also consistent with the typical reddening ( mag) determined for the red quasars (Urrutia et al., 2009).
The widths of several spectral lines which are presumed to be generated near the central region of the AGN (like Mg ii 2800Å and H Balmer lines) are widely different for two interesting objects. For J0746+4526, FWHM of Mg ii 2800Å is 35.22Å , whereas for J0935+0204 it is about 61.33Å (Kozieł-Wierzbowska et al., 2012). These demonstrate that the velocity dispersions of several broad-line-region (BLR) clouds are much higher for J09350204 in comparison to that for J0746+4526 and further indicate that the former galaxy hosts a higher mass central black hole than the latter one.

4. Estimation of the Black Hole mass and Eddington ratio
“Reverberation Mapping” (RM) or “Echo Mapping” has proven to be a viable technique to measure the location of the line emitting clouds and the black hole mass (Blandford & McKee, 1982; Peterson, 1993). A major drawback with RM is that for a single system it requires a long-term monitoring programme to measure the time gap between continuum and the broad line variability. To measure the black hole mass of this DDRQ we follow an indirect technique of virial single-epoch method which is an approximation to the reverberation mapping method (Kaspi et al., 2005; Chand et al., 2010; Joshi et al., 2011; Kuźmicz & Jamrozy, 2012). It exploits the empirical power-law correlation between the size of the BLR and the AGN continuum luminosity (R ; with 0.5), as expected from photoionization model predictions (Bentz et al., 2006).
The best calibration values for the single epoch mass measurement scaling relations are available for the H line, as it is the basis for the majority of reverberation mapping programmes. However, the similar R-L relationship is also frequently employed to measure the BH mass using the C iv and Mg ii lines. The redshifts of these DDRQs are such that only the Mg ii ÅÅ and H Å lines fall in the wavelength range of the observed spectra. We note that the H and Mg ii emission features are prominent in the spectrum of J0935+0204, whereas for J0746+4526 the Mg ii line is clearly seen (although weaker) and the H emission line is barely seen (see Figure 2). Therefore, to determine the black hole mass of J0746+4526, we have used the Mg ii emission line, whereas for J0935+0204, Kuźmicz & Jamrozy (2012) used both the Mg ii and H emission lines.
According to the Vestergaard & Osmer (2009) (followed by Kuźmicz & Jamrozy 2012), the FWHM of the Mg ii emission line of a quasar spectrum is related to its black hole mass by the following scaling formula :
| (1) |
where is the monochromatic luminosity at 3000 Å .
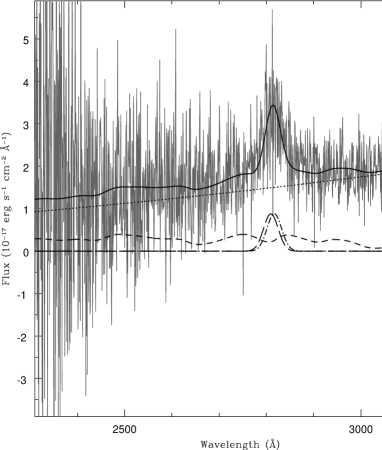
The Mg ii feature of J0746+4526 spectrum has been fitted with multiple Gaussian functions along with a power-law continuum and underlying UV Fe ii features have been obtained from the templates of nearby QSOs (Tsuzuki et al., 2006). In Gaussian profile fits, our initial guess consists of two Gaussian components for each line of the Mg ii doublet. However, if one of the components becomes statistically insignificant the procedure automatically drops it during the fit (Chand et al., 2010). In our two component Gaussian profile fits, width of each component (narrow/broad) of Mg ii 2796Å were tied to the respective components of the MgII 2803Å line. Here broad and narrow components represent the Mg ii emission associated with BLR and NLR clouds respectively. The width of the broad components are set to be greater than 2000 whereas those for the narrow components are constrained to be less than 1000 . In addition, we have constrained the width of the broader Mg ii component to be the same as the width of UV Fe ii emission line in this region.
The fitting has been done in an iterative way, minimizing the reduced to . Our final spectral fitting in the UV region is shown in Figure 3. Absence of the narrow Mg ii features in this fitting process probably indicates that no (or very negligible) Mg ii emissions are produced by the NLR clouds associated with J0746+4526. The contribution of the underlying Fe ii features is also very small. The FWHM of the broad components, obtained from the fitting, is 35.220.1 Å . This corresponds to a BH mass of M⊙ , where the error has been estimated after propagating the errors associated with flux estimation at 3000 Å and FWHM estimation of Mg ii line in a quadrature. This value is about one order smaller than the BH mass estimated for J09350204 ( M⊙ from Mg ii fit; Kuźmicz & Jamrozy 2012).
The Eddington ratio has been computed from the relation , where is the bolometric luminosity and is the Eddington luminosity (Metcalf & Magliocchetti, 2006; Dietrich et al., 2009; Kuźmicz & Jamrozy, 2012). For J07464526, the computed values of and are respectively and . This implies for J07464526, the Eddington ratio 0.03, which is consistent with that of J09350204 ( 0.06 calculated from Mg ii profiles; Kuźmicz & Jamrozy 2012).
5. Discussion and conclusions
In this paper we have presented a radio and optical spectroscopic study of the DDRQ J07464526. Both GMRT and FIRST images of this object show that there have been two episodes of activity. The diffuse emission of the outer double is well beyond both the hotspots of the inner lobes. The steeper spectral indices of the outer lobes suggest that these are due to older emission. The lobes of the outer double are significantly more asymmetric in flux density than the inner ones. The core emission is not detected at either 1400 or 607 MHz. This is in contrast with the DDRQ J09350204, where a prominent core has been detected at both frequencies. Although higher resolution observations at higher frequencies would be required to estimate the core flux density reliably, non-detection of a core in J07464526 is consistent with a larger angle of inclination of this source to the line of sight (Saikia & Kulkarni, 1994).
Although the projected linear size of J07464526 is larger than that of J09350204, both are of FRII type, lobe dominated DDRQs and highly asymmetric in flux density. J09350204 has a bright hotspot in the south-western outer lobe. This feature indicates that, for this source, the time scale of episodic activity is less than a few Myr (Saikia & Jamrozy, 2009; Jamrozy et al., 2009). On the other hand, both the outer lobes of J07464526 do not show any hot-spots, and a more detailed multi-frequency study would be required to estimate its ages.
J0746+4526 and J0935+0204 are two quasars where recurrent jet activity has been observed. The optical spectrum of J0935+0204 shows a blue continuum dominated spectrum, similar to most quasars, whereas that of J0746+4526 shows evidence of more extinction and obscuration, similar to that of red quasars. Significant populations of obscured red quasars have been reported in recent studies (e.g., Urrutia et al., 2009; Glikman et al., 2012). These findings demonstrate that possibly some different mechanism rather than the orientation of the torus is responsible for large obscuration. In particular, the large extinction in red quasars is probably related to significant dust extinction in the host galaxies. The fact that, out of the two known DDRQs, one is a red quasar is an interesting result. As large dust extinction is often related to massive starbursts and galaxy merging, it suggests that galaxy merging cannot only trigger powerful AGN activity (Heckman et al., 1986; Wilson & Colbert, 1995; Sánchez & González-Serrano, 2002) but that it can also trigger the interruption and restarting of jet formation. In other words, this result plausibly supports the merger-driven scenario for DDRG formation (Liu et al., 2003). In order to test whether this mechanism is the main scenario for DDRG formation, a larger sample of DDRGs needs to be investigated and compared with the global AGN population. The present paper, which presents the first discovery of a red quasar with recurrent jet activity, is only the first step towards a larger investigation.
The BH masses of giant and small-sized radio quasars, measured from Mg ii emission lines typically belong to the range and respectively (Kuźmicz & Jamrozy, 2012). For J0746+4526, the BH mass estimated using the Mg ii line is smaller than that of J0935+0204. However their accretion rates are comparable. Although Kuźmicz & Jamrozy (2012) suggested that larger mass BHs are associated with smaller accretion rates, this does not persist for all types of quasars (e.g., J23350927, J16233419, J14333209; Kuźmicz & Jamrozy 2012). Hence it appears that the BH mass and accretion rates of these DDRQs are quite similar to other quasars.
The discovery of a new DDRQ underlines the importance of identifying more such objects to study the properties of these objects at different wavelengths to estimate time scales of episodic activity, and properties of host galaxies and their environments to understand the triggering mechanisms for jet activity.
References
- Baars et al. (1977) Baars, J. W. M., Genzel, R., Pauliny-Toth, I. I. K., & Witzel, A. 1977, A&A, 61, 99
- Barbon et al. (1990) Barbon, R., Benetti, S., Rosino, L., Cappellaro, E., & Turatto, M. 1990, A&A, 237, 79
- Becker et al. (1995) Becker, R. H., White, R. L., & Helfand, D. J. 1995, ApJ, 450, 559
- Bentz et al. (2006) Bentz, M. C., Peterson, B. M., Pogge, R. W., Vestergaard, M., & Onken, C. A. 2006, ApJ, 644, 133
- Blandford & McKee (1982) Blandford, R. D., & McKee, C. F. 1982, ApJ, 255, 419
- Brotherton et al. (2001) Brotherton, M. S., Tran, H. D., Becker, R. H., Gregg, M. D., Laurent-Muehleisen, S. A., & White, R. L. 2001, ApJ, 546, 775
- Chand et al. (2010) Chand, H., Wiita, P. J., & Gupta, A. C. 2010, MNRAS, 402, 1059
- Dietrich et al. (2009) Dietrich, M., Mathur, S., Grupe, D., & Komossa, S. 2009, ApJ, 696, 1998
- Glikman et al. (2012) Glikman, E., et al. 2012, ApJ, 757, 51
- Heckman et al. (1986) Heckman T. M., Smith E. P., Baum S. A., van Breugel W. J. M., Miley G. K., Illingworth G. D., Bothun G. D., Balick B., 1986, ApJ, 311, 526
- Jamrozy et al. (2009) Jamrozy, M., Saikia, D. J., & Konar, C. 2009, MNRAS, 399, L141
- Joshi et al. (2011) Joshi, R., Chand, H., Gupta, A. C., & Wiita, P. J. 2011, MNRAS, 412, 2717
- Kaspi et al. (2005) Kaspi, S., Maoz, D., Netzer, H., Peterson, B. M., Vestergaard, M., & Jannuzi, B. T. 2005, ApJ, 629, 61
- Kozieł-Wierzbowska et al. (2012) Kozieł-Wierzbowska, D., Jamrozy, M., Zola, S., Stachowski, G., & Kuźmicz, A. 2012, MNRAS, 422, 1546
- Kuźmicz & Jamrozy (2012) Kuźmicz, A., & Jamrozy, M. 2012, MNRAS, 426, 851
- Lara et al. (1999) Lara, L., Márquez, I., Cotton, W. D., Feretti, L., Giovannini, G., Marcaide, J. M., & Venturi, T. 1999, A&A, 348, 699
- Liu et al. (2003) Liu, F. K., Wu, X.-B., & Cao, S. L. 2003, MNRAS, 340, 411
- Metcalf & Magliocchetti (2006) Metcalf, R. B., & Magliocchetti, M. 2006, MNRAS, 365, 101
- Nandi & Saikia (2012) Nandi, S., & Saikia, D. J. 2012, Bulletin of the Astronomical Society of India, 40, 121
- Peterson (1993) Peterson, B. M. 1993, PASP, 105, 247
- Poznanski et al. (2012) Poznanski, D., Prochaska, J. X., & Bloom, J. S. 2012, MNRAS, 426, 1465
- Proctor (2011) Proctor, D. D. 2011, ApJS, 194, 31
- Roy et al. (2011) Roy, R., et al. 2011, MNRAS, 414, 167
- Saikia & Jamrozy (2009) Saikia, D. J., & Jamrozy, M. 2009, Bulletin of the Astronomical Society of India, 37, 63
- Saikia & Kulkarni (1994) Saikia, D. J., & Kulkarni, V. K. 1994, MNRAS, 270, 897
- Sánchez & González-Serrano (2002) Sánchez S. F., González-Serrano J. I., 2002, A&A, 396, 773
- Schoenmakers et al. (2000) Schoenmakers, A. P., de Bruyn, A. G., Röttgering, H. J. A., van der Laan, H., & Kaiser, C. R. 2000, MNRAS, 315, 371
- Subrahmanyan et al. (1996) Subrahmanyan, R., Saripalli, L., & Hunstead, R. W. 1996, MNRAS, 279, 257
- Tsuzuki et al. (2006) Tsuzuki, Y., Kawara, K., Yoshii, Y., Oyabu, S., Tanabé, T., & Matsuoka, Y. 2006, ApJ, 650, 57
- Turatto et al. (2003) Turatto, M., Benetti, S., & Cappellaro, E. 2003, in From Twilight to Highlight: The Physics of Supernovae, ed. W. Hillebrandt & B. Leibundgut, 200
- Urrutia et al. (2009) Urrutia, T., Becker, R. H., White, R. L., Glikman, E., Lacy, M., Hodge, J., & Gregg, M. D. 2009, ApJ, 698, 1095
- Vestergaard & Osmer (2009) Vestergaard, M., & Osmer, P. S. 2009, ApJ, 699, 800
- Wilson & Colbert (1995) Wilson A. S., Colbert E. J. M., 1995, ApJ, 438, 62