M-Dwarf Fast Rotators and the Detection of Relatively Young Multiple M-Star Systems
Abstract
We have searched the Kepler light curves of M-star targets for evidence of periodicities that indicate, by means of the effects of starspots, rapid stellar rotation. Several analysis techniques, including Fourier transforms, inspection of folded light curves, ‘sonograms’, and phase tracking of individual modulation cycles, were applied in order to distinguish the periodicities due to rapid rotation from those due to stellar pulsations, eclipsing binaries, or transiting planets. We find 178 Kepler M-star targets with rotation periods, , of 2 days, and 110 with 1 day. Some 30 of the 178 systems exhibit two or more independent short periods within the same Kepler photometric aperture, while several have three or more short periods. Adaptive optics imaging and modeling of the Kepler pixel response function for a subset of our sample support the conclusion that the targets with multiple periods are highly likely to be relatively young physical binary, triple, and even quadruple M star systems. We explore in detail the one object with four incommensurate periods all less than 1.2 days, and show that two of the periods arise from one of a close pair of stars, while the other two arise from the second star, which itself is probably a visual binary. If most of these M-star systems with multiple periods turn out to be bound M stars, this could prove a valuable way of discovering young hierarchical M-star systems; the same approach may also be applicable to G and K stars. The 5% occurrence rate of rapid rotation among the M star targets is consistent with spin evolution models that include an initial contraction phase followed by magnetic braking, wherein a typical M star can spend several hundred Myr before spinning down to periods longer than 2 days.
Subject headings:
techniques: photometric—stars:activity—binaries (including multiple)—binaries: general—stars: late type—stars: rotation—stars: spots1. Introduction
M dwarfs—main-sequence stars with masses —dominate the Galactic stellar population in number and mass (Chabrier 2003). This preponderance is reflected in the local neighborhood where % of the nearest stars fall within this spectral class (Henry et al. 1994, 2006; Reid et al. 2002; Cruz & Reid 2002), and this fraction will continue to grow as more nearby red dwarfs are revealed. Despite their ubiquity, these small stars are difficult to characterize due in part to their low luminosities and complex atmospheres, and models are unable to satisfactorily account for their radii and temperatures at given masses (Torres et al. 2010; Boyajian et al. 2012; Birkby et al. 2013). The motivation to understand the fundamental properties of M dwarfs, including their multiplicity, has been amplified by recent results indicating that they frequently host low-mass planets (Swift et al. 2013; Dressing & Charbonneau 2013; Morton & Swift 2013).
Low-mass stars lose angular momentum through rotational magnetic braking (Mestel 1968). However, during their pre-main sequence lifetime their rotation rates increase due to gravitational contraction. This pre-main sequence phase can last from 100 Myr for stars of mass 0.5 to several hundred Myr for the lowest mass stars (see, e.g., Baraffe et al. 2002). After hydrogen burning commences in their cores and gravitational contraction ceases these stars begin to gradually spin down. Consequently, their magnetic field strengths and activity levels tend to decline (Skumanich 1972).
M dwarfs are thought to rotate differentially, but less so than solar type stars. Recent measurements based on Kepler data show that differential rotation rates for M dwarfs are typically less than 0.1 rad d-1 (Reinhold et al. 2013). Observations of late type stars show that their differential rotation rates generally depend strongly on effective temperature and weakly on rotation period (Barnes et al. 2005; Reiners 2006), a behavior that is also seen in computer models (Küker & Rüdiger 2011).
The Kepler Space Mission (Borucki et al. 2010; Koch et al. 2010) monitored over 150,000 stars nearly continuously for about four years, primarily to search for exoplanets (Borucki et al. 2011; Batalha et al. 2013; Burke et al. 2013). Kepler’s unprecedented photometric precision has also led to extensive ancillary investigations111keplerscience.arc.nasa.gov/PublicationsAstrophysics.shtml.
Though the vast majority of Kepler target stars are Sun-like (), several thousand M dwarfs have been monitored as well over the course of the primary mission. The initial estimation of the important characteristics of the stars in the Kepler field was done using ground-based multicolor photometry as part of the construction of the Kepler Input Catalog (KIC). This estimation process was optimized for sun-like stars; the characteristics of the M dwarfs in the KIC were not determined as accurately and should be adopted only with caution (Brown et al. 2011). There have been several efforts to revise the stellar parameters for this M-star sample (e.g. Muirhead et al. 2012a; Mann et al. 2012, 2013). In particular, Dressing & Charbonneau (2013; hereafter “DC13”) have tabulated and calibrated the properties of 3897 cool and high surface gravity Kepler target stars. The vast majority of these have masses in the range and the bulk of the effective temperatures fall in the range K. The numbers of stars show a bias toward the higher mass M dwarfs due to the magnitude limited nature of the Kepler targets (Batalha et al. 2010). Some 90% of the DC13 collection of M stars are at distances in the range 15-400 pc (median distance of 210 pc), and have absolute visual magnitudes in the range +8 to +12.
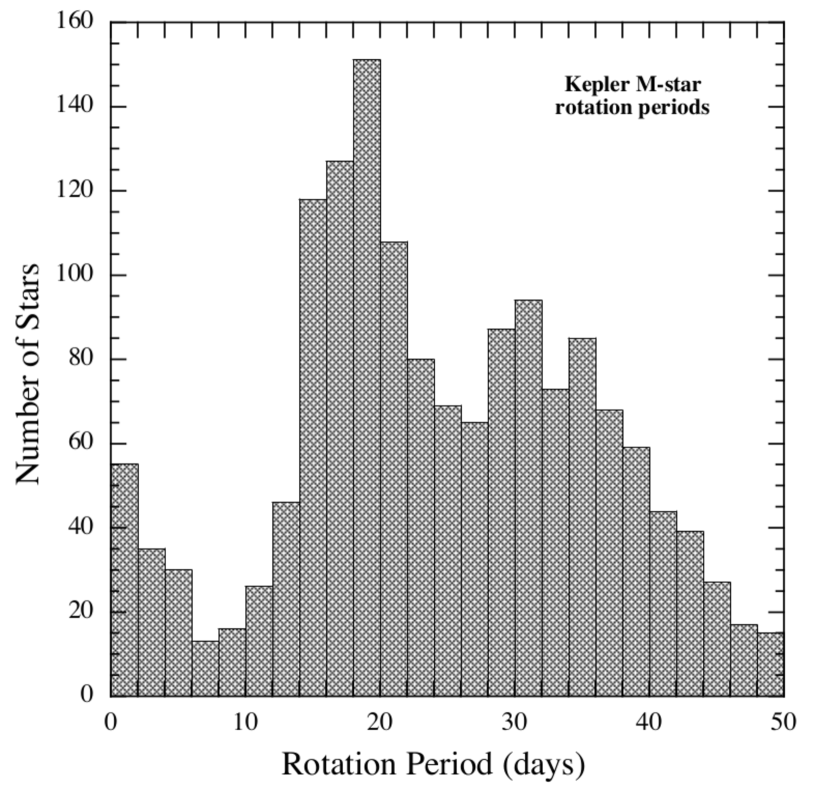
McQuillan, Aigrain, & Mazeh (2013) performed both autocorrelation function (‘ACF’) and Fourier transform analyses of the Kepler photometric data for the M dwarf targets in order to identify variations of the stellar fluxes due to starspots and to measure the corresponding periods. The period distribution that they derived is shown in the top panel of Fig. 1. The distribution includes periods all the way down to less than a day, has local maxima near 19 days and 33 days, and tails off dramatically toward periods above 40 days. There is also what appears to be a distinct group of M stars with periods less than 6 days, and the distribution is rising toward the shortest periods. Some 55 of these M stars have rotation periods of days.
In this work we focus on the rapidly rotating M stars, in particular those with day. In Section 2 we describe our search through the Kepler photometric data base for rapidly rotating M stars using a Fourier transform algorithm. In Section 3 the possibility that some of the periodicities we observe are due to stellar pulsations is discussed and largely discounted. We show selected examples of ‘sonograms’ for several of our candidate rotators in Section 4, and demonstrate that various frequencies and their harmonics appear to vary independently, thereby arguing for the rotating spotted star hypothesis. In Section 5 we present an analysis where we track the phases of individual starspot rotation cycles and thereby demonstrate that these are not stellar pulsations. In Section 6 we discuss the Kepler M-star targets wherein we have found two or more distinct rotation periods. This includes some 30 with at least two short periods, several with three periods, and one with four distinct periods (all shorter than 1.2 days). We argue in Section 7 that these are actually binary, triple, and quadruply bound M-star systems. In Section 8, we present evidence, based on UKIRT J-band and Keck adaptive optics images, that these are indeed binary and/or hierarchical systems. In Section 9 we apply a point-spread-function analysis to the Kepler pixel-level data for KIC 4660255 which exhibits four short periodicities, and show that two of them arise in each of two stellar images separated by about 4′′. We summarize our results and draw some final conclusions in Section 10.
2. Search for Rapidly Rotating M Stars
Because the Fourier transform (‘FT’) is an efficient tool for searching for periodic signals with high-duty cycle and smoothly varying profiles (i.e., where the first few harmonics dominate), it was our choice for discovering spotted stars rotating with short periods. While the transitory nature of starspots, which can induce possible erratic changes in the modulation phase, and surface differential rotation can broaden the peaks in a Fourier power spectrum, we did not find it necessary, nor particularly useful, to employ an ACF analysis. As it turns out, we have discovered a substantial number of Kepler M-star targets that exhibit more than one independent period—sometimes close to or near multiples of one another—and the FT is substantially more straightforward than an ACF to use in identifying multiple periods.
The FT approach utilized in this work is very similar in nature to the one used by Sanchis-Ojeda et al. (2013) in their search for short-period planets, and is based on the same selection criteria. In brief, the available Kepler PDCSAP_FLUX data (corrected with PDCMAP; Stumpe et al. 2012; Smith et al. 2012) were normalized quarter-by-quarter with the quarterly median values and then stitched together into a single data file, with all data gaps filled with the mean flux. After the FTs were computed, amplitude spectra were produced with units of parts per million (ppm) variation with respect to a flux of unity. We refer to these Fourier transforms below simply as “the FT”. For the purpose of searching for statistically significant peaks, we further normalized the FT by dividing by a smoothed version of the FT. The smoothing was accomplished by convolution with a boxcar function that is 100 frequency bins in length. This procedure has the effect of normalizing the raw FT to its local (100-bin) mean. All targets whose normalized FT revealed at least one frequency peak exceeding the local mean by a factor with at least one harmonic or subharmonic which exceeded its local mean by a factor of 3, were considered to be worthy of further investigation. We note that the analysis outlined here of the 3897 DC13 M-star Kepler targets requires only about one hour of cpu time on a standard laptop machine.
In all, we find 297 of the 3897 targets exhibit the requisite significant FT signal comprising a base frequency plus its harmonic, with the base frequency exceeding 0.5 cycles/day (i.e., days). We believe that the majority of these periodicities are likely to be due to stellar rotation manifested via starspots, but a significant number may be due to planet transits and binary eclipses. The individual FTs for these systems were further examined to eliminate those which were clearly not due to rotating starspots. In all cases we folded the data modulo the detected fundamental period, and were readily able to rule out cases due to transiting planets since their well-known sharp, relatively rectangular dipping profiles are characteristic. Of course, we also checked the KOI list for matches. Any of the objects that appear in the Kepler eclipsing binary (“EB”) star catalog (e.g., Matijevič et al. 2012) were likewise eliminated.
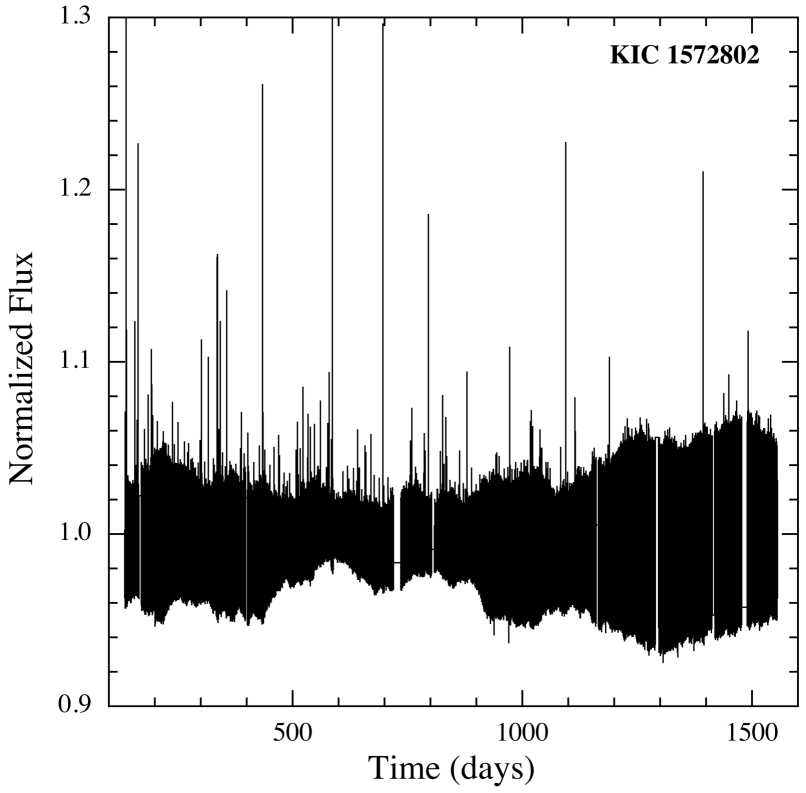
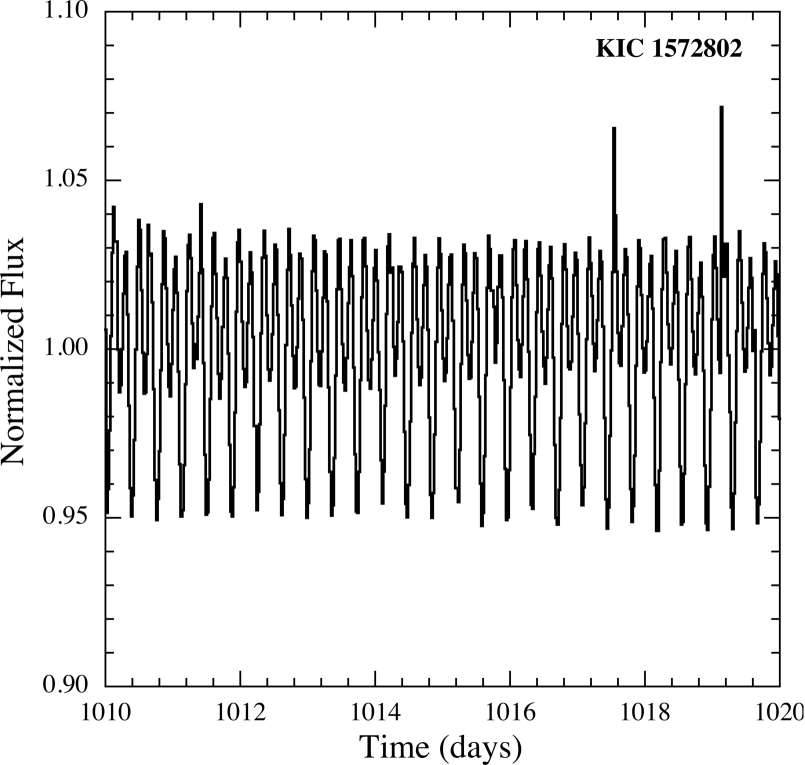
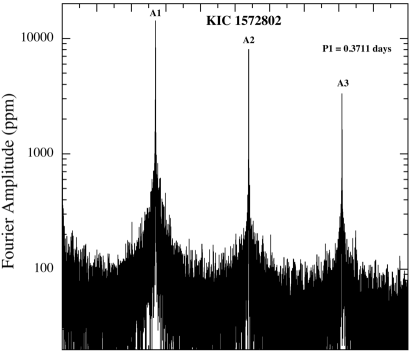
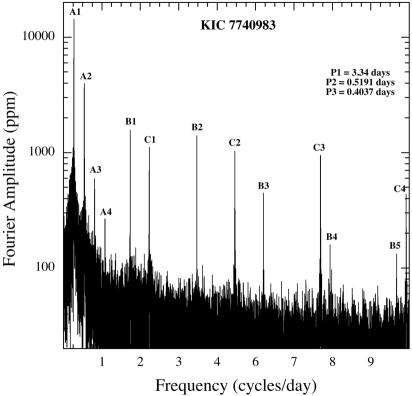
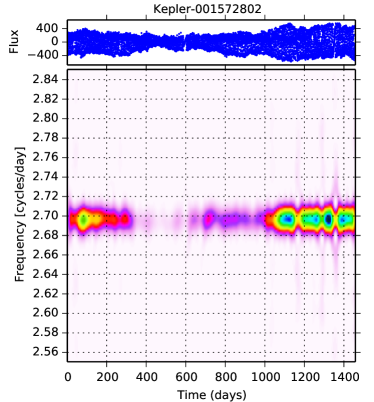
Spots on a rotating star can, depending on their locations and other properties, produce a profile that may be mistaken for the profile of an EB. The target KIC 1572802 is an example; see the top panel of Fig. 3. It exhibits variations at a period of 8.9 hours that resemble the light curve of a contact binary. However, an inspection of the top panel in Fig. 2, which shows the corresponding full Kepler light curve, indicates that the object is not likely to be a contact binary. Aside from the profusion of stellar flares, which are not atypical of M stars, the overall envelope of the 8.9-hour periodicity is seen to be highly and erratically variable. These amplitude changes are inconsistent with the behavior of a typical EB. Moreover, the shape of the 8.9-hr modulation changes dramatically over the four years of observations. The Fourier transform for this object is shown in the top left panel of Fig. 4.
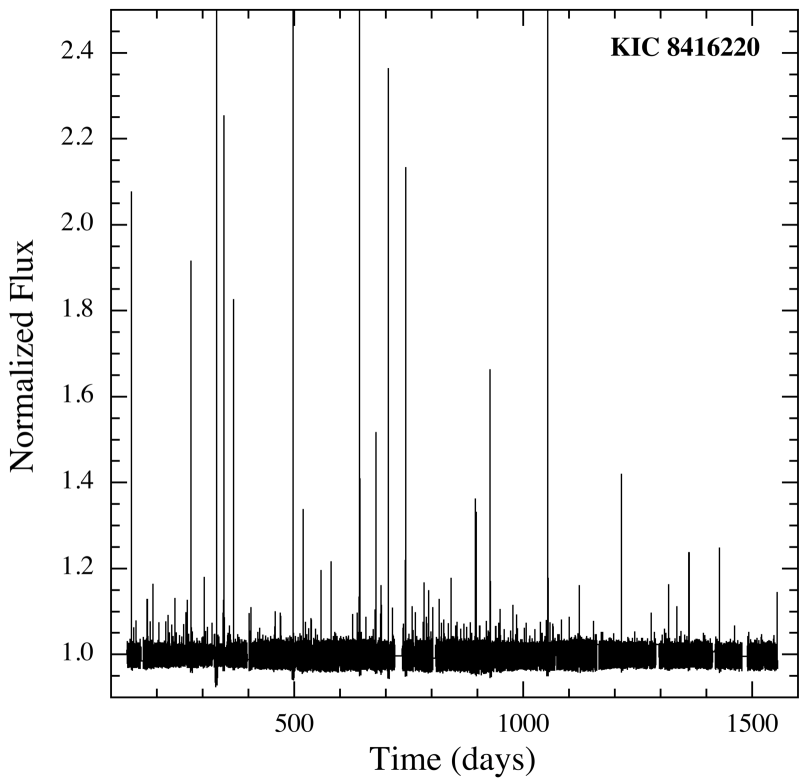
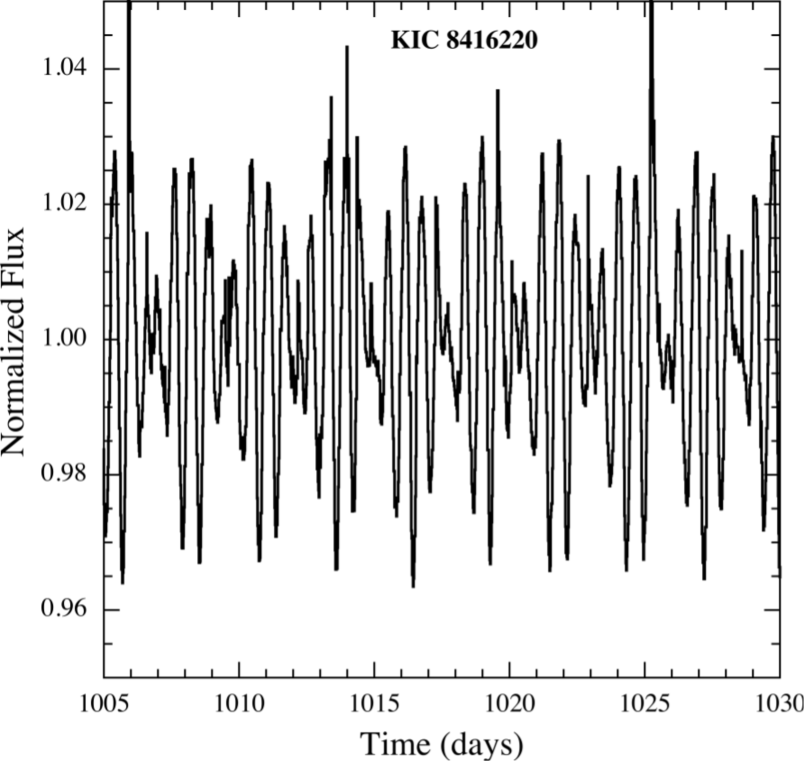
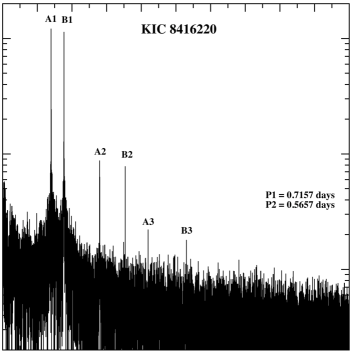
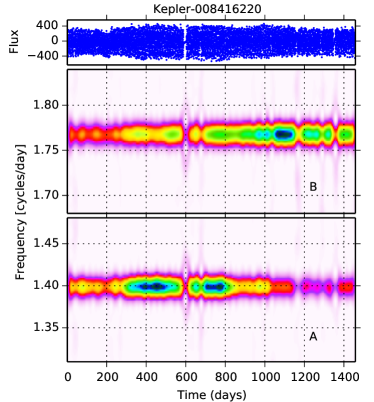
The bottom panels of Figs. 2 and 3 provide another example, i.e., the M star KIC 8416220 that exhibits a non-EB like light curve, yet where the overall amplitude remains nearly constant over the long term. This light curve results from a beat between two rotation periodicities whose periods differ by only 20% (see the FT in the upper right panel of Fig. 4).
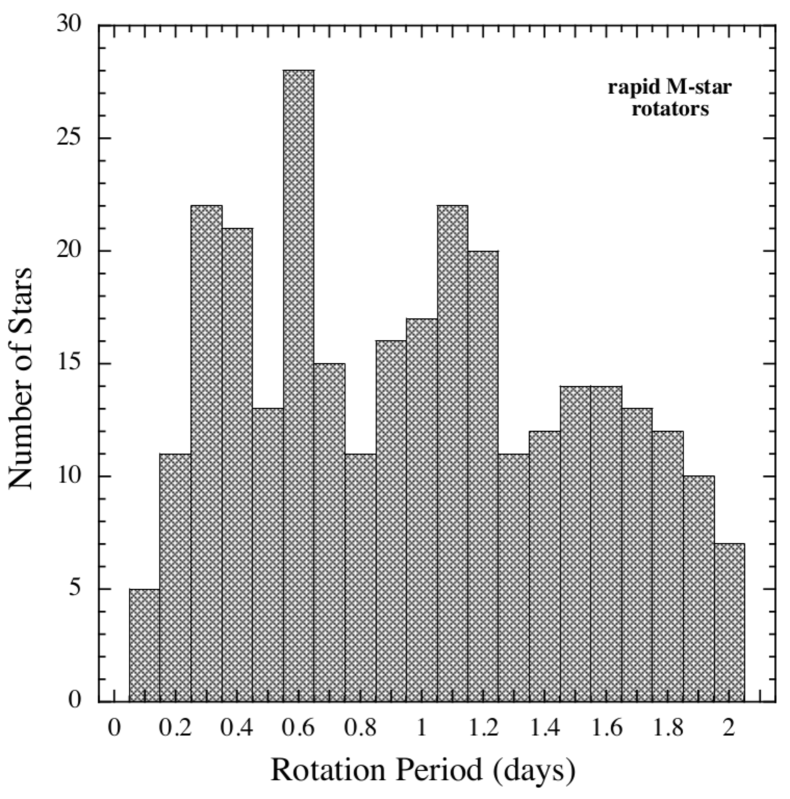
After carefully examining the 297 M star targets that exhibit significant periodicities with periods less than two days, we believe we have identified the stellar rotators, and are able to exclude the eclipsing binaries and transiting planets. In summary, we find that approximately 110 of these are previously identified binaries or transiting planets, or are likely to be binaries or transiting planets based on the characteristics of their FTs or folded light curves. Some eight of the 297 targets were identified as artifacts caused by leakage of the signal from the very bright star RR Lyr that pulsates with a period of 0.5669 days. After elimination of these targets, there remain 178 targets that exhibit one or more periodicities that are likely to be due to starspots (see Table 1) on rotating stars. These targets comprise a total of 211 different periodicities with days. Some 110 of the 178 targets exhibit 127 periodicities with day. The distribution of all 211 periods is shown in the bottom panel of Fig. 1.
3. Possible Stellar Pulsations Among the Periodicities
Stars with convective envelopes oscillate in multiple modes that are typically manifest as a forest of peaks in a Fourier spectrum, with amplitudes forming a roughly Gaussian-shaped envelope (see, e.g., Bedding 2011 for a recent review). The frequency of the mode with the maximum amplitude, , has been proposed to scale with the acoustic cut-off frequency (Brown et al. 1991) and can be related to basic stellar parameters by the scaling relation (Kjeldsen & Bedding 1995):
| (1) |
Using the masses, effective temperatures, and radii of Kepler M-star targets as determined by Dressing & Charbonneau (2013), as well as 3140 Hz (Barban et al. 2013), this relation yields values in the range 6.4 - 31.6 mHz, corresponding to periods between 0.5 and 2.6 minutes. This is at least a factor of 80 shorter than the shortest period in our stellar sample. Additionally, scaling relations for amplitudes of convectively excited oscillations predict amplitudes lower than a few parts per million for M dwarfs (Corsaro et al. 2013), which is incompatible with our observations. This, in combination with the lack of the typical Gaussian-shaped forests of peaks in our Fourier transforms, argues strongly against solar-like oscillations as the cause of the observed variability.
On the other hand, pulsations driven by the mechanism and convective-flux blocking similar to those in Doradus variables have been theoretically predicted to occur in M dwarfs (Rodríguez-López et al. 2012, 2013). Usually, the associated pulsation periods would be of the order of half an hour, but for some low-mass pre-main sequence models timescales between 7 - 11 hours were found. However, the authors argued that these oscillations would only grow during the short phase of deuterium burning, and, furthermore, would only grow slowly during that phase. It thus seems unlikely that pulsations driven by this mechanism could be responsible for the observed periodicities. Further evidence against contamination of our sample by stellar pulsations is provided in Sections 4 and 5.
4. Time-Frequency (“Sonogram”) Analysis
As a further check as to whether the periodicities in the Kepler M-star data are the result of the rotation of spotted stars, we have also carried out sonogram, i.e., time-frequency, analyses. In the present case, short segments of the Kepler time series are Fourier transformed and the amplitudes in each FT are displayed as a function of frequency in a vertical linear strip of a two-dimensional image. The orthogonal coordinate of the image encodes the start times of the data segments. The duration of the individual segments of the time series, and their overlap are parameters that can be adjusted. The image shows how the amplitude of a particular signal evolves with time.
To compute the sonograms, we used the program package TiFrAn (Time Frequency Analysis; Kolláth & Oláh 2009) which allows a time-frequency analysis to be carried out via several different methods. From these possible options, we have chosen the Short-Term Fourier Transform (STFT) to study the rotational periodicities. This procedure yields good resolution in both time and frequency. In particular, each data segment is defined by a Gaussian window function with full width at half maximum (FWHM) of about 30 days, and the centers of the windows of sequential segments are separated by 2 days.
In Fig. 5 we show sonograms for the same four Kepler targets whose full FTs are displayed in Fig. 4. The FT amplitudes of most of the individual frequency components appear to change dramatically and erratically over time, and largely independently of one another. This gives added weight to the hypothesis that these are indeed features due to spots on rotating stars, as opposed to stellar pulsations or other more stable periodicities, e.g., binary modulations.
5. Tracking the Modulation Phases
It would not be surprising to find that starspots produce modulations with phases that are quite variable, as are the amplitudes per the above discussion. Therefore, we devised a way to track the phases of the observed periodicities in order to assess their characteristics and determine whether they suggest an origin in starspots. Because the FTs of the inferred rotationally induced spot modulations have harmonics that fall off rapidly in amplitude with frequency, we model the modulations by just the base frequency and its first harmonic. We can then describe the flux locally in the time series by the expression:
| (2) |
where . For each point in the flux time series, we fit a function of the form given by Eqn. (2) over a short interval of time equal to 2 to 4 base periods of the modulations, depending on the statistical precision that is desired. For periods between 1/4 and 2 days, this corresponds to using between 25 and 400 flux points to determine five unknown parameters, including the phases and . The phases of the base frequency and of its first harmonic are thereby computed for every point in the time series.
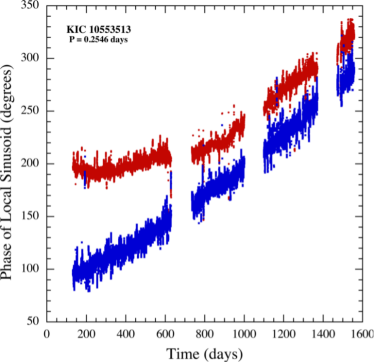
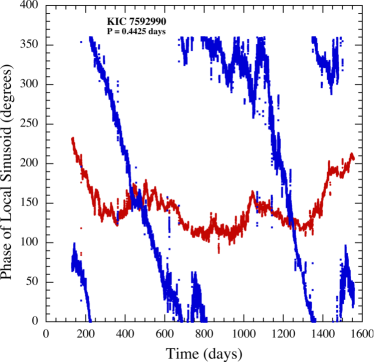
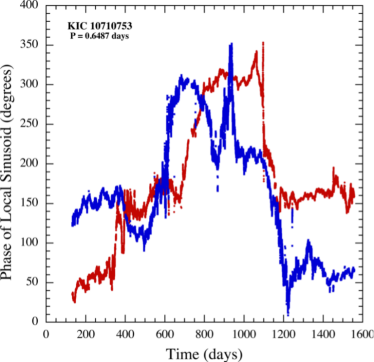
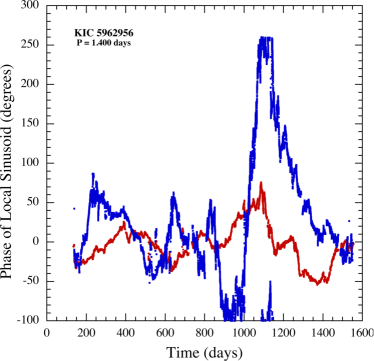
Results of this ‘phase tracking’ are shown in Fig. 6 for four M-star targets for which we found, in each case, a single rotation period in the range from 0.25 to 1.4 days. The phases of the base frequency are plotted in red points while those of the first harmonic are shown in blue. Portions of the phase curves with linear trends indicate times of constant effective frequency; regions with curvature indicate changes in the apparent frequency. These plots tend to exhibit two different signatures that are likely characteristic of transitory, migrating, and differentially rotating starspots: (1) erratic phase behavior, and (2) different phase behavior for the base frequency vs. the first harmonic. The stellar pulsators that we have examined with this same phase-tracking code do not behave in this manner.
More quantitatively, the phase of the modulations can be formally defined as
| (3) |
In terms of the period, this can be written as
| (4) |
where and are the reference frequency and period, respectively. The characteristic timescale for period changes, , can be expressed in terms of as:
| (5) |
As numerical examples, we note that a change in phase of 1 cycle (360∘) over the Kepler mission corresponds to (1500 d)-1 which implies, according to Eqn. (4), a difference in period from the reference period of 0.00017 days (for day). In terms of the implications of curvature in the phase curves, a parabolic arc of 1/6 of a cycle in amplitude occurring over an interval of days corresponds to cycles day-2 with a corresponding value of years.
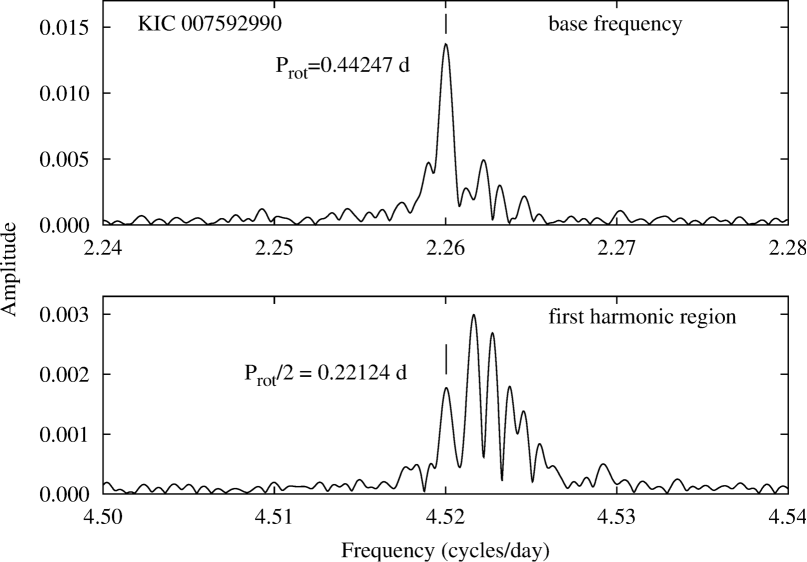
Finally, we note an important property of these “phase curves”. By construction from Eqn. (2), we see that if the second harmonic term is exactly twice the base frequency, then any slopes in the phase curves should bear the relation . However we can see examples in Fig. 6 where this is clearly not the case. For KIC 10553513 the two slopes are nearly the same over the final 800 days of observation, while for KIC 7592990 the mean slope of is substantially larger than twice the mean slope of . This is a direct indication that the first harmonic does not occur at exactly twice the base frequency (see also Fig. 7). Vida & Oláh (2013) and Vida et al. (2014) find that KIC 7592990 has an activity cycle on the timescale of about 520 days inferred from the systematic change of its rotational period due to differential rotation, with an estimated lower limit of (see Eqn. 6). In turn, this likely demonstrates that the second harmonic may arise from spots that are located at both different longitudes and different latitudes, with the attendant differential rotation when latitude differences are present. Clustering of starspots at two active longitudes opposite to each other, on close binaries of dwarf stars, has been theoretically investigated by Holzwarth & Schüssler (2003), showing that with faster rotation the occurrence of this clustering is higher (but the initial parameters of the rising flux tubes also play a significant role).
6. Multiple Period Systems
Upon further careful examination of the FTs of the 178 systems with short rotation periods among the Kepler M stars, we find 30 objects with two or more incommensurate periods, at least one of which has 1 day, and a second that has 2 days. KIC 8416220, discussed above, provides an example of an M star that exhibits two periodicities; see the upper right panel of Fig. 4. Note that the amplitudes of all three visible harmonics at each frequency have very similar amplitudes. The two base frequencies differ by only 20%.
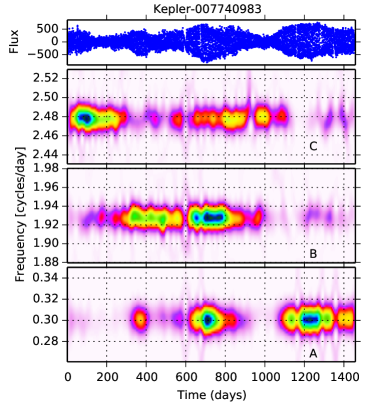
Further scrutiny also reveals several objects with three or more independent short periods, at least one of which has 1 day. One particular example is KIC 7740983 whose FT is shown in the lower left panel of Fig. 4. The three independent frequencies, labeled “”, “”, and “” exhibit 3, 7, and 11 harmonics, respectively, out to 25 cycles/day.
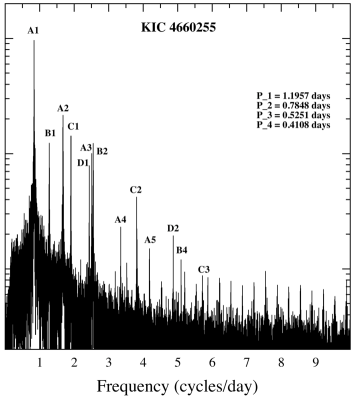
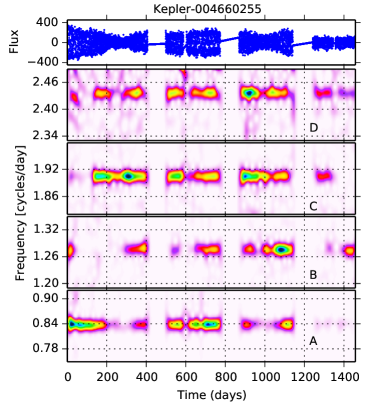
One of the systems whose FT we studied exhibited four independent frequencies: KIC 4660255 (see lower right panel of Fig. 4). All four periods have 1.2 days.
The results of the multiple M-star detections are summarized in Table 2 which lists 37 systems. Of these, 27 have one period with day, another with days, and each independent frequency has at least a base frequency plus the next higher harmonic. For 7 of the other systems listed in Table 2, they satisfy all of these criteria, except that one of the periodicities does not have a detectable harmonic. Finally, a few remaining systems have a second period that is slightly longer than 2 days.
7. Binary and Hierarchical M-Star Systems
We take the presence of two or more periodicities with incommensurate periods, as described in the previous section, as evidence for the presence of two or more rapidly rotating spotted stars within the photometric aperture. This conclusion seems inevitable, since these cases are similar to the cases where only one periodicity is seen in a given target, and since we know of no evidence, for any of these periodicities, that indicates they are due to binary system modulations or stellar pulsations.
A simple statistical argument indicates that most of these targets where two or more periods have been found must consist of multiple physically related stars, i.e., stars in bound systems. Of the approximately 4000 M stars we studied, 200 or % have at least one rotation period shorter than 2 days, and about 100 or % have at least one rotation period shorter than 1 day. Thus, given a Kepler target that exhibits a periodicity with day, the probability that a second periodicity with days will also be apparent is % times the chance that the image of a second M star is in the photometric aperture of the target. The probability of finding two other M stars with days by chance coincidence in the aperture must be lower than 0.3%. If we have examined 110 objects with day, we should have found, by chance, fewer than 5 and 1/4 systems with either 2 or 3 M stars, respectively, in the same Kepler photometric aperture with days. The actual values are 30 and 3 (see Table 2), both significantly in excess of what could be expected by chance. Here we have implicitly assumed that, on average, there is much less than one serendipitously occurring second or third detectable M star in any given photometric aperture.
In the above discussion and probability estimates for finding two or more rapidly rotating stars within the same Kepler photometric aperture, we made the assumption that the second and third stars were also M stars. If we loosen that assumption, then we can draw on the broader statistics about rotation periods in the Kepler sample found by Reinhold, Reiner, & Basri (2013). They identified periodic variations presumably due to spots on rotating stars, and thereby compiled the rotation periods of all active Kepler stars. Out of their sample of 21,100 stars, they found 925 with periods days. Thus, rapidly rotating stars comprise only 4.5% of stars across the spectral types studied by Kepler. This is essentially the same value as we found for our M-star sample, and thus the statistical argument presented above is again applicable, i.e., there is a rather low probability of finding additional rapidly rotating active stars with any of a range of spectral types in the same aperture as the first M star with a short period.
We therefore adopt the working hypothesis that each M star target having a detected periodicity with day and also one or more additional incommensurate rotational periodicities with , must actually consist of multiple M stars bound in a single system.
Finally, we note that 12 of the 37 systems listed in Table 2 have two short periods that are similar, i.e., they differ by no more than 4% to 25%. There is one system where two periods differ by only 1%. This phenomenon can have two explanations. The first is that the two periods originate in an M-star binary with two nearly equal mass stars of essentially the same age and spin-down history. Thus, perhaps the closeness of a pair of rotation frequencies is not at all unexpected.
The second possibility would be that two close periods come from spots at different latitudes of a single star that is undergoing differential rotation. Reinhold et al. (2013) have carried out an extensive study of differential rotation in 40,660 active Kepler stars. In some 18,600 of these stars they find two or more close rotation periods which they take as evidence of differential rotation and which they then use to derive limits on the differential rotation properties. Their Fig. 15 summarizes the measured horizontal shear differential rotation parameter , which is defined as the difference in rotation frequency between the equator and the pole. For stars hotter than 6000 K, values of are often found to exceed 0.2 rad d-1. However, for cool stars, of the type we are studying here, averages about 0.07 rad d-1 and only rarely exceeds 0.1 rad d-1. We translate this to a fractional differential rotation parameter, , for cool stars of arbitrary rotation rate:
| (6) |
where is the equatorial rotation frequency of the star, and . If this relation indeed holds down to short periods (e.g., 1/2 day), then it implies that any two short periods we detect which are different by more than a few percent are not likely due to differential rotation.
In any event, the possibility that some of the periodicities we see may arise on the same star should be kept in mind, though we do not expect this to be the situation in many cases. Future tests with high resolution AO imaging and ground-based spectroscopy can be of further help for checking this possibility.
Reinhold et al. (2013) also show (in their Fig. 8) that there is a strong trend for stars that are of spectral type F and earlier to rotate more rapidly than cooler stars which are presumably braked by magnetically constrained stellar winds (see, e.g., Mestel 1968; Skumanich 1972; Smith 1979; Zwaan 1981; Verbunt & Zwaan 1981). Such magnetic braking likely requires dynamo activity that is stronger in stars with convective envelopes. Therefore, according to Barnes & Sofia (1996) and Barnes (2007), M stars that are rotating with periods shorter than 2 days are probably relatively young, i.e., one to a few hundred Myr (see also Sect. 10).
An alternative to the “youth hypothesis” is that the short periods we see are indeed due to spots on rotating stars, but in tidally locked close binaries. One such example is V405 And with active components consisting of M0V+M5V spectral types and rotational/orbital periods of 0.465 day (Vida et al. 2009). Since the light curves of our short period systems do not exhibit obvious eclipses or ellipsoidal light variations222In ellipsoidal variations the main peak in the FT occurs at twice the orbital frequency, , with very small contributions at , and . We see no such cases. There is also the possibility that the amplitudes at and are too low to be detected, leaving only the peak at . Several cases of frequencies with no other harmonics are indeed seen, but these are clearly marked in Table 2., this would imply that we are viewing the systems at small orbital inclination angles. However, that would make the situation even more extreme in the sense that each such short period would itself require a binary. Thus, in systems where we see three or four short periods, this hypothesis would require 6-8 bound stars, which is rather implausible.
8. Imaging Evidence for Multiplicity
8.1. UKIRT Images
We have inspected the UKIRT J-band images333http://keplerscience.arc.nasa.gov/ToolsUKIRT.shtml for the 37 systems listed in Table 2 which exhibit two to four rotation periods. In general, for the UKIRT images of the Kepler field, one can easily distinguish two stars of comparable brightness that are separated by , while for objects separated by less than , there is a single image. Often, it is possible to discern that the image is elongated for stellar separations as small as . Nineteen of the UKIRT J-band frames appear to show single stellar images. However, 11 show an apparent companion, or more than one companion, with a separation of , while 7 of these have separations . Thus, there is tentative evidence for multiplicity in the UKIRT images of of the systems in Table 2.
In reviewing the evidence, it is good to keep in mind that a separation of 1 at typical distances of 200 pc corresponds to a physical separation of 200 AU. If, for sake of argument, bound stellar pairs are taken to have orbital separations between 0.01 AU and AU that are distributed uniformly in terms of the logarithms of the separations (e.g., Dhital et al. 2010), then fewer than half of them will have orbital separations AU. Thus, the UKIRT image multiplicity numbers noted above do not rule out the possibility that all of the 37 multiple M-star candidates are in bound hierarchical systems (see e.g., Sect. 8.2 for some examples of closer pairs).
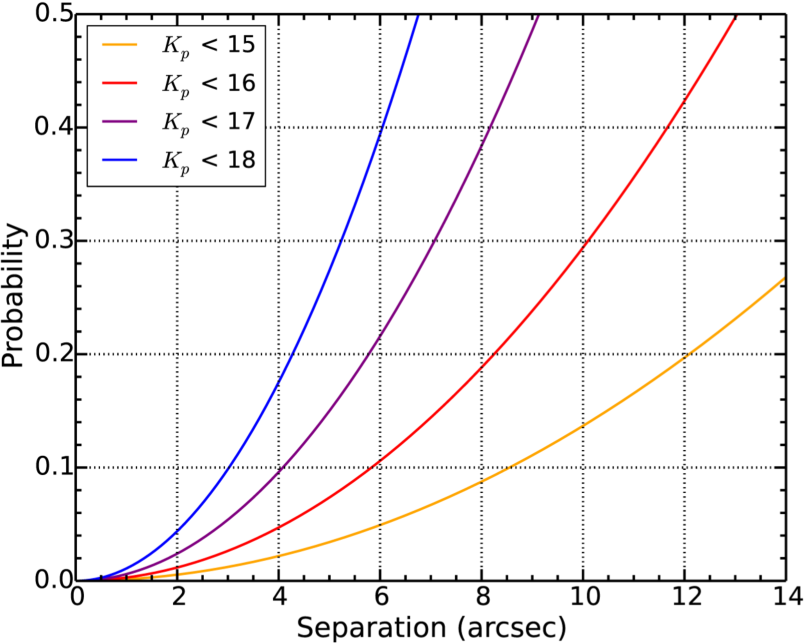
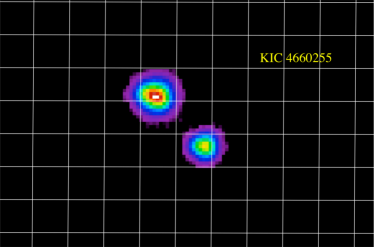
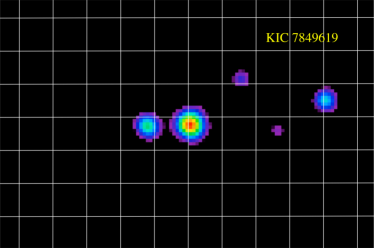
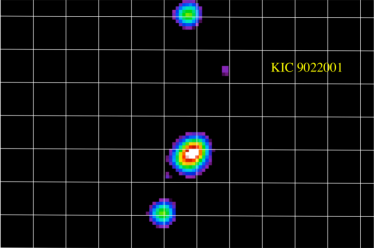
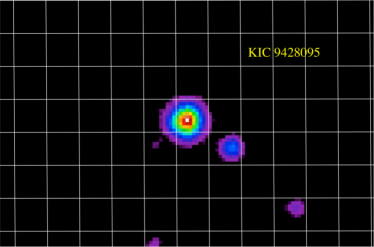
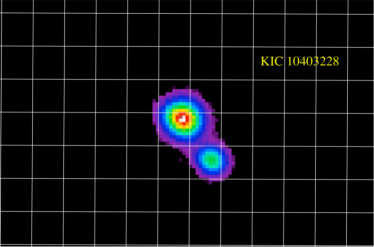
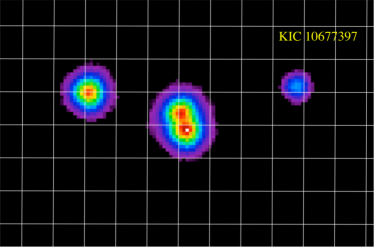
In Fig. 8 we present six examples of multiple M-star candidates that show direct evidence for multiple stellar images within the Kepler photometric aperture. These systems are: KIC 4660255, 7849619, 9022001, 9428095, 10403228, and 10677397, and they are included in Table 2 along with their periods. The Kepler magnitudes of these stars range from 15.3-16.1. The magnitudes and densities of stellar images in Fig. 8 indicate that most of these pairs of images are likely to be physically related as opposed to chance alignments. In Fig. 9 we show the probability of interlopers (i.e., background or foreground stars) coming within a given angular distance of any particular Kepler target star. These estimates were obtained by calculating a uniform stellar density from the 10th release of the Kepler Input Catalog (KIC10)444https://archive.stsci.edu/kepler/kic10/search.php. for a given magnitude limit within a 115 square degree field of view (Borucki et al. 2010). The mean stellar densities are likely slight overestimates since the KIC10 catalog includes roughly 36,000 calibration stars outside the Kepler field of view. Although the stellar density is not uniform over Kepler’s field of view—rather it varies with Galactic latitude—the distribution of our multi-period sources are uniform in Galactic latitude supporting our conclusion that the multi-period sources are most likely bound companions rather than interlopers. We can see from Fig. 9 that for stars comparable to, or up to 1-2 magnitudes fainter than, our = 15-16 magnitude target M stars, it is worth considering stars out to 5′′ as possibly physically related to the M star in question.
The white grid lines in Fig. 8 are drawn with a spacing of . The images have been slightly smoothed with a 2D Gaussian with . KIC 7849619, KIC 9428095, and KIC 10403228 appear as fairly close doubles with separations of . KIC 10677397 has a barely resolved stellar core (separation ) and has two possible stellar companions at 6′′ and . KIC 9022001 and KIC 4660255 are apparent doubles separated by , and, in each case, the brighter star is elongated and may itself be a binary. Finally, we remind the reader that KIC 4660255 is the remarkable object that exhibits four independent periods, all days. This target is discussed in detail in Section 9.
Some of these separations seen in the UKIRT images are sufficiently large, i.e., , that the point-spread-function (“PSF”) fitting technique (Still & Barclay 2013) may be useful for identifying which of the stellar images is the source of a particular periodicity. This method is applied to KIC 4660255 in Section 9.
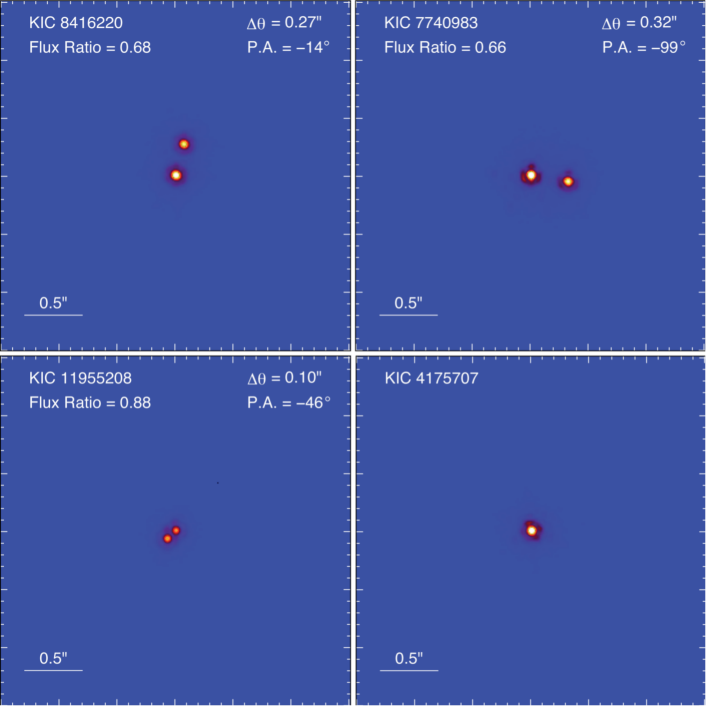
8.2. Keck AO Images
Images of four targets in our sample were obtained with the NIRC2 camera using the Keck II adaptive optics (AO) system during the past ground-based observing season for the Kepler field. We observed KIC 4175707, KIC 11955208, and KIC 8416220 on 2013 May 30 (UT) using the laser guide star to close the AO system control loops (Wizinowich et al. 2006). The targets were imaged in at low air mass () using a 3-point dither pattern with dither spacings. Three images were obtained at each dither position with integration times of 2, 3, and 2 s incorporating 10, 5, and 10 coadds per frame for a total integration time per target of 180, 135, and 180 s, respectively. KIC 7740983 was imaged on the night of 2013 August 18 with Keck II/NIRC2 natural guide star AO (Wizinowich et al. 2000) in the band. The same 3-point dither was performed for this target with 3-s integrations, and 10 coadds per frame for a total integration time of 180 s.
Each dither frame was corrected for bad pixels, sky subtracted, and flat fielded. Centroids were obtained by fitting the core of the Airy pattern with a two dimensional Gaussian function. The final images in Figure 10 show the medians of the aligned dither stacks for each target.
Each of these four targets shows a pair of rotation periods (in days) that are shorter than 1 day, viz., {0.57,0.72}, {0.40,0.52}, {0.56,0.70}, and {0.34,0.42}, for KIC 8416220, KIC 7740983, KIC 11955208, and KIC 4175707, respectively. Amazingly, three of the four systems show close twin pairs of M stars in what are almost certainly bound binaries if not higher-order multiples. Only KIC 4175707 still appears single at the level.
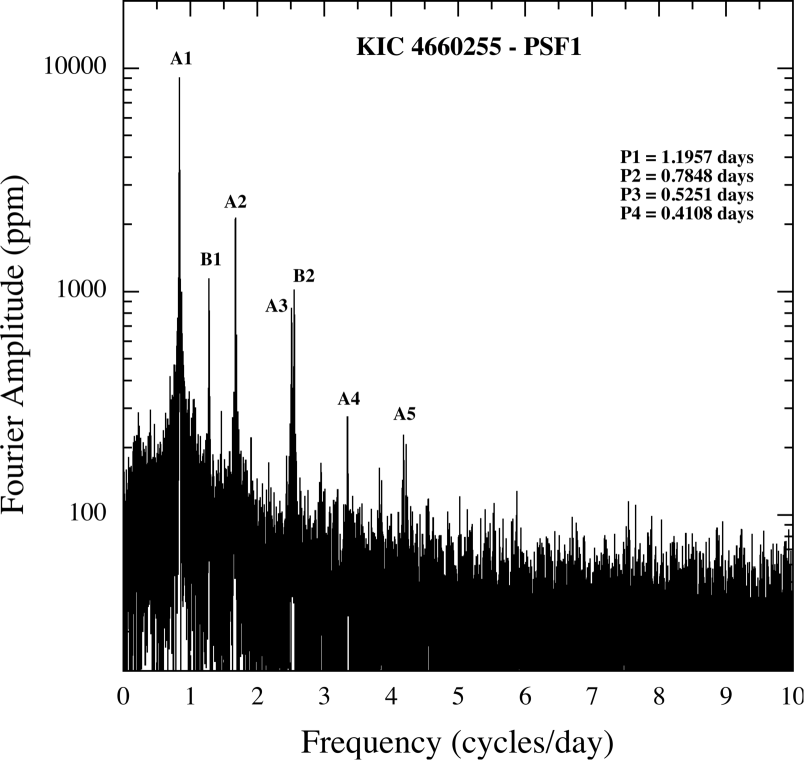
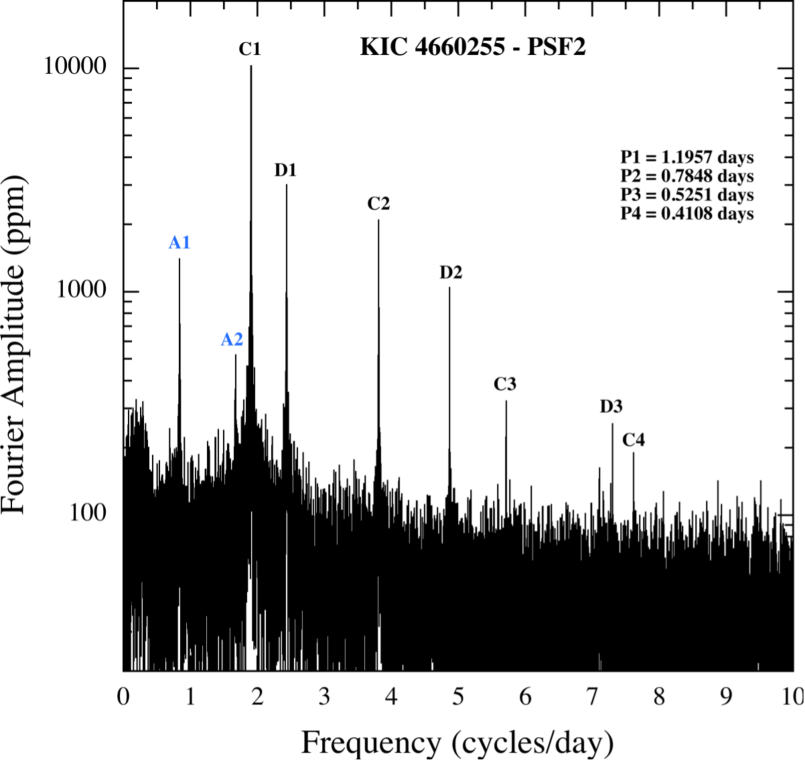
9. Special Case of KIC 4660255
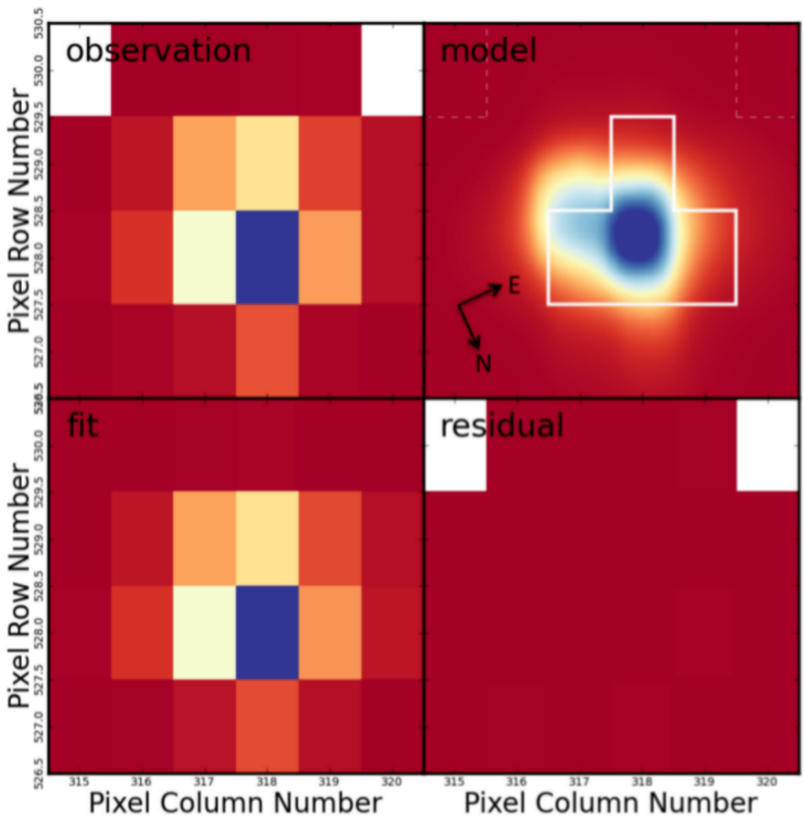
In this section we examine KIC 4660255, which exhibits four rotational periodicities all with periods shorter than 1.2 days. As the upper left panel of Fig. 8 shows, at the location of KIC 4660255 there are two point-like images that are separated by 4.2′′, and, hence, are well within the photometric aperture. Still & Barclay (2014) have devised a point-spread function (“PSF”) fitting technique that can utilize data at the pixel level to compute light curves for each of several stars within the photometric aperture. In brief, we assume here that the two stars can be characterized as two point-spread-functions with two unknown fluxes and shifts of the photometric aperture relative to the sky, and (see Fig. 11). We then minimize upon the uncertainty-weighted residuals between the pixel-level data and the fit in order to yield the flux and pixel position of both stars for every one of 48,100 exposures across quarters Q1-16. This technique was demonstrated in the case of KOI 2700 to determine which of two stars within the photometric aperture was the source of planet transits (Rappaport et al. 2013).
We have carried out a PSF analysis for KIC 4660255 to try to identify from which of the two well-separated images (see Fig. 8) the various rotation frequencies arise. We show in Fig. 11 an example of a single frame of pixel-level data for this object. The upper left panel shows the Kepler pixels within the pixel mask for KIC 4660255 for a single frame of the 50,575 available for this object. The best fitting PSF model, comprised of two stars, is shown in the upper right panel. When this model is integrated over the pixels, the “fit” is shown in the lower left panel. The residuals with respect to the data from that frame, are shown in the lower-right panel. This process was repeated for each of the 50,575 frames for KIC 4660255, thereby yielding two photometric time series, one for each star.
The resultant FTs for the time series extracted from the two stars within the aperture of KIC 4660255 are shown in Fig. 12. The top panel shows the FT for the brighter of the two stars (the more northerly one). Only the and frequencies are present at a detectable level. The corresponding periods are 1.1958 days and 0.7859 days. No evidence is seen for the shorter and periods. In contrast, the bottom panel in Fig. 12 shows the and periods, 0.5251 and 0.4108 days, very clearly. In addition, the first two harmonics of the periodicity leak through weakly – at about 1/5 of the amplitude that they exhibit in the upper panel. Thus, the PSF fitting technique appears to have cleanly distinguished the four periodicities as being from two different stellar sources. In turn, we can marginally discern from Fig. 8 that the northerly image which is host to periods and likely comprises two images, and we propose that each of those is the source of one of the and periods. By analogy, we hypothesize that the fainter, more southerly image is itself a binary, each star of which is rotating with the or period.
10. Summary and Conclusions
In this work we have searched the Kepler photometric data base of M stars for short rotation periods. We found 178 Kepler targets with 211 different periods of days and 110 systems with 127 different periods with day. Some 30 of these objects exhibit two or more rotation periods where at least one has day and the other has days. We also find several systems with three or more rotation periods where at least one has day and the others have day. There are a sufficient number of these with more than one short rotation period to allow us to argue that they are likely young, physically related, binary or hierarchical triple systems.
At least 6, and perhaps as many as 14, of these M-star systems show, in the UKIRT Kepler region survey J-band images, multiple stellar images555These 14 systems are ones with another stellar image within of the target and within . that may represent physically related stars. Three more systems were clearly resolved in Keck AO images of four systems. These are almost certainly physically bound twin M-star binaries. It seems quite likely that additional AO imaging in the future will reveal that more of these 30 multiple-period systems contain multiple stellar images. Spectroscopy could further reveal closer binary members.
If most of these M-star systems with multiple short periods indeed turn out to be multiple bound M-stars, this could prove a valuable way of discovering young hierarchical M-star systems. We suggest that this approach may also be applicable to K and G stars.
In the process of conducting this study we found that approximately 5% of all M stars are rotating with periods shorter than 2 days. If we utilize standard models of contraction onto the main sequence, with the consequent spinup of the star due to conservation of angular momentum, and the loss of systemic angular momentum due to magnetic braking (see, e.g., Kawaler 1988; Chaboyer et al. 1995; Barnes & Sofia 1996; Irwin et al. 2011) we can check whether M stars spend sufficient time rotating rapidly to allow for 5% of them to have days. These models typically take the magnetic braking torque to be proportional to when , where is a “saturation” frequency, above which the torque is proportional to . As an example of a model spin history of an M star, see Fig. 13 of Irwin et al. (2011; dashed curve). We see that a minimum rotation period of 0.3 days is attained at 10 Myr, and the period lengthens to more than 1 day at 300 Myr and 2 days at 400 Myr. Thus, at least for this specific example, which involves numerous uncertainties, the fraction of time that a year old M star has spent with days is about 4% of its lifetime. This is reassuringly consistent with the fraction of M stars that we find are rotating rapidly.
References
- Baraffe et al. (2002) Baraffe, I., Chabrier, G., Allard, F., & Hauschildt, P.H. 2002, A&A, 382, 563
- Barban et al. (2013) Barban, C., Beuret, M., Baudin, F., Goupil, M.-J., Samadi, R. 2013, J. Phys. Conf. Ser., 440, 012031
- Barnes & Sofia (1996) Barnes, S., & Sofia, S. 1996, ApJ, 462, 746
- Barnes (2007) Barnes, S.A. 2007, ApJ, 669, 1167
- Batalha et al. (2010) Batalha, N.M., Borucki, W.J., Koch, D.G. et al. 2010, ApJ, 713, 109
- Batalha et al. (2011) Batalha, N. M., Borucki, W. J., Bryson, S. T., et al. 2011, ApJ, 729, 27
- Batalha et al. (2013) Batalha, N.M., Rowe, J.F., Bryson, S.T., et al. 2013, ApJS, 204, 24
- Bedding (2011) Bedding, T. 2011, arXiv:1107.1723
- Birkby et al. (2012) Birkby, J., Nefs, B., Hodgkin, S., et al. 2012, MNRAS., 426, 1507
- Borucki et al. (2010) Borucki, W.J., Koch, D., Basri, G., et al. 2010, Sci, 327, 977
- Borucki et al. (2011) Borucki, W.J., Koch, D.G., Basri, G. 2011, ApJ, 736, 19
- Boyajian et al. (2012) Boyajian, T.S., von Braun, K., van Belle, G., et al. 2012, ApJ, 757, 112
- Brown et al. (1991) Brown, T.M., Gilliland, R.L., Noyes, R.W., et al. 1991, ApJ, 368, 599
- Brown et al. (2011) Brown, T.M., Latham, D.W., Everett, M.E., & Esquerdo, G.A. 2011, AJ, 142, 112
- Bryson et al. (2013) Bryson, S. T., Jenkins, J. M., Gilliland, R. L., et al. 2013, arXiv:1303.0052
- Burke et al. (2013) Burke, C.J., Bryson, S.T., Mullally, F., et al. 2013, submitted to ApJ, arXiv: 1312.5358
- Chaboyer et al. (1995) Chaboyer, B., Demarque, P., & Pinsonneault, M. H. 1995, ApJ, 441, 865
- Chabrier (2003) Chabrier, G. 2003, PASP, 115, 763
- Collier Cameron (2007) Collier Cameron, A. 2007, 328, 1030
- Corsaro et al. (2013) Corsaro, E., Fröhlich, H.E., Bonnano, A., et al. 2013, MNRAS, 430, 2313
- Cruz et al. (2002) Cruz, K.L., & Reid, I.N. 2002, AJ, 123, 2828
- Delfosse et al. (1998) Delfosse, X., Forveille, T., Perrier, C., & Mayor, M. 1998, A&A, 331, 581
- Dhital et al. (2010) Dhital, S., West, A.A., Stassun, K.G., & Bochanski, J.J. 2010, AJ, 139, 2566
- Dressing & Charbonneau (2013) Dressing, C.D., & Charbonneau, D. 2013, ApJ, 767, 95
- Duchene & Kraus (2013) Duchêne, G. & Kraus, A. 2013, ARA&A, 51, 269
- Henry et al. (1994) Henry, T.J., Kirkpatrick, J.D., & Simons, D.A. 1994, AJ, 108, 1437
- Henry et al. (2006) Henry, T.J., Jao, W.-C., Subasavage, J.P., Beaulieu, T.D., Ianna, P.A., Costa, E., & Méndez, R.A. 2006, ApJ, 132, 2360
- Holzwarth & Schussler (2003) Holzwarth, V. & Schüssler, M. 2003, A&A, 405, 303
- Irwin et al. (2011) Irwin, J., Berta, Z.K., Burke, C.J., Charbonneau, D., Nutzman, P., West, A.A., & Falco, E.E. 2011, ApJ, 727, 56
- Jenkins et al. (2010) Jenkins, J. M., Borucki, W. J., Koch, D. G., et al. 2010, ApJ, 724, 1108
- Kawaler (1998) Kawaler, S. D. 1998, ApJ, 333, 236
- Kjeldsen & Bedding (1995) Kjeldsen, H. & Bedding, T.R. 1995, A&A, 293, 87
- Koch et al. (2010) Koch, D.G., Borucki, W., Basri, G. et al. 2010, ApJ, 713, L79
- Kollath & Olah (2009) Kolláth, Z., Oláh, K. 2009, A&A 501, 695
- Kuker & Rudiger (2011) Küker, M, & Rüdiger, G. 2011, AN, 332, 933
- Lee et al. (2001) Lee, Y.-W., Ree, C. H., Lejeune, T., & Barnes, S. 2001, ApJS, 136, 417
- Lissauer et al. (2012) Lissauer, J. J., Marcy, G. W., Rowe, J. F., et al. 2012, ApJ, 750, 112
- Mann et al. (2012) Mann, A.W., Gaidos, E., Lépine, S., & Hilton, E.J. 2012, 753, 90
- Mann et al. (2013) Mann, A.W., Gaidos, E., Kraus, A., & Hilton, E.J. 2013, submitted to ApJ, arXiv:1304.7269
- Marcus et al. (2010) Marcus, R.A., Sasselov, D., Hernquist, L., & Stewart, S.T. 2010, ApJ, 712, L73
- Matijevic et al. (2012) Matijevič, G., Prša, A., Orosz, J.A., Welsh, W.F., Bloemen, S., & Barclay, T. 2012, AJ, 143,123
- McQuillan et al. (2013) McQuillan, A., Aigrain, S., & Mazeh, T. 2013, MNRAS, 432, 1203
- Mestel (1968) Mestel, L. 1968, MNRAS, 138, 359.
- Morton & Swift (2013) Morton, T.D., & Swift, J.J. 2013, arXiv: 1303.3013
- Muirhead et al. (2012a) Muirhead, P.S., Hamren, K., Schlawin, E., Rojas-Ayala, B., Covey, K.R., & Lloyd, J.P. 2012, ApJ, 750, L37
- Muirhead et al. (2012b) Muirhead, P. S., Johnson, J. A., Apps, K., et al. 2012, ApJ, 747, 144
- Olah et al. (2003) Oláh, K., Jurcsik, J., Strassmeier, K.G. 2003, A&A 410, 685
- Rappaport et al. (2013) Rappaport, S., Barclay, T., DeVore, J., Rowe, J., Sanchis-Ojeda, R., & Still, M. 2014, ApJ, 784, 40
- Reid et al. (2002) Reid, R.I., Gizis, J.E., & Hawley, S.L. 2002, AJ, 124, 2721
- Reiners (2006) Reiners, A. 2006, A&A, 446, 267
- Reinhold et al. (2013) Reinhold, T., Reiners, A., & Basri, G. 2013, A&A, 560, 4
- Rodriguez-Lopez et al. (2012) Rodríguez-López, C., MacDonald, J., & Moya, A. 2012, MNRAS, 419, 44
- Rodriguez-Lopez et al. (2013) Rodríguez-López, C., MacDonald, J., Amado, P.J., Moya, A., & Mullan D. 2013, MNRAS.tmp.2985; arXiv: 1312.2743
- Sanchis-Ojeda et al. (2013) Sanchis-Ojeda, R., Rappaport, S., Winn, J.N., Levine, A., Kotson, M.C., Latham, D. & Buchhave, L. A. 2013, ApJ, 774, 54
- Shulyak et al. (2011) Shulyak, D., Seifahrt, A., Reiners, A., Kochukhov, O. & Piskunov, N. 2013, submitted to MNRAS, arXiv: 1108.3465
- Skumanich (1972) Skumanich, A. 1972, Ap.J., 171, 565
- Sotin et al. (2007) Sotin, C., Grasset, O., & Mocquet, A. 2007, Icar, 191, 337
- Smith (1979) Smith, M.A. 1979, PASP, 91, 737
- Smith et al. (2012) Smith, J. C., Stumpe, M. C., Van Cleve, J. E., et al. 2012, PASP, 124, 1000
- Still & Barclay (2012) Still M., & Barclay T., 2013, in preparation
- Stumpe et al. (2012) Stumpe, M. C., Smith, J. C., Van Cleve, J. E., et al. 2012, PASP, 124, 985
- Swift et al. (2013) Swift, J. J., Johnson, J. A., Morton, T. D., et al. 2013, ApJ, 764, 105
- Torres & Gimenez (2010) Torres, G., & Giménez, A. 2010, A&ARv, 18, 67
- Tran et al. (2013) Tran, K., Levine, A., Rappaport, S., Borkovits, T., Csizmadia, Sz., & Kalomeni, B. 2013, ApJ, 774, 81
- Verbunt & Zwaan (1981) Verbunt, F., & Zwaan, C. 1981, A&A, 100, L7
- Vida et al. (2009) Vida,K., Oláh,K., Kővári, Zs., Korhonen, H., Bartus, J., Hurta, Zs., Posztobányi, K. 2009, A&A 504, 1021
- Vida & Olah (2013) Vida,K. & Oláh,K. 2013, eprint arXiv:1308.2641
- Vida et al. (2014) Vida,K., Oláh,K., & Szabó, R. 2014, MNRAS, in press (arXiv: 1404.4359)
- Wizinowich et al. (2000) Wizinowich, P., Acton, D. S., Shelton, A.H. 2000, PASP, 112, 315
- Wizinowich et al. (2006) Wizinowich, P.L., Le Mignant, D., Bouchez, C. 2006, PASP, 118, 297
- Zwaan (1981) Zwaan, C. 1981, in Solar Phenomena in Stars and Stellar Systems, eds. R.M.Bonnet & A.K. Dupree (D. Reidel; Dordrecht), p. 463.
| KIC | Period | KIC | Period | KIC | Period | KIC | Period |
|---|---|---|---|---|---|---|---|
| 1572802 | 0.3711 | 6592335 | 0.4119 | 8565914 | 1.4183 | 10790812 | 1.0629 |
| 2300039 | 1.7083 | 6664639 | 1.4482 | 8611876 | 1.5797 | 10790838 | 0.9173 |
| 2449101 | 0.7399 | 6715960 | 0.9185 | 8672278 | 1.8549 | 10796551 | 1.1485 |
| 2557669 | 1.8595 | 6752578 | 0.2601 | 8673358 | 1.0292 | 10803430 | 1.5207 |
| 3130391 | 1.2301 | 6762389 | 0.3855 | 8681527 | 0.5775 | 10975238 | 1.9487 |
| 3439791 | 0.4321 | 6928206 | 1.2839 | 8873575 | 0.6702 | 11031746 | 1.2109 |
| 3454793 | 0.6682 | 6936046 | 0.5274 | 8909833 | 1.2812 | 11042875 | 1.5658 |
| 3642335 | 0.6725 | 6949412 | 1.6453 | 8935942 | 1.6582 | 11091336 | 1.1947 |
| 3732401 | 1.7990 | 7110077 | 0.9717 | 9022001 | 0.6989 | 11124203 | 0.9596 |
| 3748172 | 1.0516 | 7269729 | 0.3346 | 9041966 | 0.1477 | 11140425 | 1.1879 |
| 3757251 | 0.2158 | 7431659 | 1.0507 | 9075708 | 0.5131 | 11147271 | 1.8794 |
| 3831911 | 0.5621 | 7434110 | 0.4014 | 9083354 | 1.1341 | 11189348 | 0.5060 |
| 3935499 | 0.9214 | 7445605 | 1.0782 | 9091897 | 0.2399 | 11305240 | 0.7808 |
| 3962433 | 0.4025 | 7448057 | 0.3873 | 9142641 | 1.3747 | 11343461 | 1.6167 |
| 4036313 | 1.5816 | 7449695 | 0.5610 | 9142714 | 1.1285 | 11349556 | 1.6941 |
| 4077867 | 0.4777 | 7547969 | 0.6802 | 9205855 | 0.9144 | 11390683 | 1.1295 |
| 4246255 | 1.3177 | 7592990 | 0.4426 | 9268481 | 0.5802 | 11446073 | 1.0393 |
| 4264634 | 0.7541 | 7678417 | 0.6267 | 9335198 | 0.2898 | 11447564 | 0.3812 |
| 4473355 | 0.2060 | 7686474 | 1.4843 | 9395840 | 1.0973 | 11498106 | 0.5708 |
| 4545041 | 0.3326 | 7733540 | 1.5488 | 9479539 | 1.8576 | 11521274 | 0.6653 |
| 4660255 | 0.4109 | 7740983 | 0.4036 | 9519275 | 0.5797 | 11605209 | 1.8622 |
| 4951466 | 0.1349 | 7741987 | 1.2612 | 9590249 | 0.2642 | 11668095 | 0.9156 |
| 5083330 | 1.9550 | 7743830 | 0.3749 | 9702550 | 1.6270 | 11702167 | 0.3798 |
| 5095098 | 0.7414 | 7800087 | 0.4722 | 9705079 | 0.5377 | 11722217 | 0.1643 |
| 5182822 | 0.3391 | 7847566 | 0.3806 | 9761113 | 0.6806 | 11760021 | 0.7565 |
| 5184487 | 1.1051 | 7849619 | 0.3092 | 9784820 | 1.1005 | 11855334 | 0.8173 |
| 5341666 | 0.3631 | 7973675 | 0.4572 | 9899900 | 0.4145 | 11855853 | 1.4325 |
| 5360129 | 1.3519 | 8012943 | 0.5726 | 9933464 | 1.2234 | 11876220 | 1.4600 |
| 5435958 | 0.8370 | 8057610 | 1.7332 | 9992083 | 0.4197 | 11955208 | 0.5637 |
| 5621528 | 0.7991 | 8075991 | 1.2932 | 10027247 | 0.5887 | 12022407 | 0.7976 |
| 5685704 | 0.5129 | 8098178 | 0.9874 | 10324374 | 1.7311 | 12058533 | 0.3442 |
| 5771150 | 0.5049 | 8098228 | 0.5472 | 10384891 | 0.4079 | 12060710 | 0.3788 |
| 5937264 | 0.6037 | 8107903 | 1.5406 | 10403228 | 0.2369 | 12105694 | 1.9567 |
| 5938531 | 0.8800 | 8150479 | 0.3805 | 10412044 | 1.4002 | 12105867 | 1.1736 |
| 5951140 | 1.0551 | 8183594 | 0.2980 | 10462462 | 0.8696 | 12203082 | 0.5263 |
| 5952378 | 0.4528 | 8248415 | 0.9892 | 10469305 | 0.8971 | 12207432 | 1.6982 |
| 5962956 | 1.3998 | 8257134 | 0.2995 | 10515986 | 0.7472 | 12258225 | 0.9423 |
| 6102091 | 0.5162 | 8325962 | 0.5721 | 10518758 | 1.3394 | 12304013 | 0.3498 |
| 6117832 | 0.6047 | 8414250 | 0.7446 | 10536761 | 1.0255 | 12356535 | 0.8096 |
| 6122790 | 1.1193 | 8415004 | 1.2297 | 10552016 | 1.5089 | 12365719 | 0.8521 |
| 6183736 | 1.1819 | 8416220 | 0.5660 | 10553513 | 0.2547 | 12505054 | 0.4397 |
| 6370174 | 0.8606 | 8417053 | 1.4751 | 10584063 | 1.4280 | 12784183 | 0.2087 |
| 6425928 | 0.3255 | 8447096 | 1.2361 | 10587237 | 0.9603 | 12835232 | 1.8951 |
| 6469920 | 0.9717 | 8454353 | 1.4905 | 10677397 | 0.3115 | ||
| 6529445 | 0.2231 | 8474897 | 0.9954 | 10710753 | 0.6493 |
Note. — 178 Kepler targets exhibiting at least one starspot rotation period shorter than 2 days. If more than one period is present, only the shortest period is listed here. Periods are in days. For systems with more than one short rotation period see Table 2
| Object | Imaging | ||||||||
|---|---|---|---|---|---|---|---|---|---|
| (1) | (2) | (3) | (4) | (5) | (6) | (7) | (8) | (9) | (10) |
| 3454793 | 19h 36m 49.43s | 38d 31m 47.50s | 15.5 | 3431 | 0.6681 | 0.9673 | … | … | UKIRT: elongated (?) |
| 3757251 | 19h 36m 14.20s | 38d 50m 19.25s | 15.8 | 3623 | 0.2158 | 0.4485 | 15.40 | … | UKIRT: 2.6′′ & 4.2′′ |
| 3831911 | 19h 00m 13.23s | 38d 59m 06.04s | 15.0 | 3953 | 0.5670 | 1.8343 | 30.484† | … | UKIRT: 4.0′′ |
| 3962433 | 19h 34m 28.26s | 39d 01m 38.78s | 15.8 | 3741 | 0.4024 | 0.6378 | … | … | UKIRT: single |
| 4077867 | 19h 45m 41.35s | 39d 06m 34.56s | 15.8 | 3490 | 0.4776 | 0.9798 | 19.35 | … | UKIRT: 4.0′′ |
| 4175707 | 19h 42m 47.72s | 39d 16m 00.66s | 15.0 | 3825 | 0.3406 | 0.4163 | … | … | Keck AO: single |
| 4264634 | 19h 28m 34.15s | 39d 18m 00.76s | 14.8 | 3939 | 0.7536 | 0.8865 | 12.38 | … | UKIRT: single |
| 4545041 | 19h 04m 19.82s | 39d 37m 18.16s | 15.9 | 3329 | 0.3321 | 0.4045 | … | … | UKIRT: single |
| 4660255 | 19h 33m 17.12s | 39d 42m 32.62s | 15.4 | 3917 | 0.4108 | 0.5251 | 0.7859 | 1.1958 | UKIRT: elongated & 4.2′′ |
| 5182822 | 19h 22m 00.25s | 40d 22m 13.08s | 15.7 | 3900 | 0.3390 | 1.1660 | 15.51 | … | UKIRT: single |
| 6425928 | 19h 01m 05.40s | 41d 51m 29.38s | 14.5 | 3862 | 0.3254 | 0.3942 | 2.4018 | 2.9842 | UKIRT: single |
| 6529445 | 19h 36m 05.46s | 41d 56m 23.42s | 15.7 | 3746 | 0.2231 | 0.2362 | … | … | UKIRT: elongated & 4.7′′ |
| 6936046 | 19h 10m 16.10s | 42d 26m 36.49s | 15.0 | 3772 | 0.5273 | 1.2327 | 13.21 | … | UKIRT: |
| 7110077 | 19h 17m 35.66s | 42d 41m 37.28s | 15.6 | 3598 | 0.9716 | 1.0390 | 22.08 | … | UKIRT: 2 faint compan. at 1.3′′ |
| 7434110 | 19h 13m 24.06s | 43d 02m 47.00s | 16.0 | 3311 | 0.4014 | 1.8070 | … | … | UKIRT: single |
| 7448057 | 19h 31m 04.12s | 43d 05m 54.96s | 15.6 | 3500 | 0.3872* | 1.9594 | … | … | UKIRT: single |
| 7449695 | 19h 32m 58.53s | 43d 04m 42.92s | 16.0 | 3787 | 0.5609 | 1.6635 | … | … | UKIRT: single |
| 7740983 | 19h 07m 57.37s | 43d 29m 56.08s | 14.7 | 3727 | 0.4036 | 0.5190 | 3.33 | … | Keck AO: 0.32′′ binary |
| 7849619 | 19h 58m 02.71s | 43d 34m 02.06s | 15.5 | 3799 | 0.3092 | 0.3298 | 12.91 | … | UKIRT: 2.6′′ |
| 7973675 | 19h 45m 11.65s | 43d 45m 26.50s | 15.1 | 3506 | 0.4572 | 0.7764 | 17.40 | … | UKIRT: single |
| 8325962 | 19h 58m 46.21s | 44d 15m 05.62s | 15.0 | 3946 | 0.1690∗ | 0.5719 | 7.721 | 12.34 | UKIRT: 6.3′′ |
| 8416220 | 19h 00m 57.66s | 44d 28m 27.91s | 15.1 | 3227 | 0.5659 | 0.7151 | … | … | Keck AO: 0.27′′ binary |
| 8701179 | 19h 44m 31.15s | 44d 53m 48.08s | 15.9 | 3900 | 0.7046 | 0.7874 | 16.18 | … | UKIRT: single |
| 8873575 | 19h 07m 14.00s | 45d 07m 40.12s | 16.5 | 3906 | 0.6737 | 1.0226 | 11.88 | … | UKIRT: single |
| 8909833 | 19h 57m 23.98s | 45d 09m 38.92s | 15.6 | 3903 | 1.2802 | 7.385 | 11.80 | … | UKIRT: |
| 9022001 | 19h 27m 18.51s | 45d 22m 42.02s | 16.0 | 3648 | 0.6989∗∗ | 0.7055∗∗ | 14.48 | … | UKIRT: elongated & |
| 9268481 | 19h 02m 03.70s | 45d 44m 06.76s | 15.6 | 3198 | 0.5802∗ | 1.5780 | 1.8638 | … | UKIRT: single |
| 9428095 | 19h 59m 37.83s | 45d 56m 04.78s | 15.9 | 3431 | 0.6289 | 0.6974 | 23.04 | … | UKIRT: 3.0′′ |
| 9519275 | 19h 14m 06.86s | 46d 07m 18.77s | 15.5 | 3578 | 0.5798 | 1.8706 | 17.71 | … | UKIRT: 6′′ |
| 9590249 | 19h 30m 58.54s | 46d 13m 12.76s | 15.8 | 3855 | 0.2640∗ | 2.1665 | 12.0 | … | UKIRT: single |
| 10403228 | 19h 24m 54.41s | 47d 32m 59.93s | 16.1 | 3386 | 0.2367 | 0.2461 | 34.6 | … | UKIRT: 2.8′′ |
| 10584063 | 18h 57m 06.17s | 47d 49m 28.67s | 15.7 | 3316 | 1.397∗ | 1.5988 | 18.72 | … | UKIRT: single |
| 10677397 | 19h 45m 09.30s | 47d 54m 59.15s | 15.3 | 3387 | 0.3115* | 0.4743 | 7.803 | … | UKIRT: double & 6′′ & 7′′ |
| 11955208 | 19h 06m 43.50s | 50d 20m 08.77s | 15.7 | 3604 | 0.5637 | 0.7028 | 1.1855 | … | Keck AO: 0.1′′ binary |
| 12203082 | 19h 12m 51.12s | 50d 48m 00.61s | 15.3 | 3804 | 0.5263∗ | 0.6592 | 11.75 | … | UKIRT: single |
| 12258225 | 19h 25m 41.94s | 50d 56m 41.82s | 14.7 | 3500 | 0.9416 | 1.0141 | … | … | UKIRT: single |
| 12304013 | 19h 17m 40.27s | 51d 00m 16.92s | 15.2 | 3465 | 0.3497 | 2.3491 | 19.12 | … | UKIRT: single |
Note. — * = inferred from only the base frequency and no higher harmonics; ** = sufficiently close that these may result from differential rotation of a single star; - the period of an eccentric binary component of the system; (1) KIC ID, (2) Right Ascension, (3) Declination, (4) Kepler magnitude, , (5) composite , (6)–(9) rotation period in days, (10) Comments on the stellar neighbors inferred from the UKIRT J-band images, as well as the Keck AO images – where available; angular distances to some of the neighboring stars are noted. - the other stars are of a distinctly different, i.e., hotter, spectral type.