Algebraic and Topological Indices of Molecular Pathway Networks in Human Cancers
Abstract
Protein-protein interaction networks associated with diseases have gained prominence as an area of research. We investigate algebraic and topological indices for protein-protein interaction networks of 11 human cancers derived from the Kyoto Encyclopedia of Genes and Genomes (KEGG) database. We find a strong correlation between relative automorphism group sizes and topological network complexities on the one hand and five year survival probabilities on the other hand. Moreover, we identify several protein families (e.g. PIK, ITG, AKT families) that are repeated motifs in many of the cancer pathways. Interestingly, these sources of symmetry are often central rather than peripheral. Our results can aide in identification of promising targets for anti-cancer drugs. Beyond that, we provide a unifying framework to study protein-protein interaction networks of families of related diseases (e.g. neurodegenerative diseases, viral diseases, substance abuse disorders).
Introduction
Biological networks have been an active area of research for some years, see e.g. [12, 16, 17] and the references therein. In earlier work [6] we reported that molecular signaling network complexity is correlated with cancer patient survival. In that work we reported a statistical mechanics measure of network complexity. Here we focus on the relative sizes of automorphism groups and the dimensions of the cycle spaces (cyclomatic numbers).
Complex real-world networks contain feedback loops to enable the network “communication” to continue in the face of node failure [2]. In the case of protein-protein interaction (PPI) networks this means that inhibition of a specific node may or may not have any effect. It is well known that targeting hub nodes in networks often causes the network to break up into multiple components and this could be lethal, because many protein hubs in PPIs for cancer are also important proteins in metabolic networks. As we argued in [6], targeting nodes with high-betweenness has higher potential for improved cancer treatment. Selective targeting of nodes in a PPI for cancer treatment is fraught with difficulties.
In this letter we apply two more algebraic and topological indices to study cancer PPI networks and show correlation with 5 year patient survival. We identify several repeated motifs of proteins that are “interchangeable” in a sense to be specified below. In the long run we anticipate that the methods described here will aid identification of potential drug targets.
Results and Discussion
A network is an undirected graph with vertex set and edge set . The vertices are proteins and two vertices are connected by an edge if there is a known interaction of the two partners, either by direct binding or by enzymatic catalysis. Beyond cancer pathways, the Kyoto Encyclopedia of Genes and Genomes (KEGG) database also contains pathways related to immune diseases (e.g. asthma), neurodegenerative diseases (Alzheimer’s disease, Parkinson’s disease), substance dependence, cardiovascular diseases, viral diseases and many others [13]. The KEGG networks are assembled from the literature by searches for experimental confirmation of the relevant interactions. Each interaction is always confirmed by two or more different experimental techniques such as pull-down mass spectrometry, yeast two-hybrid and various biochemical tests. Naturally, networks constructed from experimental results are likely to contain errors, which are however impossible to quantify.
An automorphism is a permutation that preserves the adjacency relation, that is,
With the operation of composition, the automorphisms form a group . The relation on the set of vertices
is an equivalence relation and its equivalence classes are called the (group) orbits.
MacArthur et al. [18] list 20 examples of real world networks and their rich symmetry groups. This is in contrast to large random graphs, such as graphs from the Erdős-Rényi model . Here is the number of vertices. Edges are independently present with probability . Such graphs have only the trivial automorphism, with probability approaching one, in the limit [5, Chapter IX]. The difference is not surprising if one realizes that real networks display a modular structure, with vertices organized in communities tightly connected internally and loosely connected to each other [10]. This results in the presence of symmetric subgraphs such as trees and complete cliques.
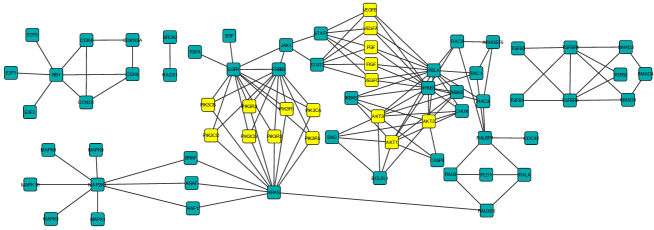
Figure 1 shows as an example the protein-protein interaction network of pancreatic cancer as retrieved from the KEGG database. We find that the automorphism group of this network is the direct product of symmetric groups
see Table 1 for a complete list of automorphism groups. Remarkably, symmetries do not only arise due to tree subgraphs at the “ends” of the network, but also due to central nodes of high degree (highlighted in yellow in Figure 1). Thus any flow of information that passes through one node in such an orbit equivalence class may pass through any other node in the same equivalence class. The presence of such modular patterns indicates a high level of redundancy which confers robustness to the associated biological system (tumor cells). We suggest that to interrupt the flow through such a network most efficiently, the nodes adjacent to large central orbits are the best to be targeted for example by pharmacological agents that inhibit a specific protein-protein interaction pair. Similar suggestions have been made in [7, 8, 22]. The use of automorphism groups has, to the best of our knowledge, not yet been proposed.
Automorphism groups are often used to measure the complexity of a network [23]. In order to make automorphism group sizes of graphs with vertices comparable, we follow the suggestion in [23] and compute the ratio
This relates the size of to the size of the automorphism group of the complete graph on vertices.
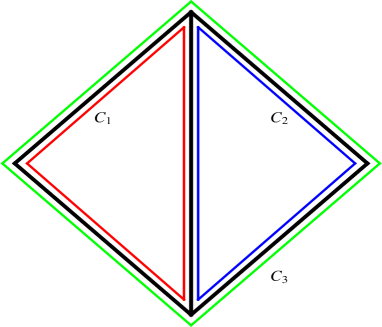
A second graph invariant is of a more topological nature. A cycle is a sequence of adjacent vertices that starts and ends at the same vertex. The set of all cycles can be made a vector space over the field by taking the symmetric difference
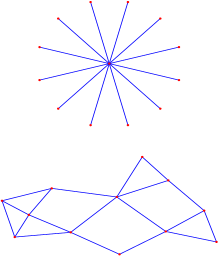
as addition, the identity as negation, and the empty cycle as zero. The dimension of this vector space is called the cyclomatic number , or the circuit rank. Loosely speaking, it is a count of the “independent” loops, see Figure 2. It is shown in [4, 15] that for a graph with vertices, edges and connected components, is given by
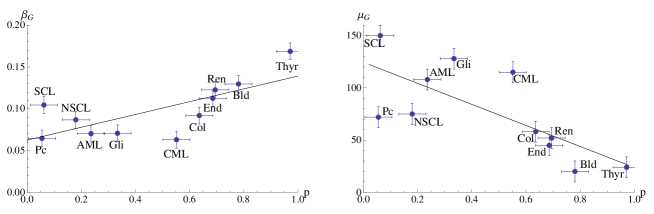
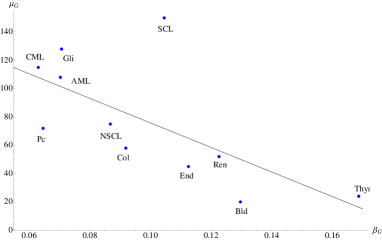
We plot these two indices against the five year survival probability , obtained from the Surveillance, Epidemiology and End Results (SEER) database [20] for 11 types of cancer in Figure 3. Interaction networks with larger values of or equivalently greater symmetry are associated with better chances of survival. A large value of indicates high topological complexity and correlates with decreased chance of survival. We find that both coefficients of determination are with corresponding -value (the equality is coincidental). There are widespread differences in detection stage, metastasis status, treatment and general health of the patient which are unfortunately not accessible from the SEER database. Nevertheless, given this large amount of natural uncertainty in the data, this indicates a strong correlation of averages. It would be invaluable for future research to classify database entries according to some of the parameters mentioned above. Since both the automorphism group size and the cyclomatic number are correlated to the five year survival probability , it is to be expected that these two quantities are correlated to each other, for the the protein-protein interaction networks of cancers that are the object of our study, see Figure 4, left panel. However, it is easy to construct examples of graphs that show no correlation between and , see Figure 4, right panel.
Further study of the automorphism groups reveals repeated motifs in several interaction networks. The eight proteins from the PIK3C{A,B,D,G} and PIK3R{1,2,3,5} family form a single orbit equivalence class in seven of the networks (AML, CML, colorectal, endometrial, pancreatic, renal and SCL cancers) and are split in two orbit equivalence class in two more networks (glioma and NSCL). The three proteins AKT{1,2,3} are orbit equivalent in eight networks (CML, colorectal, endometrial, glioma, NSCL, pancreatic, renal and SCL cancers), that is, whenever they appear in the network to begin with. These players have been known for a long time to be of crucial importance to the initiation and progression of cancer, mainly due to the various biological and biochemical assays performed on cancer cells. However, our conclusions stem directly from a group-theoretic analysis of the PPI networks and they are network specific. Since its initial discovery as a proto-oncogene, the serine/threonine kinase AKT has become a major focus of attention because of its critical regulatory role in diverse cellular processes, including cancer progression and insulin metabolism. The AKT cascade is activated by receptor tyrosine kinases, integrins, B and T cell receptors, cytokine receptors, G-protein-coupled receptors and other stimuli that induce the production of phosphatidylinositol (3,4,5)-triphosphates (PtdIns(3,4,5)P3) by phosphoinositide 3-kinase (PI3K). These lipids serve as plasma membrane docking sites for proteins that harbor pleckstrin-homology (PH) domains, including AKT and its upstream activator PDK1. The tumor suppressor PTEN is recognized as a major inhibitor of AKT and is frequently lost in human tumors. There are three highly related isoforms of AKT (AKT1, AKT2, and AKT3), which represent the major signaling arm of PI3K. For example, germline mutations of AKT have been identified in pathological conditions of cancer and insulin metabolism. AKT regulates cell growth through its effects on the TSC1/TSC2 complex and mTOR pathways, as well as cell cycle and cell proliferation through its direct action on the CDK inhibitors p21 and p27, and its indirect effect on the levels of cyclin D1 and p53. AKT is a major mediator of cell survival through direct inhibition of pro-apoptotic signals such as the pro-apoptotic regulator BAD and the FOXO and Myc family of transcription factors. AKT has been demonstrated to interact with Smad molecules to regulate TGF- signaling. These findings make AKT an important therapeutic target for the treatment of cancer.
Interestingly, the network of small cell lung cancer contains an enormous orbit of 18 equivalent nodes of degree six. This orbit consists of laminines, collagens and a fibronectin that are major proteins in the basal lamina. All nodes are connected to six members of the integrin family of transmembrane receptors.
Conclusion
We have shown that the relative size of the automorphism groups and the cyclomatic numbers for cancer pathway networks from the KEGG database are both correlated with five-year survival of cancer patients. Determination of the specific reasons for these great discrepancies in survival rates remains a topic for future research. Interestingly, cancers with more symmetric interaction networks are associated with better survival rates. This may be due to a greater robustness to failure, which, somewhat counterintuitive, is a positive feature in this context.
We suggest that selective removal of nodes from the network (clinically equivalent to protein inhibition) and reinterpolation on the linear curves helps to identify potential drug targets. This indicates that complexity of a biochemical network involved in a deregulated cell cycle as exemplified by cancer cells is of crucial importance to its robustness. This is manifested by various redundancies in the PPI network that make the search for a therapeutic “silver bullet” an impossible task. We suggest that selective removal of nodes from the network (clinically equivalent to protein inhibition) and reinterpolation on the linear curves helps to identify potential drug targets. We have shown that PI3K and AKT families of proteins appear to be the most suitable targets for pharmacological inhibition in the most number of cancer types studied. It is encouraging that there are several AKT pathway inhibitors in clinical development, e.g. perifosine (KRX-0401, Aeterna Zentaris/Keryx), MK-2206 (Merck), and GSK-2141795 (Glaxo-SmithKline) [3]. Similarly, Bayer, GlaxoSmithKline (GSK), Novartis, Merck & Co., Roche and Sanofi are just a few of the companies that have placed great importance on the development of a spectrum of agents targeting the PI3K pathway. Drug candidates including pan-PI3K inhibitors, PI3K isoform-specific inhibitors, AKT inhibitors and mTOR inhibitors are currently tested alone and in combinations in an array of cancer indications [11]. While the motivation for this focus has been stated as: “The pathway is almost invariably on in cancer”, our methodology identifies this pathway as the most crucial using mathematical analysis of the network. Moreover, we are able to identify those types of cancer where the pathway should be the main target and those types where targeting it may not produce the expected clinical outcomes.
Methods
The cancer pathways were obtained from the Kyoto Encyclopedia of Genes and Genomes (KEGG) [13] with the help of the open source software packages KEGGgraph [24] and cytoscape [21]. The automorphism groups of the networks were found with saucy [14] and gap [9] (see Tables 2-12 for the complete group lists). Bases of the cycle spaces were found using python networkX.
Acknowledgements
JAT acknowledges funding support for this research from NSERC (Canada), Canadian Breast Cancer Foundation and the Allard Foundation. We thank Dr. Giannoula Klement (Newman-Lakka Institute, Tufts University School of Medicine) for valuable comments.
References
- [1] Ahuja RK, Magnanti TL, Orlin JB, Network Flows. Theory, Algorithms, and Applications, Prentice Hall, Englewood Cliffs, NJ, 1993
- [2] Albert R, Jeong H, Barabási AL, Error and attack tolerance of complex networks, Nature 406, 378-382, (2000)
- [3] Alexander W, Inhibiting the Akt pathway in cancer treatment. Three leading candidates, Pharmacy and Therapeutics 36, 225-227, (2011)
- [4] Berger F, Gritzmann P, de Vries S, Minimum cycle bases for network graphs, Algorithmica 40, 51-62, (2004)
- [5] Bollobás B, Random Graphs, Cambridge University Press, Cambridge, 2001
- [6] Breitkreutz D, Hlatky L, Rietman E, Tuszynski JA, Molecular signaling network complexity is correlated with cancer patient survivability, Proc. Natl. Acad. Sci. USA 109, 9209-9212, (2012)
- [7] Chandra N, Padiadpu J, Network approaches to drug discovery, Expert Opin. Drug Discov. 8, 7-20, (2013)
- [8] Csermely P, Korcsmáros T, Kiss HJM, London G, Nussinov R, Structure and dynamics of molecular networks: A novel paradigm of drug discovery. A comprehensive review, Pharmacol. Therapeut. 138, 333-408, (2013), arXiv:1210.0330
- [9] The GAP Group, GAP -- Groups, Algorithms, and Programming, Version 4.6.4, 2013, http://www.gap-system.org
- [10] Garlaschelli D, Ruzzenenti F, Basosi R, Complex networks and symmetry I: A review, Symmetry 2, 1683-1709, (2010), arXiv:1006.3923
- [11] Holmes D, PI3K Pathway inhibitors approach junction, Nat. Rev. Drug Discov. 10, 563-564, (2011)
- [12] Junker BH, Schreiber F (eds.), Analysis of Biological Networks, John Wiley & Sons, Hoboken, NJ, 2008
- [13] Kanehisa M, Goto S, Kawashima S, Okuno Y, Hattori M, The KEGG resource for deciphering the genome, Nucleic Acids Res. 32, D277-D280, (2004), http://www.genome.jp/kegg/
- [14] Katebi H, Sakallah KA, Markov IL, Graph Symmetry Detection and Canonical Labeling: Differences and Synergies, In: Turing-100. The Alan Turing Centenary, A Voronkov (ed.), p. 181-195, Manchester, UK, (2012), http://vlsicad.eecs.umich.edu/BK/SAUCY/
- [15] Kavitha T, Liebchen C, Mehlhorn K,Michail D, Rizzie R, Ueckerdt T, Zweig KA, Cycle bases in graphs characterization, algorithms, complexity, and applications, Computer Science Review 3, 199-243, (2009)
- [16] Koonin EV, Wolf YI, Karev GP (eds.), Power Laws, Scale-Free Networks and Genome Biology, Landes Bioscience, Austin, TX, 2006
- [17] Ma’ayan A, MacArthur BD (eds.), New Frontiers of Network Analysis in Systems Biology, Springer Verlag, Dordrecht, Heidelberg, New York, London, 2012
- [18] MacArthur BD, Sánchez-García RJ, Anderson JW, Symmetry in complex networks, Discr. Appl. Math. 156, 3525-3531, (2008), arXiv:0705.3215
- [19] Newman MEJ, Networks: An Introduction, Oxford University Press, Oxford, New York, 2010
- [20] National Cancer Institute, Surveillance, Epidemiology and End Results (SEER) Program, 2013, http://seer.cancer.gov/
- [21] Shannon P, Markiel A, Ozier O, Baliga NS, Wang JT, Ramage D, Amin N, Schwikowski B, Ideker T, Cytoscape: a software environment for integrated models of biomolecular interaction networks, Genome Res. 13, 2498-2504, (2003), http://cytoscape.org
- [22] Winterbach W, van Mieghem P, Reinders M, Wang H, de Ridder D, Topology of molecular interaction networks, BMC Syst. Biol. 7, 90, (2013)
- [23] Xiao Y, MacArthur BD, Wang H, Xiong M, Wang W, Network quotients: Structural skeletons of complex systems, Phys. Rev. E 78, 046102, (2008), arXiv:0802.4318
- [24] Zhang JD, Wiemann S, KEGGgraph: a graph approach to KEGG PATHWAY in R and Bioconductor, Bioinformatics 25, 1470-1471, (2009), http://bioconductor.org
Figures
Tables
| Cancer | ||||||
|---|---|---|---|---|---|---|
| AML | 62 | 1 | 108 | |||
| Bld | 29 | 3 | 20 | |||
| CML | 73 | 3 | 115 | |||
| Col | 49 | 3 | 58 | |||
| End | 44 | 2 | 45 | |||
| Gli | 64 | 2 | 128 | |||
| NSCL | 48 | 1 | 75 | |||
| Pc | 69 | 4 | 72 | |||
| Ren | 60 | 3 | 52 | |||
| SCL | 77 | 2 | 150 | |||
| Thyr | 28 | 3 | 24 |
| Nodes | Degree | ||||||
|---|---|---|---|---|---|---|---|
| PIK3R5 | PIK3CA | PIK3CB | PIK3CD | PIK3R1 | PIK3R2 | PIK3R3 | 9 |
| CCND1 | MYC | PPARD | LEF1 | TCF7 | TCF7L2 | TCF7L1 | 1 |
| KRAS | NRAS | HRAS | 12 | ||||
| RPS6KB1 | RPS6KB2 | EIF4EBP1 | 5 | ||||
| STAT3 | STAT5A | STAT5B | 5 | ||||
| RARA | PML | LOC652346 | LOC652671 | 3 | |||
| ARAF | RAF1 | BRAF | 1 | ||||
| KIT | LOC652799 | 12 | |||||
| IKBKB | IKBKG | 5 | |||||
| MAP2K1 | MAP2K2 | 5 | |||||
| SOS1 | SOS2 | 4 | |||||
| PIM1 | PIM2 | 3 | |||||
| NFKB1 | RELA | 3 | |||||
| MAPK1 | MAPK3 | 2 | |||||
| Nodes | Degree | |||
|---|---|---|---|---|
| DAPK1 | DAPK3 | DAPK2 | RPS6KA5 | 2 |
| KRAS | NRAS | HRAS | 5 | |
| ARAF | RAF1 | BRAF | 5 | |
| E2F1 | E2F2 | E2F3 | 1 | |
| MAPK1 | MAPK3 | 6 | ||
| MAP2K1 | MAP2K2 | 5 | ||
| RASSF1 | FGFR3 | 3 | ||
| CCND1 | CDK4 | 3 | ||
| EGFR | ERBB2 | 1 | ||
| Nodes | Degree | |||||||
|---|---|---|---|---|---|---|---|---|
| PIK3R5 | PIK3CA | PIK3CB | PIK3CD | PIK3CG | PIK3R1 | PIK3R2 | PIK3R3 | 9 |
| CRK | CRKL | CBLC | CBL | CBLB | 9 | |||
| SHC2 | SHC4 | SHC3 | SHC1 | MYC | 2 | |||
| HDAC1 | HDAC2 | CTBP1 | CTBP2 | 2 | ||||
| AKT1 | AKT2 | AKT3 | 14 | |||||
| ARAF | RAF1 | BRAF | 5 | |||||
| KRAS | NRAS | HRAS | 5 | |||||
| CHUK | IKBKB | IKBKG | 4 | |||||
| CDK4 | CDK6 | CCND1 | 3 | |||||
| E2F1 | E2F2 | E2F3 | 1 | |||||
| ABL1 | BCR | 13 | ||||||
| MAP2K1 | MAP2K2 | 5 | ||||||
| SOS1 | SOS2 | 4 | ||||||
| MECOM | RUNX1 | 4 | ||||||
| STAT5A | STAT5B | 3 | ||||||
| MAPK1 | MAPK3 | 2 | ||||||
| TGFRB1 | TGFRB2 | 2 | ||||||
| NFKB1 | RELA | 1 | ||||||
| Nodes | Degree | |||||||
|---|---|---|---|---|---|---|---|---|
| PIK3R5 | PIK3CA | PIK3CB | PIK3CD | PIK3CG | PIK3R1 | PIK3R2 | PIK3R3 | 4 |
| RHOA | RAC1 | RAC2 | RAC3 | 4 | ||||
| LEF1 | TCF7 | TCF7L1 | TCF7L2 | 4 | ||||
| AKT1 | AKT2 | AKT3 | 8 | |||||
| MAPK8 | MAPK9 | MAPK10 | 4 | |||||
| ARAF | RAF1 | BRAF | 2 | |||||
| SMAD4 | TGFBR1 | TGFBR2 | 2 | |||||
| MAPK1 | MAPK3 | 4 | ||||||
| JUN | FOS | 3 | ||||||
| DCC | CASP3 | 3 | ||||||
| SMAD2 | SMAD3 | 3 | ||||||
| Nodes | Degree | |||||||
|---|---|---|---|---|---|---|---|---|
| PIK3R5 | PIK3CA | PIK3CB | PIK3CD | PIK3CG | PIK3R1 | PIK3R2 | PIK3R3 | 3 |
| APC2 | APC | AXIN1 | AXIN2 | GSK3B | 1 | |||
| LEF1 | TCF7 | TCF7L1 | TCF7L2 | 3 | ||||
| AKT1 | AKT2 | AKT3 | 5 | |||||
| KRAS | NRAS | HRAS | 5 | |||||
| ARAF | RAF1 | BRAF | 5 | |||||
| BAD | CASP9 | FOXO3 | 3 | |||||
| PDPK1 | ILK | 10 | ||||||
| MAP2K1 | MAP2K2 | 5 | ||||||
| MAPK1 | MAPK3 | 3 | ||||||
| SOS1 | SOS2 | 4 | ||||||
| MYC | CCND1 | 4 | ||||||
| DCC | CASP3 | 3 | ||||||
| Nodes | Degree | |||||
|---|---|---|---|---|---|---|
| CALML6 | CALML5 | CALM1 | CALM2 | CALM3 | CALML3 | 3 |
| PIK3CA | PIK3CB | PIK3CD | PIK3CG | 9 | ||
| CAMK2A | CAMK2B | CAMK2D | CAMK2G | 8 | ||
| PIK3R5 | PIK3R1 | PIK3R2 | PIK3R3 | 7 | ||
| SHC1 | SHC2 | SHC3 | SHC4 | 5 | ||
| KRAS | NRAS | HRAS | 20 | |||
| ARAF | RAF1 | BRAF | 5 | |||
| PRKCA | PRKCB | PRKCG | 3 | |||
| CCND1 | CDK4 | CDK6 | 3 | |||
| AKT1 | AKT2 | AKT3 | 1 | |||
| E2F1 | E2F2 | E2F3 | 1 | |||
| PDGFRA | PDGFRB | 16 | ||||
| MAP2K1 | MAP2K2 | 9 | ||||
| PLCG1 | PLCG2 | 4 | ||||
| SOS1 | SOS2 | 4 | ||||
| MDM2 TP53 (2) | CDKN2A CDKN1A (4) | - | ||||
| MAPK1 | MAPK3 | 2 | ||||
| PDGFA | PDGFB | 2 | ||||
| EGF | TGFA | 1 | ||||
| Nodes | Degree | |||
|---|---|---|---|---|
| PIK3CA | PIK3CB | PIK3CD | PIK3CG | 7 |
| PIK3R5 | PIK3R1 | PIK3R2 | PIK3R3 | 5 |
| PLCG1 | PLCG2 | TGFA | EGF | 2 |
| AKT1 | AKT2 | AKT3 | 12 | |
| ARAF | RAF1 | BRAF | 8 | |
| PRKCA | PRKCB | PRKCG | 3 | |
| CCND1 | CDK4 | CDK6 | 3 | |
| BAD | CASP9 | FOXO3 | 3 | |
| E2F1 | E2F2 | E2F3 | 1 | |
| EGFR | ERBB2 | 9 | ||
| NRAS | HRAS | 5 | ||
| MAP2K1 | MAP2K2 | 4 | ||
| SOS1 | SOS2 | 4 | ||
| MAPK1 | MAPK3 | 3 | ||
| STK4 | RASSF5 | 2 | ||
| CDK4 | CDK6 | 2 | ||
| Nodes | Degree | |||||||
|---|---|---|---|---|---|---|---|---|
| PIK3R5 | PIK3CA | PIK3CB | PIK3CD | PIK3CG | PIK3R1 | PIK3R2 | PIK3R3 | 3 |
| FIGF | PGF | VEGFA | VEGFB | VEGFC | 4 | |||
| MAPK1 | MAPK3 | MAPK8 | MAPK9 | MAPK10 | 1 | |||
| AKT1 | AKT2 | AKT3 | 8 | |||||
| CHUK | IKBKB | IKBKG | 5 | |||||
| RAC1 | RAC2 | RAC3 | 4 | |||||
| ARAF | RAF1 | BRAF | 2 | |||||
| TGFB1 | TGFB2 | TGFB3 | 2 | |||||
| E2F1 | E2F2 | E2F3 | 1 | |||||
| RELA | NKFB1 | 14 | ||||||
| STAT1 | STAT3 | 6 | ||||||
| TGFBR1 | TGFBR2 | 6 | ||||||
| BAD | BCL2L1 | 4 | ||||||
| RALA | RALB | 3 | ||||||
| CDK4 | CDK6 | 3 | ||||||
| SMAD2 | SMAD3 | 3 | ||||||
| BRCA2 | RAD51 | 1 | ||||||
| TGFA | EGF | 1 | ||||||
| Nodes | Degree | |||||||
|---|---|---|---|---|---|---|---|---|
| ARNT | ARNT2 | CREBBP | EP300 | EGLN2 | EGLN3 | EGLN1 | SLC2A1 | 2 |
| FIGF | PGF | VEGFA | VEGFB | VEGFC | TGFB1 | TGFB2 | TGFB3 | |
| PDGFB | TGFA | |||||||
| PIK3R5 | PIK3CA | PIK3CB | PIK3CD | PIK3CG | PIK3R1 | PIK3R2 | PIK3R3 | 4 |
| PAK1 | PAK2 | PAK3 | PAK4 | PAK6 | PAK7 | 2 | ||
| AKT1 | AKT2 | AKT3 | 8 | |||||
| ARAF | RAF1 | BRAF | 2 | |||||
| EPAS1 | HIF1A | 18 | ||||||
| RAC1 | CDC42 | 6 | ||||||
| MAPK1 | MAPK3 | 5 | ||||||
| MAP2K1 | MAP2K2 | 5 | ||||||
| ETS1 | JUN | 2 | ||||||
| CRK | CRKL | 2 | ||||||
| SOS1 | SOS2 | 1 | ||||||
| RAP1A | RAP1B | 1 | ||||||
| Nodes | Degree | |||||||
|---|---|---|---|---|---|---|---|---|
| LAMA1 | LAMA2 | LAMA3 | LAMA4 | LAMA5 | LAMB1 | LAMB2 | LAMB3 | 6 |
| LAMB4 | LAMC1 | LAMC2 | LAMC3 | COL4A1 | COL4A2 | COL4A4 | COL4A5 | |
| COL4A6 | FN1 | |||||||
| TRAF1 | TRAF2 | TRAF3 | TRAF4 | TRAF5 | TRAF6 | 2 | ||
| PTGS2 | NOS2 | BIRC2 | BIRC3 | XIAP | BCL2L1 | |||
| PIK3R5 | PIK3CA | PIK3CB | PIK3CD | PIK3CG | PIK3R1 | PIK3R2 | PIK3R3 | 4 |
| PIAS1 | PIAS2 | PIAS3 | PIAS4 | 3 | ||||
| AKT1 | AKT2 | AKT3 | 11 | |||||
| CHUK | IKBKB | IKBKG | 4 | |||||
| CCNE1 | CCNE2 | CDK2 | 2 | |||||
| E2F1 | E2F2 | E2F3 | 1 | |||||
| RELA | NKFB1 | 13 | ||||||
| MAX | MYC | 8 | ||||||
| CDK4 | CDK6 | 4 | ||||||
| APAF1 | CYCS | 1 | ||||||
| Nodes | Degree | ||||||
|---|---|---|---|---|---|---|---|
| RET | CCDC6 | NCOA4 | TFG | NTRK1 | TPM3 | TPR | 3 |
| LEF1 | TCF7 | TCF7L1 | TCF7L2 | 3 | |||
| KRAS | NRAS | HRAS | 8 | ||||
| RXRA | RXRB | RXRG | 2 | ||||
| MYC | CCND1 | 4 | |||||
| MAP2K1 | MAP2K2 | 3 | |||||
| PPARG | PAX8 | 3 | |||||
| MAPK1 | MAPK3 | 2 | |||||