Multi-color Optical and NIR Light Curves of 64 Stripped-Envelope Core-Collapse Supernovae
Abstract
We present a densely-sampled, homogeneous set of light curves of low redshift () stripped-envelope supernovae (SN of type IIb, Ib, Ic and Ic-bl). These data were obtained between 2001 and 2009 at the Fred L. Whipple Observatory (FLWO) on Mt. Hopkins in Arizona, with the optical FLWO 1.2-m and the near-infrared PAIRITEL 1.3-m telescopes. Our dataset consists of optical photometric measurements on SN, including a combination of , , and , and near-infrared measurements on SN.
This sample constitutes the most extensive multi-color data set of stripped-envelope SN to date. Our photometry is based on template-subtracted images to eliminate any potential host galaxy light contamination. This work presents these photometric data, compares them with data in the literature, and estimates basic statistical quantities: date of maximum, color, and photometric properties. We identify promising color trends that may permit the identification of stripped-envelope SN subtypes from their photometry alone. Many of these SN were observed spectroscopically by the CfA SN group, and the spectra are presented in a companion paper (Modjaz et al., 2014). A thorough exploration that combines the CfA photometry and spectroscopy of stripped-envelope core-collapse SN will be presented in a follow-up paper.
1. Introduction
Stripped-envelope core-collapse supernovae (stripped SN) arise from the spectacular death of massive stars that have been stripped of their outer layers of hydrogen and helium. In this paper we present photometric data in optical and near infra-red (NIR) wavelengths for 64 stripped SN, data that we collected between 2001 and 2009 at the Fred L. Whipple Observatory (FLWO) on Mt. Hopkins in Arizona.
Stripped SN include SN of types Ib, Ic, and IIb. Type Ib (SN Ib) and Type Ic SN (SN Ic) are SN that do not show hydrogen lines (thus Type I), but do not exhibit the strong Si II absorption lines characteristic of SN Ia (Uomoto & Kirshner 1986, Clocchiatti et al. 1997). SN Ib show conspicuous lines of He I, while SN Ic do not. SN IIb change as they age: initially they show strong hydrogen features (hence the Type II classification), but over time the Balmer series decreases in strength, while the series of He I lines characteristic of SN Ib grows stronger (e.g., Filippenko et al. 1993). Finally, broad-lined SN Ic (SN Ic-bl) exhibit broad and blended lines in a SN Ic-like spectrum, indicative of very high expansion velocities (Galama et al., 1998; Patat et al., 2001; Pian et al., 2006; Modjaz et al., 2006; Sanders et al., 2012). SN Ic-bl are the only type of SN that have been observed in conjunction with long-duration GRBs (e.g., Galama et al. 1998; Stanek et al. 2003; Hjorth et al. 2003; Modjaz et al. 2006). See Woosley & Bloom (2006), Modjaz (2011), and Hjorth & Bloom (2012) for reviews of GRB-SN connections. For a review of SN spectroscopic classification, see Filippenko (1997).
Stripped SN have been studied less than SN Ia. These SN, however, are intrinsically almost as common per volume as SN Ia (Li et al., 2011), and they hold vital clues about the death and explosion properties of very massive stars (Uomoto & Kirshner, 1986), and their nucleosynthesis products that contribute to the Universe’s chemical enrichment (Burbidge et al., 1957; Nomoto et al., 2006). The characteristics of the progenitor channels, and their link to each SN class and subclass are not yet well understood. Nor do we know which is the dominant process responsible for stripping these massive stars of their outer layers: models propose stripping may occur through strong winds (Woosley et al., 1993), or binary interaction (Nomoto et al., 1995; Podsiadlowski et al., 2004).
Several stripped SN have been studied in detail individually, beginning with the SN Ic 1994I in the nearby galaxy M 51 (e.g., Richmond et al. 1996; Filippenko et al. 1995). Because of its proximity, it was well observed over many wavelengths and it is commonly referred to as the “prototypical” normal SN Ic (e.g., Elmhamdi et al. 2006 and Sauer et al. 2006).
However, in order to assess the peculiarities of these explosions and to understand the characteristics of stripped SN, well observed SN must be evaluated in the context of a sample large enough to be studied with a statistical approach. For example, SN 1994I appears to be non-typical: Richardson et al. (2006) and Drout et al. (2011) showed that SN 1994I had a faster light curve than any other SN Ic in the literature and is a 2 outlier of the overall distribution of light curves of SN Ib and SN Ic.
Richardson et al. (2006) compiled light curves of 27 stripped-envelope SN from the literature, of which one-third had been found or observed with photographic plates. However, photographic plate surveys are strongly biased against dim SN or SN near the nucleus of the host galaxy. Modern CCD surveys, analyzed with image subtraction techniques (Smith et al. 2002) should instead be nearly complete, barring large amounts of host galaxy dust extinction.
A sample of stripped SN was presented in Drout et al. (2011) – D11 henceforth: 25 SN Ib, Ic and Ic-bl, observed in 2 bands. Eighteen of these objects were also observed within our program. D11 concluded that SN Ib and Ic are indistinguishable photometrically. Furthermore, from the peak luminosity D11 sets constraints to the 56Ni mass generated in the explosion, and assuming that SN Ib and SN Ic have the same photospheric velocities, D11 derives constraints on the ejecta mass from the light curve shape. This pioneering study of stripped SN, however, presents data in just two bands and does not employ galaxy subtraction. As we show in Section 5, galaxy subtraction can be important for producing accurate light curves.
Li et al. (2011) presented unfiltered light curves of SN that were discovered as part of the Lick Observatory SN Search (LOSS, Filippenko et al. 2001), including about 30 stripped SN (5 of which are included in this study). Those unfiltered light curves were crucial for calculating the SN luminosity function and the LOSS SN rates, however they are in a single, non-standard band.
A collection of UV light curves of core-collapse SN from SWIFT (Gehrels et al., 2004), including 15 stripped SN (6 of which are in our sample), is presented in Pritchard & Roming (2013).
Understanding the full range of massive star explosion properties requires the study of a large and comprehensive SN sample with homogeneous and densely-sampled data. Moreover, the current SN classification scheme, outlined above, is based on spectroscopy. As we enter the era of all-sky optical transient searches, with hundreds, even thousands of SN to be discovered each night (LSST Science Collaboration and LSST Project, 2009), we will simply be unable to obtain systematic spectroscopic follow-up data of most objects. Devising photometric criteria for classifying SN without spectra is important (Sako et al., 2014). The first step in this process is to obtain well-sampled light curves of SN Ib, SN Ic and SN IIb.
This work presents a densely sampled, multi-color, homogeneous data set of stripped SN, supported and complemented by spectroscopic data (Modjaz et al. 2014, henceforth M14). Since 1993, spectroscopic and photometric monitoring of nearby and newly-discovered SN at the Fred L. Whipple Observatory (FLWO) on Mt. Hopkins in Arizona has been undertaken by the Harvard-Smithsonian Center for Astrophysics (CfA)111http://www.cfa.harvard.edu/oir/Research/supernova/. Furthermore, the CfA conducted a parallel near infrared (NIR) photometric campaign with PAIRITEL at FLWO starting in 2004. While, due to their cosmological relevance, SN Ia were prioritized targets throughout the campaign (Riess et al., 1999; Jha et al., 2006; Hicken et al., 2009, 2012), an intense follow-up program of stripped SN began in 2004, in addition to the SN Ia follow-up. Here we present photometric data of nearby () stripped SN collected between 2001 and 2009. In a second paper (Bianco et al. in preparation) we will present a deeper analysis of the sample, integrate it with data from the literature, discuss statistical differences in the photometry and colors of different stripped SN subtypes, and derive constraints on their progenitors.
The data set presented in this paper includes optical photometric observations of SN (Section 3.1), and NIR observations of SN (Section 3.2). All photometry presented here is available in the online version of the journal, and at the CfA222http://www.cfa.harvard.edu/oir/Research/supernova/ and NYU333http://www.cosmo.nyu.edu/SNYU supernova group Web sites. The CfA spectroscopic observations of of our SN are presented in M14.
2. Discovery
The nearby SN we monitored at the CfA were discovered by a variety of professional SN searches, as well as amateurs using modern CCD technology. Systematic SN searches include LOSS, the Texas SN Search444http://www.grad40.as.utexas.edu/q̃uimby/tss (Quimby, 2006), The Chilean Automatic Supernova Search (Hamuy et al., 2012), and the Nearby SN Factory (Aldering et al., 2002). SN 2008D was discovered in the X-Ray with SWIFT (Soderberg et al. 2008, in X-Ray observations of SN 2007uy, an unrelated stripped SN discovered in the same galaxy). The LOSS survey, and many amateur SN searches, observe in a relatively small field-of-view (FOV, for LOSS) and recursively monitor the same galaxies. Typically, these surveys concentrate on well-known luminous galaxies (e.g., Li et al. 2001; Gallagher et al. 2005; Mannucci et al. 2005). Conversely, the Texas SN Search and the Nearby SN Factory are rolling searches with a large FOV (2 and 3 square degrees, respectively) with thousands of galaxies searched impartially.
We list the objects in our SN sample and their basic discovery data in Table 3. Our decision to monitor a particular newly-discovered SN Ib, SN Ic, or SN IIb was broadly informed by three considerations: accessibility, declination , brightness, 18 mag for spectroscopic observations, and 20 mag for optical photometry, and age, SN whose spectra indicated a young age were given higher priority. Of course, the latter two criteria are correlated, since older SN are dimmer.
FLWO undergoes a shutdown during the month of August every year, due to Arizona monsoon season, thus, we have no monitoring data for one month each year.
The 37 SN in our sample that were studied in the literature prior to this work (and to M14) are noted in Table 3. Twenty-two of these were previously studied individually (i.e., not just as part of a survey) in the literature. However the optical and/or NIR light curves are published for only 18 of these 22 SN. In some cases (e.g., SN 2007ke – Section 7.2) the only photometric data published are in a single band, while our data always provides multi-band coverage, in a minimum of three photometric bands. The photometry for an additional 17 stripped SN that are part of our sample appeared in D11 in and bands.
The host galaxy characteristics for all of our objects are listed in Table 4.
3. Photometry Data and Reduction
Our optical and NIR photometric campaigns are described in detail below, and elsewhere (Hicken et al., 2009, 2012; Wood-Vasey et al., 2008; Friedman et al., 2014). We paid particular attention to removing galaxy contamination, as contaminating host galaxy light may affect both the estimates of the peak brightness of the SN and its decline rate (Boisseau & Wheeler, 1991). The optical sample is produced from template-subtracted images in all but 6 cases, where the SN is well removed from the host galaxy (Section 3.1). Thus of our optical sample of 64 stripped SN have photometry based on template-subtracted images. Similarly, for 80% of our objects with NIR coverage, NIR photometry is derived from template-subtracted images: all but 5 objects out of 25.
Photometry in both the natural and standard system is available in the supplementary material of this paper, as well as through the CfA Web site.555http://www.cfa.harvard.edu/oir/Research/supernova/
Below we describe the photometry acquisition for both optical and NIR photometry, as well as the image and photometric reduction pipelines.
3.1. Optical Photometric Observations and Reductions
All optical photometry presented in this paper was obtained with the FLWO 1.2m telescope during the CfA3 (Hicken et al., 2009) and CfA4 campaigns (Hicken et al., 2012). Three different cameras were used to acquire the photometry: the 4Shooter 22 CCD mosaic (for data before 2004 September), the Minicam CCD mosaic camera (2004 September until 2005 July), and the Keplercam CCD mosaic Camera (after 2005 August). All cameras are thinned, back-illuminated CCDs, mounted at the f/8 Cassegrain focus of the 1.2m telescope. All photometry is obtained in Johnson , with and Harris filters. At redder wavelengths, observations were conducted with the 4Shooter 22 CCD mosaic in Johnson band-passes, with the Harris filter set, and after 2004 September with Sloan Digital Sky Survey (SDSS) filters (Fukugita et al., 2007; Smith et al., 2002). In addition in 2009 January the Johnson filter broke and was replaced by an SDSS filter. Two objects in our survey, SN 2009iz and SN 2009jf, have data. The typical FWHM in our data falls between 1.5″ and 3″ , with the larger values typically found in the CfA4 survey. To provide prompt and dense sampling, the SN were observed by observers at the telescopes for other programs, and supplemented by photometric observations on our scheduled nights.
The optical photometry presented here was produced at the same time and in the same way as the CfA3 and CfA4 SN Ia samples. The detailed operations of the optical photometric pipeline are discussed in Hicken et al. (2009), and Hicken et al. (2012) respectively. In brief: we employed differential photometry by measuring the brightness of the SN with respect to a set of comparison stars (ranging from a few to dozens) in the SN field. We employed the photometry pipeline of the SuperMACHO and ESSENCE collaborations (see Rest et al. 2005 and Miknaitis et al. 2007 for details), adapted for the 1.2m FLWO.
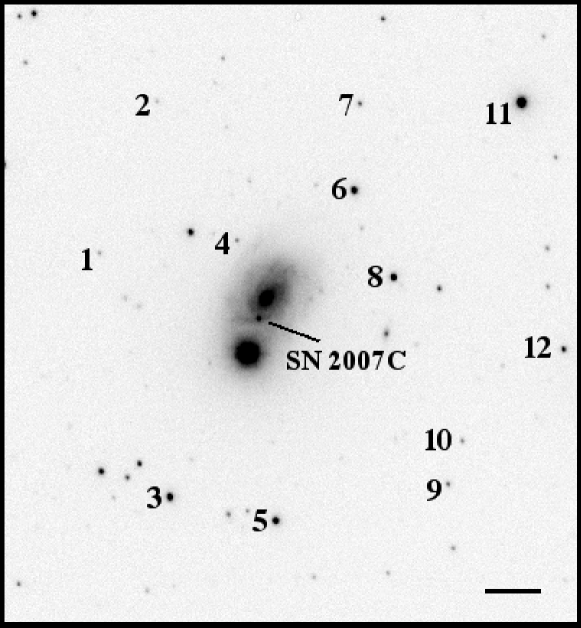
A finding chart is shown in Figure 1, with the field comparison stars marked. Comparison stars for each SN are available on the web666http://www.cfa.harvard.edu/oir/Research/supernova/, and the photometry for the comparison stars used to produce the optical light curve of SN 2005hg is shown, as an example, in Table 5. The comparison stars were calibrated on photometric nights by observing standard stars from Landolt (Landolt, 1992) and Smith et al. (2002). Aperture photometry in IRAF777IRAF (Image Reduction and Analysis Facility) is distributed by the National Optical Astronomy Observatories, which are operated by the Association of Universities for Research in Astronomy, Inc., under cooperative agreement with the National Science Foundation. was used for this calibration.
Color terms are obtained from the standard stars. The implicit color term equations have the following form: for Keplercam-chip2/Sloan, for example, constant. For the filters, the lowercase/uppercase letters in the color terms refer to instrumental/standard magnitudes. For the filters, the lowercase letters refer to the instrumental magnitudes, whereas the primed lower case letters refer to the standard magnitudes. Average color terms for each setup used in our optical sample, along with the internal uncertainties in the mean, are available in the supplementary material, as well as online.888http://www.cfa.harvard.edu/oir/Research/supernova/
Throughout the survey, five different sets of color terms were used, corresponding to four different camera/filter setups (4Shooter 22 – , Minicam – , Keplercam – , and Keplercam – ), slight modifications to the photometric pipeline between CfA3 and CfA4 (all 4Shooter, Minicam and much of the Keplercam data before 2009 was processed during CfA3 while some of the data before 2009 and all of it afterwards was processed during CfA4), and lastly, changes in the instrument transmission observed in mid 2009. For each light curve made available online, the instrument setup and pipeline used for the reduction are indicated in the file header as 4sh/, mini/, CfA3kep/, CfA4kep1/, and CfA4kep2/, respectively. Since no data in Johnson band was collected in 2009, all our is to be processed with the CfA4kep2/ color-terms. Anyone wishing to use the natural system passbands must ensure that the proper passband is used to correct the photometry.
With the exception of 6 objects that are well removed from the host galaxy (SN 2002ap, SN 2004aw, SN 2006gi, SN 2007ce, SN 2007ru, and SN 2008aq), we derive photometric measurements from template-subtracted images (see Smith et al. 2002) using the robust algorithm of Alard & Lupton (Alard & Lupton, 1998; Alard, 2000). The template images of SN host galaxies were obtained under optimal seeing conditions, after the SN had faded sufficiently, usually 6 months to 1 year after the end of the SN observing campaign. In Table 4 we report the characteristics of the host galaxies for all objects in our sample.
DoPHOT PSF photometry (Schechter et al., 1993) was used to measure the flux of the SN and its comparison stars. The majority of the stripped SN photometry in this work was produced during the CfA3 campaign and used only one host-galaxy image for host subtraction. However, the CfA4 campaign used multiple host-galaxy images where possible, and for stripped SN produced during CfA4 we use the median photometry pipeline uncertainty as the uncertainty for each light curve point. The CfA4 SN Ia uncertainties (Hicken et al., 2012) also added, in quadrature, the standard deviation of the photometry values from the multiple host-image subtractions for a given point to produce the total uncertainty. However, this overestimates the uncertainty (Scolnic et al., 2013). In order to maintain consistency with the CfA3-era stripped SN, we present the CfA4 data without adding the standard deviation to the CfA4-era uncertainties. The optical photometry of the 61 SN is available for download999http://www.cfa.harvard.edu/oir/Research/supernova/ and in the supplementary material for this paper.
Optical CfA photometry of some of the SN listed in this paper has been previously published: SN 2005bf (Tominaga et al., 2005), SN 2006aj/GRB060218 (Modjaz et al., 2006), and SN 2008D (Modjaz et al., 2009). The optical data previously published for SN 2005bf were not based on template-subtracted images. Although SN 2005bf is well removed from its host, so host contamination was not significant, here we present the template-subtracted photometry, produced with the standard CfA photometric pipeline. Thus the light curves presented here for SN 2005bf supersede those previously published.
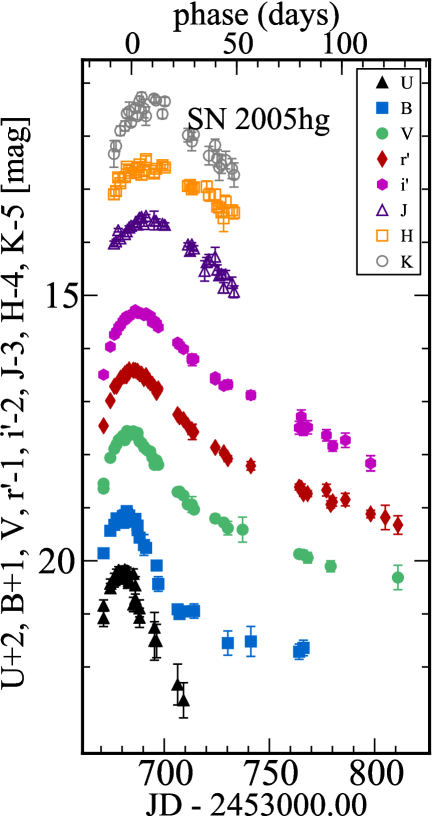
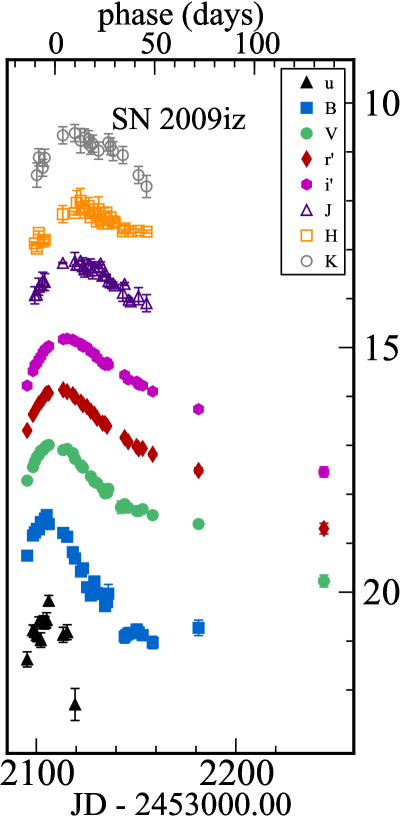
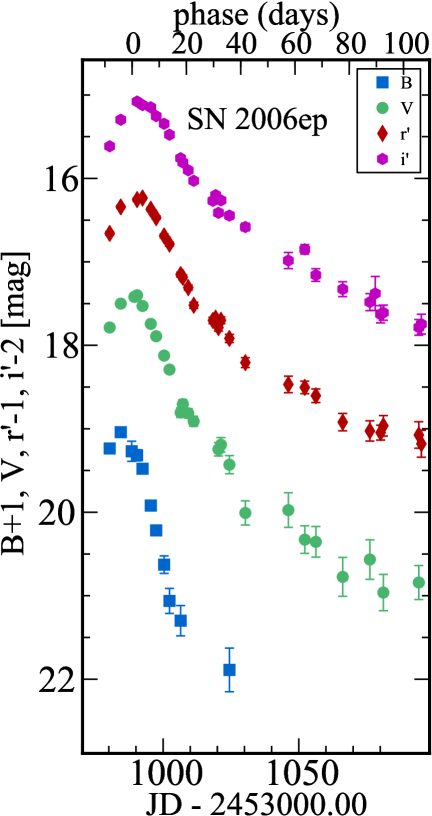
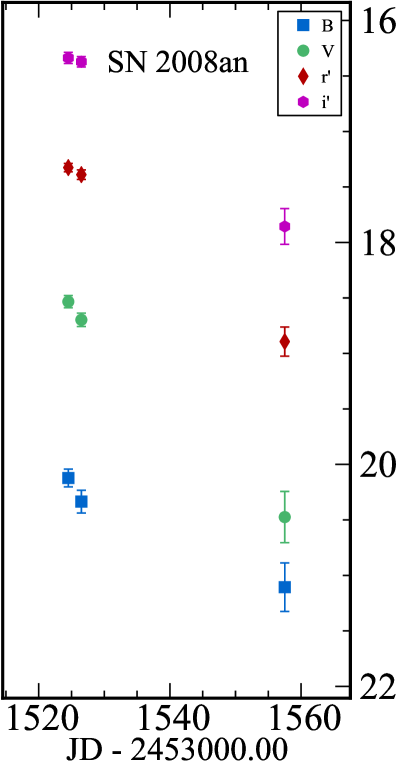
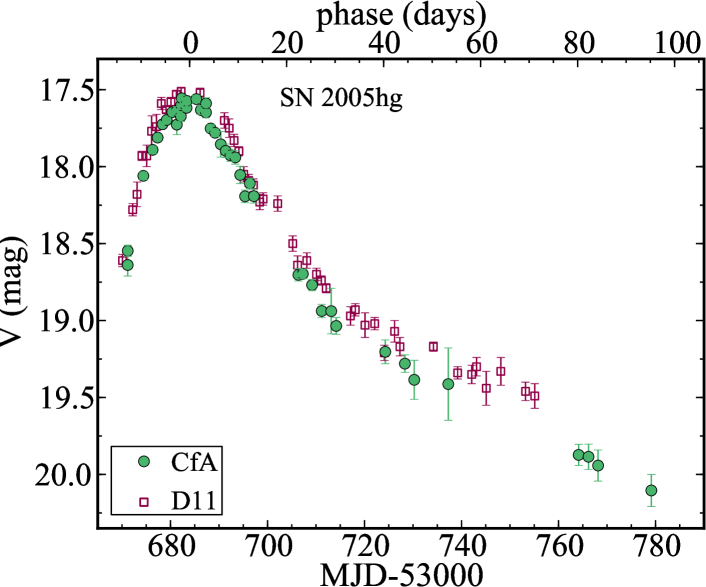
A sample CfA SN light curve is shown in Table 6, and the photometry for four objects, spanning the best and worst sampling quality, is shown in Figure 2. Note that for SN 2005hg, SN 2009iz, and SN 2006ep, where the epoch of maximum -band brightness is known (see Section 4), the epochs are expressed both as JD (bottom -axis) and as days since/to -band peak (top -axis). However, the epoch of maximum -band brightness is not known for SN 2008an. Plots for all SN are available online.101010http://www.cosmo.nyu.edu/SNYU
3.2. Near-infrared Photometry
For 25 SN in our sample, we obtained near infrared (NIR) photometry with the fully automated 1.3-m Peters Automated Infrared Telescope (PAIRITEL)111111http://www.pairitel.org/ located at FLWO. PAIRITEL is a refurbishment of the 2MASS North telescope outfitted with the 2MASS South camera (Skrutskie et al., 2006) and is the first fully robotic and dedicated IR imaging system for the follow-up of transients (Bloom et al., 2006). The automation of PAIRITEL has enabled NIR SN with simultaneous -, - and -band observations and nearly nightly cadence allows for densely sampled PAIRITEL NIR SN light curves, from as many as 10 days before -band maximum brightness to 150 days past maximum. PAIRITEL SN Ia data are published in Wood-Vasey et al. (2008), Friedman (2012), and Friedman et al. (2014) will present the CfAIR2 sample of SN Ia light curves.
PAIRITEL data for individual stripped-envelope SN have been published in Tominaga et al. (2005), Kocevski et al. (2007), Modjaz et al. (2009), Marion et al. (2013), and Drout et al. (2013).
PAIRITEL -, - and -band images were acquired simultaneously with the three NICMOS3 arrays in double correlated reads with individual exposure times of 7.8 seconds. Individual images were dithered every fourth exposure in order to remove bad pixels and aid subtraction of the bright NIR sky. Each image consists of a 256256 array with a plate scale of pixel-1, yielding an individual FOV of .
Sky subtraction is a crucial step in NIR image processing. The PAIRITEL image reduction pipeline software (Bloom et al., 2006; Wood-Vasey et al., 2008; Friedman, 2012) performed sky subtraction before cross-correlating, stacking and sub-sampling the processed images in order to produce the final, Nyquist-sampled image, with an effective pixel scale of 1 pixel-1.
The PAIRITEL imager does not have a shutter, thus independent determination of the dark current is impossible. For all SN, the sky+dark values for a given raw image were determined using a star-masked, pixel-by-pixel robust average through a temporal stack of unregistered raw images, which included removing the highest and lowest pixel values in the stack. The temporal range of the raw image stack was set to minutes around the raw science image, which implicitly assumes that sky+dark values are approximately constant on minute time scales. This reconstructed sky+dark image was then subtracted from the corresponding raw science image. For some SN fields with large host galaxies filling a fraction of the final FOV greater than , a pixel-by-pixel robust average through the image series can lead to biased sky+dark values due to excess galaxy light falling in those pixels. However, overall systematic effects are negligible, biasing photometry to be fainter by only hundredths of a magnitude. The same sky+dark procedure was applied to all SN fields, including those with large host galaxies. The sky+dark subtracted dithered science images are then registered and combined into final mosaiced images with SWarp (Bertin et al., 2002), with a FOV of .
Collection time ranged between 1800-second and 5400-seconds including overhead; the effective exposure times for the final mosaiced images ranged between 10 and 20 minutes. The effective seeing generally fell between 2″ and 2.5″ FWHM. The typical 30-minute signal-to-noise-ratio (SNR=10) sensitivity limits are 18, 17.5, and 17 mag for , , and respectively. For fainter sources, 10 point source sensitivities of 19.4, 18.5, and 18 mag are achievable with 1.5 hours of dithered imaging (Bloom et al., 2003).
Photometric data points are calculated using forced DoPHOT photometry at the best fit SN centroid position. Photometry is generated for each SN from both un-subtracted and template-subtracted mosaiced images, the latter produced using the ESSENCE pipeline (Rest et al., 2005). Typically, a minimum of 3 template images were obtained for each SN, after the SN had faded below our detection limit, 6 to 12 months after discovery. The template-subtracted light curves are created as a nightly weighted average of the photometry produced using different templates. The most reliable photometry is ultimately chosen by visual inspection of the un-subtracted and subtracted mosaiced images, as well as considering the scatter in the photometric measurement obtained by each method. For template-subtracted light curves, a combination of automated and visual inspection also allowed removal of individual bad subtractions and outlier data points arising from poor quality science or template images.
For SN not embedded in the host galaxy nucleus, or with little host galaxy light at the SN position, forced DoPHOT photometry on the un-subtracted mosaics was sometimes of higher quality than the galaxy subtracted light curves. We include in our sample forced photometry NIR light curves from un-subtracted images for the following objects: SN 2004gq, SN 2005ek, SN 2007ce, SN 2007uy, and SN 2008hh. All other NIR SN light curves included here used photometry on the template-subtracted images, including SN 2006aj, and SN 2008D, for which PAIRITEL photometry is already published in Kocevski et al. (2007) and Modjaz (2007), and Modjaz et al. (2009), respectively. A new light curve, generated from template-subtracted images, is presented here for SN 2005bf, and supersedes previously published PAIRITEL data in Tominaga et al. 2005. SN 2005ek is well separated from the host galaxy; the light curve presented here is not based on host subtracted images, however we present additional PAIRITEL data points, together with those already included in Drout et al. 2013, and originally published in Modjaz 2007.
For each SN field, the SN brightness was determined using differential photometry against reference field stars in the 2MASS point source catalog (Cutri et al., 2003). Each field had 10–90 2MASS stars (which achieved 10 point source sensitivities of =15.8 mag, =15.1 mag, =14.3 mag; Skrutskie et al. 2006). No color-term corrections were required since our natural system photometry is already on the 2MASS system. We extensively tested the accuracy and precision of both the PAIRITEL reduction and our photometry pipeline by comparing our photometry of 2MASS stars in the SN observations to that in the 2MASS catalog. The difference between the two photometry values is consistent with zero everywhere in the magnitude range = 12-18 mag. Thus, we conclude our photometry is well anchored in the 2MASS system. Note however, that the difference uncertainties are expected to be correlated, since the 2MASS photometry values were used to compute the zeropoint of each image in the first place. More details of the PAIRITEL image processing and photometric pipelines are presented in Modjaz (2007); Wood-Vasey et al. (2008); Friedman (2012), and Friedman et al. (2014).
4. CfA stripped SN sample statistics
The sample of stripped SN we present contains a total of 64 SN observed between 2001 and 2009. The quality varies. The list below details our objects grouped based on their photometric quality. Several objects are then discussed in the later sections of this paper.
-
•
Our best quality subset contains light curves in at least 4 bands, with data before and after the photometric peak. In this subset are multi-band light curves of 24 objects, 11 SN Ib, 5 SN Ic, 3 SN IIb, 3 SN Ic-bl, and two peculiar SN Ib (SN 2007uy, and SN 2009er).
-
•
An intermediate quality subsample contains multi-band light curves of 26 SN: 6 SN Ib, 8 SN Ic, 4 SN IIb, 4 SN Ic-bl, 1 SN Ic/Ic-bl (SN 2007iq), 2 SN Ib-n/IIb-n (Ib with narrow emission lines of H and He: SN 2005la and SN 2006jc), one Ca-rich Ib (SN 2007ke).
-
•
A subset of 11 SN light curves for which we could not set good constraints on the date of maximum in any band, or which contains only a few epochs, or less than four photometric bands.
-
•
Finally three objects (SN 2005ek, SN 2008ax, and SN 2008hh) have only NIR photometry.
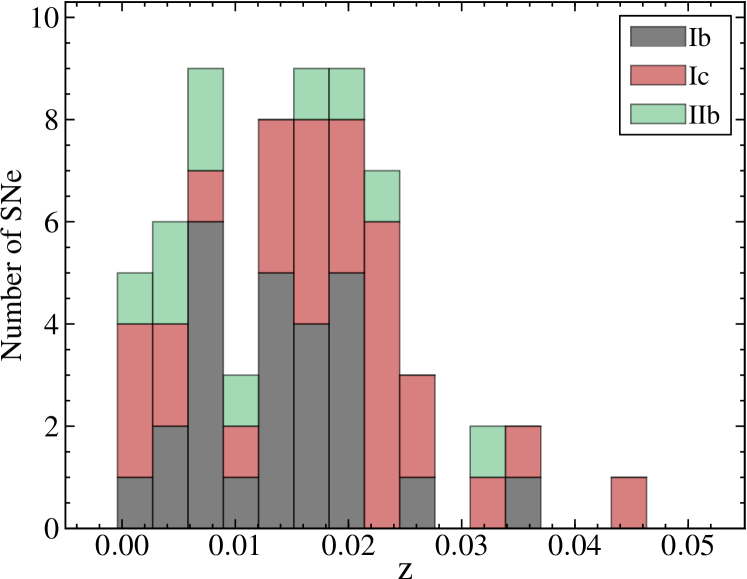
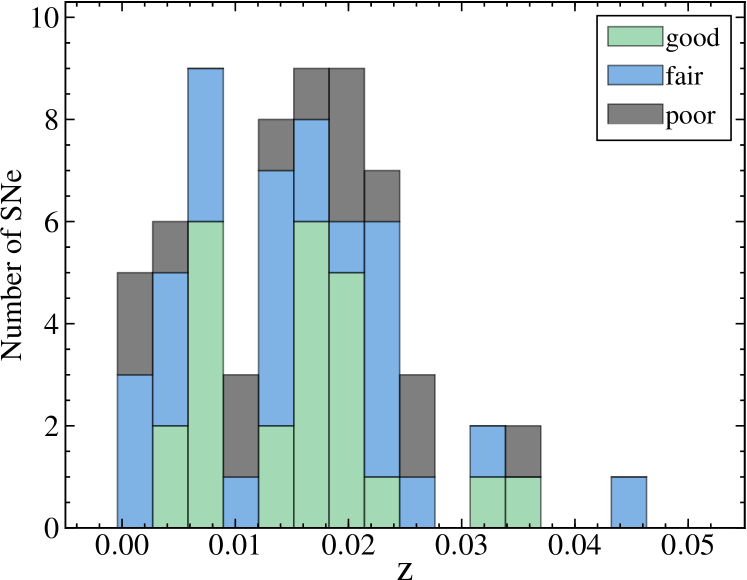
The distribution of our objects in redshift is shown in Figure 3, where we identify different SN types with different colors, and Figure 4, where the color indicates the quality of our photometry.
Most of the optical photometric measurements are in , , , and : 854, 1120, 1115, 1123 in each band respectively; 183 measurements were collected in band. In addition, the earliest objects observed within our program (SN 2001ej, SN 2001gd, SN 2002ap, SN 2003jd, SN 2004ao, and SN 2004aw) were imaged with and filter, in place of and , with 68 and 60 points in each band for the 6 objects. In 2009 the Johnson filter was replaced by an SDSS filter; two objects, SN 2009iz and SN 2009jf, have band data, a total of 20 data points, 13 for SN 2009iz and 7 for SN 2009jf. In the NIR we collected: 774 measurements in , 738 in , and 630 in . The photometry for each of our SN is made available as machine-readable tables in the supplementary material, on our Web site121212http://www.cosmo.nyu.edu/SNYU as plots, and in tabular form.131313http://www.cfa.harvard.edu/oir/Research/supernova/ In Table 8, 9, and 10 we present observational photometric characteristic for all objects in our sample: the epoch of maximum brightness, the peak magnitude, and the decline rate in each filter, whenever it is possible to derive them. Similarly to what is done for SN Ia, we measure the decline rate as : the difference in magnitude between peak and 15 days after peak. We simply rely on a second-degree polynomial fit near the light curve peak to obtain these quantities. Notice that these are presented as observational quantities: no or -corrections are applied to compensate for the reddening effects of redshift, nor do we correct for dust extinction at this time. A more complete analysis of our photometric data will be presented in the companion paper (Bianco et al., in preparation), and such corrections will be discussed there. The maximum brightness, and the epoch of maximum, are measured as follows:
-
•
For each single-band light curve we select by eye a region around peak large enough to allow a quadratic fit (at least four points, typically several more) but small enough to follow a simple parabolic evolution.
-
•
A suite of Monte Carlo realizations is generated by drawing each data point from a Gaussian distribution centered on the photometric data point, and with a standard deviation corresponding to the photometric error-bars. In each realization the boundaries of the region that is fit, particularly after peak where in most cases more photometric data points are available, are allowed to oscillate by including or removing up to three data points. The number of realizations depends on the number of data points used for that particular object: is the integer nearest to , but no smaller than 200:
-
•
Each realization is fit with a second-degree polynomial. The epochs of maximum brightness and the corresponding magnitudes we report are the mean of the maximum epoch and magnitude distributions in the fit over the family of Monte Carlo realizations, and the errors are the corresponding standard deviations.
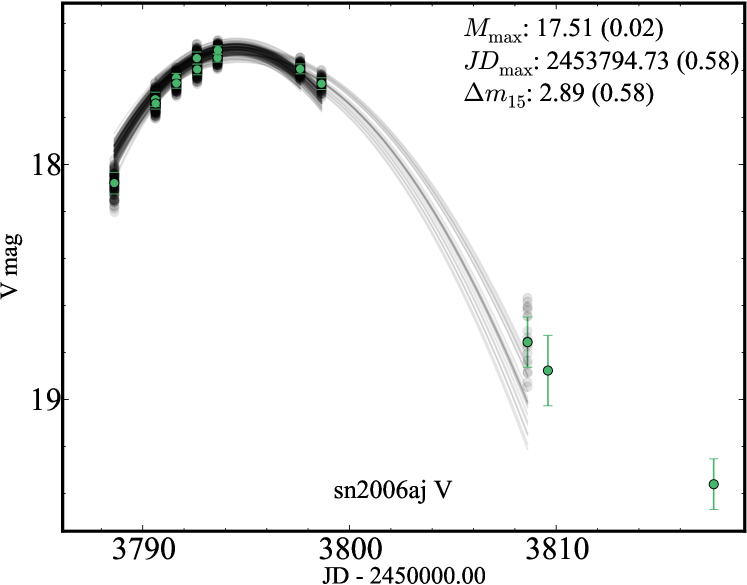
Figure 5 shows the suite of Monte Carlo realization generated for SN 2006aj -band near peak to determine the peak date and magnitude, and their uncertainties. Notice that, with a day gap in the coverage starting about 4 days after peak, the determination of is indeed affected by the choice of boundaries to the region used for the parabola fit. By means of the Monte Carlo simulations this is reflected in a 0.61 days uncertainty. The can be estimated as an extrapolation of the polynomial to 15 days. However, we only report this metric when it is sensible to do so: when data covers epochs near 15 days after maximum in the band considered, and the quadratic fit is consistent with these data. In the case of SN 2006aj, for example (Figure 5), these criteria are not fulfilled, and the obtained through polynomial fitting, shown in the figure, is not reported in Table 8.
In Table 1 and Table 2 we report the statistical differences we find across our sample in the date of maximum, and peak magnitude, compared to (helpful to estimate , which is usually the reference for spectral phases, even in absence of adequate coverage around peak).
| Band | Weighted average | Median | Standard deviation |
|---|---|---|---|
| -1.2 | -3.3 | 2.1 | |
| -2.3 | -2.3 | 1.3 | |
| 1.8 | 1.5 | 1.3 | |
| 3.5 | 3.1 | 1.5 | |
| 8.5 | 6.9 | 3.3 | |
| 10.1 | 9.8 | 4.3 | |
| 10.5 | 10.9 | 5.0 |
| Band | Weighted average | Median | Standard deviation |
|---|---|---|---|
| -0.13 | -0.20 | 0.27 | |
| -0.70 | -0.62 | 0.16 | |
| 0.21 | 0.19 | 0.16 | |
| 0.25 | 0.17 | 0.32 | |
| 0.91 | 0.73 | 0.71 | |
| 1.04 | 0.81 | 0.81 | |
| 1.35 | 1.19 | 0.87 |
In Table 4 we report the characteristics of the host galaxies for all objects in our sample. We report the distance to the host galaxy (as heliocentric recession velocity), the absolute and apparent magnitude, when available, and distance modulus. These quantities are extracted from the HyperLEDA catalog141414http://www.leda.univ-lyon1.fr (Paturel et al., 2003). When not available in HyperLEDA, the NED catalog is used, and the cosmological parameters used, for consistency with HyperLEDA, are: , , and
We report Galactic extinction () for each of our objects based on its sky coordinates, and on the most recent dust maps produced by Schlafly & Finkbeiner (2011). Note that these extinction maps deviate by about 10% in high-extinction regions from the older, and commonly used Schlegel et al. (1998) maps. The photometry we provided is not corrected for Galaxy, host, or cosmological extinction or reddening.
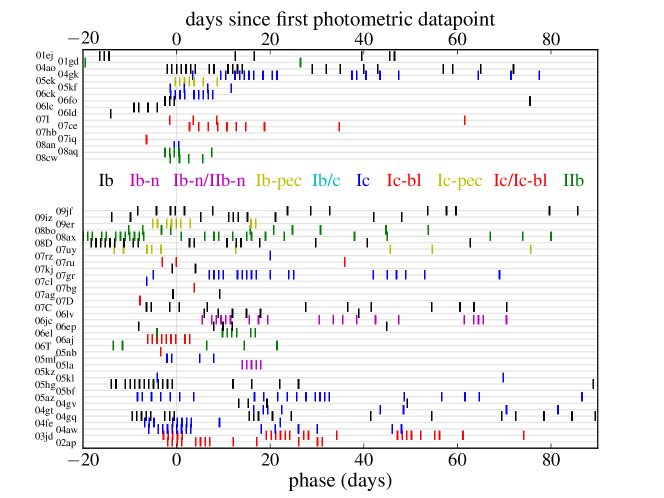
Among the supernovae in this sample over 80% of the objects have spectra collected within our SN program (M14): only SN 2005kz, SN 2006F, SN 2006ba, SN 2006bf, SN 2006cb, SN 2006gi, SN 2006ir, SN 2007aw, SN 2007ke, and SN 2009K do not have any spectral coverage obtained within our group. Spectral information for SN 2007ke exists in the literature, and it indicates that SN 2007ke is an unusual Ca-rich SN Ib (Kasliwal et al., 2011). SN 2008hh does not have spectral coverage within the CfA sample and it only has NIR CfA photometric coverage. Figure 6 shows the epoch of all spectra obtained at FLWO for the objects in our sample. In the bottom portion of the plot all objects for which the epoch of maximum brightness () is available are plotted against the bottom -axis: the epoch of the spectra is expressed as days to (since) . In the top portion of the plot the 17 objects for which we have CfA spectra, but is not known (neither through our data nor in the literature) are plotted against the top -axis, with the epoch expressed as day to (since) our first photometric measurement. Omitted from the plot are all spectra collected at epoch days, however our spectroscopic sample contains many nebular phase spectra (M14).
5. Comparison with literature data
Out of the 64 objects that comprise our sample, 37 objects have published photometry. The objects for which data is available in the literature are marked in Table 3. When photometric measurements exist for an object in the same photometric system of our monitoring program, or the photometric conversion is trivial (when the photometric system for the data available in the literature is well defined) we compare our data with the published photometry. In addition, when more data around maximum are available, our data are combined with the literature data to derive a more accurate date of maximum in , following the procedure described in Section 4 and Figure 5.
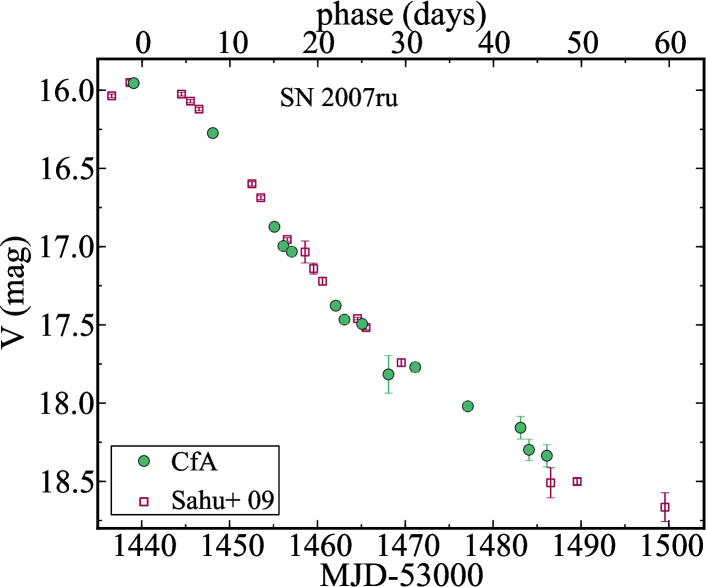
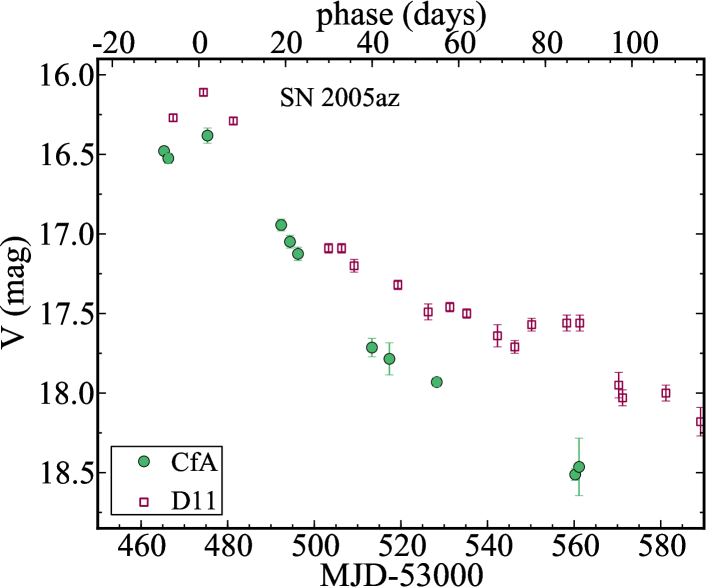
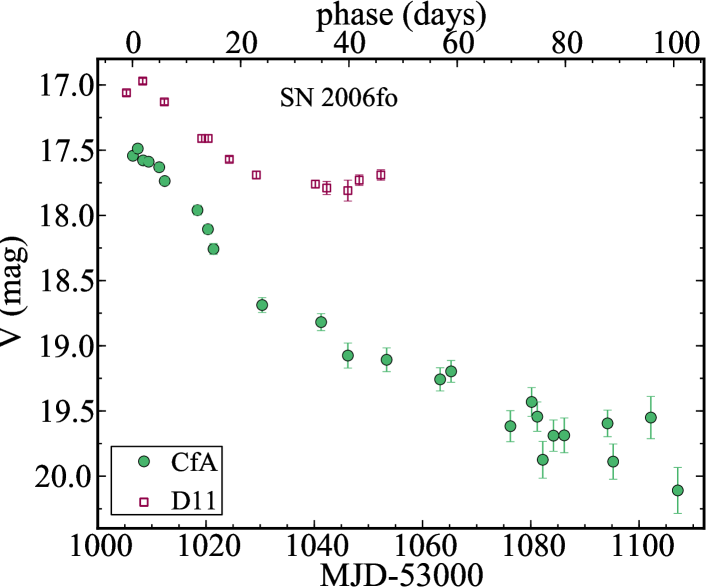
We find that our photometry is generally consistent within the errors with published photometry for the objects in our sample (Figure 7), with one notable exception: D11 offered the most complete study of stripped SN light curves to date, and our samples share 17 stripped SN. D11 published photometry in and . When compared with our photometry, only two objects appear to be in excellent agreement in both bands: SN 2004gk, and SN 2006jc. SN 2005hg and SN 2007C agree well in , but shows an offset in . In addition for SN 2005la and SN 2006jc an independent confirmation of the magnitude is also available. The D11 photometry of SN 2006jc includes data from Foley et al. 2007, and Pastorello et al. 2007, and the photometry agrees well with ours. The D11 photometry of SN 2005la includes measurements from Pastorello et al. 2008a, and although the light curves from both the D11 and our surveys are noisy, they are in reasonable agreement.
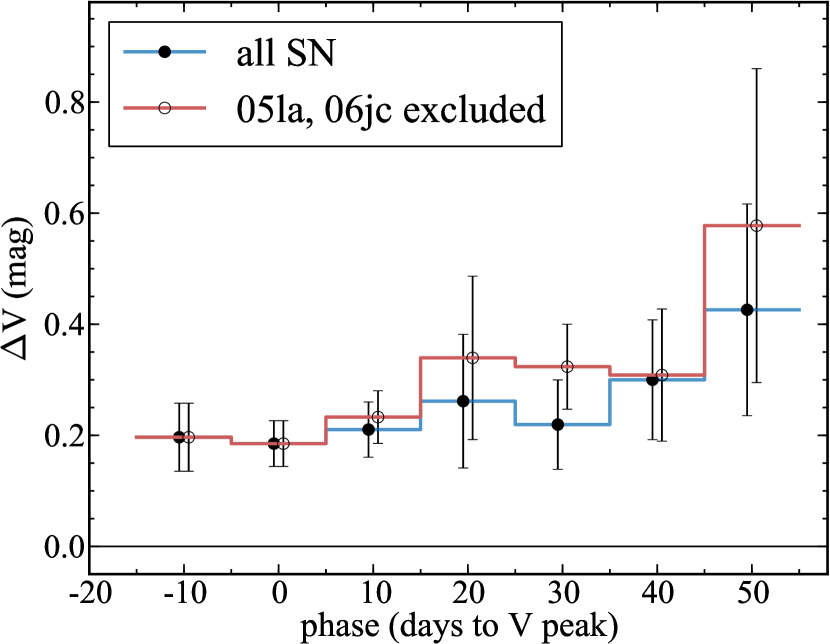
For the remaining objects, where the coverage overlaps allowing a comparison, we notice that the D11 photometry is brighter, with up to a magnitude difference in at peak and over 0.5 mag in (e.g., SN 2006fo, Figure 8). The discrepancy typically increases as the SN evolve, growing as large as in and mag in at later epochs (, e.g., SN 2007D, SN 2006fo). Figure 9 shows the evolution of the mean discrepancy in band between the D11 and CfA surveys, as a function of phase. Photometric measurements are included if the separation in time between the D11 and CfA photometry is less than 5 days for epochs earlier than 45 days after , and less than 10 days for later epochs. A single SN can contribute to each bin with one or more data points. Error bars represent the error in the mean offset for each epoch (standard deviation over square root of the number of data points that generates the mean). The mean evolution is shown for all objects, as well as after excluding SN 2005la and SN 2006jc.
Figure 10 shows a histogram of the distribution of band magnitude offsets for data points within 5 days of , within 5 days of phase=40 days after , and for any epoch later than 45 days after . Notice that all offsets are positive, or zero at best, indicating that the D11 is always brighter than the CfA photometry, and at later epochs the discrepancy increases, as the D11 light curves reach a plateau.
For all of these objects, our measurements are generated as PSF fitting photometry on host-subtracted images, while D11 performed PSF fitting photometry on the original images, without host subtraction. Thus we attribute this discrepancy to galaxy contamination in the D11 sample. The discrepancy is consistent with the well-known effect of host galaxy contamination on SN light curves, as the SN fades and becomes less bright in comparison to the host-galaxy, as described in (Boisseau & Wheeler, 1991). Additionally our photometry has proven to be consistent at the level of a few hundredths of a magnitude on average for a large sample of SN Ia (Hicken et al., 2012, 2009). Visual inspection of the SN images shows that several objects for which the difference is largest are in fact close to the core of the host galaxy (e.g., SN 2006fo) or in bright regions of the host galaxy arms (e.g., SN 2004gt, SN 2004fe).
D11 classified their sample by quality in three groups: a gold, a silver, and a bronze subset. The latter is judged too poor to be used for the analysis and all inference in D11 is based on the gold and silver objects. We notice that, although still typically brighter, the gold sample is in best agreement with our data, while the silver and bronze sample shows the largest offsets (see Figure 8 and Figure 11). The host contamination in the D11 sample may affect the time evolution of the SN, and particularly the estimates, and the use of the color evolution in correcting the host galaxy extinction, since, in addition to giving rise to an offset in magnitude, the contamination is worse at later epochs and is different in different bands.
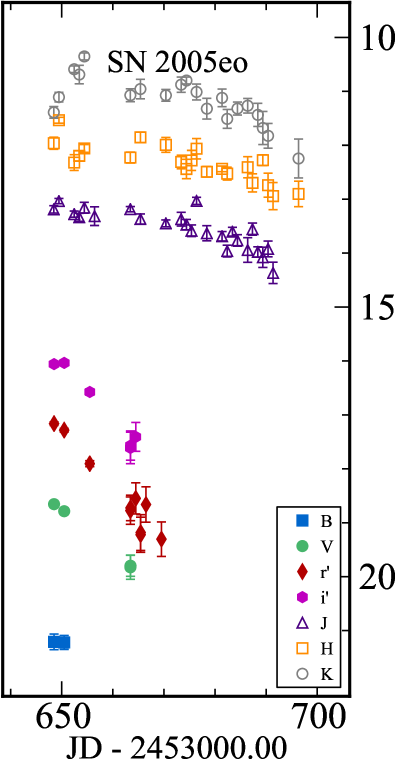
Finally, in addition to the 17 stripped SN common to our samples, D11 presents photometry or SN 2005eo, which was also monitored at the CfA. SN 2005eo is included in the D11 silver sample, and was originally classified as a SN Ic. SN 2005eo was however removed from our stripped SN sample, as we reclassified this object as a SN Ia (M14). This classification is further discussed in Section 7.3.4.
6. Colors and Color Evolution
Our multi-wavelength photometric coverage allows us to discuss the color characteristics and color evolution of the supernovae in our sample. While an in-depth discussion is beyond the scope of this paper, and it will be presented in (Bianco et al., in preparation), here we present the basic color evolution and color-color behavior of our stripped SN sample.
When we discuss colors, color evolution, and for all plots in color space, we correct the magnitude of all objects in our sample for Galactic extinction only. The Galactic extinction is obtained adopting the Schlafly & Finkbeiner (2011) recalibration of the Schlegel et al. (1998) extinction maps, with the reported in Table 4. For each photometric band we use the extinction coefficients normalized to the photoelectric measurements of as reported in Table 6 of Schlegel et al. (1998), which assume a reddening law according to Fitzpatrick (1999) with , and standard transmission for the Landolt , the SDSS , and 2MASS filters. These extinction corrections are based on star spectra and we do not correct the extinction for the SN SED. Based on Jha et al. (2007), who studied this effect for SN Ia, we estimate the correction on to be . No host reddening or cosmological corrections are applied. While with spectra and NIR data the host reddening can be constrained (Bianco et al., in preparation), here we use the observed color. This approach is sensible to aid photometric differentiation of subtypes.
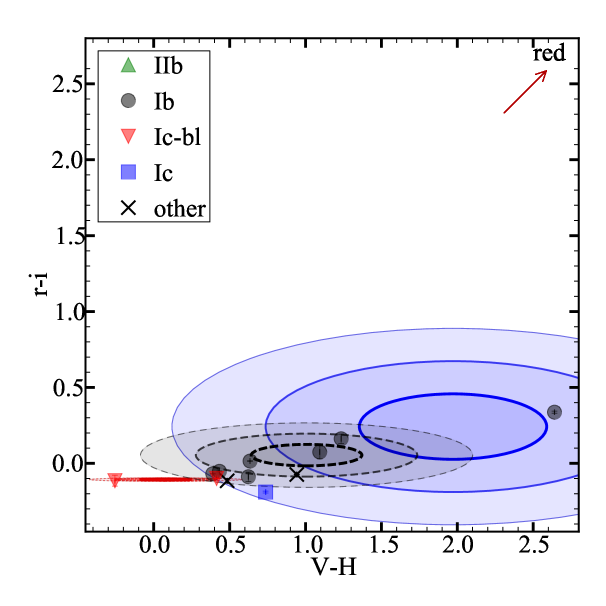
Figure 12 shows color-color plots for our sample of stripped SN in vs. , vs. , and vs. space. The errorbars in the plot are generated by adding photometric errors in each band in quadrature (disregarding correlation). All objects with a solid determination of , either in the literature or derived from our data (Section 5), are included in these plots when photometry data are available within 8 days of for all four bands used in each plot. In vs. this amounts to 47 objects: 8 SN IIb, 15 Ib, 13 Ic, 6 Ic-bl. Identified as “other” are objects for which we could not determine a subtype (SN 2007iq, which is of uncertain classification Ic or Ic-bl, as only late spectra are available), or that appear spectroscopically atypical (the Ca-rich transient SN 2007ke, the narrow line SN 2005la, and the SN Ib-pec 2007uy and SN 2009er). The spectroscopic characteristics of these objects are discussed in detail in M14 and the photometric properties of SN 2007ke, SN 2005la are discussed in Section 7. The ellipses in the plot represent the mean (center) and standard deviation () of each subtype distribution.
In vs. all distributions are well consistent with each other to the 1 level: the subtypes cluster in overlapping distributions and appear indistinguishable in this color-color space (Figure 12, top panel). When NIR colors are used the subtypes seem to separate in color-color space, although the number of objects available for this analysis is smaller. When including NIR colors () the number of objects that can be used for this plot drops significantly, as only 15 objects in our sample have a determination of and optical and NIR photometry within 8 days of it. These objects include: 8 SN Ib, 2 SN Ic, and 2 Ic-bl, and the peculiar objects SN 2007uy and SN 2009er (in these plots under the label “other”). Subtypes separate to level, particularly in vs. . The distribution in fact shows the broadest variation, while the is the narrowest. Amongst the SN IIb only SN 2008ax has NIR coverage, but unfortunately there is no optical coverage from FLWO for this SN, thus no SN IIb were included in the vs. or vs. plot. The mean of the distribution of SN Ib and Ic is still consistent within 2, but SN Ib appear redder in , and SN Ic-bl bluer, though this observation is based on only 2 SN Ic-bl and it needs to be verified in larger samples.
While these trends are based on small samples, they highlight the importance of NIR photometry, and we suggest populating such vs. color-color plots in the future to verify the SN-type-dependent color trends observed here, which ultimately could be used to differentiate core-collapse SN subtypes photometrically.
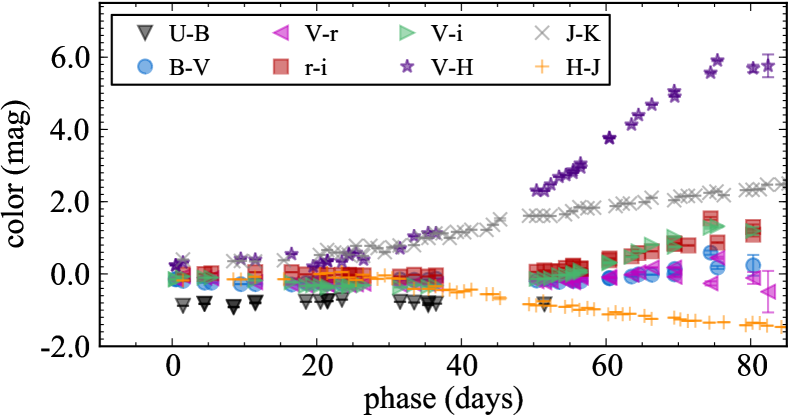
We plot the color evolution of our objects in , , and in Figure 13. In each plot all photometric data between -20 and 210 days with respect to the epoch of peak V magnitude, , are plotted in the bottom panel for all SN with well determined . All objects in our sample with known are on display here. The errorbars represent the photometric errors. The scatter in the bottom panels of this plot thus represents the diversity in the observed photometry of stripped SN.
The top panel shows the mean color evolution, binned in 10 day intervals, and its standard deviation as a gray area. This is the weighted average of the photometry for all objects calculated over 10-day bins, weighted by the photometric errors. The standard deviation in the average is calculated as the second moment of the distribution of photometric measurements, disregarding the photometric errors. The weighted average colors for a more complete set of color spaces is shown in Figure 14. Outliers are plotted in color in Figure 13 in each top panel, with the same 10 day binning, and errorbars representing the standard deviation within the bin. All objects with a binned color data-point with a 2 lower (upper) limit above (below) the average by more than 2 standard deviations (standard deviations of the average in this case) are considered outliers, are plotted in this panel, and identified in the legend. Note that SN 2006jc (Section 7.3.2) is an obvious outlier in each of these plots (gray circles) with early blue and late red colors. SN 2006jc is removed from the calculation of the mean color evolution, as it is known to be spectroscopically peculiar and its late-time color-evolution is driven by non-intrinsic SN processes, such as dust formation (see Section 7.3.2 and references therein). Other outliers are discussed in Section 7.
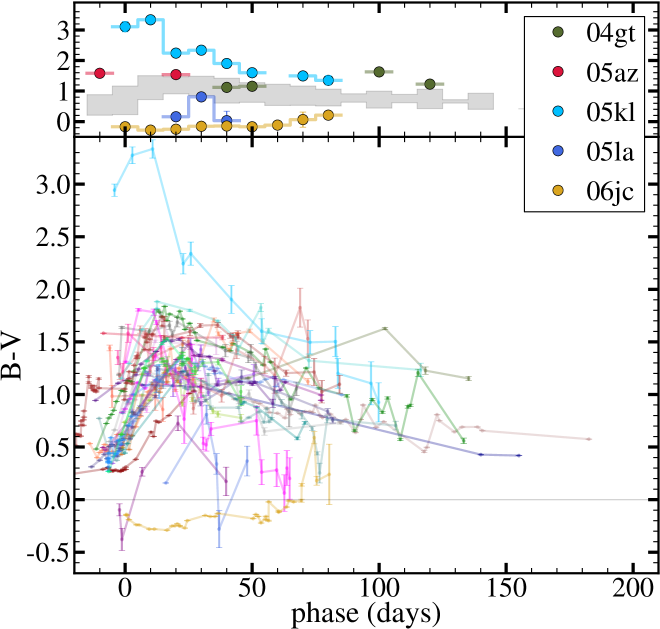
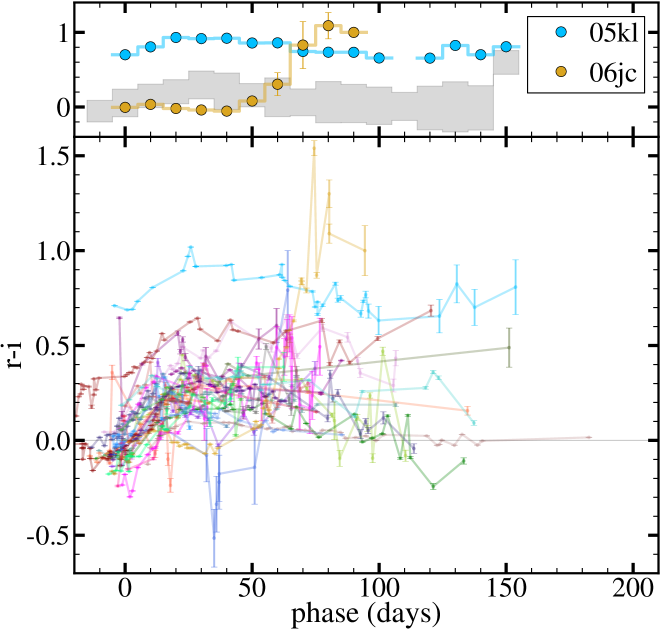
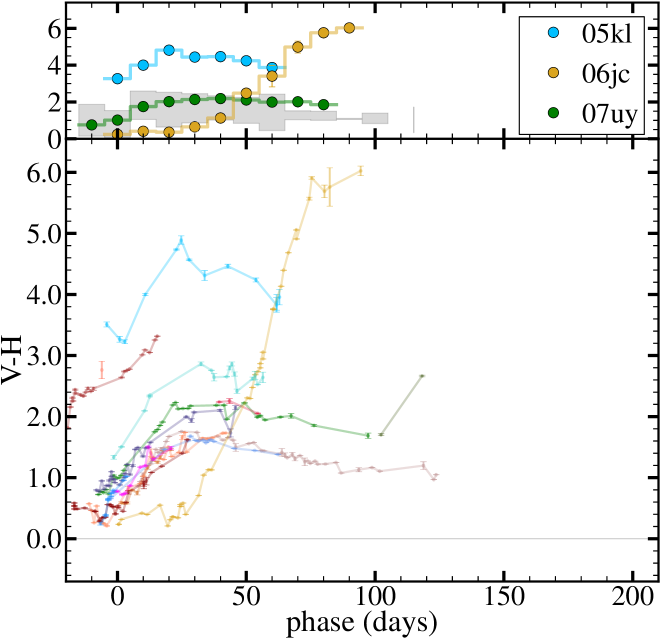
Finally, we present the average color evolution across our sample, and its standard deviation, in Figure 14 for , , and (left), and , , , (right). For , , and these averages also appear as shaded regions in Figure 13. The average, weighted by the photometric errors, is generated in each color band as described in the previous paragraph, again excluding SN 2006jc.
We notice that:
-
•
the largest color variation is observed in : in time, (Figure 14), as well as amongst different SN types (as already noted in Section 6 and Figure 12, and indicated by the large standard deviation in this plot). Two causes may contribute to this effect: the small size of the sample that has photometry near in both and , which is only 20 objects, and host galaxy reddening effects. High reddening would have the most impact on the bluest and the least on the reddest band, and would result in a large effect in , since we are bridging an interval of over 1100nm in wavelength. However reddening would affect the spread in color equally at all epochs (the standard deviation of the mean color, which is in fact large, typically mag). The color evolution over time is due to intrinsic changes in the SN SED as the SN evolves. The mean color spans a dramatic 1.6 magnitudes between days before and 50 days after peak;
-
•
the least variation is in : only 0.5 mag total as seen in Figure 14 both for the standard deviation, and for the change in mean color over time. Narrow standard deviations are also observed in and , while shows remarkably little color evolution;
-
•
the colors at peak are intriguingly similar for all objects. This was also noticeable in Figure 12, especially for SN Ic-bl, although only 6 and 2 SN Ic-bl are plotted, respectively, in the top and two bottom panels, due to the availability of photometry in all four bands needed for each plot. However, we can measure the color within 10 days of for 7 SN Ic-bl. We find a mean peak color for SN Ic-bl of mag. The standard deviation for the distribution of other types is at least twice as large.
These color evolutions and the relation between colors are worth a more thorough investigation, since they will be valuable in typing and classification in synoptic surveys where the data volume renders spectroscopic identification infeasible, and followup resources will be scarce compared to the number of discoveries. A more complete analysis of the colors of stripped SN, and their correlations with types will be presented in Bianco et al. (in preparation) including SN data from the literature.
7. Discussion of specific SN
7.1. SN 2005bf
Some CfA optical and NIR photometric measurements of SN 2005bf were published in Tominaga et al. (2005), but the data presented here used template subtraction and more comparison stars for the reduction, and they supersede the measurements in Tominaga et al. (2005). SN 2005bf was an unusual SN Ib with unique photometric and spectroscopic properties (Mattila et al., 2008; Tominaga et al., 2005; Folatelli et al., 2006; Maeda et al., 2007; Maund et al., 2007), interpreted as a strongly aspherical explosion of a Wolf-Rayet WN star, perhaps with a unipolar jet (Tominaga et al., 2005; Folatelli et al., 2006; Maund et al., 2007), and possibly powered by a magnetar at late times (Maeda et al., 2007).
Our light curve has excellent multi-band coverage of the region around peak brightness, both before and after peak: the first CfA optical epochs were collected on JD 2553471.742 (), while NIR coverage began 10 days later. The CfA optical and NIR light curve of SN 2005bf is shown in Figure 15, left panel. An early peak is clearly identifiable in the bluer bands and , and (less clearly) in on . A later, more prominent peak, visible in all bands occurs in on 2453498.96 (). Our photometric coverage continues through JD 2553526 in optical wavelengths and JD 2553525 in NIR. An in-depth phenomenological discussion of these peaks was presented in Tominaga et al. (2005), and Folatelli et al. (2006). We notice that the first peak is too late after explosion to be consistent with a standard shock breakout (as seen in SN 2008D – Soderberg et al. 2008; Modjaz et al. 2009), while if the second peak is considered, the rise time for this SN is unusually long (over 30 days!). The second maximum and long rise time has been attributed to the highly aspherical distribution of a large amount of 56Ni synthesized in the explosion (Tominaga et al., 2005; Folatelli et al., 2006). M14 discusses how the choice of the epoch for the peak affects the spectroscopic analysis of SN 2005bf.
7.2. SN 2007ke
SN 2007ke is a known Ca-rich transient with 7 photometric data points in KAIT published in Kasliwal et al. (2011). Our data does not cover the rise of the light curve, thus we estimated the -band maximum using the Kasliwal et al. (2011) data according to the prescription described in Section 4, and applying a shift corresponding to the median difference in time between and reported in Table 1. Adding the error to the fit (0.32 days) and the standard deviation in the time offset (1.4 days, Table 1) in quadrature, we obtain . While our photometry is sparse, and our coverage begins near peak, we have coverage in four bands , with four epochs in and , including a non detection at JD=2454402.8, and five in . This allows us to probe its color evolution, and we notice that SN 2007ke shows scatter (Figure 15, right panel). Additionally, it was noted (Kasliwal et al., 2011) that SN 2007ke is well removed from its host galaxy (compare its separation of arcmin from the center of the host, Table 4, with NGC 1129’s radius of 1.6 arcmin: the extinction corrected apparent semi major axis of the 25 isophote reported by HyperLEDA, Paturel et al. 1991). Additionally, SN 2007ke is the only SN in our sample to arise in an elliptical host galaxy (see Table 4), confirming the environments of Ca-rich transients are unusual, compared to stripped SN host environments, as pointed out in (Kasliwal et al., 2011).
7.3. Unusual color evolution
Figure 13 shows the color evolution of our SN in , , and . The top panel in each of the three plots shows the mean color evolution, as described in Figure 14, and over plotted are the color curves for outliers: objects whose color, binned in 10 day intervals, is at least 2 away from the 2 limit of the color average in one or more bins. Three obvious outliers in these plots are discussed in this Section: SN 2006jc, SN 2005kl (both outliers in all three color spaces), and SN 2005la (outlier in , and for which we have no NIR coverage). Additionally SN 2008D is a outlier in both and . Although SN 2004gt, SN 2005az, and SN 2007uy, also appear in the top plots in Figure 13 as outlier in one color space, their classification as outlier is weak, due only to the distance of one early (SN 2005az) or one late 10-day bin (SN 2004gt, SN 2007uy) from the sample average, and are not discussed individually.
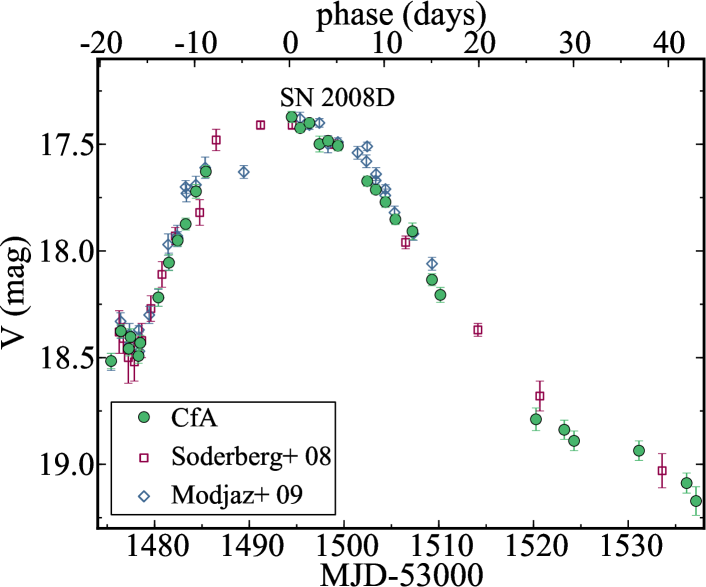
7.3.1 SN 2008D
SN 2008D is a well studied SN Ib (Soderberg et al., 2008; Mazzali et al., 2008; Modjaz et al., 2009; Malesani et al., 2009), discovered in the X-Ray while SWIFT monitored the host galaxy to observe the evolution of SN 2007uy (Soderberg et al., 2008), thus yielding very stringent optical and NIR pre-explosion limits only hours before explosion (Modjaz et al., 2009). Our data on SN 2008D were already published in Modjaz et al. (2009), and it is presented again here for completeness. SN 2008D does not appear as an outlier in Figure 13, but it is a outlier in both and colors. Its light curve is redder than the mean over the entire evolution, and in fact SN 2008D is known to suffer significant host reddening ( mag - Soderberg et al. 2008), in addition to the early (prior to days to ) blue excess attributed to cooling of the shock-heated stellar envelope (Modjaz et al., 2009).
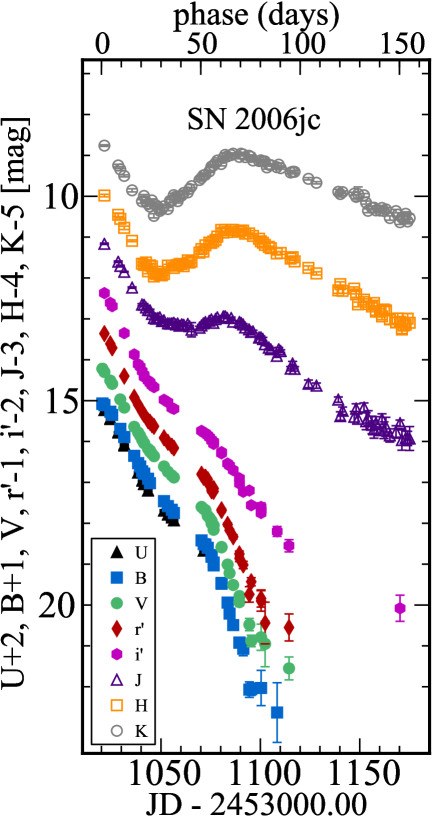
7.3.2 SN 2006jc
SN 2006jc is classified as a SN Ib-n. A re-brightening in the NIR light curve of SN 2006jc was noticed first by Arkharov et al. (2006). Our NIR data has exquisite sampling of the NIR re-brightening, which begins near JD 24541050, or roughly 40 days after peak, adopting the peak determination of Pastorello et al. (2008a), and continues with regular sampling through 160 days after peak. We also present regular photometry in optical bands that continues through 100 days after peak. Optical and NIR photometry of SN 2006jc can be found in the literature (Mattila et al., 2008; Pastorello et al., 2008a). We plot our light curve in Figure 16 (left panel), and color time series in Figure 17. The unusually blue early color of SN 2006jc at early times, and its later NIR re-brightening have been explained by complex interaction with circumstellar material. The early blue color is due to interaction with He-rich material ejected by the progenitor in prior outbursts (Pastorello et al., 2007; Foley et al., 2007; Smith et al., 2008), and the reddening is due to production of dust triggered in the ejecta at later epochs (Mattila et al., 2008; Pastorello et al., 2008a).
7.3.3 SN 2005la
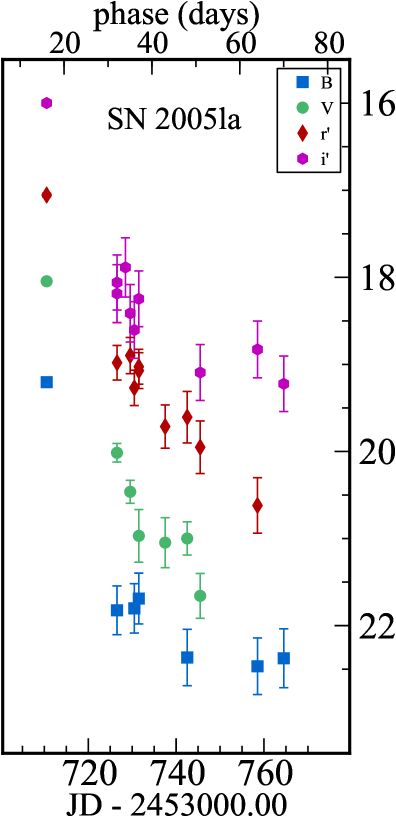
SN 2005la (Figure 16, right panel) is spectroscopically peculiar, showing narrow He and H lines in emission, indicative of interaction with circumstellar material (Pastorello et al., 2008b), and is considered a transitional object between SN 2006jc-like events, and SN IIn. SN 2005la appears as a blue outlier in , and it is bluer than the mean in , evolving redward at late times (phase days). SN 2005la is also included in the D11 sample. We note that SN 2006jc and SN 2005la, both SN interacting with a He-rich, and for SN 2005la also H-rich, circumstellar medium have bluer colors than the rest of the normal stripped SN. Figure 3 in Pastorello et al. (2008b) shows the evolution of SN Ib-n (also including SN 2000er and SN 2002ao): all of these SN have very blue colors ( mag for 0 to 100 days after maximum) when compared to non-interacting stripped SN, as in our Figure 13. The bluer colors of these SN Ib-n and SN 2005la are due to both a bluer continuum (most likely due blending of FeII lines from fluorescence, Foley et al. 2007) and to strong He lines in emission.
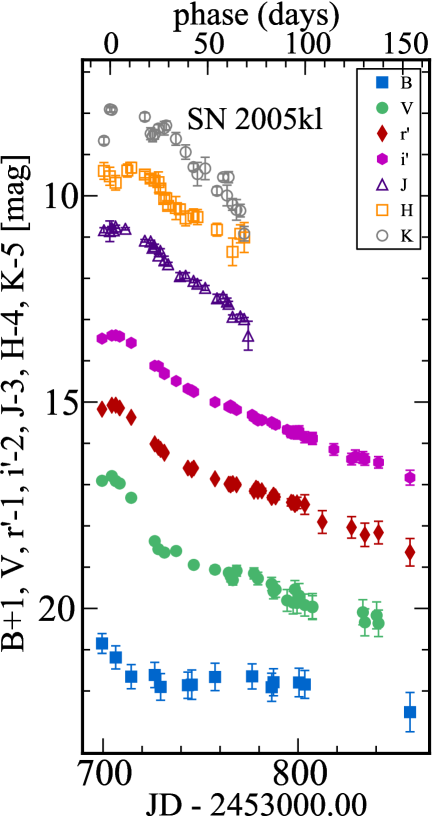
7.3.4 SN 2005kl
SN 2005kl (light blue in Figure 13) is consistently and significantly redder than the sample mean throughout its color evolution in each color space. However it is not spectroscopically peculiar.
The SN is in a bright and high-gradient galaxy, making image subtraction difficult, and resulting in the large errorbars, especially in . From the spectra, published in M14 it is evident that the SN sits in an HII region. SN 2005kl is classified as a SN Ic in M14. The sparse spectral coverage cannot rule out the development of He I lines near peak, which would modify the classification to SN IIb. We notice a supernova that shows a qualitatively similar color evolution, with suppressed flux, and red colors, is SN 2005eo. CfA light curves for both objects are shown in Figure 18. While SN 2005eo was initially classified as a SN Ic, and thus included in the D11 sample, we now reclassify it as a late SN Ia (M14)151515The light curve was fitted with SNANA (Kessler et al., 2009), but with the little available data the photometric fit remains inconclusive, although SN Ic provided worse fits than SN Ia’s. Although SN 2005eo would not be a standard SN Ia, as its -band flux fall is slow, the poor light curve fit to SN Ic templates reinforces our trust in the new spectroscopic classification.. With its reclassification the earliest optical photometry in D11 is actually catching the second -band peak of the late SN Ia. Both SN 2005kl and SN 2005eo are found in early type spiral galaxies. Neither object suffers from significant galactic reddening (see Table 4). While SN 20005kl may show similarly red colors as SN 2005eo, a SN Ia, we are certain that SN 2005kl is not a SN Ia since our CfA late-time, nebular spectra of SN 2005kl show strong emission lines of [OI] and [CaII], characteristic of stripped SN (M14).
8. Conclusions
This paper presents a densely-sampled, homogeneous suite of photometric measurements of stripped SN at optical and NIR wavelengths: (before 2009 January) and (after 2009 January); ; (before 2004 September) and (after 2004 September); and bands, including 61 objects covered in optical bands, and 25 in NIR. These data were collected between 2001 and 2009 at FLWO.
Our photometry provides additional data for 37 supernovae already discussed in the literature, and the first published measurements for 27 new supernovae. Among the objects previously published, we are publishing photometry for 6 objects studied in the literature at other wavelengths (radio or UV), or with methods different than photometry (e.g., spectroscopy, or host and progenitor studies, see Table 3), but for which photometric measurements had not yet been published. Stripped SN spectroscopy from our group is presented in M14, complementing this data set with coverage for 54 of our total 64 objects.
This is the largest stripped SN data set to date, containing multi-color photometry in bands from optical to NIR . Our sample includes 64 stripped SN, 22 with both optical and NIR measurements, 61 with optical measurements, and 25 with NIR measurements. This doubles the current supply of stripped SN objects in the literature. All SN have multi-band data, allowing the determination of multiple colors. Our photometry (described in Section 3.1 and 3.2) is produced from template-subtracted images, for all but 6 objects in optical bands and 5 in NIR, since those objects are well removed from their host galaxy. We compare our photometry with literature data (Section 5) and find agreement within the errors for most published SN. However, we find D11 photometry to be brighter than ours by as much as one magnitude at peak, and even more at late times. We attribute this discrepancy to host galaxy contamination in the D11 data, since the D11 photometric data are not based on template-subtracted images.
A solid determination of the epoch of maximum brightness in -band () is now possible for 36 objects using our data in combination with existing literature data (Section 4).
With these data we investigated the color behavior of stripped SN (Section 6), with the caveat that no corrections for host galaxy extinction have been applied to our data. This approach captures the observed color behavior of stripped SN (also adopted for SN rates, in Li et al. 2011 for example), and simulates the parameter space of current and future optical and NIR surveys such as RATIR (Butler et al., 2012) and LSST (LSST Science Collaboration and LSST Project, 2009), assuming the reddening of the SN in our sample experienced is representative.
We present an intriguing separation of different stripped SN subtypes in the vs color space, with SN Ic-bl appearing bluer than both SN Ib and Ic, based on the 19 stripped SN for which optical+NIR colors can be determined, but cautioning the reader that in our dataset only two SN Ic and two SN Ic-bl has sufficient photometric coverage to be included in a vs color-color plot evaluated near peak (Figure 12). We also observe a very narrow distribution in color for SN Ic-bl, with a standard deviation of only 0.01 mag around a mean mag. This standard deviation is at least two times smaller than for any other subtype. As the data set grows, these color-color plots hold the promise to separate supernova types by photometry alone, especially with the advent of new NIR surveys (e.g., RATIR – Butler et al. 2012; Fox et al. 2012, and SASIR – Bloom et al. 2009).
In addition we identify a number of individual SN with peculiar color behavior - some of which were known to be peculiar from spectra (e.g., SN 2005la and SN 2006jc, both SN whose ejecta are interacting with He-rich and for SN 2005la, also H-rich circumstellar material), while others are spectroscopically normal (SN 2005kl).
Finally, spectra for over 80% of the objects we presented here are presented in a companion paper (M14). The availability of spectra with ample coverage at several epochs for most of our objects, offers an opportunity for an accurate statistical assessment of the photometric diversity among stripped SN types, which is necessary for classification in upcoming large synoptic surveys, as well as for future progenitor studies.
References
- Alard (2000) Alard, C. 2000, Astronomy and Astrophysics Supplement Series, 144, 363
- Alard & Lupton (1998) Alard, C., & Lupton, R. H. 1998, The Astrophysical Journal, 503, 325
- Aldering et al. (2002) Aldering, G., Adam, G., Antilogus, P., et al. 2002, 4836, 61
- Arkharov et al. (2006) Arkharov, A., Efimova, N., Leoni, R., et al. 2006, The Astronomer’s Telegram, 961, 1
- Bertin et al. (2002) Bertin, E., Mellier, Y., Radovich, M., et al. 2002, in Astronomical Society of the Pacific Conference Series, Vol. 281, Astronomical Data Analysis Software and Systems XI, ed. D. A. Bohlender, D. Durand, & T. H. Handley, 228–+
- Bloom et al. (2003) Bloom, J. S., Caldwell, N., Pahre, M., & Falco, E. E. 2003, Proposal, 1
- Bloom et al. (2006) Bloom, J. S., Starr, D. L., Blake, C. H., Skrutskie, M. F., & Falco, E. E. 2006, in Astronomical Society of the Pacific Conference Series, Vol. 351, Astronomical Data Analysis Software and Systems XV, ed. C. Gabriel, C. Arviset, D. Ponz, & S. Enrique, 751
- Bloom et al. (2009) Bloom, J. S., Prochaska, J. X., Lee, W., et al. 2009, ArXiv e-prints, arXiv:0905.1965
- Boisseau & Wheeler (1991) Boisseau, J. R., & Wheeler, J. C. 1991, AJ, 101, 1281
- Burbidge et al. (1957) Burbidge, E., Burbidge, G., Fowler, W., & Hoyle, F. 1957, Reviews of Modern Physics, 29, 547
- Butler et al. (2012) Butler, N., Klein, C., Fox, O., et al. 2012, in Society of Photo-Optical Instrumentation Engineers (SPIE) Conference Series, Vol. 8446, Society of Photo-Optical Instrumentation Engineers (SPIE) Conference Series
- Clocchiatti et al. (1997) Clocchiatti, A., Wheeler, J. C., Phillips, M. M. et al. 1997, The Astrophysical Journal, 482, 675
- Cutri et al. (2003) Cutri, R. M., Skrutskie, M. F., van Dyk, S., et al. 2003, 2MASS All Sky Catalog of point sources. (The IRSA 2MASS All-Sky Point Source Catalog, NASA/IPAC Infrared Science Archive. http://irsa.ipac.caltech.edu/applications/Gator/)
- Drout et al. (2011) Drout, M. R., Soderberg, A. M., Gal-Yam, A., et al. 2011, The Astrophysical Journal, 741, 97
- Drout et al. (2013) Drout, M. R., Soderberg, A. M., Mazzali, P. A., et al. 2013, The Astrophysical Journal, 774, 58
- Elmhamdi et al. (2006) Elmhamdi, A., Danziger, I. J., Branch, D., et al. 2006, Astronomy and Astrophysics, 450, 305
- Filippenko (1997) Filippenko, A. V. 1997, Annual Review of Astronomy and Astrophysics, 35, 309
- Filippenko et al. (1995) Filippenko, A. V., Barth, A. J., & Matheson, T. a. 1995, ApJ, 450, L11
- Filippenko et al. (2001) Filippenko, A. V., Li, W. D., Treffers, R. R., & Modjaz, M. 2001, in Small Telescope Astronomy on Global Scales, IAU Colloquium 183, Vol. 246, 121
- Filippenko et al. (1993) Filippenko, A. V., Matheson, T., & Ho, L. C. 1993, The Astrophysical Journal, 415, L103
- Fitzpatrick (1999) Fitzpatrick, E. L. 1999, PASP, 111, 63
- Folatelli et al. (2006) Folatelli, G., Contreras, C., Phillips, M. M., et al. 2006, The Astrophysical Journal, 641, 1039
- Foley et al. (2007) Foley, R. J., Smith, N., Ganeshalingam, M., et al. 2007, The Astrophysical Journal, 657, L105
- Foley et al. (2007) Foley, R. J., Smith, N., Ganeshalingam, M., et al. 2007, ApJ, 657, L105
- Fox et al. (2012) Fox, O. D., Kutyrev, A. S., Rapchun, D. A., & Klein, C. R. a. 2012, in Society of Photo-Optical Instrumentation Engineers (SPIE) Conference Series, Vol. 8453, Society of Photo-Optical Instrumentation Engineers (SPIE) Conference Series
- Friedman (2012) Friedman, A. S. 2012, PhD thesis, Harvard University
- Friedman et al. (2014) Friedman, A. S., Wood-Vasey, W. M., Marion, G. H. H., et al. 2014, in prep.
- Fukugita et al. (2007) Fukugita, M., Nakamura, O., Okamura, S., et al. 2007, The Astronomical Journal, 134, 579
- Galama et al. (1998) Galama, T. J., Vreeswijk, P. M., van Paradijs, J., et al. 1998, Nature, 395, 670
- Gallagher et al. (2005) Gallagher, J. S., Garnavich, P. M., Berlind, P., et al. 2005, The Astrophysical Journal, 634, 210
- Gehrels et al. (2004) Gehrels, N., Chincarini, G., Giommi, P., et al. 2004, The Astrophysical Journal, 611, 1005
- Hamuy et al. (2012) Hamuy, M., Pignata, G., Maza, J., et al. 2012, Mem. Soc. Astron. Italiana, 83, 388
- Hicken et al. (2009) Hicken, M., Challis, P., Jha, S., et al. 2009, ApJ, 700, 331
- Hicken et al. (2012) Hicken, M., Challis, P., Kirshner, R. P., et al. 2012, The Astrophysical Journal Supplement Series, 200, 12
- Hjorth & Bloom (2012) Hjorth, J., & Bloom, J. S. 2012, The Gamma-Ray Burst - Supernova Connection, 169–190
- Hjorth et al. (2003) Hjorth, J., Sollerman, J., Møller, P., et al. 2003, Nature, 423, 847
- Jha et al. (2006) Jha, S., Kirshner, R. P., Challis, P., & Garnavich, P. M. a. 2006, AJ, 131, 527
- Jha et al. (2007) Jha, S., Riess, A. G., & Kirshner, R. P. 2007, ApJ, 659, 122
- Kasliwal et al. (2011) Kasliwal, M. M., et al. 2011, ArXiv e-prints, arXiv:1111.6109
- Kessler et al. (2009) Kessler, R., Bernstein, J. P., Cinabro, D., et al. 2009, PASP, 121, 1028
- Kocevski et al. (2007) Kocevski, D., Modjaz, M., Bloom, J. S., et al. 2007, The Astrophysical Journal, 663, 1180
- Landolt (1992) Landolt, A. U. 1992, The Astronomical Journal, 104, 340
- Li et al. (2001) Li, W., Filippenko, A. V., Treffers, R. R., et al. 2001, The Astrophysical Journal, 546, 734
- Li et al. (2011) Li, W., Leaman, J., Chornock, R., et al. 2011, MNRAS, 412, 1441
- LSST Science Collaboration and LSST Project (2009) LSST Science Collaboration and LSST Project. 2009, LSST Science Book (arXiv:0912.0201, http://www.lsst.org/lsst/scibook)
- Maeda et al. (2007) Maeda, K., Tanaka, M., Nomoto, K., et al. 2007, ApJ, 666, 1069
- Malesani et al. (2009) Malesani, D., Fynbo, J. P. U., Hjorth, J., et al. 2009, ApJ, 692, L84
- Mannucci et al. (2005) Mannucci, F., Della Valle, M., Panagia, N., et al. 2005, Astronomy and Astrophysics, 433, 807
- Marion et al. (2013) Marion, G. H., Vinko, J., Kirshner, R. P., et al. 2013, ArXiv e-prints, arXiv:1303.5482
- Mattila et al. (2008) Mattila, S., Meikle, W. P. S., & Lundqvist, P. a. 2008, MNRAS, 389, 141
- Maund et al. (2007) Maund, J. R., Wheeler, J. C., Patat, F., et al. 2007, MNRAS, 381, 201
- Mazzali et al. (2008) Mazzali, P. A., Valenti, S., Della Valle, M., et al. 2008, Science, 321, 1185
- Miknaitis et al. (2007) Miknaitis, G., Pignata, G., Rest, A., et al. 2007, The Astrophysical Journal, 666, 674
- Modjaz (2007) Modjaz, M. 2007, PhD thesis, Harvard University
- Modjaz (2011) —. 2011, Astronomische Nachrichten, 332, 434
- Modjaz et al. (2014) Modjaz, M., Blondin, S., Kirshner, R., P., T., M., et al. 2014, The Astrophysical Journal, submitted
- Modjaz et al. (2006) Modjaz, M., Stanek, K. Z., Garnavich, P. M., et al. 2006, The Astrophysical Journal, 645, L21
- Modjaz et al. (2009) Modjaz, M., Li, W., Butler, N., et al. 2009, The Astrophysical Journal, 702, 226
- Nomoto et al. (1995) Nomoto, K., Iwamoto, K., & Suzuki, T. 1995, Physics Reports, 256, 173
- Nomoto et al. (2006) Nomoto, K., Tominaga, N., Umeda, H., Kobayashi, C., & Maeda, K. 2006, Nuclear Physics A, 777, 424
- Pastorello et al. (2008a) Pastorello, A., Mattila, S., Zampieri, L., & Della Valle, M. a. 2008a, MNRAS, 389, 113
- Pastorello et al. (2008b) Pastorello, A., Quimby, R. M., & Smartt, S. J. a. 2008b, MNRAS, 389, 131
- Pastorello et al. (2007) Pastorello, A., Smartt, S. J., Mattila, S., & Eldridge, J. J. a. 2007, Nature, 447, 829
- Patat et al. (2001) Patat, F., Cappellaro, E., Danziger, J., et al. 2001, The Astrophysical Journal, 555, 900
- Paturel et al. (1991) Paturel, G., Garcia, A. M., Fouque, P., & Buta, R. 1991, A&A, 243, 319
- Paturel et al. (2003) Paturel, G., Theureau, G., Bottinelli, L., et al. 2003, A&A, 412, 57
- Pian et al. (2006) Pian, E., Mazzali, P. A., Masetti, N., et al. 2006, Nature, 442, 1011
- Podsiadlowski et al. (2004) Podsiadlowski, P., Langer, N., Poelarends, A. J. T., et al. 2004, The Astrophysical Journal, 612, 1044
- Pritchard & Roming (2013) Pritchard, G. H., & Roming, P. W. A. 2013, ArXiv e-prints, arXiv:1303.1190
- Quimby (2006) Quimby, R. 2006, PhD thesis, The University of Texas at Austin
- Rest et al. (2005) Rest, A., Stubbs, C., Becker, A. C., et al. 2005, ApJ, 634, 1103
- Richardson et al. (2006) Richardson, D., Branch, D., & Baron, E. 2006, The Astronomical Journal, 131, 2233
- Richmond et al. (1996) Richmond, M. W., Treffers, R. R., Filippenko, A. V., & Paik, Y. 1996, The Astronomical Journal, 112, 732
- Riess et al. (1999) Riess, A. G., Kirshner, R. P., Schmidt, B. P., et al. 1999, The Astronomical Journal, 117, 707
- Sahu et al. (2009) Sahu, D. K., Tanaka, M., Anupama, G. C., Gurugubelli, U. K., & Nomoto, K. 2009, ApJ, 697, 676
- Sako et al. (2014) Sako, M., Bassett, B., Becker, A. C., et al. 2014, ArXiv e-prints, arXiv:1401.3317
- Sanders et al. (2012) Sanders, N. E., Soderberg, A. M., & Valenti, S. a. 2012, ApJ, 756, 184
- Sauer et al. (2006) Sauer, D. N., Mazzali, P. A., Deng, J., et al. 2006, MNRAS, 369, 1939
- Schechter et al. (1993) Schechter, P. L., Mateo, M., & Saha, A. 1993, Publications of the Astronomical Society of the Pacific, 105, 1342
- Schlafly & Finkbeiner (2011) Schlafly, E. F., & Finkbeiner, D. P. 2011, ApJ, 737, 103
- Schlegel et al. (1998) Schlegel, D. J., Finkbeiner, D. P., & Davis, M. 1998, ApJ, 500, 525
- Scolnic et al. (2013) Scolnic, D., Rest, A., Riess, A., & Huber, M. E. a. 2013, ArXiv e-prints, arXiv:1310.3824
- Skrutskie et al. (2006) Skrutskie, M. F., Cutri, R. M., Stiening, R., et al. 2006, The Astronomical Journal, 131, 1163
- Smith et al. (2002) Smith, J. A., Tucker, D. L., Kent, S., et al. 2002, The Astronomical Journal, 123, 2121
- Smith et al. (2008) Smith, N., Foloey, R. J., & Filippenko, A. V. 2008, ApJ, 680, 568
- Soderberg et al. (2008) Soderberg, A. M., Berger, E., Page, K. L., et al. 2008, Nature, 453, 469
- Stanek et al. (2003) Stanek, K. Z., Matheson, T., Garnavich, P. M., et al. 2003, The Astrophysical Journal, 591, L17
- Tominaga et al. (2005) Tominaga, N., Tanaka, M., Nomoto, K., et al. 2005, The Astrophysical Journal, 633, L97
- Uomoto & Kirshner (1986) Uomoto, A., & Kirshner, R. P. 1986, The Astrophysical Journal, 308, 685
- Valenti et al. (2011) Valenti, S., Fraser, M., Benetti, S., et al. 2011, Monthly Notices of the Royal Astronomical Society, 416, 3138
- Wood-Vasey et al. (2008) Wood-Vasey, W. M., Friedman, A. S., Bloom, J. S., et al. 2008, The Astrophysical Journal, 689, 377
- Woosley & Bloom (2006) Woosley, S. E., & Bloom, J. S. 2006, ARA&A, 44, 507
- Woosley et al. (1993) Woosley, S. E., Langer, N., & Weaver, T. A. 1993, The Astrophysical Journal, 411, 823
| SN Name | CfA spectraaaThese objects have spectra presented in M14 | CfA NIRbbObject for which NIR data is available within the CfA survey. ∗Indicates only NIR data is available within the CfA survey for this object. | RA | Dec | SN TypeccSN reclassified with SNID using updated templates in M14 have the new classification reported. | Discovery Date | Discovery Reference | Spectroscopic IDccSN reclassified with SNID using updated templates in M14 have the new classification reported. |
|---|---|---|---|---|---|---|---|---|
| SN 2001ej | M14 | 7:23:43 | +33:26:38.0 | Ib | 2001-09-17 | IAUC 7719 | IAUC 7721 | |
| SN 2001gd33Radio studies, no published optical lightcurve.4Progenitor studies, no published lightcurve.5Host studies, no published lightcurve.6Only spectra published.7Only UV data published. | M14 | 13:13:23 | +36:38:17.7 | IIb | 2001-11-24 | IAUC 7761 | IAUC 7765 | |
| SN 2002ap11Indicates SN whose early-time behavior have been studied in the literature. 2 Included in the D11 sample. | M14 | 1:36:23 | +15:45:13.2 | Ic-bl | 2002-01-29 | IAUC 7810 | IAUC 7811/7825 | |
| SN 2003jd11Indicates SN whose early-time behavior have been studied in the literature. 2 Included in the D11 sample. | M14 | 21:03:38 | -4:53:45 | Ic-bl | 2003-10-25 | IAUC 8232 | IAUC 8234 | |
| SN 2004ao11Indicates SN whose early-time behavior have been studied in the literature. 2 Included in the D11 sample. | M14 | 17:28:09 | +07:24:55.5 | Ib | 2004-03-07 | IAUC 8299 | IAUC 8430 | |
| SN 2004aw11Indicates SN whose early-time behavior have been studied in the literature. 2 Included in the D11 sample. | M14 | 11:57:50 | +25:15:55.1 | Ic | 2004-03-19 | IAUC 8310 | IAUC 8331 | |
| SN 2004fe | M14 | 0:30:11 | +02:05:23.5 | Ic | 2004-10-30 | IAUC 8425 | IAUC 8426 | |
| SN 2004gk1,21,2footnotemark: | M13 | Y | 12:25:33 | +12:15:39.9 | Ic | 2004-11-25 | IAUC 8446 | IAUC 8446 |
| SN 2004gq2,32,3footnotemark: | M14 | Y | 5:12:04 | -15:40:54 | Ib | 2004-12-11 | IAUC 8452 | IAUC 8452/8461 |
| SN 2004gt2,42,4footnotemark: | M14 | Y | 12:01:50 | -18:52:12 | Ic | 2004-12-12 | IAUC 8454 | M14 |
| SN 2004gv22footnotemark: | M14 | 2:13:37 | -0:43:05.8 | Ib | 2004-12-13 | IAUC 8454 | IAUC 8456 | |
| SN 2005az22footnotemark: | M14 | Y | 13:05:46 | +27:44:08.4 | Ic | 2005-03-28 | IAUC 8503 | IAUC 8504 |
| SN 2005bf11Indicates SN whose early-time behavior have been studied in the literature. 2 Included in the D11 sample. | M14 | Y | 10:23:57 | -3:11:28 | Ib | 2005-04-06 | IAUC 8507 | IAUC 8521 |
| SN 2005ek11Indicates SN whose early-time behavior have been studied in the literature. 2 Included in the D11 sample. | M14 | Y∗ | 3:05:48 | +36:46:10 | Ic | 2005-09-24 | IAUC 8604 | CBET 235 |
| SN 2005hg22footnotemark: | M14 | Y | 1:55:41 | +46:47:47.4 | Ib | 2005-10-25 | IAUC 8623 | CBET 271 |
| SN 2005kf | M14 | 7:47:26 | +26:55:32.4 | Ic | 2005-11-11 | IAUC 8630 | CBET 301 | |
| SN 2005kl | M14 | Y | 12:24:35 | +39:23:03.5 | Ic | 2005-11-22 | CBET 300 | CBET 305 |
| SN 2005kz22footnotemark: | 19:00:49 | +50:53:01.8 | Ic | 2005-12-01 | IAUC 8639 | IAUC 8639 | ||
| SN 2005la1,2,d1,2,dfootnotemark: | M14 | 12:52:15 | +27:31:52.5 | Ib-n/IIb-n | 2005-11-30 | IAUC 8639 | IAUC 8639 | |
| SN 2005mf22footnotemark: | M14 | Y | 9:08:42 | +44:48:51.4 | Ic | 2005-12-25 | IAUC 8648 | IAUC 8650 |
| SN 2005nb22footnotemark: | M14 | 12:13:37 | +16:07:16.2 | Ic-bl | 2005-12-17 | CBET 357 | IAUC 8657 | |
| SN 2006F22footnotemark: | 2:28:11 | +19:36:13 | Ib | 2006-01-11 | CBET 364 | CBET 368 | ||
| SN 2006T | M14 | 9:54:30 | -25:42:29 | IIb | 2006-01-30 | IAUC 8666 | IAUC 8680 | |
| SN 2006aj11Indicates SN whose early-time behavior have been studied in the literature. 2 Included in the D11 sample. | M14 | Y | 3:21:39 | +16:52:02.6 | Ic-bl | 2006-02-18 | IAUC 8674 | CBET 409 |
| SN 2006ba | 9:43:13 | -9:36:53 | IIb | 2006-03-19 | IAUC 8693 | CBET 458 | ||
| SN 2006bf | 12:58:50 | +9:39:30 | IIb | 2006-03-19 | IAUC 8693 | M14 | ||
| SN 2006cb | 14:16:31 | +39:35:15 | Ib | 2006-05-05 | IAUC 8709 | CBET 529 | ||
| SN 2006ck22footnotemark: | M14 | 13:09:40 | -1:02:57 | Ic | 2006-05-20 | IAUC 8713 | CBET 519 | |
| SN 2006el22footnotemark: | M14 | 22:47:38 | +39:52:27.6 | Ib | 2006-08-25 | IAUC 8741 | CBET 612 | |
| SN 2006ep | M14 | 0:41:24 | +25:29:46.7 | Ib | 2006-08-30 | IAUC 8744 | CBET 612 | |
| SN 2006fo22footnotemark: | M14 | Y | 2:32:38 | +00:37:03.0 | Ib | 2006-09-16 | IAUC 8750 | M14 |
| SN 2006gi11Indicates SN whose early-time behavior have been studied in the literature. 2 Included in the D11 sample. | 10:16:46 | 73:26:26 | Ib | 2006-09-18 | CBET 630 | CBET 635 | ||
| SN 2006ir | 23:04:35 | 7:36:21 | Ic | 2006-09-24 | CBET 658 | Leloudas et al. 2011 | ||
| SN 2006jc1,2,e1,2,efootnotemark: | M14 | Y | 9:17:20 | +41:54:32.7 | Ib-n | 2006-10-09 | IAUC 8762 | CBET 672/674/677 |
| SN 2006lc | M14 | 22:44:24 | -0:09:53 | Ib | 2006-10-25 | CBET 693 | CBET 699 | |
| SN 2006ld | M14 | Y | 0:35:27 | +02:55:50.7 | Ib | 2006-10-19 | IAUC 8766 | CBET 689 |
| SN 2006lv | M14 | 11:32:03 | +36:42:03.6 | Ib | 2006-10-28 | IAUC 8771 | CBET 722 | |
| SN 2007C2 2 footnotemark: | M14 | Y | 13:08:49 | -6:47:01 | Ib | 2007-01-07 | IAUC 8792 | CBET 800 |
| SN 2007D2 2 footnotemark: | M14 | Y | 3:18:38 | +37:36:26.4 | Ic-bl | 2007-01-07 | IAUC 8794 | CBET 805 |
| SN 2007I | M14 | Y | 11:59:13 | -1:36:18 | Ic-bl | 2007-01-14 | IAUC 8798 | CBET 808 |
| SN 2007ag | M14 | 10:01:35 | +21:36:42.0 | Ib | 2007-03-07 | IAUC 8822 | CBET 874 | |
| SN 2007aw | 9:57:24 | -19:21:23 | Ic | 2006-03-22 | IAUC 8829 | CBET 908 | ||
| SN 2007bg3,43,4footnotemark: | M14 | 11:49:26 | +51:49:28.8 | Ic-bl | 2007-04-16 | IAUC 8834 | CBET 927/948 | |
| SN 2007ce | M14 | Y | 12:10:17 | +48:43:31.5 | Ic-bl | 2007-05-04 | IAUC 8843 | CBET 953 |
| SN 2007cl | M14 | 17:48:21 | +54:09:05.2 | Ic | 2007-05-23 | IAUC 8851 | CBET 974 | |
| SN 2007gr11Indicates SN whose early-time behavior have been studied in the literature. 2 Included in the D11 sample. | M14 | Y | 2:43:27 | +37:20:44.7 | Ic | 2007-08-15 | CBET 1034 | CBET 1036 |
| SN 2007hb | M14 | 2:08:34 | +29:14:14.3 | Ic | 2007-09-24 | CBET 1043 | M14 | |
| SN 2007iq | M14 | 6:13:32 | +69:43:49.2 | Ic/Ic-bl | 2007-09-12 | CBET 1064 | CBET 1101 | |
| SN 2007ke11Indicates SN whose early-time behavior have been studied in the literature. 2 Included in the D11 sample. | 2:54:23 | +41:34:16 | Ib (Ca rich) | 2007-09-25 | CBET 1084 | CBET 1101 | ||
| SN 2007kj | M14 | 0:01:19 | +13:06:30.6 | Ib | 2007-10-02 | CBET 1092 | CBET 1093 | |
| SN 2007ru11Indicates SN whose early-time behavior have been studied in the literature. 2 Included in the D11 sample. | M14 | 23:07:23 | +43:35:33.7 | Ic-bl | 2007-11-30 | CBET 1149 | CBET 1151 | |
| SN 2007rz66footnotemark: | M14 | 4:31:10 | +07:37:51.5 | Ic | 2007-12-08 | CBET 1158 | CBET 1160 | |
| SN 2007uy11Indicates SN whose early-time behavior have been studied in the literature. 2 Included in the D11 sample. | M14 | Y | 9:09:35 | +33:07:08.9 | Ib-pec | 2007-12-31 | IAUC 8908 | M14 |
| SN 2008D11Indicates SN whose early-time behavior have been studied in the literature. 2 Included in the D11 sample. | M14 | Y | 9:09:30 | +33:08:20.3 | Ib | 2008-01-07 | GCN 7159 | CBET 1205 |
| SN 2008an | M14 | 17:38:28 | +61:02:13.7b | Ic | 2008-02-24 | CBAT 1268 | CBAT 1271 | |
| SN 2008aq77footnotemark: | M14 | 12:50:30 | -10:52:01 | IIb | 2008-02-27 | CBAT 1271 | CBAT 1271 | |
| SN 2008ax11Indicates SN whose early-time behavior have been studied in the literature. 2 Included in the D11 sample. | M14 | Y∗ | 12:30:40 | +41:38:14.5 | IIb | 2008-03-03 | CBET 1280/6 | CBET 1298 |
| SN 2008bo66footnotemark: | M14 | 18:19:54 | +74:34:20.9 | IIb | 2008-04-01 | CBET 1324 | CBET 1325 | |
| SN 2008cw | M14 | 16:32:38 | +41:27:33.2 | IIb | 2008-06-01 | IAUC 1395 | CBET 1408 | |
| SN 2008hh | Y∗ | 1:26:03 | 11:26:26 | Ic | 2008-11-20 | CBET 1575 | CBET 1580 | |
| SN 2009K | 4:36:36 | -0:08:35.6 | IIb | 2009-01-14 | CBET 1663 | CBET 1665/1703 | ||
| SN 2009erffThe type classification of SN 2009er remains ambiguous. SNID classifies SN 2009er differentlly at different epochs. We also note the presence of high velocity He I lines. | M14 | Y | 15:39:29 | +24:26:05.3 | Ib-pec | 2009-05-22 | CBAT 1811 | M14 |
| SN 2009iz | M14 | Y | 2:42:15 | +42:23:50.1 | Ib | 2009-09-19 | CBET 1943 | M14 |
| SN 2009jf11Indicates SN whose early-time behavior have been studied in the literature. 2 Included in the D11 sample. | M14 | Y | 23:04:52 | +12:19:59.5 | Ib | 2001-09-17 | IAUC 7719 | IAUC 7721 |
| SN Name | SN TypeaaThe SN Type ”Ic-bl” stands for broad-lined SN Ic. SN 2006jc is a SN Ib-n (”n” for narrow) which showed narrow He lines in emission. See text for details. | Galaxybb“Anonimous” stands for non-catalogues host galaxy. | ccFrom HYPERLEDA catalog (bold) or NED catalog. | ccFrom HYPERLEDA catalog (bold) or NED catalog. | ccFrom HYPERLEDA catalog (bold) or NED catalog. | Morphology ccFrom HYPERLEDA catalog (bold) or NED catalog. | SN OffsetsddSN 2005la is spectroscopically peculiar showing narrow He and H lines in emission (Pastorello 2008). | eeSN 2006jc is spectroscopically peculiar and showed narrow He lines in emission. See text for details. | ||
|---|---|---|---|---|---|---|---|---|---|---|
| [] | [mag] | [mag] | [mag] | ” | ” | |||||
| SN 2001ej | Ib | UGC 3829 | 4031 | - | 13.80 (0.2) | 33.97 | Sb | 4W | 7N | 0.0460 |
| SN 2001gd | IIb | NGC 5033 | 1024 | -20.95 | 10.70 (0.13) | 30.92 | Sc | 52W | 161N | 0.0098 |
| SN 2002ap | Ic-bl | M74 | 659 | -20.71 | 9.70 (0.26) | 29.67 | Sc | 258W | 108S | 0.0620 |
| SN 2003jd | Ic-bl | MCG-01-59-21 | 5635 | -19.81 | 15.21 (0.50) | 34.49 | SABm | 8E | 8S | 0.0784 |
| SN 2004ao | Ib | UGC 10862 | 1691 | -18.53 | 14.41 (0.59) | 31.95 | SBc | 6.3E | 23.8S | 0.0893 |
| SN 2004aw | Ic | NGC 3997 | 4770 | -20.78 | 14.04 (0.13) | 34.24 | SBb | 28E | 20S | 0.0180 |
| SN 2004fe | Ic | NGC 132 | 5363 | -21.13 | 13.74 (0.33) | 34.21 | SABb | 9E | 12S | 0.0210 |
| SN 2004gk | Ic | IC 3311 | 122 | -18.00 | 14.71 (0.18) | 31.48 | Scd | 2E | 3N | 0.0247 |
| SN 2004gq | Ib | NGC 1832 | 1919 | -21.41 | 11.64 (0.52) | 32.00 | Sbc | 22E | 22N | 0.0627 |
| SN 2004gt | Ic | NGC 4038 | 1663 | -21.45 | 10.85 (0.11) | 31.72 | SBm | 34W | 10S | 0.0398 |
| SN 2004gv | Ib | NGC 0856 | 6017 | -20.78 | 14.21 (0.27) | 34.69 | Sa | 14W | 4S | 0.0276 |
| SN 2005az | Ic | NGC 4961 | 2517 | -19.26 | 13.96 (0.06) | 32.65 | SBc | 8W | 6N | 0.0097 |
| SN 2005bf | Ib | MCG+00-27-5 | 5670 | -21.53 | 13.60 (0.26) | 29.67 | Sc | 13E | 32S | 0.0385 |
| SN 2005ek | Ic | UGC 2526 | 4962 | -21.29 | 15.38 (0.33) | 34.26 | Sc | 66E | 60S | 0.1788 |
| SN 2005hg | Ib | UGC 1394 | 6388 | -21.10 | 14.66 (0.39) | 34.84 | Sa | 4W | 20S | 0.0901 |
| SN 2005kf | Ic | SDSS J0747+2655ffAbbreviated galaxy name for “SDSS J074726.40+265532.4” . | 4522 | -17.01 | 17.33 (0.29) | - | - | 1E | 1S | 0.0378 |
| SN 2005kl | Ic | NGC 4369 | 1016 | -19.11 | 12.36 (0.11) | 31.40 | Sa | 6W | 4N | 0.0219 |
| SN 2005kz | Ic | MCG+08-34-32 | 8107 | -20.83 | 15.19 (0.33) | 35.39 | SBa | 15.6E | 9.5N | 0.0460 |
| SN 2005la | Ib/IIb | PGC 043632 | 5570 | -18.43 | 16.67 (0.50) | 34.69 | Sc | 6W | 6S | 0.0100 |
| SN 2005mf | Ic | UGC 4798 | 8023 | -20.34 | 15.34 (0.32) | 35.46 | Sc | 6W | 13N | 0.0153 |
| SN 2005nb | Ic-bl | UGC 7230 | 7127 | - | 14.51 (0.2) | 35.24 | SB(s)d pec | 2W | 5N | 0.0320 |
| SN 2006F | Ib | NGC 935 | 4197 | -21.39 | 13.75 (0.41) | 33.06 | Sc | 3E | 15N | 0.1635 |
| SN 2006T | IIb | NGC 3054 | 2396 | -20.95 | 12.34 (0.14) | 32.68 | Sb | 22E | 21S | 0.0647 |
| SN 2006aj | Ic-bl | Anon. 00 | 10052 | - | - | - | - | - | - | 0.1267 |
| SN 2006ba | IIb | NGC 2980 | 5764 | -21.78 | 13.60 (0.04) | 34.79 | Sc | 21E | 8S | 0.0452 |
| SN 2006bf | IIb | UGC 8093 | 7115 | -20.82 | 14.92 (0.27) | 35.25 | Sbc | 3.1W | 15.5N | 0.0216 |
| SN 2006cb | Ib | NGC 5541 | 7708 | -21.84 | 13.89 (0.58) | 35.36 | Sc | 0.6E | 5.7S | 0.0094 |
| SN 2006ck | Ic | UGC 8238 | 7312 | -20.86 | 14.95 (0.36) | 35.30 | Sc | 10W | 3S | 0.0245 |
| SN 2006el | Ib | UGC 12188 | 5150 | - | 14.4 (0.4) | - | S+companion | 13E | 18S | 0.0973 |
| SN 2006ep | Ib | NGC 214 | 4505 | -21.65 | 12.94 (0.05) | 33.99 | SABc | 43W | 11S | 0.036 |
| SN 2006fo | Ib | UGC 2019 | 6214 | -20.36 | 14.81 (0.47) | 34.75 | Sbc | 14E | 4N | 0.0250 |
| SN 2006gi | Ib | NGC 3147 | 2780 | -22.22 | 11.26 (0.15) | 32.99 | Sbc | 30W | 144N | 0.0205 |
| SN 2006ir | Ic | PGC 085376 | 6220 | - | 17.36 (0.50) | 34.63 | - | - | - | 0.0393 |
| SN 2006jc | Ib-n | UGC 4904 | 1644 | -17.47 | 15.05 (0.35) | 32.99 | SBbc | 11W | 7S | 0.0173 |
| SN 2006lc | Ib | NGC 7364 | 4863 | -21.24 | 13.44 (0.43) | 34.13 | S0-a | 1E | 10S | 0.0556 |
| SN 2006ld | Ib | UGC 348 | 4179 | -18.44 | 15.86 (0.39) | 33.78 | SABd | 1E | 18S | 0.0144 |
| SN 2006lv | Ib | UGC 6517 | 2490 | -19.33 | 14.12 (0.46) | 33.06 | SBbc | 10E | 12N | 0.0245 |
| SN 2007C | Ib | NGC 4981 | 1767 | -20.31 | 12.07 (0.30) | 31.71 | Sbc | 9E | 22S | 0.0363 |
| SN 2007D | Ic-bl | UGC 2653 | 6944 | -21.70 | 15.68 (0.50) | 35.03 | Scd | 5E | 3S | 0.2881 |
| SN 2007I | Ic-bl | PGC 1114807 | 6487 | -16.77 | 18.30 (0.25) | 35.06 | - | - | - | 0.0250 |
| SN 2007ag | Ib | UGC 5392 | 6017 | -20.33 | 15.94 (0.35) | 34.95 | Scd(?) | 4E | 16N | 0.0250 |
| SN 2007aw | Ic | NGC 3072 | 3431 | -19.91 | 13.83 (0.19) | 33.75 | S0-a | 3.3E | 5.2S | 0.0338 |
| SN 2007bg | Ic-bl | Anonimous | 10370 | - | - | - | - | - | - | 0.0179 |
| SN 2007ce | Ic-bl | Anonimous | 13890 | - | - | - | - | - | - | 0.0200 |
| SN 2007cl | Ic | NGC 6479 | 6650 | -20.85 | 14.50 (0.33) | 34.97 | Sc | 3W | 8N | 0.0200 |
| SN 2007gr | Ic | NGC 1058 | 518 | -18.70 | 11.96 (0.14) | 28.33 | Sc | 25W | 16N | 0.0535 |
| SN 2007hb | Ic | NGC 819 | 6669 | -20.90 | 16.23 (0.35) | 34.88 | S(?) | 19W | 5S | 0.0518 |
| SN 2007iq | Ic/Ic-bl | UGC 3416 | 4003 | -20.19 | 15.08 (0.32) | 33.87 | Sc | 39W | 30S | 0.1182 |
| SN 2007ke | Ib (Ca rich) | NGC 1129 | 5194 | -21.64 | 13.40 (0.72) | 34.37 | E | 39.1W | 29.8S | 0.0954 |
| SN 2007kj | Ib | NGC 7803 | 5366 | -20.92 | 13.08 (0.11) | 34.37 | S0-a | 6W | 10S | 0.0691 |
| SN 2007ru | Ic-bl | UGC 12381 | 4636 | -20.37 | 15.12 (0.44) | 34.05 | Sc | 5E | 41S | 0.2254 |
| SN 2007rz | Ic | NGC 1590 | 3897 | -20.25 | 14.49 (0.04) | 33.78 | Sc B | 9E | 0N | 0.1723 |
| SN 2007uy | Ib-pec | NGC 2770 | 2100 | -20.78 | 12.76 (0.05) | 32.08 | SABc | 21E | 15S | 0.0194 |
| SN 2008D | Ib | NGC 2770 | 2100 | -20.78 | 12.76 (0.05) | 32.08 | SABc | 38W | 56N | 0.0194 |
| SN 2008an | Ic | UGC 10936 | 8124 | -20.79 | 15.36 (0.49) | 35.42 | Sb | 5E | 10S | 0.0450 |
| SN 2008aq | IIb | MCG-02-33-20 | 2389 | - | 13.27 (0.15) | 32.45 | SB(s)m | 15E | 45S | 0.0383 |
| SN 2008ax | IIb | NGC 4490 | 630 | -21.82 | 9.76 (0.17) | 29.90 | SBcd | 15E | 45S | 0.0186 |
| SN 2008bo | IIb | NGC 6643 | 1484 | -21.10 | 11.76 (0.08) | 31.57 | Sc | 31E | 15N | 0.0513 |
| SN 2008cw | IIb | PGC 2181396 | 9724 | -18.34 | 17.60 (0.47) | - | - | 1E | 2N | 0.0060 |
| SN 2008hh | Ic | IC 112 | 5819 | -21.23 | 14.16 (0.41) | 34.58 | Sd | 9.8E | 8.4S | 0.0427 |
| SN 2009K | IIb | NGC 1620 | 3530 | -21.82 | 12.87 (0.21) | 33.55 | SABc | 8.7W | 1.5N | 0.0499 |
| SN 2009er | Ib-pec | SDSS J1539+2426ggAbbreviated galaxy name for “SDSS J153930.49+242614.8” . | 10500 | -18.22 | 18.05 (0.50) | 35.87 | - | 8W | 9S | 0.0389 |
| SN 2009iz | Ib | UGC 02175 | 4257 | -21.82 | 12.87 (0.21) | 33.91 | SABc | 12W | 14N | 0.0729 |
| SN 2009jf | Ib | NGC 7479 | 2443 | -19.00 | 15.60 (0.32) | 32.37 | SABb | 54W | 36N | 0.0971 |
| Star | RA(J2000) | DEC(J2000) | ||||||||||
|---|---|---|---|---|---|---|---|---|---|---|---|---|
| 01 | 01:56:08.386 | +46:51:51.91 | 16.217.013 | 3 | 0.113.052 | 3 | 0.729.020 | 3 | 0.189.009 | 3 | 0.407.011 | 3 |
| 02 | 01:56:03.007 | +46:52:47.44 | 16.338.013 | 3 | 0.382.043 | 3 | 0.740.016 | 3 | 0.204.011 | 3 | 0.395.011 | 3 |
| 03 | 01:56:02.641 | +46:52:31.82 | 16.032.012 | 3 | 0.091.042 | 3 | 0.593.017 | 3 | 0.150.010 | 3 | 0.314.011 | 3 |
| 04 | 01:56:02.558 | +46:43:25.08 | 15.460.012 | 3 | 0.170.042 | 3 | 0.725.015 | 3 | 0.192.009 | 3 | 0.381.009 | 3 |
| 05 | 01:55:59.139 | +46:51:51.01 | 15.467.012 | 3 | 0.102.047 | 3 | 0.620.017 | 3 | 0.159.011 | 3 | 0.330.010 | 3 |
| 06 | 01:55:59.060 | +46:46:57.56 | 15.492.013 | 3 | 0.250.056 | 3 | 0.759.017 | 3 | 0.211.009 | 3 | 0.431.009 | 3 |
| 07 | 01:55:58.585 | +46:49:29.73 | 15.898.013 | 3 | 0.105.050 | 3 | 0.632.016 | 3 | 0.166.011 | 3 | 0.344.009 | 3 |
| 08 | 01:55:57.677 | +46:44:26.44 | 14.789.013 | 3 | 0.095.043 | 3 | 0.603.016 | 3 | 0.135.010 | 3 | 0.264.009 | 3 |
| 09 | 01:55:57.102 | +46:42:17.85 | 15.387.012 | 3 | 0.337.099 | 3 | 0.841.055 | 3 | 0.215.009 | 3 | 0.417.028 | 3 |
| 10 | 01:55:57.103 | +46:49:56.47 | 15.740.013 | 3 | 0.117.044 | 3 | 0.601.016 | 3 | 0.146.010 | 3 | 0.302.009 | 3 |
| 11 | 01:55:57.059 | +46:52:27.68 | 15.967.013 | 3 | 0.105.045 | 3 | 0.575.017 | 3 | 0.136.010 | 3 | 0.279.009 | 3 |
| 12 | 01:55:52.143 | +46:46:55.57 | 15.723.013 | 3 | 0.333.044 | 3 | 0.721.016 | 3 | 0.181.009 | 3 | 0.332.009 | 3 |
| 13 | 01:55:45.171 | +46:47:37.72 | 15.207.013 | 3 | -0.018.044 | 3 | 0.502.018 | 3 | 0.114.009 | 3 | 0.232.009 | 3 |
| 14 | 01:55:43.728 | +46:45:15.07 | 16.674.015 | 3 | 0.192.044 | 3 | 0.646.021 | 3 | 0.157.018 | 3 | 0.275.012 | 3 |
| 15 | 01:55:42.395 | +46:50:57.27 | 16.022.012 | 3 | 0.068.043 | 3 | 0.614.016 | 3 | 0.151.010 | 3 | 0.306.009 | 3 |
| 16 | 01:55:41.672 | +46:42:26.85 | 15.505.056 | 3 | 0.075.071 | 3 | 0.573.017 | 3 | 0.134.011 | 3 | 0.300.030 | 3 |
| 17 | 01:55:39.694 | +46:48:48.36 | 14.894.013 | 3 | 0.802.043 | 3 | 1.010.016 | 3 | 0.310.009 | 3 | 0.608.009 | 3 |
| 18 | 01:55:38.790 | +46:51:18.19 | 15.114.013 | 3 | 0.000.042 | 3 | 0.506.015 | 3 | 0.116.009 | 3 | 0.237.010 | 3 |
| 19 | 01:55:34.046 | +46:50:11.12 | 16.249.014 | 3 | 0.035.046 | 3 | 0.645.016 | 3 | 0.165.009 | 3 | 0.356.010 | 3 |
| 20 | 01:55:30.653 | +46:47:13.56 | 15.956.012 | 3 | 0.012.046 | 3 | 0.628.015 | 3 | 0.155.011 | 3 | 0.325.010 | 3 |
| 21 | 01:55:20.903 | +46:51:07.29 | 14.712.013 | 3 | 0.572.042 | 3 | 0.942.016 | 3 | 0.287.009 | 3 | 0.585.009 | 3 |
| 22 | 01:55:14.253 | +46:45:00.08 | 16.515.015 | 2 | 0.012.045 | 2 | 0.611.016 | 2 | 0.141.009 | 2 | 0.301.011 | 3 |
| 23 | 01:55:10.188 | +46:50:01.06 | 16.070.108 | 2 | -0.243.128 | 2 | 0.576.079 | 2 | 0.164.016 | 2 | 0.402.102 | 3 |
| MJD | d | MJD | d | MJD | d | MJD | d | MJD | d | |||||
|---|---|---|---|---|---|---|---|---|---|---|---|---|---|---|
| 53671.188 | 19.08 | 0.16 | 53671.176 | 18.64 | 0.07 | 53671.184 | 18.86 | 0.03 | 53671.180 | 18.46 | 0.03 | 53671.184 | 18.49 | 0.04 |
| 53671.191 | 18.84 | 0.11 | 53671.180 | 18.55 | 0.04 | 53674.402 | 18.43 | 0.03 | 53674.398 | 17.98 | 0.03 | 53674.398 | 17.97 | 0.03 |
| 53674.402 | 18.43 | 0.09 | 53674.395 | 18.06 | 0.02 | 53676.309 | 18.32 | 0.04 | 53676.305 | 17.71 | 0.02 | 53676.309 | 17.74 | 0.02 |
| 53674.406 | 18.52 | 0.09 | 53676.305 | 17.89 | 0.03 | 53677.348 | 18.20 | 0.04 | 53677.336 | 17.71 | 0.01 | 53677.336 | 17.68 | 0.02 |
| 53676.316 | 18.36 | 0.13 | 53677.340 | 17.81 | 0.02 | 53678.359 | 18.23 | 0.02 | 53678.348 | 17.63 | 0.02 | 53678.348 | 17.60 | 0.02 |
| 53677.340 | 18.22 | 0.06 | 53678.348 | 17.73 | 0.02 | 53679.219 | 18.22 | 0.03 | 53679.215 | 17.56 | 0.02 | 53679.219 | 17.56 | 0.02 |
| 53678.352 | 18.24 | 0.07 | 53679.215 | 17.70 | 0.02 | 53680.359 | 18.16 | 0.02 | 53680.348 | 17.53 | 0.02 | 53680.348 | 17.49 | 0.02 |
| 53678.355 | 18.17 | 0.06 | 53680.352 | 17.65 | 0.02 | 53681.289 | 18.14 | 0.02 | 53681.277 | 17.48 | 0.02 | 53681.277 | 17.47 | 0.02 |
| 53679.223 | 18.30 | 0.05 | 53681.277 | 17.64 | 0.03 | 53681.305 | 18.27 | 0.12 | 53681.293 | 17.52 | 0.02 | 53681.293 | 17.44 | 0.04 |
| 53679.230 | 18.34 | 0.06 | 53681.297 | 17.73 | 0.06 | 53682.137 | 18.16 | 0.05 | 53682.133 | 17.51 | 0.03 | 53682.137 | 17.40 | 0.03 |
| 53680.355 | 18.22 | 0.10 | 53682.129 | 17.67 | 0.03 | 53682.195 | 18.07 | 0.04 | 53682.188 | 17.45 | 0.03 | 53682.191 | 17.43 | 0.03 |
| 53681.281 | 18.23 | 0.08 | 53682.188 | 17.60 | 0.03 | 53682.328 | 18.12 | 0.02 | 53682.324 | 17.47 | 0.02 | 53682.328 | 17.41 | 0.02 |
| 53681.285 | 18.16 | 0.07 | 53682.320 | 17.56 | 0.02 | 53683.316 | 18.15 | 0.02 | 53683.305 | 17.45 | 0.02 | 53683.305 | 17.39 | 0.02 |
| 53681.297 | 18.20 | 0.10 | 53683.309 | 17.62 | 0.02 | 53683.352 | 18.15 | 0.02 | 53683.340 | 17.40 | 0.02 | 53683.340 | 17.39 | 0.03 |
| 53682.141 | 18.27 | 0.08 | 53683.344 | 17.57 | 0.02 | 53685.328 | 18.26 | 0.04 | 53685.316 | 17.41 | 0.02 | 53685.316 | 17.33 | 0.03 |
| 53682.332 | 18.19 | 0.07 | 53685.320 | 17.56 | 0.02 | 53686.270 | 18.21 | 0.06 | 53686.254 | 17.41 | 0.02 | 53686.258 | 17.28 | 0.02 |
| 53683.309 | 18.38 | 0.07 | 53686.258 | 17.63 | 0.03 | 53687.320 | 18.34 | 0.07 | 53687.309 | 17.43 | 0.02 | 53687.309 | 17.32 | 0.03 |
| 53683.312 | 18.42 | 0.07 | 53687.312 | 17.65 | 0.04 | 53687.336 | 18.42 | 0.07 | 53687.324 | 17.44 | 0.03 | 53687.324 | 17.33 | 0.02 |
| 53683.348 | 18.38 | 0.07 | 53687.328 | 17.59 | 0.04 | 53688.285 | 18.56 | 0.06 | 53688.270 | 17.48 | 0.03 | 53688.273 | 17.33 | 0.02 |
| 53685.320 | 18.82 | 0.14 | 53688.273 | 17.75 | 0.02 | 53690.391 | 18.70 | 0.20 | 53689.199 | 17.48 | 0.02 | 53689.203 | 17.34 | 0.03 |
| 53685.324 | 18.25 | 0.09 | 53689.195 | 17.78 | 0.03 | 53691.391 | 18.76 | 0.07 | 53690.359 | 17.57 | 0.04 | 53690.359 | 17.37 | 0.04 |
| 53686.262 | 18.46 | 0.16 | 53690.363 | 17.85 | 0.08 | 53696.375 | 19.09 | 0.09 | 53690.375 | 17.54 | 0.05 | 53690.379 | 17.36 | 0.04 |
| 53686.266 | 18.72 | 0.19 | 53691.379 | 17.90 | 0.04 | 53697.191 | 19.44 | 0.14 | 53691.375 | 17.51 | 0.04 | 53691.379 | 17.34 | 0.02 |
| 53688.277 | 19.07 | 0.18 | 53692.352 | 17.93 | 0.04 | 53706.371 | 19.91 | 0.07 | 53692.348 | 17.60 | 0.04 | 53692.352 | 17.38 | 0.02 |
| 53688.281 | 18.90 | 0.16 | 53693.363 | 17.94 | 0.04 | 53707.289 | 20.00 | 0.08 | 53693.359 | 17.65 | 0.03 | 53693.363 | 17.39 | 0.03 |
| 53695.375 | 19.51 | 0.36 | 53694.363 | 18.05 | 0.06 | 53709.195 | 19.95 | 0.07 | 53694.359 | 17.67 | 0.03 | 53694.359 | 17.51 | 0.03 |
| 53695.379 | 19.26 | 0.29 | 53695.371 | 18.19 | 0.04 | 53714.172 | 19.95 | 0.13 | 53695.367 | 17.73 | 0.02 | 53695.371 | 17.48 | 0.02 |
| 53696.371 | 19.51 | 0.31 | 53696.363 | 18.11 | 0.03 | 53730.258 | 20.55 | 0.23 | 53696.363 | 17.83 | 0.02 | 53696.363 | 17.53 | 0.02 |
| 53706.375 | 20.33 | 0.39 | 53697.184 | 18.19 | 0.05 | 53741.195 | 20.52 | 0.28 | 53697.188 | 17.76 | 0.04 | 53697.188 | 17.60 | 0.03 |
| 53709.199 | 20.63 | 0.33 | 53706.363 | 18.70 | 0.04 | 53764.168 | 20.71 | 0.14 | 53706.363 | 18.25 | 0.02 | 53706.367 | 17.89 | 0.03 |
| - | - | - | 53707.281 | 18.70 | 0.03 | 53766.195 | 20.64 | 0.15 | 53707.281 | 18.29 | 0.02 | 53707.285 | 17.94 | 0.02 |
| - | - | - | 53709.188 | 18.77 | 0.04 | - | - | - | 53709.191 | 18.34 | 0.02 | 53709.191 | 18.01 | 0.02 |
| - | - | - | 53711.180 | 18.94 | 0.04 | - | - | - | 53711.184 | 18.45 | 0.02 | 53713.145 | 18.19 | 0.09 |
| - | - | - | 53713.141 | 18.94 | 0.15 | - | - | - | 53713.141 | 18.53 | 0.09 | 53713.336 | 18.21 | 0.11 |
| - | - | - | 53714.164 | 19.03 | 0.05 | - | - | - | 53713.336 | 18.57 | 0.14 | 53714.172 | 18.20 | 0.03 |
| - | - | - | 53724.277 | 19.20 | 0.08 | - | - | - | 53714.168 | 18.57 | 0.03 | 53724.258 | 18.54 | 0.06 |
| - | - | - | 53728.320 | 19.28 | 0.06 | - | - | - | 53724.281 | 18.87 | 0.03 | 53724.285 | 18.59 | 0.03 |
| - | - | - | 53730.250 | 19.39 | 0.13 | - | - | - | 53728.324 | 18.97 | 0.04 | 53728.328 | 18.70 | 0.04 |
| - | - | - | 53737.270 | 19.41 | 0.23 | - | - | - | 53730.254 | 19.08 | 0.05 | 53730.254 | 18.68 | 0.08 |
| - | - | - | 53764.148 | 19.87 | 0.07 | - | - | - | 53741.191 | 19.21 | 0.08 | 53741.191 | 18.88 | 0.08 |
| - | - | - | 53766.184 | 19.89 | 0.08 | - | - | - | 53764.164 | 19.61 | 0.06 | 53764.168 | 19.49 | 0.12 |
| - | - | - | 53768.160 | 19.94 | 0.10 | - | - | - | 53765.145 | 19.63 | 0.08 | 53765.145 | 19.28 | 0.12 |
| - | - | - | 53779.137 | 20.10 | 0.10 | - | - | - | 53766.188 | 19.74 | 0.05 | 53766.191 | 19.52 | 0.12 |
| - | - | - | 53811.105 | 20.32 | 0.23 | - | - | - | 53768.164 | 19.74 | 0.06 | 53768.164 | 19.49 | 0.12 |
| - | - | - | - | - | - | - | - | - | 53777.117 | 19.67 | 0.11 | 53777.117 | 19.64 | 0.11 |
| - | - | - | - | - | - | - | - | - | 53779.129 | 19.94 | 0.07 | 53780.094 | 19.84 | 0.10 |
| - | - | - | - | - | - | - | - | - | 53780.094 | 19.89 | 0.08 | 53786.113 | 19.73 | 0.14 |
| - | - | - | - | - | - | - | - | - | 53786.113 | 19.85 | 0.12 | 53798.129 | 20.17 | 0.14 |
| - | - | - | - | - | - | - | - | - | 53798.141 | 20.12 | 0.07 | 53798.145 | 20.16 | 0.14 |
| - | - | - | - | - | - | - | - | - | 53805.098 | 20.18 | 0.23 | - | - | - |
| - | - | - | - | - | - | - | - | - | 53811.109 | 20.33 | 0.17 | - | - | - |
| MJD | d | MJD | d | MJD | d | |||
|---|---|---|---|---|---|---|---|---|
| 53676.109 | 17.10 | 0.09 | 53676.109 | 17.02 | 0.05 | 53676.109 | 17.34 | 0.25 |
| 53677.129 | 17.03 | 0.09 | 53677.129 | 16.98 | 0.04 | 53677.129 | 17.19 | 0.10 |
| 53678.141 | 16.78 | 0.07 | 53678.141 | 16.77 | 0.03 | 53679.148 | 16.90 | 0.09 |
| 53679.148 | 16.89 | 0.05 | 53679.148 | 16.93 | 0.05 | 53681.352 | 16.81 | 0.09 |
| 53681.352 | 16.77 | 0.07 | 53681.352 | 16.85 | 0.04 | 53682.230 | 16.58 | 0.08 |
| 53682.160 | 16.58 | 0.05 | 53682.160 | 16.79 | 0.03 | 53683.359 | 16.53 | 0.17 |
| 53683.340 | 16.65 | 0.05 | 53683.340 | 16.72 | 0.03 | 53684.238 | 16.75 | 0.07 |
| 53684.238 | 16.70 | 0.05 | 53684.238 | 16.69 | 0.03 | 53686.301 | 16.47 | 0.06 |
| 53686.301 | 16.68 | 0.05 | 53686.301 | 16.63 | 0.03 | 53687.211 | 16.62 | 0.06 |
| 53687.211 | 16.58 | 0.07 | 53687.211 | 16.67 | 0.04 | 53688.230 | 16.34 | 0.09 |
| 53688.230 | 16.53 | 0.05 | 53688.230 | 16.54 | 0.03 | 53689.230 | 16.26 | 0.09 |
| 53689.230 | 16.73 | 0.09 | 53689.230 | 16.53 | 0.03 | 53690.359 | 16.48 | 0.17 |
| 53690.359 | 16.66 | 0.08 | 53690.359 | 16.66 | 0.04 | 53691.340 | 16.62 | 0.17 |
| 53691.340 | 16.43 | 0.06 | 53691.340 | 16.50 | 0.03 | 53695.180 | 16.29 | 0.07 |
| 53695.180 | 16.70 | 0.07 | 53695.180 | 16.59 | 0.17 | 53696.141 | 16.33 | 0.06 |
| 53696.141 | 16.61 | 0.06 | 53696.141 | 16.60 | 0.04 | 53699.172 | 16.58 | 0.09 |
| 53699.172 | 16.55 | 0.06 | 53699.172 | 16.66 | 0.04 | 53700.301 | 16.35 | 0.08 |
| 53700.301 | 16.59 | 0.06 | 53700.301 | 16.67 | 0.04 | 53711.301 | 16.98 | 0.13 |
| 53711.301 | 16.94 | 0.09 | 53711.301 | 17.04 | 0.03 | 53713.129 | 17.10 | 0.17 |
| 53712.281 | 16.92 | 0.07 | 53712.281 | 17.16 | 0.07 | 53714.102 | 16.97 | 0.11 |
| 53713.129 | 17.00 | 0.09 | 53713.129 | 17.04 | 0.04 | 53721.262 | 17.37 | 0.17 |
| 53714.102 | 16.97 | 0.07 | 53714.102 | 17.11 | 0.05 | 53724.211 | 17.17 | 0.11 |
| 53720.219 | 16.95 | 0.11 | 53719.219 | 17.54 | 0.19 | 53725.172 | 17.42 | 0.16 |
| 53721.262 | 17.10 | 0.12 | 53720.219 | 17.37 | 0.09 | 53726.148 | 17.59 | 0.25 |
| 53724.211 | 17.10 | 0.10 | 53721.262 | 17.33 | 0.10 | 53727.199 | 17.54 | 0.17 |
| 53725.172 | 17.33 | 0.05 | 53724.211 | 17.27 | 0.17 | 53729.238 | 17.45 | 0.17 |
| 53726.148 | 17.35 | 0.04 | 53725.172 | 17.52 | 0.09 | 53732.211 | 17.61 | 0.19 |
| 53727.199 | 17.44 | 0.07 | 53726.148 | 17.62 | 0.09 | 53733.191 | 17.73 | 0.23 |
| 53728.219 | 17.55 | 0.25 | 53727.199 | 17.60 | 0.08 | - | - | - |
| 53729.238 | 17.24 | 0.12 | 53728.219 | 17.86 | 0.10 | - | - | - |
| 53732.211 | 17.40 | 0.10 | 53729.238 | 17.61 | 0.08 | - | - | - |
| 53733.191 | 17.44 | 0.12 | 53732.211 | 17.76 | 0.11 | - | - | - |
| - | - | - | 53733.191 | 17.93 | 0.11 | - | - | - |
| SN Name | |||||||||
|---|---|---|---|---|---|---|---|---|---|
| () | () | () | () | () | () | () | () | () | |
| SN 2003jdaaIncludes data near peak from Valenti et al. (2008). | - - | - - | - - | 52942.50 (0.39) | 16.33 (0.05) | - - | 52942.78 (0.47) | 15.93 (0.02) | - - |
| SN 2004awbbIncludes data near peak from Taubenberger et al (2006). | - - | - - | - - | 53085.55 (0.32) | 17.91 (0.03) | 0.85 (0.26) | 53090.95 (0.85) | 17.23 (0.03) | - - |
| SN 2004fe | - - | - - | - - | - - | - - | - - | 53318.80 (0.46) | 17.09 (0.02) | - - |
| SN 2004gq | 53353.86 (2.61) | 15.67 (0.09) | - - | 53353.68 (1.87) | 16.12 (0.02) | - - | - - | - - | - - |
| SN 2004gt | - - | - - | - - | 53388.52 (1.41) | 18.07 (0.05) | - - | - - | - - | - - |
| SN 2005az | - - | - - | - - | - - | - - | - - | 53473.36 (0.75) | 16.40 (0.05) | 0.33 (0.03) |
| SN 2005bfccTwo peaks are visible for SN 2005bf in -band and both are reported here. | 53473.20 (0.05) | 17.16 (0.03) | - - | 53474.22 (0.18) | 17.66 (0.02) | - - | 53476.75 (0.42) | 17.46 (0.03) | - - |
| SN 2005bfccTwo peaks are visible for SN 2005bf in -band and both are reported here. | 53498.54 (0.09) | 16.42 (0.02) | 1.13 (0.08) | 53497.73 (0.14) | 16.71 (0.02) | 1.12 (0.06) | 53498.46 (0.33) | 16.43 (0.02) | 0.86 (0.02) |
| SN 2005hg | 53679.26 (0.68) | 18.25 (0.06) | 1.51 (0.45) | 53681.51 (0.17) | 18.14 (0.02) | 1.50 (0.15) | 53683.94 (0.27) | 17.61 (0.03) | 0.93 (0.14) |
| SN 2005kl | - - | - - | - - | - - | - - | - - | 53703.16 (0.56) | 16.83 (0.03) | 1.07 (0.40) |
| SN 2005kz | - - | - - | - - | 53710.58 (0.76) | 19.85 (0.29) | - - | 53712.44 (0.36) | 18.61 (0.05) | 0.97 (0.99) |
| SN 2005mf | - - | - - | - - | - - | - - | - - | 53734.06 (0.14) | 18.07 (0.02) | 0.94 (0.05) |
| SN 2006T | - - | - - | - - | 53780.67 (0.41) | 16.81 (0.05) | 2.13 (0.10) | 53781.56 (0.10) | 15.69 (0.02) | - - |
| SN 2006aj | 53789.29 (0.78) | 17.99 (0.06) | - - | 53792.68 (0.07) | 18.06 (0.03) | - - | 53794.23 (0.58) | 17.51 (0.02) | - - |
| SN 2006elddFrom http://www.cbat.eps.harvard.edu/lists/Supernovae.html. | - - | - - | - - | - - | - - | - - | 53984.20 (0.11) | 17.57 (0.03) | - - |
| SN 2006ep | - - | - - | - - | 53984.96 (0.23) | 18.07 (0.05) | 1.69 (0.12) | 53988.18 (0.08) | 17.40 (0.02) | - - |
| SN 2006lv | - - | - - | - - | - - | - - | - - | 54045.07 (1.10) | 18.44 (0.05) | 0.48 (0.19) |
| SN 2007C | - - | - - | - - | - - | - - | - - | 54115.44 (0.51) | 16.13 (0.02) | 1.05 (0.03) |
| SN 2007D | - - | - - | - - | - - | - - | - - | 54122.81 (0.83) | 18.84 (0.13) | 1.34 (0.20) |
| SN 2007ag | - - | - - | - - | - - | - - | - - | 54169.76 (0.37) | 18.42 (0.03) | - - |
| SN 2007cl | - - | - - | - - | - - | - - | - - | 54250.35 (1.00) | 17.85 (0.03) | 0.64 (0.09) |
| SN 2007iq | - - | - - | - - | 54377.26 (2.97) | 19.47 (0.09) | - - | - - | - - | - - |
| SN 2007kj | - - | - - | - - | 54378.42 (0.83) | 18.14 (0.03) | 1.29 (0.29) | 54381.96 (0.11) | 17.67 (0.02) | 1.34 (0.07) |
| SN 2007rueeGalactic extintion calculated according to Schlafly & Finkbeiner (2011) | - - | - - | - - | - - | - - | - - | 54439.95 (0.43) | 15.96 (0.01) | 0.91 (0.07) |
| SN 2007rz | - - | - - | - - | 54455.49 (1.61) | 19.01 (0.17) | - - | - - | - - | - - |
| SN 2007uy | - - | - - | - - | 54477.81 (0.10) | 16.73 (0.02) | 1.30 (0.07) | 54481.34 (0.70) | 15.76 (0.01) | - - |
| SN 2008DffIncludes KAIT data near peak from Modjaz et al. (2009), and Soderberg et al. (2008). | - - | - - | - - | 54491.69 (0.12) | 18.42 (0.05) | 1.56 (0.09) | 54494.24 (0.07) | 17.40 (0.02) | 0.80 (0.02) |
| SN 2008bo | - - | - - | - - | 54567.80 (0.23) | 16.58 (0.02) | 2.29 (0.21) | 54569.24 (0.16) | 16.08 (0.01) | - - |
| SN 2009er | - - | - - | - - | - - | - - | - - | 54982.09 (0.16) | 17.25 (0.02) | 0.90 (0.01) |
| SN 2009iz | 55106.85 (0.38) | 18.47 (0.12) | 55106.72 (0.17) | 17.52 (0.04) | 1.08 (0.10) | 55108.85 (1.36) | 16.97 (0.02) | 0.74 (0.09) | |
| SN 2009jfggIncludes data near peak from Valenti et al. (2011). | - - | - - | - - | 55119.23 (0.21) | 15.66 (0.01) | 0.99 (0.05) | 55122.32 (0.18) | 15.03 (0.02) | 0.91 (0.14) |
| SN Name | ||||||
|---|---|---|---|---|---|---|
| () | () | () | () | () | () | |
| SN 2003jdaaPhotometry collected with Johnson R and I filters | - - | - - | - - | 52945.05 (2.54) | 15.61 (0.03) | - - |
| SN 2004awaaPhotometry collected with Johnson R and I filters | 53096.04 (0.02) | 16.82 (0.03) | 0.39 (0.01) | 53095.29 (0.80) | 16.79 (0.02) | 0.57 (0.11) |
| SN 2004fe | 53321.52 (0.68) | 17.01 (0.04) | - - | 53320.09 (0.75) | 17.09 (0.03) | - - |
| SN 2004gq | - - | - - | - - | 53364.31 (0.24) | 15.50 (0.04) | 0.25 (0.02) |
| SN 2005az | 53476.10 (0.54) | 16.06 (0.03) | - - | 53479.84 (0.76) | 15.97 (0.04) | 0.45 (0.05) |
| SN 2005bf | 53499.93 (0.38) | 16.36 (0.02) | 0.65 (0.05) | 53503.58 (0.30) | 16.36 (0.02) | - - |
| SN 2005eo | - - | - - | - - | 53648.97 (0.63) | 18.02 (0.04) | 2.57 (1.00) |
| SN 2005hg | 53686.44 (0.40) | 17.45 (0.04) | 0.64 (0.20) | 53688.69 (0.63) | 17.33 (0.03) | 0.60 (0.14) |
| SN 2005kl | 53704.24 (1.65) | 16.07 (0.01) | 0.60 (0.23) | 53705.12 (0.64) | 15.39 (0.02) | 0.42 (0.09) |
| SN 2005kz | - - | - - | - - | 53713.18 (1.32) | 18.34 (0.06) | - - |
| SN 2005mf | 53736.10 (0.47) | 17.93 (0.02) | 0.78 (0.09) | 53737.86 (0.20) | 18.16 (0.03) | 0.43 (0.09) |
| SN 2006F | - - | - - | - - | 53752.48 (0.58) | 17.47 (0.03) | 0.57 (0.09) |
| SN 2006T | 53782.52 (0.11) | 15.53 (0.03) | 1.27 (0.31) | 53783.51 (0.38) | 15.55 (0.03) | - - |
| SN 2006aj | 53794.61 (1.18) | 17.44 (0.05) | - - | 53797.79 (0.14) | 17.45 (0.02) | 1.08 (0.06) |
| SN 2006ba | - - | - - | - - | 53828.34 (0.73) | 17.67 (0.05) | - - |
| SN 2006bf | 53827.53 (0.27) | 18.71 (0.03) | - - | - - | - - | - - |
| SN 2006cb | - - | - - | - - | 53863.53 (0.38) | 18.23 (0.04) | - - |
| SN 2006el | 53986.00 (0.10) | 17.47 (0.02) | - - | 53987.40 (0.21) | 17.45 (0.03) | 1.12 (0.21) |
| SN 2006ep | 53990.10 (0.11) | 17.23 (0.02) | 0.98 (0.06) | 53991.58 (0.21) | 17.10 (0.02) | 0.91 (0.05) |
| SN 2006fo | 54006.61 (0.33) | 17.32 (0.02) | 0.52 (0.02) | 54010.72 (0.54) | 17.22 (0.02) | 0.43 (0.05) |
| SN 2006lc | - - | - - | - - | 54043.14 (0.13) | 17.17 (0.03) | 0.71 (0.04) |
| SN 2007C | 54117.80 (0.15) | 15.79 (0.01) | - - | 54119.09 (0.02) | 15.56 (0.02) | 1.13 (0.04) |
| SN 2007D | 54120.31 (1.91) | 18.52 (0.08) | 0.67 (0.18) | - - | - - | - - |
| SN 2007ag | 54170.60 (0.31) | 18.13 (0.02) | 1.07 (0.21) | 54171.39 (0.26) | 18.04 (0.03) | - - |
| SN 2007ce | - - | - - | - - | 54226.61 (0.38) | 17.53 (0.02) | 0.51 (0.08) |
| SN 2007cl | 54254.09 (0.13) | 17.62 (0.02) | 0.94 (0.05) | 54255.11 (0.14) | 17.70 (0.02) | 0.82 (0.05) |
| SN 2007ke | 54371.19 (2.68) | 18.66 (0.23) | - - | - - | - - | - - |
| SN 2007kj | 54383.39 (0.33) | 17.56 (0.05) | 1.15 (0.26) | 54384.23 (0.44) | 17.71 (0.06) | 0.75 (0.26) |
| SN 2007ru | 54440.64 (0.32) | 15.87 (0.02) | 0.68 (0.03) | 54442.68 (0.40) | 15.78 (0.02) | 0.72 (0.04) |
| SN 2007rz | 54455.74 (1.94) | 18.23 (0.26) | - - | - - | - - | - - |
| SN 2007uy | 54484.75 (0.24) | 15.56 (0.02) | 0.95 (0.06) | 54485.64 (0.68) | 15.59 (0.02) | - - |
| SN 2008D | 54495.47 (0.11) | 16.99 (0.02) | 0.89 (0.03) | 54497.19 (0.45) | 16.65 (0.02) | 0.57 (0.12) |
| SN 2008aq | 54530.28 (3.20) | 15.85 (0.07) | 0.40 (0.22) | 54536.92 (0.68) | 16.04 (0.05) | - - |
| SN 2008bo | 54570.33 (0.59) | 16.02 (0.02) | 1.20 (0.28) | 54571.11 (0.30) | 16.08 (0.03) | 1.04 (0.22) |
| SN 2009er | 54984.00 (0.24) | 17.19 (0.02) | 1.00 (0.29) | 54985.08 (0.49) | 17.26 (0.02) | 0.47 (0.04) |
| SN 2009iz | 55111.73 (0.25) | 16.84 (0.02) | 0.65 (0.04) | 55115.67 (0.23) | 16.82 (0.02) | 0.45 (0.03) |
| SN 2009jf | 55123.52 (0.07) | 15.00 (0.01) | 0.52 (0.04) | 55124.92 (0.10) | 15.01 (0.02) | 0.43 (0.03) |
| SN Name | |||||||||
|---|---|---|---|---|---|---|---|---|---|
| () | () | () | () | () | () | () | () | () | |
| SN 2004gk | 53458.33 (2.49) | 16.39 (0.12) | - - | - - | - - | - - | - - | - - | - - |
| SN 2004gt | - - | - - | - - | - - | - - | - - | 53472.00 (0.45) | 15.63 (0.28) | - - |
| SN 2005bf | 53505.32 (0.44) | 15.90 (0.01) | 0.39 (0.02) | 53511.45 (2.03) | 15.81 (0.07) | 0.18 (0.11) | 53512.49 (1.69) | 15.57 (0.03) | 0.26 (0.04) |
| SN 2005eo | - - | - - | - - | - - | - - | - - | 53659.95 (1.62) | 15.57 (0.09) | 0.40 (0.13) |
| SN 2005hg | 53692.40 (0.61) | 16.54 (0.03) | 0.53 (0.07) | 53693.73 (0.44) | 16.55 (0.06) | 0.29 (0.03) | 53695.95 (0.70) | 16.37 (0.08) | 0.44 (0.08) |
| SN 2005kl | 53706.57 (1.20) | 13.78 (0.04) | 0.28 (0.04) | 53713.94 (1.70) | 13.34 (0.12) | 0.50 (0.09) | 53706.71 (3.34) | 12.97 (0.09) | 0.22 (0.05) |
| SN 2005mf | 53740.91 (0.41) | 17.41 (0.03) | 0.61 (0.17) | 53742.27 (0.27) | 17.27 (0.05) | 0.97 (0.25) | 53743.06 (0.38) | 16.93 (0.09) | 0.80 (0.12) |
| SN 2006aj | 53793.79 (2.09) | 16.95 (0.12) | - - | 53793.85 (1.62) | 16.70 (0.13) | - - | 53793.11 (0.76) | 16.39 (0.11) | - - |
| SN 2006fo | 54020.38 (0.62) | 16.26 (0.09) | 0.49 (0.07) | 54018.35 (3.42) | 16.39 (0.16) | 0.14 (0.05) | 54018.04 (0.99) | 17.03 (0.15) | 0.51 (0.12) |
| SN 2007ce | 54231.00 (2.65) | 17.26 (0.16) | 0.35 (0.29) | 54237.21 (1.77) | 17.51 (0.22) | - - | - - | - - | - - |
| SN 2007uy | 54490.08 (0.09) | 14.79 (0.02) | 0.48 (0.03) | 54491.36 (0.19) | 14.62 (0.03) | 0.47 (0.03) | 54492.40 (0.11) | 14.35 (0.03) | 0.47 (0.03) |
| SN 2009er | 54990.32 (0.28) | 16.60 (0.02) | 0.99 (0.14) | 54989.98 (1.05) | 16.64 (0.13) | 0.63 (0.14) | - - | - - | - - |
| SN 2009iz | 55120.83 (0.14) | 16.24 (0.01) | 0.33 (0.01) | 55125.04 (0.38) | 16.24 (0.03) | 0.23 (0.02) | 55123.23 (0.34) | 15.73 (0.18) | 0.23 (0.02) |
| SN 2009jf | 55129.12 (0.15) | 14.42 (0.03) | 0.23 (0.02) | 55130.40 (0.33) | 14.29 (0.06) | 0.36 (0.13) | 55133.06 (0.25) | 13.89 (0.03) | 0.54 (0.04) |