Angular momentum transport within evolved low-mass stars
Abstract
Asteroseismology of red giants by the Kepler satellite has enabled the first definitive measurements of interior rotation in both first ascent red giant branch (RGB) stars and those on the Helium burning clump. The inferred rotation rates are days for the He degenerate cores on the RGB and days for the He burning core in a clump star. Using the MESA code we calculate state-of-the-art stellar evolution models of low mass rotating stars from the zero-age main sequence to the cooling white dwarf (WD) stage. We include transport of angular momentum due to rotationally induced instabilities and circulations, as well as magnetic fields in radiative zones (generated by the Tayler-Spruit dynamo). We find that all models fail to predict core rotation as slow as observed on the RGB and during core He burning, implying that an unmodeled angular momentum transport process must be operating on the early RGB of low mass stars. Later evolution of the star from the He burning clump to the cooling WD phase appears to be at nearly constant core angular momentum. We also incorporate the adiabatic pulsation code, ADIPLS, to explicitly highlight this shortfall when applied to a specific Kepler asteroseismic target, KIC8366239.
Subject headings:
asteroseismology — methods: numerical — stars: evolution — stars: interiors — stars: rotation1. Introduction
Stellar rotation and the resulting internal rotational profile, together with the mechanisms that contribute to angular momentum transport, remain poorly probed. Different classes of transport mechanisms have been proposed, in particular hydrodynamical instabilities and circulations induced by rotation (see Maeder & Meynet, 2000, for a review), magnetic torques (Gough & McIntyre, 1998; Spruit, 1999, 2002; Spada et al., 2010) and internal gravity waves (see e.g., Charbonnel & Talon, 2005). In the absence of strong mass loss, the bulk of the redistribution of angular momentum is expected to occur when shearing is generated during evolutionary episodes of expansion or contraction.
Most stars ignite hydrogen in a shell at the end of the main sequence. Above this shell the star begins to expand, while the core contracts. In the absence of a strong coupling between the core and the envelope, conservation of angular momentum requires that the core spins up while the envelope spins down. This implies very rapidly rotating stellar cores and a shear layer between core and envelope. Evolutionary calculations that include angular momentum transport from rotational instabilities and circulations also predict rapidly rotating stellar cores at the end of stellar evolution (e.g., Heger et al., 2000; Suijs et al., 2008; Eggenberger et al., 2012; Marques et al., 2013). This is at odds with the observed rotation rate of white dwarfs (WD) and neutron stars (NS). This can be somewhat remedied by including angular momentum transport due to magnetic torques in radiative regions (Tayler-Spruit dynamo (TS) Spruit, 2002; Heger et al., 2005; Suijs et al., 2008).
In the era of space asteroseismology, the Kepler satellite enabled the measurement of the core rotation in many red giant branch (RGB) stars using the splitting of mixed modes (Beck et al., 2012; Deheuvels et al., 2012; Mosser et al., 2012b; Deheuvels et al., 2014). Mixed modes are oscillations that have an acoustic component (p-mode) in the envelope and are g-modes (restoring force is buoyancy) in the stellar core (see e.g., Beck et al., 2011). Mosser et al. (2012a, b) showed that it is the rotation rate of the material below the active hydrogen burning shell that is most directly inferred from the splitting of mixed modes (see also Marques et al., 2013). This measurement of the interior rotational state of an evolved star provides a new test for theoretical ideas of angular momentum transport. Similar to the case of compact remnants, models solely including angular momentum transport due to rotational mixing and circulations predict rotation rates 2 to 3 orders of magnitude higher than observed (Eggenberger et al., 2012; Marques et al., 2013; Ceillier et al., 2013). While the adopted treatment of angular momentum transport is a crude approximation, Marques et al. (2013) have shown that even the most extreme of the physically motivated hydrodynamic mechanisms included in their code cannot yield the observed slow rotation.
Our goal is to assess whether models including transport due to TS magnetic fields agree more closely with the observations. While the physics of the Tayler instability is secure, the existence of the Tayler-Spruit dynamo loop is debated on both analytical and numerical grounds (Braithwaite, 2006; Zahn et al., 2007). However observations of the spin rates of compact objects (WDs and NSs) are in much better agreement with models including this angular momentum transport mechanism (Heger et al., 2005; Suijs et al., 2008), which has also been discussed in the context of the rigid rotation of the solar core (Eggenberger et al., 2005), but see also Denissenkov et al. (2010). In Sec. 2 we present the stellar evolution calculations and the details of the implemented physics. Results for the evolution of core rotation during the early RGB are shown in Sec. 2.1 for different angular momentum transport mechanisms. Results are compared to Kepler asteroseismic observations of mixed modes in RGB stars. In Sec. 3 we show how the rotational splittings of mixed modes are calculated from the stellar evolution models using ADIPLS (Christensen-Dalsgaard, 2008). Sec. 4 presents the angular momentum evolution of our models beyond the early RGB. Predictions for the core rotation rates past the luminosity bump (Sec. 4.1), during core He-burning (Sec. 4.2) and in the WD stage (Sec. 4.3) are shown and compared to the asteroseismically derived values. In Sec. 5 we draw our conclusions and discuss possible future work.
2. Stellar evolution calculations
We use the Modules for Experiments in Stellar Evolution (MESA, release 5118) code to evolve low-mass stars from the pre-main-sequence to the cooling WD sequence (Paxton et al., 2011, 2013). This code includes the effects of the centrifugal force on the stellar structure, chemical mixing and transport of angular momentum due to rotationally induced hydrodynamic instabilities (Heger et al., 2000). The mixing of angular momentum due to dynamo-generated magnetic fields in radiative zones is also included (Spruit, 2002; Petrovic et al., 2005; Heger et al., 2005). See Paxton et al. (2013) for the details of the implementation of rotation and magnetic fields in MESA.
We chose an initial metallicity of with a mixture taken from Asplund et al. (2005). We adopt the OPAL opacity tables (Iglesias & Rogers, 1996) accounting for the carbon- and oxygen- enhanced opacities during helium burning (Type 2 OPAL, Iglesias & Rogers, 1993). Solid body rotation is set at the zero-age main sequence (ZAMS).
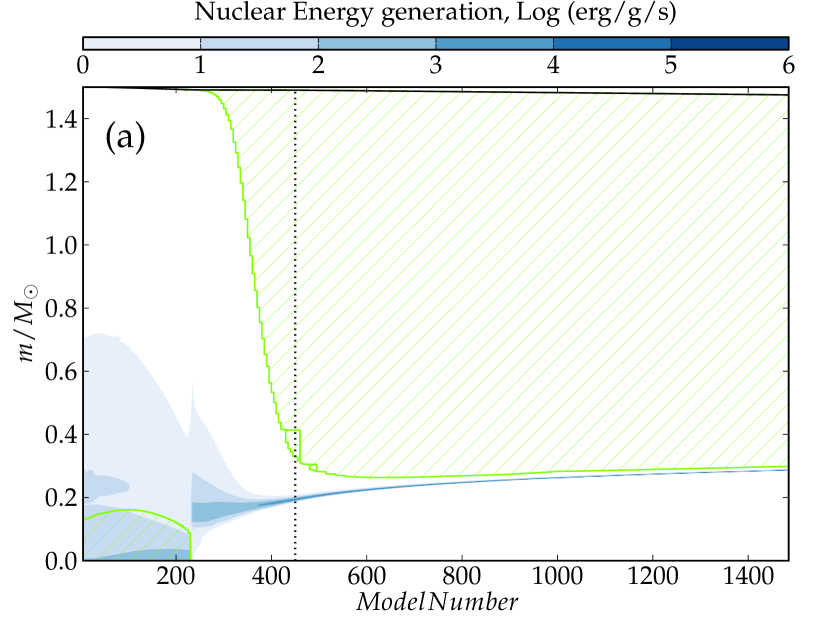
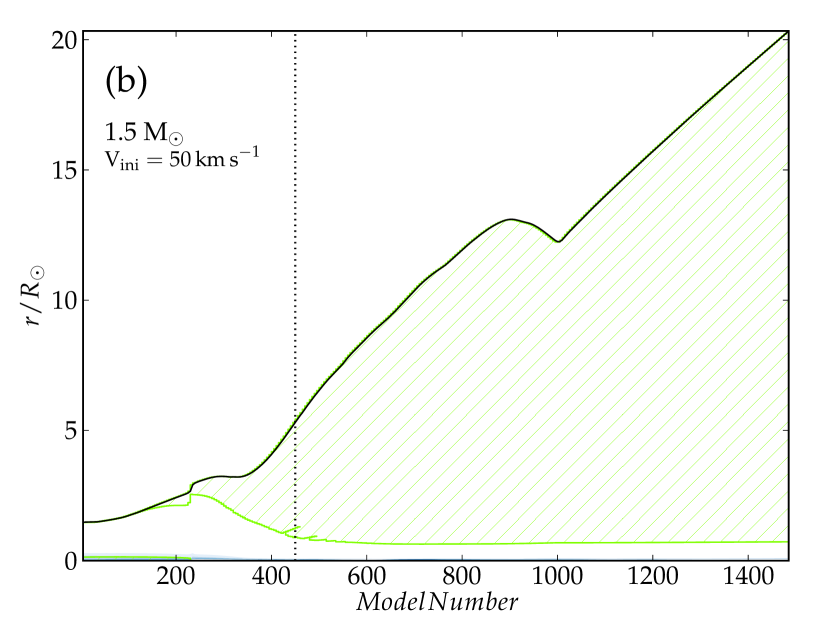
Convective regions are calculated using the mixing-length theory (MLT) in the Henyey et al. (1965) formulation with . Transport of angular momentum in convective regions is accounted for using the resulting MLT diffusion coefficient (turbulent diffusivity), which is so large as to cause rigid rotation in convective zones. While this seems to be the case in the Sun, another possible treatment of rotating convective zones is adopting a constant specific angular momentum (See e.g. Kawaler & Hostler, 2005). We ran calculations with this assumption and found that it does not affect our conclusions. The boundaries of convective regions are determined using the Ledoux criterion. Semiconvection is accounted for in the prescription of Langer et al. (1983, 1985) with an efficiency = 0.003. A step function overshooting extends the mixing region for 0.2 pressure scale heights beyond the convective boundary during core H-burning. We also account for gravitational settling and chemical diffusion (Paxton et al., 2011). Figure 1 shows Kippenhahn diagrams for the model.
2.1. Early RGB
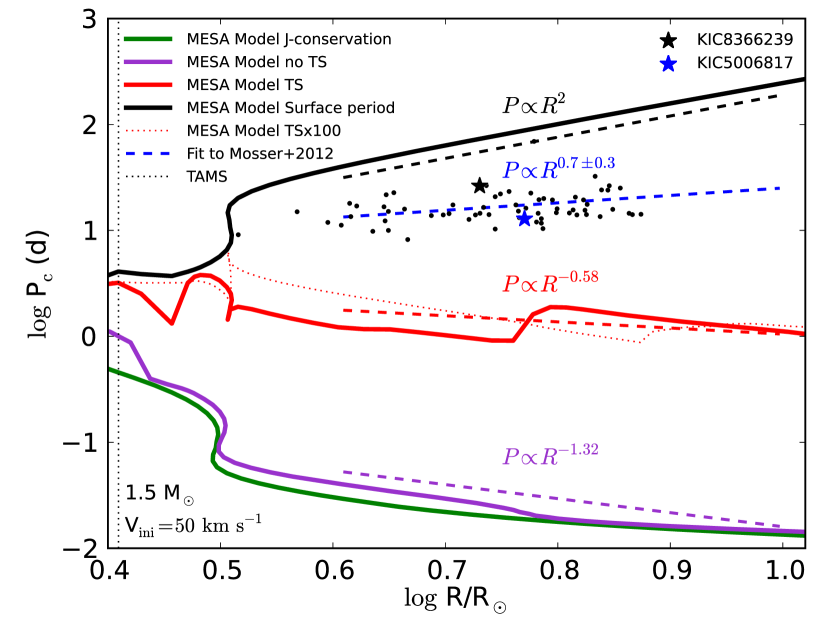
The evolution of core rotation period, , during the early RGB for our models with different assumptions for the internal angular momentum transport is shown in Fig. 2. The models are initially rigidly rotating at the ZAMS with a surface velocity of , a typical value for stars in this mass range (Nielsen et al., 2013). The value shown for is a mass average of the rotational period in the region below the maximum of the energy generation in the H-burning shell. The contraction of the core leads to different rates of spin up for the different angular momentum transport mechanisms considered (See e.g. Tayar & Pinsonneault, 2013). At the same time the expanding envelope slows down substantially, following the expected scaling from expansion and angular momentum conservation (no substantial mass is lost in this phase). These calculated cores rotate about times faster than the values inferred by asteroseismology (Fig. 2). During this phase the mass of the core increases only slightly. The work of Mosser et al. (2012b) revealed that the cores of stars in the mass range 1.2–1.5 spin down while ascending the early RGB as , while our stellar evolution calculations show spin up with different slopes ( for models including TS and for models only including angular momentum transport by rotational instabilities111These exponents have been calculated for the range R/=[3,15]), depending on the assumptions for angular momentum transport. This clearly shows that the amount of torque between the core and envelope during the RGB evolution is underestimated by the models.
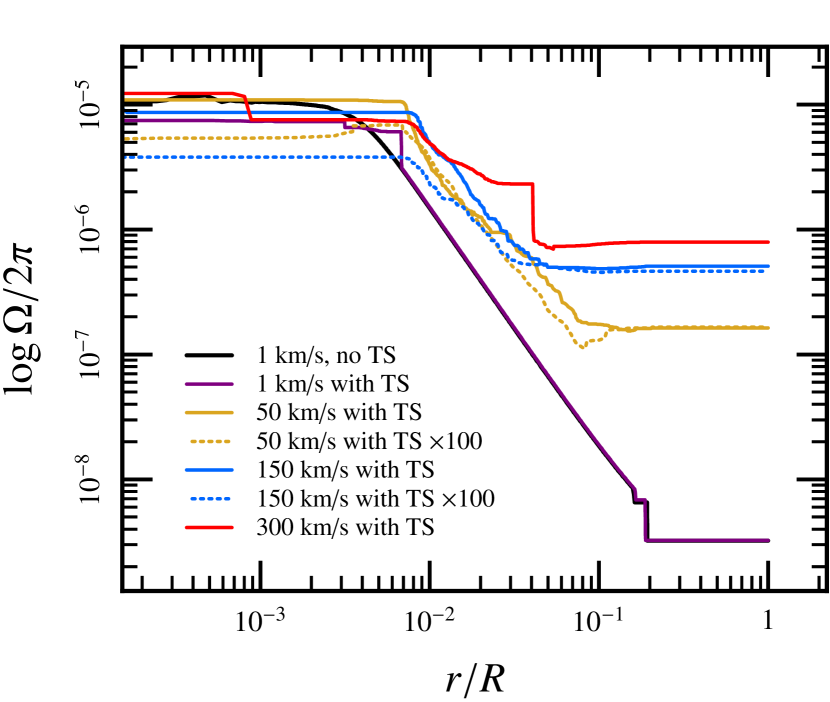
We explored whether an increase in the efficiency of the TS mechanism could reconcile the models with the observations. However, even increasing the diffusion coefficient resulting from the magnetic torques by a factor 100 does not result in enough coupling to explain the observations. This is largely due to the self-regulating nature of the Tayler-Spruit dynamo. The poloidal component of the magnetic field is generated by the Tayler instability that occurs in the toroidal component of the field. However the toroidal component is amplified by the differential rotation, which is in turn suppressed by the torque . It is not too surprising then to observe that the system tends to relax around some differential rotation state which depends only weakly on increasing the efficiency of the Tayler-Spruit dynamo loop.
Finally we checked if an artificial constant diffusivity could explain the observations. We confirm the results of Eggenberger et al. (2012): in our model initially rotating with a diffusivity of matches the observed splittings of . However such a constant diffusivity is unphysical and fails to explain the later evolution and the observations of rotation rates in clump stars and WDs (see Sec. 4.2).
We conclude that on the early RGB of low-mass stars none of the angular momentum transport mechanisms usually included in stellar evolution codes can produce a coupling adequate to explain the asteroseismic derived core rotation rates.
3. Calculating the splitting of mixed modes
Rotation lifts the degeneracy between the non-radial modes of the same radial order and degree but different azimuthal order . When the rotation of the star is slow the centrifugal force can be neglected. If the rotation profile is spherically symmetric one obtains
| (1) |
for the frequency of the mode. Here is the rotational splitting, a weighted measure of the star’s rotation profile , given by
| (2) |
The functions are called rotational kernels of the modes and depend on the star’s equilibrium structure and on the mode eigenfunctions (Aerts et al., 2010). Therefore rotational splittings are a weighted measure of the star’s rotation rate through the rotational kernels.
In order to calculate the splitting of mixed modes we used the adiabatic pulsation code ADIPLS (Christensen-Dalsgaard, 2008, 2011 June release). This code is coupled and distributed within the MESA code suite (Paxton et al., 2013).
We start by modeling the red giant , for which Beck et al. (2012) observed a rotational splitting of p-dominated mixed modes of Hz. On the other hand, the observed splitting for the g-dominated mixed modes (mostly living in the stellar core) is Hz. This confirmed the theoretical expectation that the core of this red giant is rotating faster than its envelope. Similarly to Eggenberger et al. (2012) for we adopt an initial mass of and calculate models assuming different physics for angular momentum transport. We select the background structure of the different calculations by matching the global asteroseismic properties of (frequency of maximum oscillation power, , and large frequency separation ), as derived by Beck et al. (2012). The MESA background structure and rotational profiles are then used in ADIPLS to calculate the splitting of mixed modes for different angular momentum transport mechanisms.
We show in Fig. 3 an example of the background rotational profile calculated by MESA, together with the radial partial integrals of the rotational kernels for calculated using ADIPLS. This shows that the p-dominated modes mostly probe the envelope of the star, where the angular velocity is quite low. The gravity dominated modes probe the radiative region below the H-burning shell, in which the angular velocity is much higher. Note that higher modes have higher Lamb frequencies, implying a larger tunneling zone between the acoustic cavity in the envelope and the gravity mode region in the core. As a consequence these modes are “less mixed”, with p-modes (g-modes) being more p-like (g-like) than their analogue. Therefore when observable, higher g-dominated (p-dominated) modes are cleaner probes of core (envelope) rotation rate.
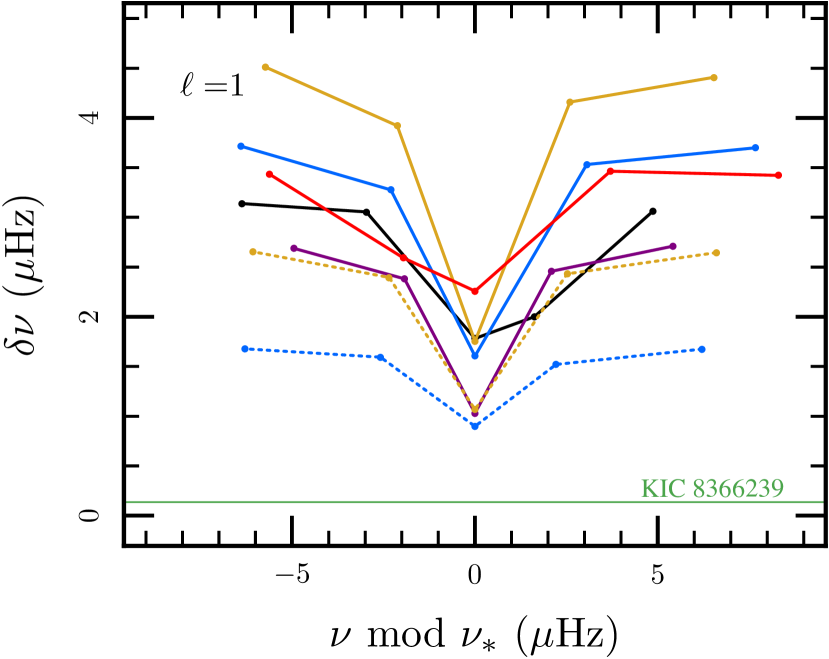
To carefully compare the model rotation rates with those derived from the observations we calculate the relevant eigenfunctions and rotational kernels and compute the predicted splittings of as a function of different initial rotational velocities and physics of angular momentum transport (Fig. 4). The splittings have been calculated using the ADIPLS code and the MESA background structure at the location that matches the asteroseismic properties (, ) of the star.
In agreement with results of Sec. 2.1, models that only include angular momentum transport due to rotational instabilities and circulations fail to reproduce the observed splittings in the RGB star . Even models with an extremely slow initial rotation of result in rotational splittings one order of magnitude larger than the observed ones, which clearly shows this class of models can not explain the observations. This agrees with the calculations of Eggenberger et al. (2012), despite the implementation of the physics of rotation being quite different in the GENEVA code compared to MESA (See Sec. 6 in Paxton et al., 2013, and references therein).
Models including angular momentum transport due to Tayler-Spruit magnetic fields couple much more strongly, but still result in rotational splittings on the order of 1 Hz (Fig. 4), a factor of higher than measured. Even artificially increasing the Tayler-Spruit diffusion coefficient by a factor of 100 we could not reproduce the observed splittings.

4. Angular momentum evolution beyond the RGB
4.1. RGB past the luminosity bump
As the degenerate He core grows in mass, its angular momentum content is determined by the rate of angular momentum transport and by the specific angular momentum of the advected material. Both may change as the star climbs up the RGB. This is because angular momentum transport mechanisms can be a function of, e.g., the rate of shear between the core and the envelope, which tends to increase as the star expands. Moreover during the RGB the H-burning shell moves up in mass coordinate and at some point crosses the compositional discontinuity left by the first dredge up (luminosity bump). Since the envelope expands and at the same time loses a considerable amount of mass through stellar winds (about in the model), it loses angular momentum at an increasing rate. As angular momentum is expected to be mixed efficiently in convective regions, the specific angular momentum of the material engulfed by the core after the luminosity bump is expected to be low and to decrease as the star climbs the RGB. Note that the disappearance of the steep compositional gradient after the luminosity bump is also expected to enhance the efficiency of angular momentum transport mechanisms between core and envelope. Evidence of enhanced chemical mixing below the convective envelope (cold bottom process) comes from the observation of surface abundances in red giants, in particular a sudden drop in the carbon isotopic ratio and changes in , carbon and nitrogen (Gratton et al., 2000). The nature of this mixing is currently debated (See e.g. Palacios et al., 2006; Charbonnel & Zahn, 2007; Nordhaus et al., 2008; Cantiello & Langer, 2010; Traxler et al., 2011; Denissenkov & Merryfield, 2011; Brown et al., 2013).
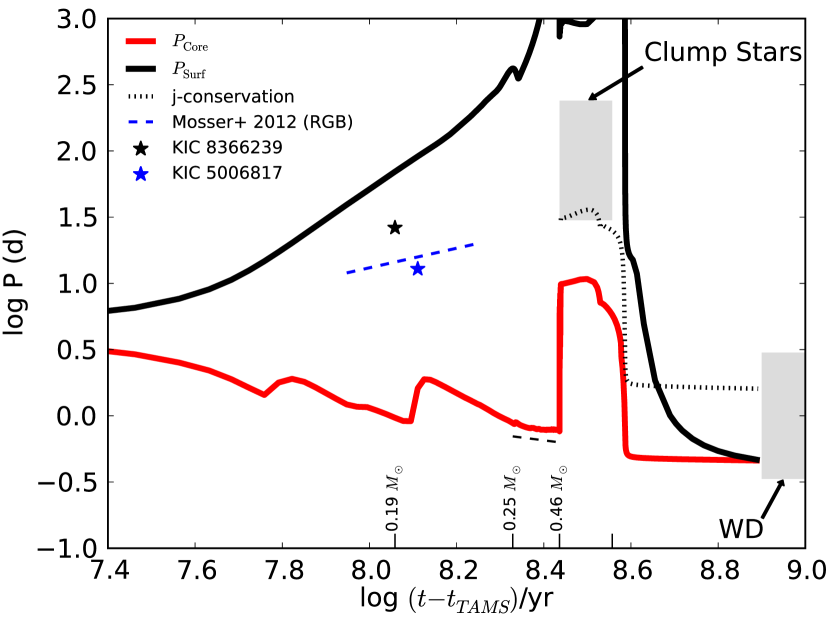
In our calculations the luminosity bump occurs when the star has a value of the large separation Hz and frequency of maximum oscillation power Hz. Regardless of the specific angular momentum transport mechanism included, we find a change in the exponent of the relation associated with the luminosity bump (see e.g. the black dashed line in Fig. 5). In particular for the model including magnetic torques and rotating with an initial surface velocity of , changes from -0.58 to -0.01 (while the same model only including angular momentum transport due to rotational instabilities has changing from -1.32 to -0.13). Different exponents are found for different initial rotational velocities, but we consistently find a break at the luminosity bump. This is because the value of the specific angular momentum of the advected material decreases rapidly as the core engulfs regions left by the retreating convective envelope. Therefore, regardless of the specific angular momentum transport mechanism operating in stars, in red giants ascending the RGB we expect that the rate of spindown should decrease past the luminosity bump, and depart from the relation observed by Mosser et al. (2012b).
While such a change in the exponent could give further clues into the currently debated extra mixing mechanism that operate past the luminosity bump, it is unlikely to be observed, as g-dominated modes are predicted to become unobservable as stars move up along the RGB, due to a combination of increasing inertia and increasing damping in the core (Dupret et al., 2009). For a and 1 year of observations g-dominated mixed modes have been predicted to be detectable only for stars with Hz and Hz (Grosjean et al., 2014).
4.2. Clump stars
After reaching the tip of the RGB, stars with ignite He in their degenerate core. This leads to a large release of energy, called the He-flash, which during a period of about 2 Myr lifts the degeneracy of the core leading to a stable He-burning phase. Such a transition phase has a unique asteroseismic signature (Bildsten et al., 2012).
In our models during the He-flash the rotational period of the core increases quite rapidly by a factor of about 10. This is because the nuclear energy released results in core expansion. In our model the core expands by approximately a factor of 3 during the He-flash, with core moment of inertia increasing by a factor of 10 from to (See also Kawaler & Hostler, 2005), fully accounting for the spin down observed in the models (See Fig. 5). Even if the timescale of the He-flash is too short for angular momentum transport outside the core, we note that the convective episodes that accompany the He flash can potentially play an important role in the redistribution of angular momentum inside the He-core. Such rapid mixing episodes can change the rotational profile of the g-mode cavity, as they lead to a fairly rigidly rotating radiative region above core He-burning. Therefore the expectation is that, regardless of previous history of angular momentum transport, the core of clump stars that underwent ignition of He in a degenerate core should be nearly rigidly-rotating.
After this rapid initial phase, the core rotation rate remains fairly constant during core He burning. The clump stars in the Mosser et al. (2012b) sample rotate with periods in the range d. Isolated pulsating sdB stars (red giants stripped of their envelope) show similar rotation rates, with periods ranging from 23 to 88 d (See e.g. Baran et al., 2012). Similar to the case of the early RGB, these values are about 1 order of magnitude slower than models which include magnetic torques, again pointing toward the need for some extra angular momentum transport occurring in previous evolutionary phases. Note that models including an artificial diffusivity able to reproduce the observed splitting on the early RGB () fail to explain the rotation rates of clump stars, with predicted rotation rates almost two orders of magnitude higher than the observations. This is because the torque required to couple core and envelope increases as the star rapidly climbs the RGB. We note that a combination of an artificial viscosity with the Tayler-Spruit magnetic torques can reproduce both the early RGB and the clump observations.
4.3. White Dwarf Rotation Rates
After core He burning the energy generation proceeds in two shells (burning H and He) moving outwards in mass coordinate while the star moves up the asymptotic giant branch (AGB). The He-shell becomes secularly unstable, giving rise to thermal pulses (TP-AGB). These pulses grow in intensity and are thought to enhance mass loss, ultimately leading to a complete removal of the H-envelope, a planetary nebula and the transition to the white dwarf cooling sequence. The details are not well understood and the transition time from the AGB to the WD cooling sequence depends on the treatment of mass-loss beyond the AGB. Note however that the timescale for angular momentum transport between core and envelope is likely much longer than the range of timescales discussed for the duration of this phase, so that the results on the angular momentum content of WD models should not depend strongly on the particular treatment of this phase. This is supported by the fact that the observed WD rotation rates can be recovered from the observed core rotation of clump stars assuming no angular momentum transport (see dotted line in Fig. 5). It is true that this is only achieved assuming clump rotation rates on the high end of the observed distribution; however one has to be careful as the mass range of the observed clump stars does not necessarily match the mass range of the progenitors of the WD with observed rotation rates.
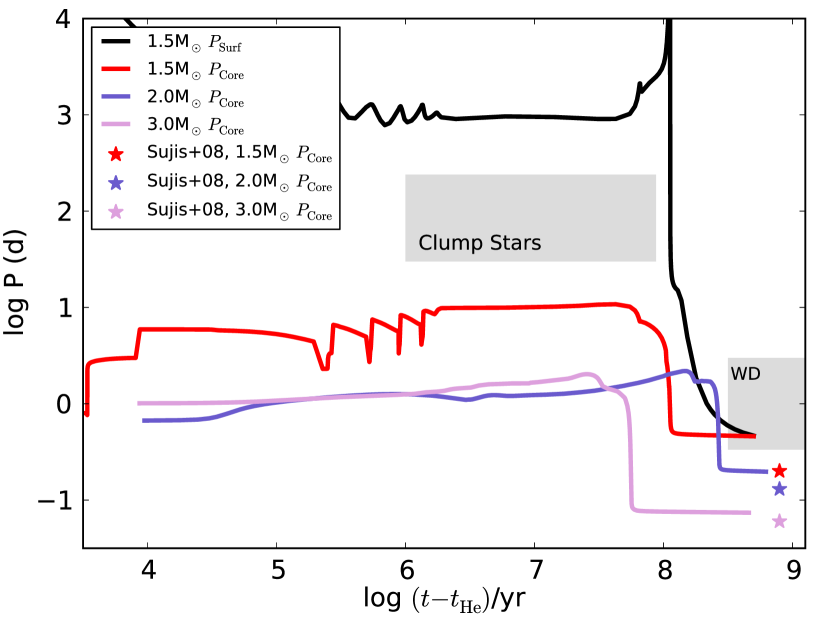
In our calculations during the TP-AGB phase we adopt the mass loss prescription of Bloecker (1995) multiplied by an efficiency factor . Results for the final rotation rate of WD as predicted by our models including magnetic torques are shown in Fig. 6. We note that, while they fail to explain the rotation rates in previous evolutionary phases (RGB and clump), these models can marginally reproduce values deduced from the asteroseismic observations of ZZ Ceti stars (pulsating WDs). This is consistent with the findings of Suijs et al. (2008), even if their final rotation rates seem to be slightly higher than the one found by the MESA calculations (which are in better agreement with the observations).
5. Conclusions and future work
We found that stellar evolution calculations of low-mass stars, including angular momentum transport from rotational instabilities, rotationally induced circulations and magnetic torques from Tayler-Spruit dynamo fields, can not explain the observed core rotation of early red giants and clump stars. The physics of internal angular momentum transport in stars is still not understood. The asteroseismic observations imply cores that are rotating at least 10 times slower than the predicted values. This is in much better agreement than the result of models only including angular momentum transport by rotational instabilities and circulations, which predict cores rotating more than times faster than the observed values. By considering the later stages of stellar evolution, we identify the RGB as the evolutionary phase where some extra angular momentum transport mechanism is efficiently coupling the core to the stellar envelope. Potential candidates for such mechanism are internal gravity waves and fossil (or convective dynamo-generated) magnetic fields.
Ensemble asteroseismology is providing outstanding results regarding the internal rotation of low-mass stars. It is important, however, to keep in mind that only a fraction of the stars analyzed for seismology have identifiable mixed modes and rotational splittings (in the case of Mosser et al., 2012b, for example, 313 out of 1399 stars, i.e. 22%). If the core rotates rapidly rotational multiplets are highly complex (Ouazzani et al., 2013); this could in principle have led to a bias toward stars with slower rotating cores (e.g. stars that did spin down due to binary interactions or because of a fossil magnetic field). We believe these potential biases need to be carefully addressed as they could have important repercussion on the theoretical interpretations.
Nevertheless it is interesting to consider what angular momentum transport mechanisms could be responsible for the strong coupling implied by the asteroseismic observations. One candidate are gravity waves excited by the convective envelope during the RGB, as these can potentially lead to some transport of angular momentum. While a similar process has been discussed in the context of the Sun’s rotational profile (Zahn et al., 1997; Charbonnel & Talon, 2005), more work needs to be done to understand the details of the excitation and propagation of gravity waves (See e.g. Lecoanet & Quataert, 2013; Shiode et al., 2013; Rogers et al., 2013)
Another possibility is that some large scale magnetic field is present in and above the stellar core at the end of the main sequence, providing some coupling between core and envelope. This magnetic field could be either of fossil origin (similar to what has been discussed in the context of explaining the internal rotation profile of the Sun) or be generated by a convective dynamo in the H-burning core during the main sequence. Dynamo action is favorable as, given the typical rotational velocities of 1.5-3.0 stars during the main sequence, Rossby numbers are usually smaller than 1, implying an -dynamo could be at work in the core. The equipartition magnetic field is ; assuming the resulting magnetic stress is and the associated diffusivity is , where is the shear. Typical convective velocities in the core of main-sequence, low-mass stars are on the order resulting in . Some of the magnetic flux will diffuse in the radiative layers above the convective core, but this is expected to affect only a small fraction of the star as the Ohmic diffusion timescale is much longer than the main sequence timescale. Overall assessing whether such a mechanism can explain the observed rotation rates requires following the coupled evolution of shear and magnetic fields.
We thank the anonymous referee for their comments and suggestions, which contributed to improve this paper. We thanks Conny Aerts, Steve Kawaler, Sterl Phinney, Marc Pinsonneault, Eliot Quataert, Dennis Stello, Rich Townsend and Jim Fuller for helpful discussions. We are grateful to Benoît Mosser for sharing his data. This project was supported by NASA under TCAN grant number NNX14AB53G and the NSF under grants PHY 11-25915 and AST 11-09174. Funding for the Stellar Astrophysics Centre is provided by The Danish National Research Foundation (Grant DNRF106). The research is supported by the ASTERISK project (ASTERoseismic Investigations with SONG and Kepler) funded by the European Research Council (Grant agreement no.: 267864).
The inlist adopted to calculate the models in this paper can be found at https://authorea.com/1608/ (bottom of the document).
References
- Aerts et al. (2010) Aerts, C., Christensen-Dalsgaard, J., & Kurtz, D. W. 2010, Asteroseismology (Springer)
- Asplund et al. (2005) Asplund, M., Grevesse, N., & Sauval, A. J. 2005, in Astronomical Society of the Pacific Conference Series, Vol. 336, Cosmic Abundances as Records of Stellar Evolution and Nucleosynthesis, ed. T. G. Barnes, III & F. N. Bash, 25
- Baran et al. (2012) Baran, A. S., Reed, M. D., Stello, D., et al. 2012, MNRAS, 424, 2686
- Beck et al. (2011) Beck, P. G., Bedding, T. R., Mosser, B., et al. 2011, Science, 332, 205
- Beck et al. (2012) Beck, P. G., Montalban, J., Kallinger, T., et al. 2012, Nature, 481, 55
- Beck et al. (2014) Beck, P. G., Hambleton, K., Vos, J., et al. 2014, A&A, 564, A36
- Bildsten et al. (2012) Bildsten, L., Paxton, B., Moore, K., & Macias, P. J. 2012, ApJ, 744, L6
- Bloecker (1995) Bloecker, T. 1995, A&A, 297, 727
- Braithwaite (2006) Braithwaite, J. 2006, A&A, 449, 451
- Brown et al. (2013) Brown, J. M., Garaud, P., & Stellmach, S. 2013, ApJ, 768, 34
- Cantiello & Langer (2010) Cantiello, M., & Langer, N. 2010, A&A, 521, A9
- Ceillier et al. (2013) Ceillier, T., Eggenberger, P., García, R. A., & Mathis, S. 2013, A&A, 555, A54
- Charbonnel & Talon (2005) Charbonnel, C., & Talon, S. 2005, Science, 309, 2189
- Charbonnel & Zahn (2007) Charbonnel, C., & Zahn, J.-P. 2007, A&A, 467, L15
- Christensen-Dalsgaard (2008) Christensen-Dalsgaard, J. 2008, Ap&SS, 316, 113
- Córsico et al. (2011) Córsico, A. H., Althaus, L. G., Kawaler, S. D., et al. 2011, MNRAS, 418, 2519
- Deheuvels et al. (2012) Deheuvels, S., García, R. A., Chaplin, W. J., et al. 2012, ApJ, 756, 19
- Deheuvels et al. (2014) Deheuvels, S., Doğan, G., Goupil, M. J., et al. 2014, A&A, 564, A27
- Denissenkov & Merryfield (2011) Denissenkov, P. A., & Merryfield, W. J. 2011, ApJ, 727, L8
- Denissenkov et al. (2010) Denissenkov, P. A., Pinsonneault, M., Terndrup, D. M., & Newsham, G. 2010, ApJ, 716, 1269
- Dupret et al. (2009) Dupret, M.-A., Belkacem, K., Samadi, R., et al. 2009, A&A, 506, 57
- Eggenberger et al. (2005) Eggenberger, P., Maeder, A., & Meynet, G. 2005, A&A, 440, L9
- Eggenberger et al. (2012) Eggenberger, P., Montalbán, J., & Miglio, A. 2012, A&A, 544, L4
- Ferrario & Wickramasinghe (2005) Ferrario, L., & Wickramasinghe, D. T. 2005, MNRAS, 356, 615
- Gough & McIntyre (1998) Gough, D. O., & McIntyre, M. E. 1998, Nature, 394, 755
- Gratton et al. (2000) Gratton, R. G., Sneden, C., Carretta, E., & Bragaglia, A. 2000, A&A, 354, 169
- Greiss et al. (2014) Greiss, S., Gänsicke, B. T., Hermes, J. J., et al. 2014, MNRAS, 438, 3086
- Grosjean et al. (2014) Grosjean, M., Dupret, M.-A., Belkacem, K., Montalbán, J., & Samadi, R. 2014, in IAU Symposium, Vol. 301, IAU Symposium, ed. J. A. Guzik, W. J. Chaplin, G. Handler, & A. Pigulski, 341–344
- Heger et al. (2000) Heger, A., Langer, N., & Woosley, S. E. 2000, ApJ, 528, 368
- Heger et al. (2005) Heger, A., Woosley, S. E., & Spruit, H. C. 2005, ApJ, 626, 350
- Henyey et al. (1965) Henyey, L., Vardya, M. S., & Bodenheimer, P. 1965, ApJ, 142, 841
- Iglesias & Rogers (1993) Iglesias, C. A., & Rogers, F. J. 1993, ApJ, 412, 752
- Iglesias & Rogers (1996) —. 1996, ApJ, 464, 943
- Kawaler & Hostler (2005) Kawaler, S. D., & Hostler, S. R. 2005, ApJ, 621, 432
- Koester et al. (1998) Koester, D., Dreizler, S., Weidemann, V., & Allard, N. F. 1998, A&A, 338, 612
- Langer et al. (1985) Langer, N., El Eid, M. F., & Fricke, K. J. 1985, A&A, 145, 179
- Langer et al. (1983) Langer, N., Fricke, K. J., & Sugimoto, D. 1983, A&A, 126, 207
- Lecoanet & Quataert (2013) Lecoanet, D., & Quataert, E. 2013, MNRAS, 430, 2363
- Maeder & Meynet (2000) Maeder, A., & Meynet, G. 2000, ARA&A, 38, 143
- Marques et al. (2013) Marques, J. P., Goupil, M. J., Lebreton, Y., et al. 2013, A&A, 549, A74
- Mosser et al. (2012a) Mosser, B., Goupil, M. J., Belkacem, K., et al. 2012a, A&A, 540, A143
- Mosser et al. (2012b) —. 2012b, A&A, 548, A10
- Nielsen et al. (2013) Nielsen, M. B., Gizon, L., Schunker, H., & Karoff, C. 2013, A&A, 557, L10
- Nordhaus et al. (2008) Nordhaus, J., Busso, M., Wasserburg, G. J., Blackman, E. G., & Palmerini, S. 2008, ApJ, 684, L29
- Ouazzani et al. (2013) Ouazzani, R.-M., Goupil, M. J., Dupret, M.-A., & Marques, J. P. 2013, A&A, 554, A80
- Palacios et al. (2006) Palacios, A., Charbonnel, C., Talon, S., & Siess, L. 2006, A&A, 453, 261
- Paxton et al. (2011) Paxton, B., Bildsten, L., Dotter, A., et al. 2011, ApJS, 192, 3
- Paxton et al. (2013) Paxton, B., Cantiello, M., Arras, P., et al. 2013, ApJS, 208, 4
- Petrovic et al. (2005) Petrovic, J., Langer, N., Yoon, S.-C., & Heger, A. 2005, A&A, 435, 247
- Rogers et al. (2013) Rogers, T. M., Lin, D. N. C., McElwaine, J. N., & Lau, H. H. B. 2013, ApJ, 772, 21
- Shiode et al. (2013) Shiode, J. H., Quataert, E., Cantiello, M., & Bildsten, L. 2013, MNRAS, 430, 1736
- Spada et al. (2010) Spada, F., Lanzafame, A. C., & Lanza, A. F. 2010, MNRAS, 404, 641
- Spruit (1999) Spruit, H. C. 1999, A&A, 349, 189
- Spruit (2002) —. 2002, A&A, 381, 923
- Suijs et al. (2008) Suijs, M. P. L., Langer, N., Poelarends, A.-J., et al. 2008, A&A, 481, L87
- Tayar & Pinsonneault (2013) Tayar, J., & Pinsonneault, M. H. 2013, ApJ, 775, L1
- Traxler et al. (2011) Traxler, A., Garaud, P., & Stellmach, S. 2011, ApJ, 728, L29
- Zahn et al. (2007) Zahn, J.-P., Brun, A. S., & Mathis, S. 2007, A&A, 474, 145
- Zahn et al. (1997) Zahn, J.-P., Talon, S., & Matias, J. 1997, A&A, 322, 320