11email: jolindbe@gmail.com 22institutetext: Niels Bohr Institute, University of Copenhagen, Juliane Maries Vej 30, DK-2100 Copenhagen Ø, Denmark 33institutetext: Department of Astronomy, University of Michigan, 500 Church Street, Ann Arbor, MI 48109-1042, USA 44institutetext: Leiden Observatory, Leiden University, P.O. Box 9513, NL-2300 RA Leiden, The Netherlands 55institutetext: SRON Netherlands Institute for Space Research, P.O. Box 800, NL-9700 AV, Groningen, The Netherlands 66institutetext: Department of Physics, The University of Tokyo, 7-3-1 Hongo, Bunkyo-ku, Tokyo, 113-0033, Japan
ALMA observations of the kinematics and chemistry of disc formation
Abstract
Context. The R CrA cloud hosts a handful of Class 0/I low-mass young stellar objects. The chemistry and physics at scales AU in this cloud are dominated by the irradiation from the nearby Herbig Be star R CrA. The luminous large-scale emission makes it necessary to use high-resolution spectral imaging to study the chemistry and dynamics of the inner envelopes and discs of the protostars.
Aims. We aim to better understand the structure of the inner regions of these protostars and, in particular, the interplay between the chemistry and the presence of discs.
Methods. Using Atacama Large Millimeter/submillimeter Array (ALMA) high-resolution spectral imaging interferometry observations, we study the molecular line and dust continuum emission at submillimetre wavelengths.
Results. We detect dust continuum emission from four circumstellar discs around Class 0/I objects within the R CrA cloud. Towards IRS7B we detect C17O emission showing a rotation curve consistent with a Keplerian disc with a well-defined edge that gives a good estimate for the disc radius at 50 AU. We derive the central object mass to and the disc mass to . The observations are also consistent with a model of material infalling under conservation of angular momentum; however, this model provides a worse fit to the data. We also report a likely detection of faint CH3OH emission towards this point source, as well as more luminous CH3OH emission in an outflow orthogonal to the major axis of the C17O emission.
Conclusions. The faint CH3OH emission seen towards IRS7B can be explained by a flat density profile of the inner envelope caused by the disc with a radius AU. We propose that the regions of the envelopes where complex organic molecules are present in Class 0/I young stellar objects can become quenched as the disc grows.
Key Words.:
stars: formation – ISM: individual objects: R CrA IRS7B – ISM: molecules – astrochemistry – protoplanetary discs1 Introduction
The earliest deeply embedded protostellar stages (Class 0 and I) represent an important period in the formation of solar-type stars and their discs. In particular, the physical and chemical evolution during these few hundred thousand years may represent the initial conditions for solar system formation – and serve as the link between the environment in which the stars form and the outcome in terms of the protoplanetary discs and their composition. With the high resolution and sensitivity offered by the Atacama Large Millimeter/submillimeter Array (ALMA) it is becoming possible to routinely image the innermost regions of such systems and thus shed light on the distribution of gas and dust there. In this paper, we present ALMA Early Science (Cycle 0) observations of deeply embedded protostars in the Corona Australis region – in particular, those representing a deep search for the presence of complex organic molecules and imaging of the dynamics in the innermost regions around these sources.
One of the big unanswered questions about the formation of circumstellar discs is exactly when those first appear during the evolution of young stars. Previous continuum surveys point to the existence of compact and dense regions of dust above the centrally condensed envelopes around even very deeply embedded Class 0 protostars (e.g., Harvey et al., 2003; Looney et al., 2003; Jørgensen et al., 2004, 2009; Enoch et al., 2011), but the kinematics and thus the exact nature of these components remain unclear: are they a representation of the earliest Keplerian discs, do they instead represent earlier magnetic pseudo-discs or are they another consequence of the protostellar core collapse? Recent observations of one deeply embedded Class 0 protostar, L1527 (Tobin et al., 2012b), as well as some Class I young stars (e.g., Brinch et al. 2007; Brinch & Jørgensen 2013; Lommen et al. 2008; Jørgensen et al. 2009; Harsono et al. 2014) show evidence of Keplerian motions on AU scales, but in general it remains challenging to disentangle these components from the collapsing envelope (see, e.g., Tobin et al., 2012a).
The exact physical nature of the innermost regions of protostellar envelopes is strongly related to the chemistry of these regions. One of the very exciting discoveries over the last decade has been the detection of complex organic molecules in the warm ( K) innermost regions of some deeply embedded protostars (sometimes referred to as “hot cores” or “hot corinos”; see, e.g., Bottinelli et al., 2004; Jørgensen et al., 2005; Ceccarelli et al., 2007; Herbst & van Dishoeck, 2009) where the increase in temperature is thought to enhance grain mantle evaporation – but any more quantitative interpretation of these observations is strongly coupled to the understanding of the envelope on these scales ( AU). It also remains a question whether such warm regions with complex organics are present only in selected sources (possibly an indication of a particular physical and chemical evolution of those) or whether the absence of complex organic molecules from single-dish observations in some sources rather could be a consequence of lack of sensitivity and/or unfavourable physics. For example, if discs form early in the evolution of protostars, they may dominate the mass budget in the innermost regions of low-mass protostellar envelopes and only a small fraction of the material there may have high enough temperatures for water and complex organics to be in the gas phase in significant amounts to allow them to be detectable.
We present ALMA observations of four young stellar objects (YSOs) in the R CrA cloud (NGC 6729) within the Corona Australis star-forming region, one of the nearest star-forming regions, at a distance of 130 pc (Neuhäuser & Forbrich, 2008). Peterson et al. (2011) found 116 YSO candidates in the Corona Australis star-forming region by multi-wavelength photometry analysis, the vast majority being Class II or older, whereas the highest concentration of Class I or younger YSOs was found in the R CrA cloud. This cloud has its name from the Herbig Be star R CrA, which irradiates the protostellar envelopes, increasing the temperature of the molecular gas to K on large ( AU) scales (van Kempen et al., 2009; Lindberg & Jørgensen, 2012).
IRS7B is a low-mass () YSO in the R CrA cloud located ″ (6000 AU) southeast of the star R CrA. Through infrared photometry, it was determined to be Class I or younger by Peterson et al. (2011). Through Herschel far-infrared observations its bolometric temperature and ratio can be established. The bolometric temperature is 89 K, and the bolometric/submillimetre luminosity ratio is 48, which put it as a borderline Class 0/I source (Lindberg et al., 2014). To understand the physical stage of this source, other methods are required.
The remaining three YSOs covered by our ALMA observations – CXO 34, IRS7A, and SMM 1C – are also situated within the R CrA cloud. These are all defined as Class I or younger by Peterson et al. (2011). The two sources IRS7A and SMM 1C cannot be spatially resolved by Herschel PACS observations. Their combined spectral energy distribution (SED) corresponds, like in the case of IRS7B, to borderline Class 0/I sources. For a summary of previous (sub)millimetre observations of the region, refer to Sect. 1 of Lindberg & Jørgensen (2012).
Sect. 2 presents the methods of observations and data reduction. Sect. 3 shows the observed spectra and continuum and spectral line maps. In Sect. 4 we study the kinematics of the molecular gas around IRS7B and describe the radiative transfer modelling of CH3OH emission from IRS7B. Sect. 5 discusses the implications of the results and Sect. 6 summarises the conclusions of our study.
2 Observations
R CrA IRS7B was observed on 4, 6, and 9 May 2012 in ALMA band 7 as part of ALMA Cycle 0 observations. The total integration time of the observations was 5.5 hours. During the observations, 18 antennas were part of the array, positioned in an extended configuration with baselines of 30–380 m (34–).
The complex gains were calibrated using the quasar J1924-292 located 10° from R CrA IRS7B, which was observed every 15 minutes. The bandpass calibration was performed using the same quasar. The quasar flux was calibrated with observations of Neptune and Titan.
The observations were performed in four spectral windows simultaneously (see Table 1 for details), each with 3840 channels with channel widths of 122 kHz ( km s-1). The typical rms in line-free channels is 9–10 mJy beam-1 channel-1. A few hundred channels at some of the spectral window edges were flagged due to considerable noise. The line-free channels were used to record the continuum emission. The continuum data were self-calibrated to reduce side-lobes and increase the signal-to-noise ratio.
The spectral line data were cleaned using Högbom PSFs in the minor cycles and Briggs weighting with a robustness parameter of 0.5 to acquire a balance between signal-to-noise and resolution performance. This resulted in a synthesised beam size of approximately ().
| ID | Frequency rangea𝑎aa𝑎aFor emission at km s-1. The IRS7B km s-1 corresponds to frequencies MHz higher. | rmsb𝑏bb𝑏bTypical rms per beam per channel around lines in this spectral window. | Channel width | |
|---|---|---|---|---|
| [GHz] | [mJy] | [kHz] | [km s-1] | |
| 0 | 336.955–337.425 | 9 | 122 | 0.109 |
| 1 | 338.276–338.721 | 9 | 122 | 0.108 |
| 2 | 349.344–349.814 | 10 | 122 | 0.105 |
| 3 | 346.921–347.354 | 10 | 122 | 0.105 |
3 Results
3.1 Continuum emission
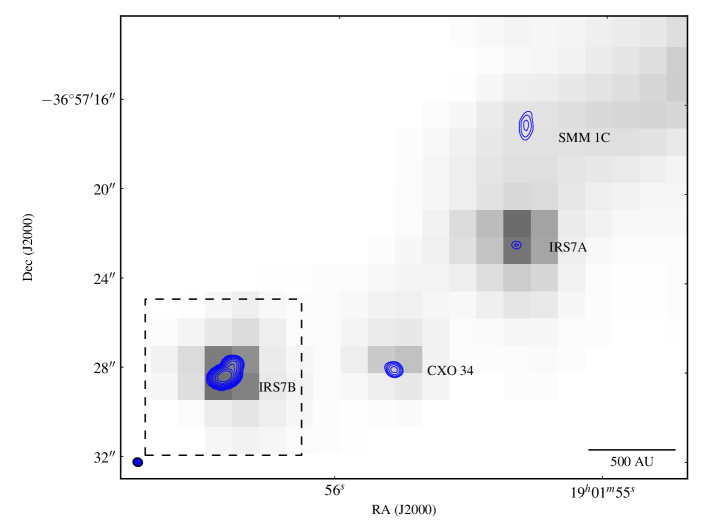
In the continuum emission, four point sources were identified. It was possible to match two of these with previous 1.3 mm SMA detections (IRS7B and SMM 1C). The remaining two sources (CXO34 and IRS7A), as well as IRS7B, are well-aligned with previously detected Spitzer 4.5 µm point sources. Measured coordinates of the detected point sources are shown in Table 2 along with fitted continuum fluxes and derived disc masses. A continuum map can be found in Fig. 1.
| Name | RA | Dec | Fluxa𝑎aa𝑎aPrimary-beam-corrected flux from a 2-D gaussian fit to the cleaned continuum image. The error reflects the accuracy in the gaussian fit, not the significance of the detection. | b𝑏bb𝑏bDisc masses calculated using the method of Jørgensen et al. (2007), which assumes optically thin emission and a dust temperature of 30 K. |
|---|---|---|---|---|
| (J2000.0) | (J2000.0) | [mJy] | [] | |
| IRS7B | 19:01:56.42 | 36:57:28.4 | 0.024 | |
| CXO 34 | 19:01:55.78 | 36:57:27.9 | 0.003 | |
| IRS7A | 19:01:55.33 | 36:57:22.4 | 0.002 | |
| SMM 1C | 19:01:55.31 | 36:57:17.0 | 0.013 |
3.2 Spectral line emission
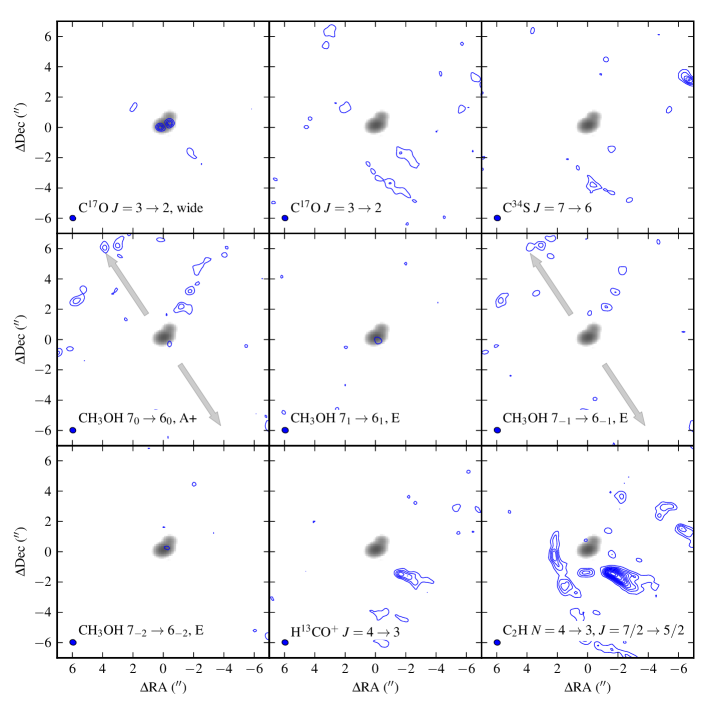
Spectral lines from five different molecular species (C17O, C34S, CH3OH, H13CO+, and C2H) were detected in the ALMA data. The details of the detected transitions are shown in Table 3. We will focus primarily on the spectra of IRS7B, the source at the phase centre of the observations (observed spectra towards this source are shown in Fig. 2). Moment 0 maps of all detected lines in the region around IRS7B can be found in Fig. 3.
Several of the molecular lines are detected as dips in the spectra at the systemic velocity towards IRS7B. This is indicative of extended emission being resolved out in the interferometric observations. This is consistent with the extended CH3OH and H2CO emission found by Lindberg & Jørgensen (2012), and also Herschel observations of CO, OH, and H2O (Lindberg et al., 2014). Single-dish observations of the region performed with the ASTE telescope show very strong CH3OH emission (Watanabe et al., 2012), with a peak flux density at Jy for the , E line. In the ALMA data, the flux density of this line spatially integrated over the ALMA primary beam is Jy, which shows that a few percent of the single-dish flux is recovered in the ALMA observations.
The major part of the CH3OH emission is seen as a pattern of stripes and blobs in a NE/SW direction from IRS7B, which most likely are traces of an extended outflow resolved out in the interferometric data. In particular, this is seen in the lowest-energy CH3OH transition , E. This is consistent with a CH3OH outflow seen in SEST data of the , E and , A+ transitions at 96.7 GHz (Miettinen et al., in prep.), extending northeast from IRS7B on scales of ′. It is also consistent with the SMA/APEX observations of the CH3OH , E line at 218 GHz, where strong extended emission was found towards SMM 1A south of IRS7B, but no significant emission was found towards the point sources in the field (Lindberg & Jørgensen, 2012). Faint C17O emission is also seen along roughly the same axis (see Fig. 4), and the outflow direction is also consistent with recent observations of bipolar radio jets by Liu et al. (2014). Faint on-source line emission consistent with four CH3OH spectral lines is detected towards IRS7B. The significance of the four detections are between and , which makes this a likely on-source detection of CH3OH.
No complex organic molecules other than CH3OH (including CH3OCH3 and CH3CN that have known lines at 347.225 GHz and 349.454 GHz, respectively) were detected. The SiO transition at 347.331 GHz is also not detected.
| Species | Transition | Frequencya𝑎aa𝑎aFrom the CDMS database (Müller et al., 2001). | a𝑎aa𝑎aFrom the CDMS database (Müller et al., 2001). |
|---|---|---|---|
| [GHz] | [K] | ||
| C17O | 337.06112 | 32.353 | |
| C34S | 337.39646 | 50.231 | |
| CH3OH | , E | 338.34463 | 70.550 |
| CH3OH | , A+ | 338.40868 | 64.981 |
| CH3OH | , E | 338.61500 | 86.051 |
| CH3OH | , E | 338.72163 | 87.258 |
| CH3OH | , E | 338.72294 | 90.912 |
| H13CO+ | 346.99834 | 41.634 | |
| C2H | b𝑏bb𝑏b | 349.39927 | 41.927 |
| C2H | c𝑐cc𝑐c | 349.40067 | 41.928 |
4 Analysis
4.1 A Keplerian disc around IRS7B
In the C17O data we find strong point-like emission around IRS7B with a large velocity span. The moment 0 (integrated intensity) and moment 1 (velocity) maps of this line are overplotted in Fig. 4. Through the CASA task uvmodelfit444http://casa.nrao.edu/docs/taskref/uvmodelfit-task.html we identify the strongest peak of the C17O emission in each channel of the data. By the method of Goodman et al. (1993), which uses a weighted least-square fit to the positional data to establish the inclination of the velocity gradient on the plane of sky, we construct a position-velocity diagram (PV diagram) of the C17O emission, shown in Figs. 5–7. We find that the motion has a position angle of ° on the sky and is centred around the channel corresponding to an LSR velocity of 6.2 km s-1. The velocities in the PV diagram are given relative to this central velocity.


The data in the PV diagram (Fig. 6) are consistent with a simple flat disc model with Keplerian rotation. The data can be separated into two parts; one part that lies beyond km s-1 which is roughly distributed like a profile and one part within km s-1 which roughly follows a linear distribution. These two parts have been coloured blue and green, respectively, in Figs. 5–7. Shown with black crosses in Fig. 6 is a simple fiducial disc model for which the C17O line emission has been calculated under the assumption of LTE using the LIME code (Brinch & Hogerheijde, 2010). The model data points have been extracted directly from the simulated image. The physical structure of the disc is unimportant as long as the emission is optically thin, because we are only interested in the kinematic signature. The central mass and the disc radius are the only free parameters. In the model, the disc is assumed to be flat with a radial density profile and a temperature profile .
The split in the distribution of the data points into these two parts is what is expected for a Keplerian disc with a finite radius as can be seen from simple considerations of an optically thin line emission: the line-of-sight velocity in a Keplerian disc seen edge-on at a projected distance of and at a depth (see Fig. 8) can be written as
| (1) |
The flux in a given velocity channel at a given projected distance is then
| (2) |
where the emission factor is proportional to the flux from a unit volume, and for a given projected distance is the line-of-sight distance at which the disc will have a projected velocity of :
| (3) |
We assume that the disc is optically thin, in which case , and that with . In this case, for projected velocities above the Keplerian velocity at the edge of the disc, the maximum flux is along a radial line in the plane of the sky giving rise to the branches (blue lines in Figs. 5–7). For projected velocities below the Keplerian velocity at the edge of the disc, the maximum flux is at the edge of the disc. If the disc radius is then along the edge of the disc, giving a linear slope in the PV diagram (green lines in Figs. 5–7). For a disc that is not edge-on, but at an inclination, the usual geometric projection factors have to be applied.
The disc edge falls exactly where the two parts join (marked by the two dotted lines in Fig. 6), and by fitting a Keplerian profile (blue curve) and a straight line (green curve) to the data we can determine the disc radius very accurately. We find the radius of the spatially well-constrained disc to be 0.41′′ which equals to 50 AU at the distance of IRS7B. The best-fit Keplerian profile corresponds to a central mass of assuming the most probable inclination of .
Note that future, higher quality, data probing the detailed shape of the low velocity branches (green lines in Figs. 6 and 8) may potentially give direct information on , i.e. the thermal energy profile of the disc. Specifically, depending on the exact value of , below a critical velocity in the PV diagram, the maximum flux will be close to the centre instead of at the edge of the disc. The transition point depends directly on .
We also explored to what extent the data in the PV diagram can be described by the emission that is expected from material falling in under angular momentum conservation (; Yen et al. 2011; Belloche 2013). We do a fit to the velocities as a function of radius weighted by the uvmodelfit errors on the positional fits. The fits are made for a combination of a profile for the lower velocities in both fits, and for the Keplerian fit and for the infall fit. The free parameters are the disc size and the central mass. We find that the two fits have similar values (the Keplerian fit has a value a factor 2.3 times lower than the infall fit), and thus neither fit can be completely ruled out. However, since the profile arises from the edge of the disc, this is an unlikely effect in the infall scenario, since the infalling material should not have a sharp edge, as observed. In Figs. 5 and 7, the Keplerian fit is shown with solid lines and the infall fit with dashed lines. In the right panel of Fig. 7, the residuals of the high-velocity data points are compared for the two models. It can be seen that the Keplerian model gives a better fit, in particular for the lower velocities, but the model with infall under conservation of angular momentum cannot be excluded, if the well-defined edge is disregarded. These relatively simple models provide good fits to the data, but because of the high sensitivity of the data, they may still contain traces of features which are not explained by these models.
Assuming that the continuum emission originates in a disc, we can estimate the mass of the disc around IRS7B from the ALMA continuum emission using the method of Jørgensen et al. (2007) assuming optically thin emission and a dust temperature of 30 K (see Table 2). The peak flux of the 0.8 mm continuum emission is 432 mJy, which corresponds to a disc mass of , or 1.0% of the central source in the Keplerian disc (), and 1.1% of the envelope mass (; see below). This is relatively low compared to the disc/star mass ratio in Class I objects and disc/envelope mass ratios in Class 0 and Class I objects (Jørgensen et al., 2009).
Considering the small angular size of the three remaining point sources SMM 1C, CXO 34, and IRS7A, the continuum emission at these positions is most likely dust emission from discs. Except for faint CH3OH emission at the position of IRS7A, no molecular emission is detected towards these point sources, which makes it impossible to study their kinematics. However, they are situated on the edge of or beyond the primary beam of the observations, so the non-detections of molecular line emission in these sources are not significant.
4.2 CH3OH modelling
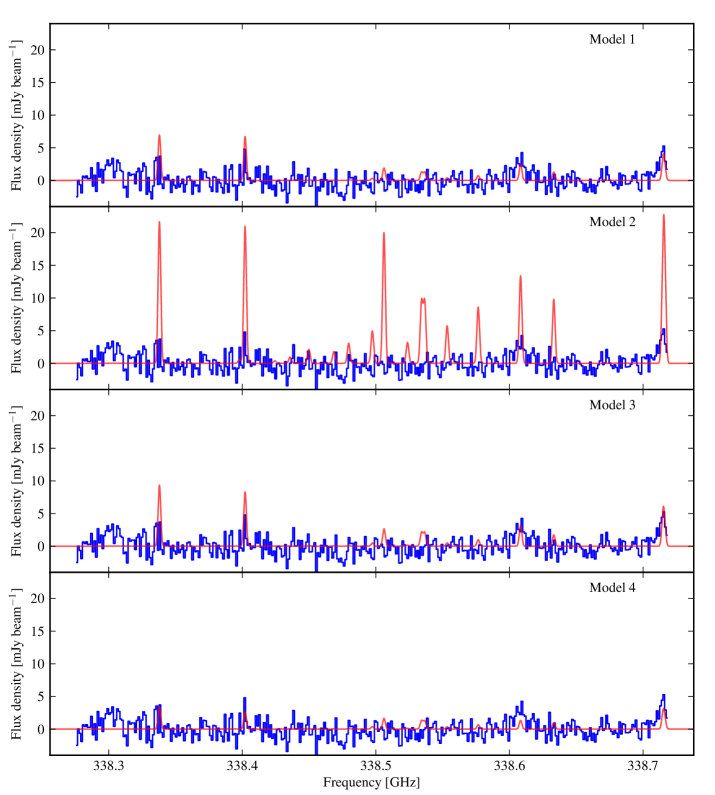
The CH3OH emission in a box around IRS7B was modelled using the radiative transfer modelling tool RATRAN (Hogerheijde & van der Tak, 2000). CH3OH collision rates from the LAMDA database were used (Schöier et al., 2005; Rabli & Flower, 2010). The level population files produced after convergence of each model were examined, and with the exception of some of the highest levels ( K; with fractional populations ), the level populations as function of radius were found to be continuous and well-behaved. All the model spectra are shown together with the observed CH3OH spectrum in Fig. 9, and the parameters used in each model are summarised in Table 4.
| Model # | a𝑎aa𝑎aDensity profile at AU. The density profiles at AU follow in all models. profile | b𝑏bb𝑏bCH3OH abundance profile in the hot inner envelope, (where K). | c𝑐cc𝑐cCH3OH abundance profile at (where K). |
|---|---|---|---|
| 1 | |||
| 2 | |||
| 3 | = constant | ||
| 4 | = constant |
The envelope model of Lindberg & Jørgensen (2012) was adopted. In this model the density profile follows an power law with a mass of . The temperature in the envelope is governed by heating from the central object on small scales ( AU), but by the external irradiation from R CrA on large scales ( AU). In Model 1, a constant CH3OH abundance was assumed. The best fit was achieved for a CH3OH abundance of , which is much lower than expected in a source with a hot inner envelope. However, IRS7B is one of the youngest sources exhibiting X-ray emission (Hamaguchi et al., 2005), which possibly could be responsible for the destruction of CH3OH. The external irradiation from R CrA could also be responsible for a chemistry with less complex organic molecules through the early evaporation of CO from the icy grain mantles (Lindberg & Jørgensen, 2012).
In the remaining models we assumed a jump abundance of CH3OH as proposed by Schöier et al. (2002); Jørgensen et al. (2005); Maret et al. (2005). This model is used since the evaporation of CH3OH from grains is enhanced by at least two orders of magnitudes at the ice sublimation temperature K (Herbst & van Dishoeck, 2009, and references therein). The jump in the abundance profile is thus introduced at the radius of the hot inner envelope, AU, inside which K. This radius is fairly insensitive to modifications of the envelope model and central luminosity – if the density profile power law is changed from to , or if the central luminosity is changed by 20%, only changes by a few AU. With an inner CH3OH abundance of and an outer CH3OH abundance of , the model CH3OH line fluxes are much stronger than in the observed data.
To account for the disc detected in the C17O, we assume a flat density profile at where AU is the assumed centrifugal radius. The density profile at AU and the shape of the abundance profile were kept as in Model 2 (power law density profile with a jump abundance). With the inner CH3OH abundance set to and the outer to (Model 3), the observed fluxes are reproduced to a first-order approximation. Another model with the outer abundance lowered to (Model 4) is also tested, but it produces fluxes that are only somewhat weaker than in the observations, meaning that the CH3OH emission in these models is dominated by the compact component. Thus, Models 3 and 4 provide equally good fits to the data.
All models overestimate the non-detected CH3OH lines at 338.51 GHz and 338.53 GHz. The small change in these line strengths between Models 3 and 4 show that these lines are tracing the inner envelope with just a small contribution from material at larger scales. The inner CH3OH abundance of these models () should thus be seen as an upper limit.
The faint on-source CH3OH emission either puts a constraint on the CH3OH abundance in the inner envelope to be as low as , or requires that the envelope has a flattened density profile at AU. This contrasts to earlier single-dish studies of several other Class 0/I sources (Jørgensen et al., 2005; Maret et al., 2005), for which radiative transfer models showed CH3OH abundances – in the innermost K regions – and is at least two orders of magnitude lower than the values or upper limits for all sources in the sample of Maret et al. (2005).
5 Discussion
Lindberg & Jørgensen (2012) suggested that the high level of irradiation from R CrA onto IRS7B would have a considerable effect on the chemistry in the envelope due to premature evaporation of CO and CH4 from the dust grains. Irradiation from R CrA in an early stage of the IRS7B core would prevent complex organic molecules and carbon-chain molecules to form on the dust grains. This together with photo-dissociation of H2O, HCN, and other molecules would produce a chemistry dominated by PDR (photo-dissociation region) tracers such as OH and CN, and no sign of either hot inner envelope (“hot corino”; Ceccarelli 2005) chemistry or warm carbon-chain chemistry (WCCC; Sakai et al., 2009a, b), in agreement with single-dish line-survey observations (Watanabe et al., 2012, Lindberg et al., in prep.) and Herschel PACS spectrometer observations (Lindberg et al., 2014).
However, H2CO (Lindberg & Jørgensen, 2012) and CH3OH emission is predominantly found on large scales in the protostellar envelope. Only very faint CH3OH emission is found directly towards the IRS7B continuum source position in the ALMA data.
The C17O data indicate the presence of a disc with a radius on 50 AU scales, which could be responsible for a flattened density profile or an inner edge of the envelope at – AU, which is supported by the faint CH3OH lines towards the continuum source and the results of the modelling of the CH3OH line observations.
Assuming an optically thin envelope heated only by a central source, the dust temperature distribution in the envelope follows
| (4) |
where relates to the power-law index of the dust-opacity law as (Jørgensen et al. 2006 and references therein). As in the previous section, we define the radius of the hot inner envelope, , as the radius within which the temperature exceeds 100 K, allowing for the evaporation of CH3OH and other complex organic molecules from the grains. Using Eq. 4, we find that
| (5) |
independently of the value of . If is dominated by accretion (), it scales linearly with , and
| (6) |
The size of the disc is on the other hand characterised by the centrifugal radius (Terebey et al., 1984), at which the rotational support gets greater than the gas pressure support due to the increase in angular momentum:
| (7) |
The hot inner envelope may be larger than the disc at early times. However, as its size follows compared to the disc size , the chemistry on small scales will at later times be dominated by the disc.
IRS7B shows relatively low CH3OH abundances and non-detections of other complex organic molecules, but also a disc at the same or slightly larger scales as the hot inner envelope would be expected to be present at. We propose that it has entered the stage where the disc dominates the physical and chemical structure at small radii.
6 Conclusions
We have performed high-resolution spectral line and continuum observations of four low-mass Class 0/I protostars in the R CrA cloud using the ALMA interferometer. The observations show the structure of the molecular gas and the dust emission at resolutions – AU. Our most important findings are:
-
1.
The C17O emission around the Class 0/I protostar R CrA IRS7B is indicative of a Keplerian disc in C17O emission, consistent with a disc mass and a central source mass . The combined mass of the disc and star is thus similar to the mass of the envelope (; Lindberg & Jørgensen 2012), which implies a source at a very young stage. The radius of the disc can be accurately determined to 50 AU. A scenario where the observed C17O emission rises from material falling in under conservation of angular momentum can, however, not be excluded, but seems unlikely due to the well-defined edge of the disc which is observed.
-
2.
Outflow-like structures are detected around IRS7B on large ( AU) scales in CH3OH emission and on smaller ( AU) scales in faint C17O emission, roughly perpendicular to the C17O disc emission.
-
3.
CH3OH emission is found on large scales ( AU) in the ALMA data, but is only marginally detected on the IRS7B continuum point source itself. The observed CH3OH spectral line intensities at IRS7B are consistent with radiative transfer models assuming an envelope with a flat density profile inside 100 AU and CH3OH abundances of in the hot inner envelope (where K) and substantially lower outside this region.
-
4.
We propose that the chemistry of IRS7B on small scales is dominated by the presence of the disc – which is more extended than the region of the envelope where the temperature is greater than 100 K. The presence of discs around typical Class I young stars may cause these sources not to show significant emission from complex organic molecules characteristic of such hot inner envelopes.
To verify that the C17O emission on IRS7B originates in a Keplerian disc, higher-sensitivity and higher-resolution observations are needed. Such observations would also be useful to investigate whether complex organic molecules are present at all in IRS7B on the scales of a hot inner envelope ( AU).
Acknowledgements.
The authors would like to thank Iván Martí-Vidal and Wouter Vlemmings at the Nordic ALMA Regional Centre node at Onsala Space Observatory for support with the calibration and data reduction. This paper makes use of the following ALMA data: ADS/JAO.ALMA#2011.0.00628.S. ALMA is a partnership of ESO (representing its member states), NSF (USA) and NINS (Japan), together with NRC (Canada) and NSC and ASIAA (Taiwan), in cooperation with the Republic of Chile. The Joint ALMA Observatory is operated by ESO, AUI/NRAO and NAOJ. Research at Centre for Star and Planet Formation is funded by the Danish National Research Foundation and the University of Copenhagen’s programme of excellence. This research was also supported by a Lundbeck Foundation Group Leader Fellowship to JKJ. TH is supported by a Sapere Aude Starting Grant from The Danish Council for Independent Research. DH is supported by the Netherlands Research School for Astronomy (NOVA) and by the Space Research Organization Netherlands (SRON). MVP acknowledges EU FP7 grant 291141 CHEMPLAN.References
- Belloche (2013) Belloche, A. 2013, in EAS Publications Series, Vol. 62, Role and Mechanisms of Angular Momentum Transport During the Formation and Early Evolution of Stars, ed. P. Hennebelle & C. Charbonnel (Cambridge University Press, Cambridge, UK), 25–66, arXiv:1311.7657
- Bottinelli et al. (2004) Bottinelli, S., Ceccarelli, C., Neri, R., et al. 2004, ApJ, 617, L69
- Brinch et al. (2007) Brinch, C., Crapsi, A., Jørgensen, J. K., Hogerheijde, M. R., & Hill, T. 2007, A&A, 475, 915
- Brinch & Hogerheijde (2010) Brinch, C. & Hogerheijde, M. R. 2010, A&A, 523, A25
- Brinch & Jørgensen (2013) Brinch, C. & Jørgensen, J. K. 2013, A&A, 559, A82
- Ceccarelli (2005) Ceccarelli, C. 2005, in IAU Symposium, Vol. 231, Astrochemistry: Recent Successes and Current Challenges, ed. D. C. Lis, G. A. Blake, & E. Herbst (Cambridge University Press, Cambridge, UK), 1–16
- Ceccarelli et al. (2007) Ceccarelli, C., Caselli, P., Herbst, E., Tielens, A. G. G. M., & Caux, E. 2007, Protostars and Planets V, 47
- Enoch et al. (2011) Enoch, M. L., Corder, S., Duchêne, G., et al. 2011, ApJS, 195, 21
- Goodman et al. (1993) Goodman, A. A., Benson, P. J., Fuller, G. A., & Myers, P. C. 1993, ApJ, 406, 528
- Hamaguchi et al. (2005) Hamaguchi, K., Corcoran, M. F., Petre, R., et al. 2005, ApJ, 623, 291
- Harsono et al. (2014) Harsono, D., Jørgensen, J. K., van Dishoeck, E. F., et al. 2014, A&A, 562, A77
- Harvey et al. (2003) Harvey, D. W. A., Wilner, D. J., Myers, P. C., & Tafalla, M. 2003, ApJ, 596, 383
- Herbst & van Dishoeck (2009) Herbst, E. & van Dishoeck, E. F. 2009, ARA&A, 47, 427
- Hogerheijde & van der Tak (2000) Hogerheijde, M. R. & van der Tak, F. F. S. 2000, A&A, 362, 697
- Jørgensen et al. (2007) Jørgensen, J. K., Bourke, T. L., Myers, P. C., et al. 2007, ApJ, 659, 479
- Jørgensen et al. (2005) Jørgensen, J. K., Bourke, T. L., Myers, P. C., et al. 2005, ApJ, 632, 973
- Jørgensen et al. (2004) Jørgensen, J. K., Hogerheijde, M. R., van Dishoeck, E. F., Blake, G. A., & Schöier, F. L. 2004, A&A, 413, 993
- Jørgensen et al. (2006) Jørgensen, J. K., Johnstone, D., van Dishoeck, E. F., & Doty, S. D. 2006, A&A, 449, 609
- Jørgensen et al. (2009) Jørgensen, J. K., van Dishoeck, E. F., Visser, R., et al. 2009, A&A, 507, 861
- Lindberg & Jørgensen (2012) Lindberg, J. E. & Jørgensen, J. K. 2012, A&A, 548, A24
- Lindberg et al. (2014) Lindberg, J. E., Jørgensen, J. K., Green, J. D., et al. 2014, A&A, 565, A29
- Liu et al. (2014) Liu, H. B., Galván-Madrid, R., Forbrich, J., et al. 2014, ApJ, 780, 155
- Lommen et al. (2008) Lommen, D., Jørgensen, J. K., van Dishoeck, E. F., & Crapsi, A. 2008, A&A, 481, 141
- Looney et al. (2003) Looney, L. W., Mundy, L. G., & Welch, W. J. 2003, ApJ, 592, 255
- Maret et al. (2005) Maret, S., Ceccarelli, C., Tielens, A. G. G. M., et al. 2005, A&A, 442, 527
- Müller et al. (2001) Müller, H. S. P., Thorwirth, S., Roth, D. A., & Winnewisser, G. 2001, A&A, 370, L49
- Neuhäuser & Forbrich (2008) Neuhäuser, R. & Forbrich, J. 2008, in Handbook of Star Forming Regions, Volume II: The Southern Sky, ed. Reipurth, B. (ASP Monographs, San Francisco, CA), 735, arXiv:0808.3374
- Peterson et al. (2011) Peterson, D. E., Caratti o Garatti, A., Bourke, T. L., et al. 2011, ApJS, 194, 43
- Rabli & Flower (2010) Rabli, D. & Flower, D. R. 2010, MNRAS, 406, 95
- Sakai et al. (2009a) Sakai, N., Sakai, T., Hirota, T., Burton, M., & Yamamoto, S. 2009a, ApJ, 697, 769
- Sakai et al. (2009b) Sakai, N., Sakai, T., Hirota, T., & Yamamoto, S. 2009b, ApJ, 702, 1025
- Schöier et al. (2002) Schöier, F. L., Jørgensen, J. K., van Dishoeck, E. F., & Blake, G. A. 2002, A&A, 390, 1001
- Schöier et al. (2005) Schöier, F. L., van der Tak, F. F. S., van Dishoeck, E. F., & Black, J. H. 2005, A&A, 432, 369
- Terebey et al. (1984) Terebey, S., Shu, F. H., & Cassen, P. 1984, ApJ, 286, 529
- Tobin et al. (2012a) Tobin, J. J., Hartmann, L., Bergin, E., et al. 2012a, ApJ, 748, 16
- Tobin et al. (2012b) Tobin, J. J., Hartmann, L., Chiang, H.-F., et al. 2012b, Nature, 492, 83
- van Kempen et al. (2009) van Kempen, T. A., van Dishoeck, E. F., Güsten, R., et al. 2009, A&A, 507, 1425
- Watanabe et al. (2012) Watanabe, Y., Sakai, N., Lindberg, J. E., et al. 2012, ApJ, 745, 126
- Yen et al. (2011) Yen, H.-W., Takakuwa, S., & Ohashi, N. 2011, ApJ, 742, 57