Superconductivity-induced Phonon Renormalization on NaFe1-xCoxAs
Abstract
We report a study of the lattice dynamics in superconducting NaFeAs ( = 8 K) and doped NaFe0.97Co0.03As ( = 20 K) using Raman light scattering. Five of the six phonon modes expected from group theory are observed. In contrast with results obtained on iso-structural and iso-electronic LiFeAs, anomalous broadening of Eg(As) and A1g(Na) modes upon cooling is observed in both samples. In addition, in the Co-doped sample, a superconductivity-induced renormalization of the frequency and linewidth of the B1g(Fe) vibration is observed. This renormalization can not be understood within a single band and simple multi-band approaches. A theoretical model that includes the effects of SDW correlations along with sign-changing -wave pairing state and interband scattering has been developed to explain the observed behavior of the B1g(Fe) mode.
pacs:
74.70.Xa, 74.25.nd, 74.25.KcI Introduction
The discovery of superconductivity in LiFeAs Tapp_PRB2008 ; Wang_SSC2008 has triggered several debates in the field of iron-based superconductors research. Most of the iron-based superconductors known so far share similar properties, namely (i) a magnetic transition accompanying a structural transition in stoichiometric parent compounds, (ii) a strongly nested-Fermi surface that induces a SDW instability, and (iii) the appearance of superconductivity upon chemical doping or application of external pressure. Even though LiFeAs has a crystal and electronic structures very similar to those of other families of iron-based superconductors Tapp_PRB2008 ; Wang_SSC2008 ; Chu_PC2009 ; Li_PRB2009 , neither structural, nor magnetic phase transitions have been reported. Furthermore it becomes superconducting at = 18 K at ambient pressure and without any doping. Superconductivity with 10 K has also been found in isostructural and isoelectronic NaFeAs Chu_PC2009 ; Parker_CC2009 . However, contrary to LiFeAs, a structural - tetragonal to orthorhombic - phase transition occurs at 52 K Parker_PRL2010 ; Chen_PRL2009 in NaFeAs, which further orders magnetically below 41 K. Another difference between the two compounds is that unlike LiFeAs, where superconductivity is suppressed upon chemical doping Pitcher_JACS2010 , the superconducting transition temperature in NaFeAs is enhanced when substituting Ni or Co to Fe Parker_PRL2010 ; Tanatar_PRB2012 ; Spyrison_PRB2012 . With such properties, NaFeAs is a promising candidate to bridge the gap between LiFeAs and other families of iron-based superconductors.
There is now a consensus that Fe-based superconductors are non-conventional superconductors, in which the electron-phonon interaction plays only a minor role Boeri_PRL2008 . Several experimental studies of the phonon spectra in these compounds have however shown significant deviations from the results of standard density function theory (DFT) calculations LeTacon_PRB2008 ; Reznik_PRB2009 ; LeTacon_PRB2009 ; Fukuda_JPSJ2008 ; Fukuda_PRB2011 ; Mittal_PRL2009 ; Hahn_PRB2009 ; Delaire_PRB2010 ; LeTacon_JPCS2011 , which can only be explained including explicitly magnetism (even in the absence of long-range order) in the lattice dynamical calculation. In relation to this, it has been shown that the magnetic interaction could enhance the electron-phonon coupling Yildirim_PhysicaC2009 ; Boeri_PRB2010 ; Li_JAP2012 ; Garcia_PRB2013 ; Yndurain_EPL2011 . Experimental manifestations of the electron-phonon coupling in Fe-based compounds remain however marginal, and with only a few exceptions Choi_JPCM2010 ; Litvinchuk_PRB2011 , no phonon anomalies are seen across the superconducting transition with infra-red Hu_PhysicaC2009 ; Dai_ChinesePhysicsB2012 or Raman Litvinchuk_PRB2008 ; Rahlenbeck_PRB2009 ; Um_PRB2012_FTS ; Um_PRB2012_LFA ; Chauviere_PRB2009 spectroscopies (whereas rather large anomalies are seen across the magneto-structural transitions Choi_PRB2008 ; Gnezdilov_PRB2011 ; Akrap_PRB2009 ; Chauviere_PRB2009 ; Rahlenbeck_PRB2009 ; Charnukha_PRB2013 ).
In this paper, we focus on the phonons at the zone center, and report an experimental study of the lattice dynamics in NaFe1-xCoxAs (x = 0, 0.03) single crystals using Raman scattering. We have observed five of the six phonon modes expected from group theory and found several unusual features. This includes the anomalous broadening of Eg(As) and A1g(Na) modes at low temperature, and a superconductivity-induced renormalization of the B1g(Fe) mode in the Co-doped compound that can not be understood within a single band and simple multiband approaches. We show that it can be accounted for in a theoretical framework that explicitly includes a sign-changing order parameter as well as interband scattering in presence of SDW correlations.
II Experimental Details
Single crystals of parent NaFeAs ( = 8 K) and optimally doped NaFe0.97Co0.03 ( = 20 K) were grown by the Bridgman method Song_APL2010 ; Park_PRB2012 . Na lump and Fe1-xCoxAs precursor were mixed with appropriate stoichiometric ratio. The Fe1-xCoxAs precursor was synthesized by reacting Fe and As pieces at 1050 ∘C for five days. Then, in a second step, all the required ingredients were weighed and mixed in the glove box filled with He gas and put into a molybdenum crucible. The crucible was sealed through arc welding under Ar-gas atmosphere. Large and shiny crystals of 5 5 5 mm3 or more were grown at 1450 ∘C. The -axis lattice parameter was measured using x-ray diffraction (not shown here) and estimated to 7.062Å and 7.045Å for NaFeAs and NaFe0.97Co0.03, respectively, in good agreement with a previous report Parker_PRL2010 .
Prior to the Raman measurements, the air sensitive NaFe1-xCoxAs single crystals were cleaved and mounted on the cold finger of a helium-flow cryostat in a glove box under Ar atmosphere. Raman spectra have been measured in backscattering geometry and recorded with a JobinYvon LabRam 1800 single grating spectrometer equipped with a razor-edge filter and a Peltier-cooled CCD camera. We used the = 632.817 nm line of a He+/Ne+ mixed gas laser for excitation. The laser beam was linearly polarized and focused through a 50 microscope objective to a 5 m diameter spot with less than 1 mW power on the sample surface to avoid laser-induced heating. In order to determine the precise frequency of phonons for each temperature, Neon emission lines were recorded between the measurements. For the data analysis, all phonon peaks were fitted by Lorentzian profiles, convoluted with the spectrometer resolution function (a gaussian line of 2 cm-1 full width at half maximum (FWHM)).
III Experimental Results
III.1 Mode Assignment in parent NaFeAs
NaFeAs crystallizes in the () space group, with the Na, Fe and As atoms located at the 2c, 2b and 2c Wyckoff positions, respectively. From group symmetry analysis, 15 zone center optical phonons are expected, among which 2A1g, 1 B1g and 3Eg modes are Raman active Rousseau_JRS1981 .
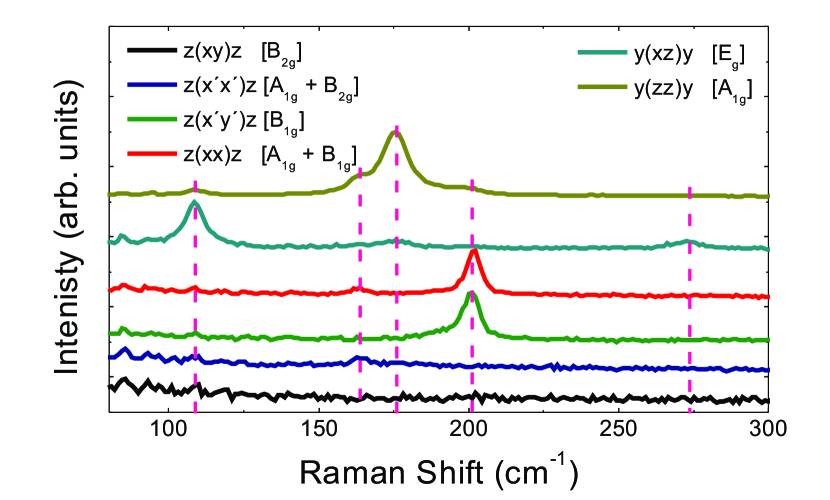
In Fig. 1, we report Raman spectra measured on parent NaFeAs at room temperature for several scattering geometries, with incident light wave vectors along the c-axis [in Porto notations: (that selects excitations with symmetry), (B1g), (A1g + B2g), (A1g + B1g)] or along the b-axis [ (A1g) and (Eg) configurations].
The assignment of the modes is similar to that of LiFeAs reported in ref. Um_PRB2012_LFA, . The two modes at 163 cm-1 and 213 cm-1 in configuration can be assigned to c-axis polarized A1g(As) and B1g(Fe) vibrations of the FeAs planes. The intense phonon at 178 cm-1 in the configuration is considerably suppressed in the configuration, and this phonon can therefore be assigned to the second A1g mode.
These modes frequencies are in good agreement with those calculated within density functional theory in refs. Jishi_ACMP2010, ; Deng_PRB2009, , listed in Table. 1.
The two remaining modes at 113 cm-1 and 281 cm-1 seen experimentally in the configuration are attributed to Eg modes. Comparison with the theoretical estimates allows one to assess the former to the Eg(As). The energy of the second mode, however, is significantly larger than the ones calculated for the two remaining Eg(Fe) and Eg(Na) phonons. We tentatively assign it to the Eg(Fe) which has the closest energy. It is therefore likely that the Eg(Na) is not observed. Further experiments with different incident photon wavelengths might help to observe this mode.
| Mode | Polarization | Selection Rule | Calc. frequency (cm-1) | Exp. fitting parameters (cm-1) | ||||
| (atom) | from Ref. Jishi_ACMP2010, | from Ref. Deng_PRB2009, | ||||||
| Eg (As) | in-plane | 110 | 126 | 113 | 0.8 | |||
| A1g (As) | c-axis | , , | 176 | 174 | 163 | 0.1 | 1.9 | 1.0 |
| B1g (Fe) | c-axis | , | 218 | 227 | 213 | 2.7 | 0.3 | 0.9 |
| Eg (Fe) | in-plane | 241 | 256 | 281 | 3.8 | |||
| Eg (Na) | in-plane | 187 | 203 | |||||
| A1g (Na) | c-axis | , , | 199 | 198 | 178 | 0.9 | ||
III.2 Temperature & doping dependence of Phonon modes
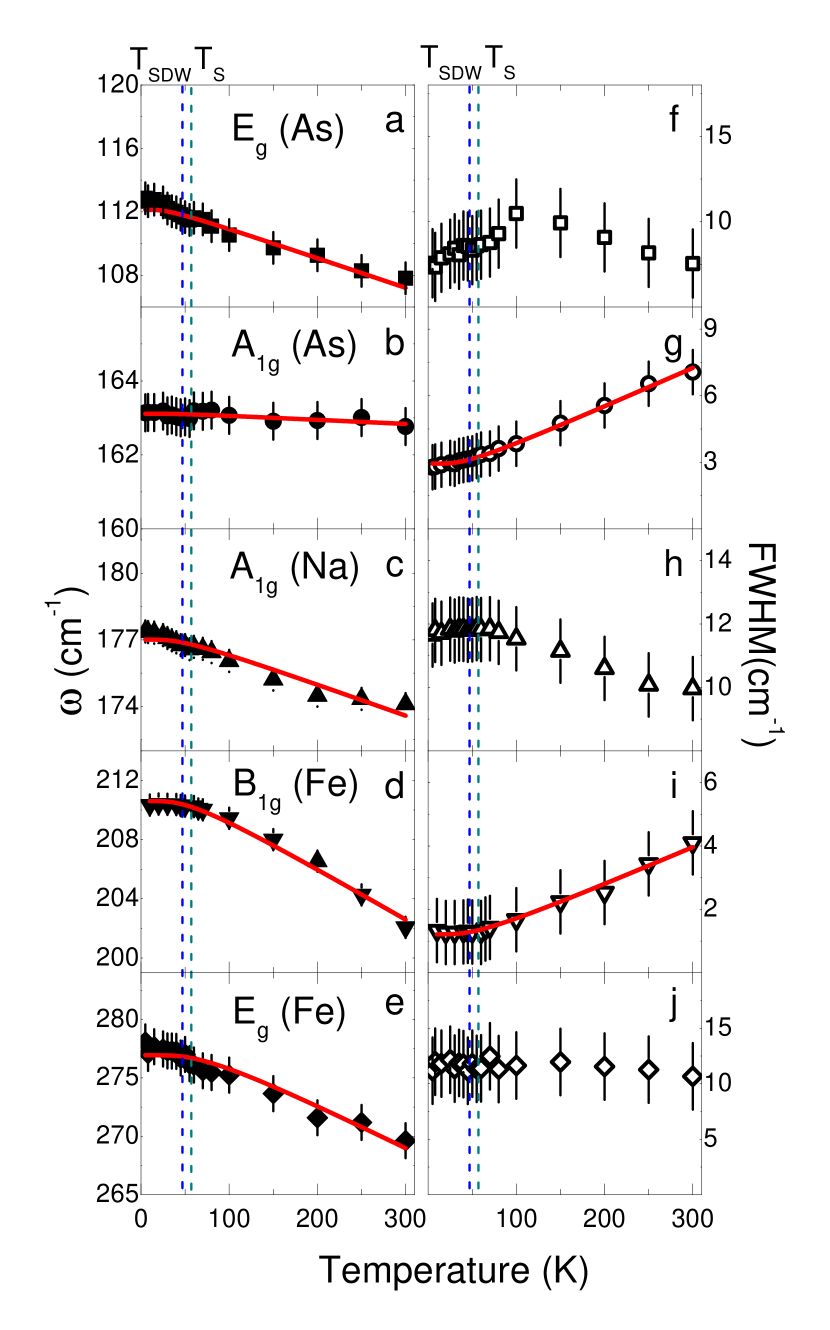
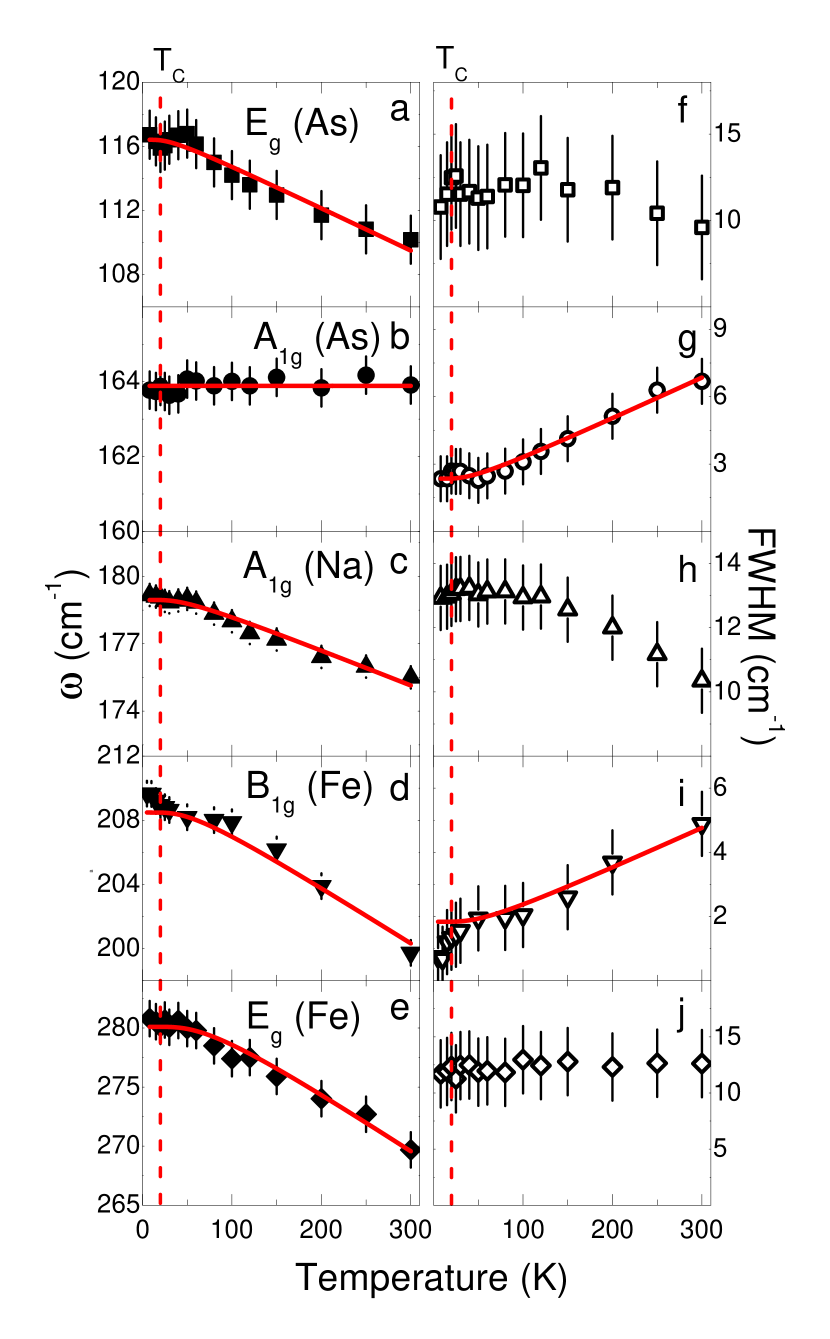
The Raman data have been collected between 5 K and room temperature. The temperature dependence of the frequencies and linewidths of the five phonons in NaFeAs and NaFe0.97Co0.03As are reported in Figs. 2 and 3, respectively. The general trend is a hardening and a narrowing of the modes upon cooling. Such a trend is expected in the absence of effects other than regular anharmonicity. The temperature dependence of frequencies and linewidths were fitted using a simple symmetric anharmonic phonon decay Klemmens_PR1966 ; Menendez_PRB1984 :
| (1) |
| (2) |
where and are positive constants, 0 is the bare phonon frequency, and 0 a residual (temperature independent) linewidth. The obtained fitting parameters are summarized in Table. 1. As shown on Fig. 2, this simple model could only reproduce the temperature dependence of the A1g(As) and B1g(Fe) of NaFeAs. Interestingly, these modes are not renormalized through the structural and magnetic transitions in sharp contrast with the observations made in the 122 compounds, where a clear narrowing of the A1g(As) and B1g(Fe) phonons has been reported Chauviere_PRB2009 ; Choi_PRB2008 ; Rahlenbeck_PRB2009 ; Choi_JPCM2010 . The linewidths of the A1g(As) and Eg(Fe) modes increases upon cooling (Figs. 2-h, and j). This is also the case for the Eg(As) mode (Figs. 2-f), however below 100 K, this trend is reversed and the linewidth starts to sharpen.
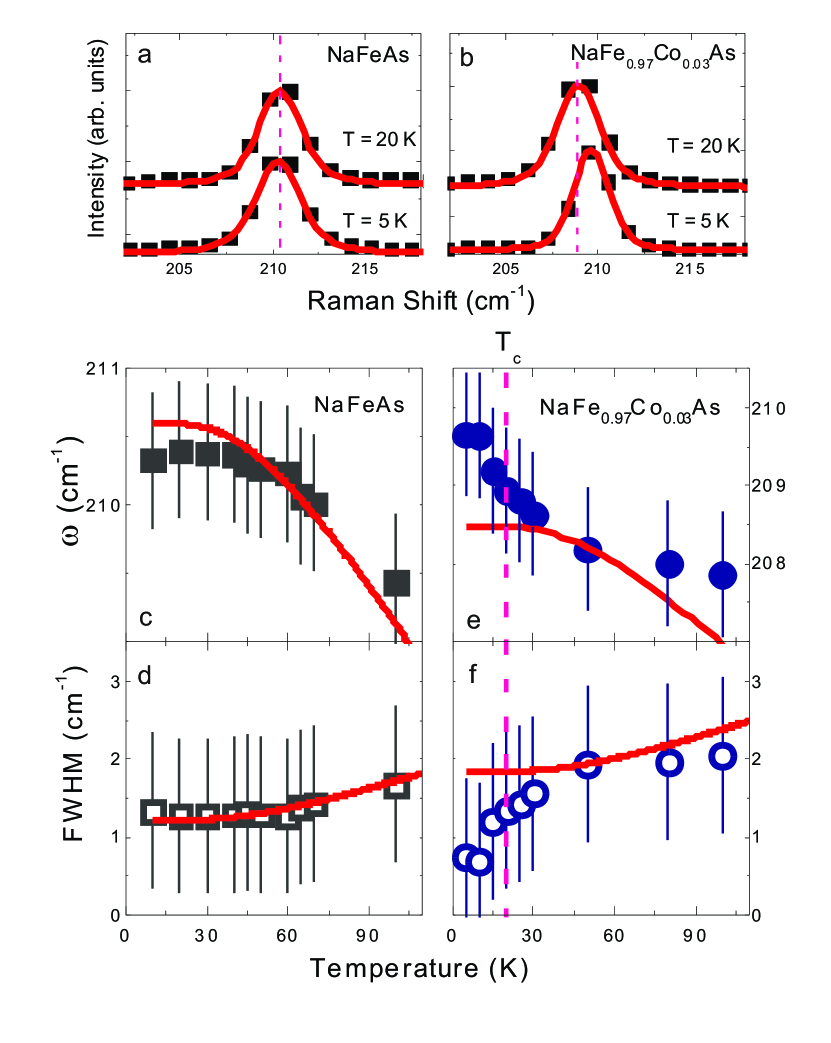
In the Co-doped compound, similar results are obtained on the linewidths (Figs. 3-f to j). In addition, a small, but clear (Fig. 4) superconductivity-induced renormalization of the B1g(Fe) phonon across the superconducting transition in NaFe0.97Co0.03As is observed. This renormalization consists in a hardening of about 1.5 cm-1 accompanied with a narrowing of similar amplitude of the mode lineshape. This behavior clearly departs from the expected anharmonic behavior extrapolated from the high temperature data.
Beyond this effect on the B1g mode, that will be discussed in details later, the only noticeable differences with the parent compound are i) a significantly broader linewidth of the A1g(Na) mode at low temperature, and ii) a weaker narrowing of the Eg(As) below 100 K. Finally we note that all the modes, except the B1g(Fe), are harder in the doped compound than in the parent one, which can be quantitatively accounted for by the shrinking of the unit cell dimensions upon Co substitution Parker_PRL2010 .
IV Discussion
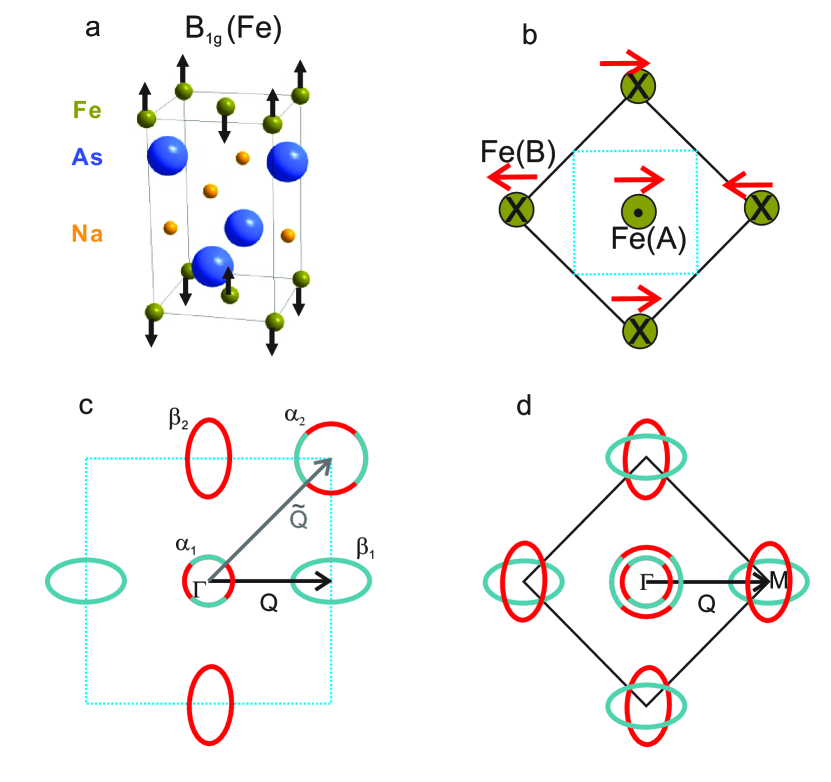
In previous phonon studies on iron pnictides, the narrowing of the phonon linewidth has been observed through the SDW transition Um_PRB2012_FTS ; Gnezdilov_PRB2011 ; Chauviere_PRB2009 ; Choi_PRB2008 ; Rahlenbeck_PRB2009 ; Choi_JPCM2010 . In those cases, the B1g(Fe) mode (that corresponds to the c-axis polarized vibration of planar Fe (Fig. 5-a)) and the A1g(As) (or A1g(Te) in the 11 compounds) modes are generally the most affected. This is understood as a consequence of a suppression of the electron-phonon coupling as the electronic density of states at the Fermi level decreases when the SDW gap opens. Splitting of the in-plane, doubly degenerate, Eg vibrations is also observed at the structural transition Chauviere_PRB2009 . The large amplitude of the latter effect is associated with strong magneto-elastic effects. Despite the similarity of the structural/magnetic phase transitions undergone by NaFeAs and 122 compounds at low temperature, none of these effects are seen here.
Instead, the B1g(Fe) and A1g(As) modes behave exactly like in LiFeAs Um_PRB2012_LFA , and display a continuous hardening and sharpening down to the lowest temperatures. The small residual linewidths of these modes indicate good sample homogeneity. This contrasts with the behavior of the three other modes, as shown in Fig. 2-f, h and j. The most interesting behavior is arguably the one of the Eg(As) mode at 110 cm-1 that broadens upon cooling and then sharpens below 100 K, a temperature larger than both TSDW (closure of the SDW gap at 40 K has recently been reported in the parent compound Zhou_PRL2012 ) and TS He_PRL2010 . We note that recently, electron nematicity above these transition temperatures has recently been reported in NaFeAs Rosenthal_NatPhys2014 . Further investigations are required to check whether these two phenomena are actually related.
The behavior of the A1g(Na) and of the Eg(Fe) modes, that broaden down to base temperature, is reminiscent of the one of the A1g(Te) polarized modes in parent Fe1+yTe compound Gnezdilov_PRB2011 ; Um_PRB2012_FTS . In these compounds, it has been argued that it originates from anharmonicity associated with the combined effect of spin-orbital frustration and large Fe magnetic moments Gnezdilov_PRB2011 . This doesn’t seem to be the case here since the magnetic moment in the ordered phase is rather modest ( 0.1 Li_PRB2009 ; Wright_PRB2012 ). Furthermore, the A1g(As) mode, that is in principle more sensitive to this effect since it modulates the Fe-As distance that controls magnetic order Yildirim_PhysicaC2009 , is not affected. The effect is also clearly present in both parent and doped compounds. This implies that it might been intrinsically related to the anharmonic potential experienced by Na atoms between the two FeAs layers rather than to the details of the electronic structure of these layers.
This is not the case for the B1g(Fe) phonon which undergoes a doping-dependent, superconductivity-induced renormalization that we will discuss in details in the following section.
V Theoretical Modeling for the B1g mode superconductivity-induced renormalization
Superconductivity induced phonon renormalizations are in principle directly related with the redistribution of the electronic states, and therefore of the electron-phonon coupling, as the superconducting gap opens. In most of the Fe-based superconductors, no specific changes were reported in the phonon frequencies and linewidths across Litvinchuk_PRB2008 ; Gallais_PRB2008 ; Rahlenbeck_PRB2009 ; Um_PRB2012_LFA , which has been attributed to the small superconducting gap amplitude 2 compared to the phonon frequencies. Interestingly, similar renormalizations (i.e. hardening + narrowing of comparable amplitudes) of the phonon across have been reported in Ba1-xKxFe2As2, Sr1-xKxFe2As2 Choi_JPCM2010 or PrxCa1-xFe2As2 Litvinchuk_PRB2011 . As pointed out by the authors of ref. Choi_JPCM2010, , in the conventional approach of the electron-phonon coupling, even considering the s±-wave symmetry of the superconducting gap, the narrowing of the phonon is puzzling since it would imply that 2 is unrealistically larger than the energy of the renormalized phonon energy (210 cm-1 26.4 meV). Recent estimations of 2 in optimally doped NaFe0.97Co0.03As range from 2 = 10.72 meV ( 86.5 cm-1) from specific heat Wang_PRB2012 , 2 = 11 meV ( 88 cm-1) from STM Zhou_PRL2012 , and 2 = 13.6 meV ( 109.7 cm-1) from ARPES Liu_PRB2011 and indeed confirm that the mode renormalization cannot be understood within the conventional framework. Choi et al. Choi_JPCM2010 also suggested that the two missing ingredients might be the effects of interband scattering and of the coexistence of superconductivity with SDW.
The physical idea behind the model calculation presented hereafter, is that interband scattering at =0 connects only the matrix element between orthogonal orbital states, leading to vanishing transition probability. The inclusion of the SDW order (or say long range correlations) opens new channels for =(,0) inter-band scattering, which connects the non-orthogonal orbital states, and therefore leads to finite transition probability, that renormalizes the phonon through the superconducting transition (in addition, a sign-changing () superconducting order parameter between hole and electron-pockets is required to get the correct signs in the renormalization).
In the case of NaFe0.97Co0.03As, no signature of static SDW have been reported, yet from the proximity with the SDW phase boundary, one can naturally expect the presence of sizeable SDW correlations that might play similar role at any frequency larger than the spin gap . Inelastic Neutron scattering measurements performed in compounds with close chemical composition Zhang_PRL2013 show that this gap in the spin excitation spectra is a couple of meV large, indicative of rather slow SDW fluctuations. Since this energy scale is in any event much smaller than the frequency of the B1g phonon we are interested in, we will treat the SDW order as static in the following.
V.1 Model details
First we notice that the Fe-Fe plane has no mirror symmetry above and below the plane. In analogy with the CuO2 planes in superconducting YBa2Cu3O6+x Devereaux1995 , this asymmetric environment results in a local electric field along the c-axis, . Then, the alternating displacements of the Fe atoms along the c-axis due to the B1g vibration (Fig. 5-a) lead to a spatial modulation of the energy of the -electrons which form the conduction bands and also the SDW order . Following ref. Devereaux1995 , we write the electron-phonon interaction for the B1g phonon as
| (3) | |||
where and stand for the alternating A- and B-sites of Fe-atoms (see Fig. 5-b), and stands for both the spin and orbital degrees of freedom. and indicate the displacement vectors of Fe(A) and Fe(B), respectively. For the B1g phonon, we assume and . The energy shift of the -orbitals couples to the charge density as well as to the amplitude of the SDW order . Therefore, in general we can assume two possible forms of the electron-phonon coupling in the compound as:
| (4) |
| (5) |
where and are the phonon annihilation and creation operators and with is the general spinor representation for the SDW order. is the short hand notation of the annihilation operator of the band electrons for all bands defined in folded BZ (the two-Fe cell BZ depicted in Fig. 5-d) and the spin index is omitted because the above form just duplicates for both spins.
Eq. 4 above describes the ordinary coupling of a phonon to the charge density. We, however, will argue below that this coupling term is very weak as far as the B1g phonon is concerned. The central idea is that the alternating displacement of the neighboring Fe-atoms in the B1g vibration depicted in Fig. 5-a and Fig. 5-b, requires to work in the folded BZ (Fig. 5-d) rather than in the non-folded one (Fig. 5-c). There, the density operator connects a large momentum scattering process with the exchange momenta in the one-Fe unit cell BZ (distinct from the SDW ordering vector, see Fig. 5-c).
This large vector becomes after the BZ folding for the two-Fe unit cell, hence the B1g phonon looks like coupling with an ordinary charge density of a small momenta modulation . However, in more microscopic model analysis, it is necessary to introduce at least two orbitals (full description needs five d-orbitals) degrees of freedom per Fe-site ( and orbitals) Hirschfeld_RPP2011 ; Raghu_PRB2008 ; Graser_NJP2009 to properly describe this folding process which backfolds of the one-Fe unit cell BZ into zone center of the two-Fe unit cell BZ.
In the minimal two orbital model, before folding there exist one hole band ( band) around and another hole band ( band) around , and one electron band ( band) around and one electron band ( band) around (Fig. 5-c).
The scattering process described above by the standard charge density coupling actually corresponds to interband scattering processes of and . Then it is easy to notice from the orbital contents ( and ) of the bands , and , that the scattering processes and are dominated by the inter-orbital scattering in terms of their orbital contents, namely . This coupling term to B1g phonon vanishes or becomes very weak, and therefore we will not consider the term any more.
On the other hand, Eq. 5 with connects the scattering processes of with the help of the SDW correlation. Notice that the scattering processes of is the scattering between the hole band and the electron bands and vice-versa. Also it is easy to find from the orbital content of the bands that these processes contain a large amplitude of the intra-orbital scattering processes such as and . The electron-phonon interaction Hamiltonian (Eq. 4) shows that only intra-orbital scattering processes will couple with the B1g phonon. Therefore, from now on we will consider the coupling term of Eq. 5 only.
Rewriting Eq. 5 in the minimal two band model of Fe-pnictide compounds, for example, for the model band shown in Fig. 5-c, we obtain:
| (6) |
where describes a hole band around point and describes an electron band around point (Fig. 5-d). Using the above coupling , it is straightforward to calculate the phonon self-energy and examine the change of the phonon frequency and its linewidth due to the change of the electronic excitations. Neglecting vertex corrections, the renormalization of optical phonons is determined by conventional Dyson equation:
| (7) |
with the bare phonon propagator , the electron-phonon coupling of Eq. 7 and the relevant polarizability given by:
| (8) | |||||
where the Green’s functions of the electron band and hole band are:
| (9) |
are the Pauli matrices, is the band dependent electronic dispersion and is the superconducting gap, that vanishes in the normal state. In our calculation, we assume that the compound has the typical sign-changing s-wave pairing state () and therefore each band has a constant s-wave gap but with opposite signs to each others as and .
The renormalization of the Raman phonon frequency (resp. linewidth) is obtained by calculating the difference between the real (resp. imaginary) part of the electronic polarizability in the superconducting and normal states: for .
The ordinary intraband polarizability (where or depending on the chosen band) in the superconducting state has the following standard coherence factor for the pair scattering process:
| (10) |
For interband scattering on the other hand, , since in our model the gap functions on each band have opposite sign, the coherence factor for the polarizability is:
| (11) | |||||
| (12) |
V.2 Results
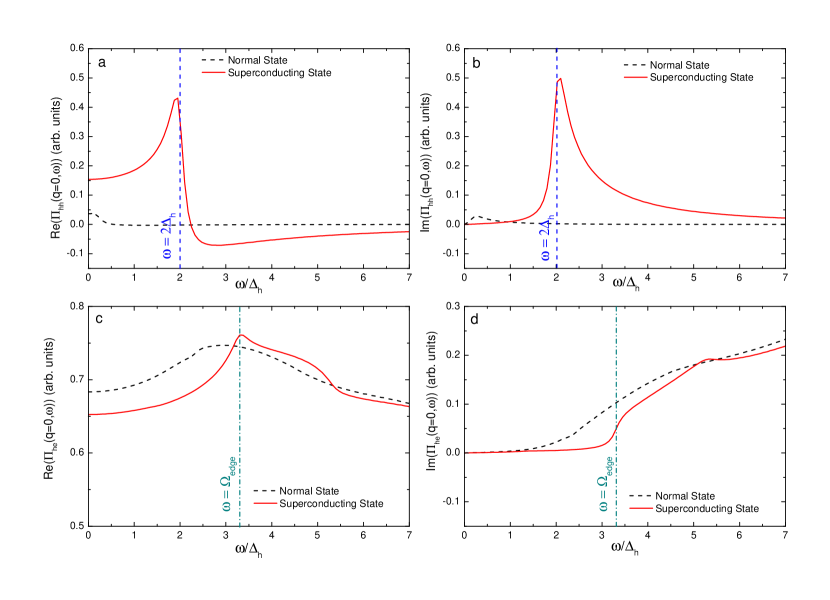
On Fig. 6, we show the results of the calculation at q=0 for the real and imaginary parts of and as a function of the Raman shift , in the normal and superconducting states.
The behavior of the phonon across the superconducting transition taking into account intra-band scattering only follows the conventional trend for a s-wave superconductor Zeyher_ZPB1990 that is:
(1) For , the real (resp. imaginary) part of is negative (resp. positive), corresponding to a hardening (resp. broadening)
of the phonon frequency (resp. linewidth).
(2) For , the real (resp. imaginary) part of is positive (resp. negative), corresponding to a softening (resp. sharpening) of the phonon frequency (resp. linewidth).
As pointed out earlier, this behavior contrasts with the observation of a hardening (resp. sharpening) of the B1g phonon frequency (resp. linewidth), despite the fact that we clearly have .
However, since the B1g phonon couples to the electrons only through Eq. 7, the relevant polarizability is the interband = one rather than . The results of the calculation for the real and imaginary parts of are shown in Figs. 6-c and -d. There is a wide region of frequencies where the real part of is negative, which corresponds to a hardening of the phonon frequency across the superconducting transition. Furthermore, in this region, the imaginary part of is also negative indicating a phonon sharpening.
The energy threshold below which this behavior occurs is not set anymore by the superconducting gap amplitudes, but by , where . This quantity vanishes only in the case of perfect nesting between the electron-band and the hole-one shifted by Q. Since generally this nesting is not perfect, is non-zero, and when large enough it allows . In this case, a hardening and narrowing of the B1g phonon such as the one experimentally observed in the Co-doped crystal, can be simultaneously obtained across the superconducting transition. We finally recall that the necessary conditions to obtain these results are both the SDW correlations (to allow non-vanishing interband scattering) and the sign-change of the superconducting gap between hole and electron-pockets.
VI Conclusion
In summary, a detailed Raman scattering study has been carried out on NaFe1-xCoxAs (x = 0, 0.03). The modes have been assigned and their temperature dependence studied. In the Co-doped compound, a non-standard renormalization of the Fe B1g(Fe) mode across the superconducting transition has been observed. This renormalization can not be understood within a single band and simple multiband approaches. We show that the additional inclusion of sufficiently strong SDW correlations, along with a sign-changing s-wave pairing state, can lead to the experimentally observed behavior.
Acknowledgements
We acknowledge Armin Schulz for technical help, Bernhard Keimer for support and reading of the manuscript, Hlynur Gretarsson and Michaela Souliou for critical reading of the paper, and the Leading Foreign Research Institute Recruitment Program (Grant No. 2012K1A4A3053565) through the National Research Foundation of Korea (NRF) funded by the Ministry of Education, Science and Technology (MEST). YB was supported by Grants No. NRF-2011-0017079 and No.2013-R1A1A2-057535 funded by the NRF of Korea. YSK was supported by the Basic Science Research Program (NRF-2013R1A1A2009778) and the Leading Foreign Research Institute Recruitment Program (Grant No. 2012K1A4A3053565).
References
- (1) J. H. Tapp, Z. Tang, B. Lv, K. Sasmal, B. Lorenz, P. C. W. Chu, and A. M. Guloy, Physical Review B 78, 060505 (2008).
- (2) X. C. Wang, Q. Q. Liu, Y. X. Lv, W. B. Gao, L. X. Yang, R. C. Yu, F. Y. Li, and C. Q. Jin, Solid State Communications 148, 538 (2008).
- (3) C. W. Chu, F. Chen, M. Gooch, A. M. Guloy, B. Lorenz, B. Lv, K. Sasma, Z. J. Tang, J. H. Tapp, and Y. Y. Xue, Physica C 469, 326 (2009).
- (4) Z. Li, J. S. Tse, and C. Q. Jin, Physical Review B 80, 092503 (2009).
- (5) D. R. Parker, M. J. Pitcher, P. J. Baker, I. Franke, T. Lancaster, S. J. Blundell, and S. J. Clarke, Chem. Commun. 16, 2189 (2009).
- (6) G. F. Chen, W. Z. Hu, J. L. Luo, and N. L. Wang, Physical Review Letters 102, 227004 (2009).
- (7) D. R. Parker, M. J. P. Smith, T. Lancaster, A. J. Steele, I. Franke, P. J. Baker, F. L. Pratt, M. J. Pitcher, S. J. Blundell, and S. J. Clarke, Physical Review Letters 104, 057007 (2010).
- (8) M. A. Tanatar, N. Spyrison, Kyuil Cho, E. C. Blomberg, Guotai Tan, Pengcheng Dai, Chenglin Zhang, and R. Prozorov, Phys. Rev. B 85, 014510 (2012).
- (9) N. Spyrison, M. A. Tanatar, K. Cho, Y. Song, P. Dai, C. Zhang, and R. Prozorov, Phys. Rev. B 86, 144528 (2012).
- (10) M. J. Pitcher, T. Lancaster, J. D. Wright, I. Franke, A. J. Steele, P. J. Baker, F. L. Pratt, W. T. Thomas, D. R. Parker, S. J. Blundell, S. J. Clarke, J. Am. Chem. Soc. 132, 10467 (2010).
- (11) L. Boeri, O. V. Dolgov, and A. A. Golubov, Phys. Rev. Lett. 101, 026403 (2008).
- (12) M. Le Tacon, M. Krisch, A. Bosak, J. W. G. Bos, and S. Margadonna, Phys. Rev. B 78, 140505 (2008).
- (13) T. Fukuda, A. Q. R. Baron, S.-i. Shamoto, M. Ishikado, H. Nakamura, M. Machida, H. Uchiyama, S. Tsutsui, A. Iyo, H. Kito, J. Mizuki, M. Arai, H. Eisaki, and H. Hosono, Journ. Phys. Soc. Jap. 77, 103715 (2008).
- (14) S. E. Hahn, Y. Lee, N. Ni, P. C. Canfield, A. I. Goldman, R. J. McQueeney, B. N. Harmon, A. Alatas, B. M. Leu, E. E. Alp, D. Y. Chung, I. S. Todorov, and M. G. Kanatzidis, Phys. Rev. B 79, 220511 (2009).
- (15) R. Mittal, L. Pintschovius, D. Lamago, R. Heid, K. P. Bohnen, D. Reznik, S. L. Chaplot, Y. Su, N. Kumar, S. K. Dhar, A. Thamizhavel, and T. Brueckel, Phys. Rev. Lett. 102, 217001 (2009).
- (16) D. Reznik, K. Lokshin, D. C. Mitchell, D. Parshall, W. Dmowski, D. Lamago, R. Heid, K. P. Bohnen, A. S. Sefat, M. A. McGuire, B. C. Sales, D. G. Mandrus, A. Subedi, D. J. Singh, A. Alatas, M. H. Upton, A. H. Said, A. Cunsolo, Y. Shvyd ko, and T. Egami, Phys. Rev. B 80, 214534 (2009).
- (17) M. Le Tacon, T. R. Forrest, C. Rüegg, A. Bosak, A. C. Walters, R. Mittal, H. M. Rønnow, N. D. Zhigadlo, S. Katrych, J. Karpinski, J. P. Hill, M. Krisch, and D. F. McMorrow, Phys. Rev. B 80, 220504 (2009).
- (18) O. Delaire, M. S. Lucas, A. M. dos Santos, A. Subedi, A. S. Sefat, M. A. McGuire, L. Mauger, J. A. Munoz, C. A. Tulk, Y. Xiao, M. Somayazulu, J. Y. Zhao, W. Sturhahn, E. E. Alp, D. J. Singh, B. C. Sales, D. Mandrus, and T. Egami, Phys. Rev. B 81, 094504 (2010).
- (19) M. Le Tacon, T. R. Forrest, C. Rüegg, A. Bosak, J. Noffsinger, A. C. Walters, P. Toulemonde, A. Palenzona, N. D. Zhigadlo, J. Karpinski, J. P. Hill, M. Krisch, and D. F. McMorrow, J Phys Chem Solids 72, 72523 (2011).
- (20) T. Fukuda, A. Q. R. Baron, H. Nakamura, S. Shamoto, M. Ishikado, M. Machida, H. Uchiyama, A. Iyo, H. Kito, J. Mizuki, M. Arai, and H. Eisaki, Phys. Rev. B 84, 064504 (2011).
- (21) T. Yildirim, Physica C: Superconductivity 469, 425 (2009).
- (22) L. Boeri, M. Calandra, I. I. Mazin, O. V. Dolgov, and F. Mauri, Phys. Rev. B 82, 020506 (2010).
- (23) F. Yndurain Europhys. Letters 94, 37001 (2011)
- (24) B. Li, Z. W. Xing, G. Q. Huang, and M. Liu, J. Appl. Phys. 111, 033922 (2012).
- (25) N. A. Garcia-Martinez, B. Valenzuela, S. Ciuchi, E. Cappelluti, M. J. Calderón, and E. Bascones, Phys. Rev. B 88, 165106 (2013)
- (26) K.-Y. Choi, P. Lemmens, I. Eremin, G. Zwicknagl, H. Berger, G. L. Sun, D. L. Sun, and C. T. Lin, J. Phys.: Condens. Matter 22, 115802 (2010).
- (27) A. P. Litvinchuk, B. Lv, and C. W. Chu, Phys. Rev. B 84, 092504 (2011).
- (28) W. Z. Hu, Q. M. Zhang, and N. L. Wang, Physica C: Superconductivity 469, 545 (2009).
- (29) Dai Yao-Min, Xu Bing, Shen Bing, Xiao Hong, R.P.S.M. Lobo R. P. S., and Qiu Xiang-Gang, Chinese Physics 21, 077403 (2012).
- (30) A. P. Litvinchuk, V. G. Hadjiev, M. N. Iliev, B. Lv, A. M. Guloy, and C. W. Chu, Phys. Rev. B 78, 060503 (2008).
- (31) Y. J. Um, J. T. Park, B. H. Min, Y. J. Song, Y. S. Kwon, B. Keimer, and M. Le Tacon, Phys. Rev. B 85, 012501 (2012).
- (32) Y. J. Um, A. Subedi, P. Toulemonde, A. Y. Ganin, L. Boeri, M. Rahlenbeck, Y. Liu, C. T. Lin, S. J. E. Carlsson, A. Sulpice, M. J. Rosseinsky, B. Keimer, and M. Le Tacon, Phys. Rev. B 85, 064519 (2012).
- (33) L. Chauvière, Y. Gallais, M. Cazayous, A. Sacuto, M. A. Méasson, D. Colson, and A. Forget, Phys. Rev. B 80, 094504 (2009).
- (34) M. Rahlenbeck, G. L. Sun, D. L. Sun, C. T. Lin, B. Keimer, and C. Ulrich, Phys. Rev. B 80, 064509 (2009).
- (35) K. Y. Choi, D. Wulferding, P. Lemmens, N. Ni, S. L. Bud ko, and P. C. Canfield, Phys. Rev. B 78, 212503 (2008).
- (36) V. Gnezdilov, Y. Pashkevich, P. Lemmens, A. Gusev, K. Lamonova, T. Shevtsova, I. Vitebskiy, O. Afanasiev, S. Gnatchenko, V. Tsurkan, J. Deisenhofer, and A. Loidl, Phys. Rev. B 83, 245127 (2011).
- (37) A. Akrap, J. J. Tu, L. J. Li, G. H. Cao, Z. A. Xu, and C. C. Homes, Phys. Rev. B 80, 180502 (2009).
- (38) A. Charnukha, D. Pröpper, T.I. Larkin, D. L. Sun, Z. W. Li, C. T. Lin, T. Wolf, B. Keimer, A. V. Boris. Phys. Rev. B 88, 184511 (2013).
- (39) Y. J. Song, J. S. Ghim, B. H. Min, Y. S. Kwon, M. H. Jung, and J.-S. Rhyee, Appl. Phys. Lett. 96, 212508 (2010).
- (40) J. T. Park, G. Friemel, T. Loew, V. Hinkov, Y. Li, B. H. Min, D. L. Sun, A. Ivanov, A. Piovano, C. T. Lin, B. Keimer, Y. S. Kwon, and D. S. Inosov, Physical Review B 86, 024437 (2012).
- (41) D. L. Rousseau, R. P. Bauman, and S. P. S. Porto, Journal of Raman Spectroscopy 10, 253 (1981).
- (42) R. A. Jishi and H. M. Alyahyaei, Adv. Condens. Matter Phys. 2010, 804343 (2010).
- (43) S. Deng, J. K’́ohler, and A. Simon , Phys. Rev. B 80, 214508 (2009).
- (44) P. G. Klemens, Physical Review 148, 845 (1966).
- (45) J. Menéndez, and M. Cardona, Phys. Rev. B 29, 2051 (1984).
- (46) C. He, Y. Zhang, B. P. Xie, X. F. Wang, L. X. Yang, B. Zhou, F. Chen, M. Arita, K. Shimada, H. Namatame, M. Taniguchi, X. H. Chen, J. P. Hu, and D. L. Feng, Phys. Rev. Lett. 105, 117002 (2010).
- (47) Xiaodong Zhou, Peng Cai, Aifeng Wang, Wei Ruan, Cun Ye, Xianhui Chen, Yizhuang You, Zheng-Yu Weng, and Yayu Wang, Phys. Rev. Lett. 109, 037002 (2012).
- (48) E. P. Rosenthal, E. F. Andrade, C. J. Arguello, R. M. Fernandes, L. Y. Xing, X. C. Wang, C. Q. Jin, A. J. Millis, and A. N. Pasupathy Nature Physics, Advance Online Publication (2014).
- (49) J. D. Wright, T. Lancaster, I. Franke, A. J. Steele, J. S. Möller, M. J. Pitcher, A. J. Corkett, D. R. Parker, D. G. Free, F. L. Pratt, P. J. Baker, S. J. Clarke, and S. J. Blundell, Phys. Rev. B 85, 054503 (2012).
- (50) Y. Gallais, A. Sacuto, M. Cazayous, P. Cheng, L. Fang, and H. H. Wen, Phys. Rev. B 78, 132509 (2008).
- (51) A. F. Wang, X. G. Luo, Y. J. Yan, J. J. Ying, Z. J. Xiang, G. J. Ye, P. Cheng, Z. Y. Li, W. J. Hu, and X. H. Chen, Phys. Rev. B 85, 224521 (2012).
- (52) Z. H. Liu, P. Richard, K. Nakayama, G. F. Chen, S. Dong, J. B. He, D. M. Wang, T. L. Xia, K. Umezawa, T. Kawahara, S. Souma, T. Sato, T. Takahashi, T. Qian, Y. Huang, N. Xu, Y. Shi, H. Ding, and S. C. Wang, Phys. Rev. B 84, 064519 (2011).
- (53) C. Zhang, R. Yu, Y. Su, Y. Song, M. Wang, G. Tan, T. Egami, J. A. Fernandez-Baca, E. Faulhaber, Q. Si, and P. Dai, Phys. Rev. Lett. 111, 207002 (2013).
- (54) T. P. Devereaux, A. Virosztek, and A. Zawadowski, Phys. Rev. B 51, 505 (1995).
- (55) P. J. Hirschfeld, M. M. Korshunov, and I. I. Mazin, Rep. Pro. Phys. 74, 124508 (2011).
- (56) S. Raghu, Xiao-Liang Qi, Chao-Xing Liu, D. J. Scalapino, and Shou-Cheng Zhang, Phys. Rev. B 77, 220503 (2008).
- (57) S. Graser, T. A. Maier, P. J. Hirschfeld, and D. J. Scalapino, New J. Phys. 11, 025016 (2009).
- (58) R. Zeyher and G. Zwicknagl, Z. Phys. B: Condens. Matter 78, 175 (1990).