Ionic Coulomb Blockade and Resonant Conduction in Biological Ion Channels
Abstract
The conduction and selectivity of calcium/sodium ion channels are described in terms of ionic Coulomb blockade, a phenomenon based on charge discreteness and an electrostatic model of an ion channel. This novel approach provides a unified explanation of numerous observed and modelled conductance and selectivity phenomena, including the anomalous mole fraction effect and discrete conduction bands. Ionic Coulomb blockade and resonant conduction are similar to electronic Coulomb blockade and resonant tunnelling in quantum dots. The model is equally applicable to other nanopores.
pacs:
87.16.Vy, 41.20.Cv, 05.40.-a, 05.30.-d,Biological ion channels are natural nanopores providing for the fast and highly selective permeation of physiologically important ions (e.g. Na+, K+ and Ca2+) through cellular membranes. Hille (2001); F. M. Ashcroft (2006); Eisenberg (2013). The conduction and selectivity of e.g. voltage-gated Ca2+ Sather and McCleskey (2003); Tang et al. (2014) and Na+ channels Payandeh et al. (2011) are defined by the ions’ movements and interactions inside a short, narrow selectivity filter (SF) lined with negatively-charged protein residues providing a net fixed charge . Permeation through the SF sometime involves the correlated motion of more than one ion Hodgkin and Keynes (1955); Armstrong and Neyton (1991); Roux et al. (2004); Kharkyanen et al. (2010). It is known from mutation studies and simulations that is a determinant of the channel’s conductivity and valence selectivity Corry et al. (2005); Boda et al. (2008); Csányi et al. (2012). The discreteness of the ionic charge, and related electrostatic effects, play significant roles in ion channel conduction. It has recently been shown that nanopores can exhibit ionic Coulomb blockade (CB) Krems and Di Ventra (2013); Meyertholen and Di Ventra (2013), a phenomenon equivalent to electronic CB in mesoscopic systems Alhassid (2000); Beenakker (1991); Pekola et al. (2013).
An electrostatic theory describing ionic transport in water-filled periodically-charged nanopores has been proposed Zhang et al. (2005); Kamenev et al. (2006) treating the ions as a 1D Coulomb gas Kamenev et al. (2006). It revealed the phenomenon of ion-exchange through low-barrier phase transitions as the ion concentration and fixed charge Zhang et al. (2006) were varied. Comparable transitions in Brownian dynamics (BD) simulations of Ca2+ channels result in discrete conduction and selectivity bands as functions of Kaufman et al. (2013a, b) consistent with earlier speculations Eisenberg (1996) and explaining both the anomalous mole fraction effect (AMFE) Sather and McCleskey (2003) and some of the puzzling mutation-induced transformations of selectivity in Ca2+/Na+ channels Heinemann et al. (1992); Tang et al. (1993); Shaya et al. (2011). We have connected the bands’ positions with sequential neutralisation and valence selectivity Kaufman et al. (2013b, c), but the physical origin of the bands and the statistical distribution of SF occupancy have remained unclear.
In this Letter, we will show that the permeation process in a simple model of the calcium/sodium ion channel is similar to mesoscopic transport in quantum dots: the simulated conduction bands and the experimentally observed valence selectivity phenomena in Ca2+/Na+ channels, including AMFE, can be well-described in terms of ionic CB conductance oscillations: the stop bands due to blockade are separated by resonant conduction bands, and the occupancy of the SF is governed by Fermi-Dirac (FD) statistics.
In what follows, with SI units, is the electronic charge, the temperature, the ionic valence, Boltzmann’s constant, and the vacuum permittivity.
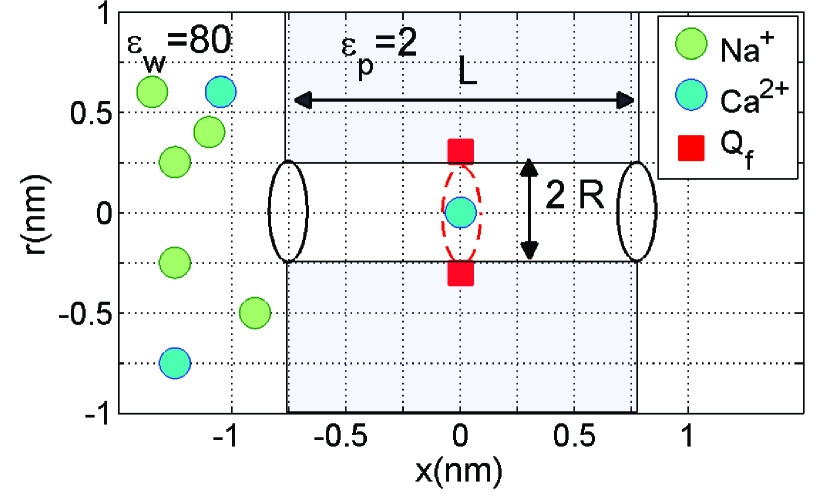
We consider the generic electrostatic model of a Ca2+/Na+ ion channel shown in Fig. 1. The SF is described as an axisymmetric, water-filled, cylindrical pore of radius nm and length nm through a protein hub in the cellular membrane. A centrally-placed, uniform, rigid ring of negative charge in the range is embedded in the wall at . The left-hand bath, modeling the extracellular space, contains non-zero concentrations of Ca2+ and/or Na+ ions. We take both the water and the protein to be homogeneous continua with relative permittivities and , respectively, but describe the ions as discrete charges within the framework of the implicit hydration model Parsegian (1969); Laio and Torre (1999); Roux et al. (2004); Zhang et al. (2005) moving in single file within the channel, with bulk values of diffusion coefficients . We take no account of the negative counterions inside the SF, which will be few on account of repulsion by the negative . Such models are equally applicable to biological channels Boda et al. (2008); Corry et al. (2005) or to artificial nanopores Zhang et al. (2005); Krems and Di Ventra (2013); Zwolak et al. (2009); Corry (2011); Garcia-Fandiño and Sansom (2012).
In the BD simulations, the coupled 3D axis-symmetrical Poisson electrostatic equation and 1D overdamped Langevin stochastic equation are solved numerically and self-consistently at each simulation step. The model obviously represents a considerable simplification of the actual electrostatics and dynamics of the ions and water molecules moving within the narrow SF Tieleman et al. (2001); Nelissen et al. (2007). It was shown that, however, that -electrostatics with bulk values works well for Ca2+ and Na+ channels (nm) with the ions retaining their first hydration shells Laio and Torre (1999); Corry (2013); Tang et al. (2014). Details of the BD simulations and of the model, its range of validity and its limitations, have been presented and discussed elsewhere Kaufman et al. (2013a, b).
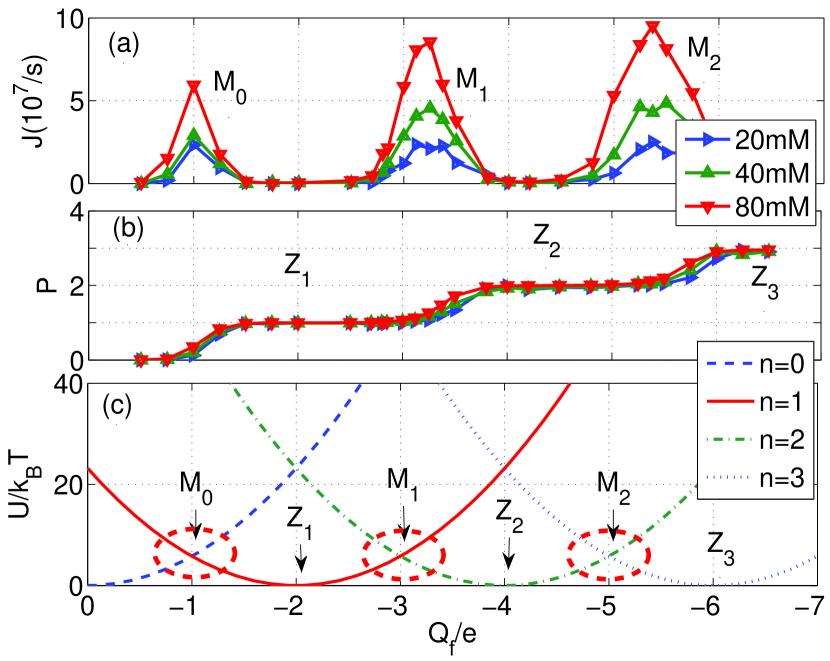
The multi-ion conduction bands found in the BD simulations Kaufman et al. (2013a, b) are shown in Fig. 2(a),(b) which plot the Ca2+ current and channel occupancy for pure baths of different concentration. Fig. 2(a) shows narrow conduction bands , , separated by stop-bands of almost zero-conductance centred on the blockade points , , . Fig. 2(b) shows that the peaks in correspond to transition regions in channel occupancy, where jumps from one integer value to the next, and that the stop-bands correspond to saturated regions with integer . Band corresponds to single-ion conduction. corresponds to the double-ion knock-on conduction, which is well-established for L–type Ca2+ channels Armstrong and Neyton (1991); Sather and McCleskey (2003); and corresponds to triple-ion conduction which can be connected with Ryanodine receptor calcium channels Gillespie (2008). The bands can be considered as examples of self-organization in ion channels Giri et al. (2011); Tindjong et al. (2013)
We can readily account for the pattern of bands in terms of ionic CB, as shown in Fig. 2(c). The discreteness of the ionic charge allows to us to introduce exclusive “eigenstates” {n} of the channel with fixed integer numbers of ions inside its SF having total electrostatic energy . The transition {n} {n+1} corresponds to the entry of a new ion, whereas {n} {n-1} corresponds to the escape of a trapped ion. The statistics of “eigenstates ” is governed by an exclusive n-states definition Nelson (2011) :
| (1) |
where is the occupancy of the state {m} and is the average SF occupancy. In equilibrium is defined by the Boltzmann factor where . The exact distribution for and (which is FD) will be derived below. The total energy for a channel in state {n} can be expressed as:
| (2) |
where is the self-energy, is the energy of attraction, and is the ions’ mutual interaction energy.
The self-energy is defined on the assumption that both the ions and are located within the central part of the SF, so that Zhang et al. (2005):
| (3) |
Here, represents the excess charge at the SF for the ions as function of .
To a first approximation we can omit and , assume , calculate as a function of for and seek the conditions that minimize the self-energy. Fig. 2(c) plots as functions of . We note two kinds of low-energy singular points, marked as and .
The minima of (and the blockade regions) appear around the neutralisation points where and the occupancy is saturated at an integer value Zhang et al. (2006); Kaufman et al. (2013c). State {n} is separated from neighbouring {n1} states by an impermeable barrier of . The crossover points () allow barrier-less transitions; they correspond to the transition regions and to the conduction peaks in Kaufman et al. (2013c). The points are separated from higher energy states by , which represents an impermeable barrier.
The positions of the singular points in Fig. 2(a) can be written as:
| (4) |
where , are possible corrections for affinity and for the ion-ion interaction, not accounted for here. Equation (4) is exactly the same as its counterpart in electronic CB Alhassid (2000). We may therefore interpret the bands as arising from an alternation between ionic CB (stop-bands around the points) and resonant conduction (the conduction bands) as is increases.
The positions of the peaks and stop-bands in the simulations are consistent with an energetics analysis Kaufman et al. (2013b, c), supporting our interpretation of the observed conduction bands as ionic CB conductance oscillations Alhassid (2000); the small deviations in the precise positions of and can reasonably be attributed to field leaks and simplifications inherent in the neutralisation approach.
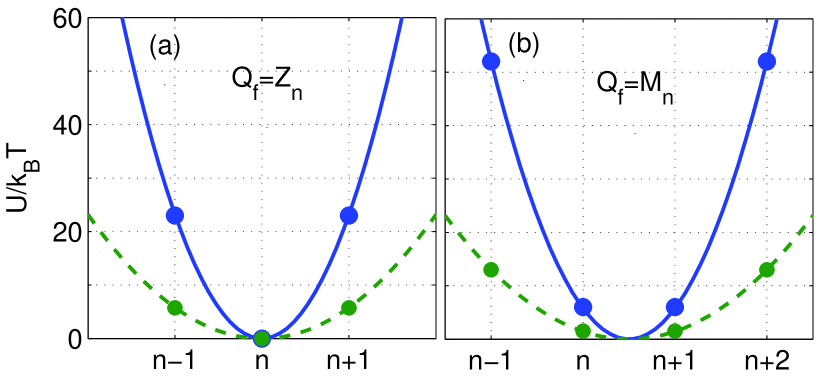
Unlike its electronic counterpart, ionic CB is valence-dependent: the bands shift in proportion to due to (4) and broaden/narrow in proportion to due (3) Kaufman et al. (2013c). Fig. 3(a) plots the energy of an -occupied channel against for the blockade/neutralisation points . For divalent Ca2+ (full curve) has a sharp minimum for state {n}, separated from neighbouring {n1} states by an impermeable barrier of . This is strong blockade closely similar to electronic CB in quantum dots Alhassid (2000); Beenakker (1991). The same plot for Na+ ions (dashed curve) reveals a permeable barrier, that is weak ionic CB.
Fig. 3(b) show a similar plot for the resonant conduction points . Again, it is strong ionic CB () for Ca2+ ions and weak ionic CB () for Na+ ions.
The ionic CB approach can be also applied to a mixed Ca2+-Na+ bath at the point, which is for Ca2+ and for Na+ ions. The combination 1Ca1Na+ (with +3 charge) inside the SF is neutralized (=0) and so the channel is asymmetrically blocked due to ionic CB (Fig. 3(a)) – strong for Ca2+ and weak for Na+. Similarly 3Na+ (with +3) also blocks the channel by weak ionic CB at the point for Na+ ions. Otherwise, a channel contents of 2Ca2+ (+4e) gives and resonant conduction (Fig. 3(b)). This asymmetric ionic CB provides an explanation of AMFE in Ca2+ channels consistent with analysis in terms of the potential energy landscape Kaufman et al. (2013b, c).
We are now in a position to derive the distribution of in the vicinity of the points and hence to calculate the shapes of or . For divalent Ca2+, the separation in energy is large (), so that general eigenstate definition (1) reduces to a discrete two-level exclusion principle:
| (5) |
The electrostatic constraint (5) plays the same role as the Pauli exclusion principle plays in quantum mechanics Dirac (1930); Kaniadakis and Quarati (1993); Liu and Eisenberg (2013). The standard derivation via a partition function, taking account of (5) leads Fowler (1935) to FD statistics for and an excess (fractional) occupancy :
| (6) |
where is some reference occupancy, related to bulk concentration. Note, that FD (6) is equivalent to the Langmuir isoterm Fowler (1935) (or Michaelis-Menten saturation). A similar Fermi function was obtained earlier Zhang et al. (2006) for the variation of with concentration. Here we will assume =1 for simplicity.
A self-consistent calculation of the conductance can be effected via the variance of the occupancy due to thermal fluctuations. The ability of an energy level to contribute to the current/conductance is proportional to via linear response theory and the Landauer approximation Alhassid (2000); Beenakker (1991):
| (7) |
where is the barrier-less diffusive current.
As an alternative, we can use the quasi-equilibrium (or nonequilibrium reaction rate Tindjong et al. (2012)) approach with explicit solution of the Nernst-Planck equation for the triangular piece-wise linear approximation (i.e. Goldman-Hodgkin-Katz (GHK) solution) of the bell-shaped SF potential with account for FD occupancy (6), yielding
| (8) |
which can be called the Fermi-GHK approximation and is identical to the corresponding approximation in the theory of CB Kulik and Shekhter (1975); Beenakker (1991).
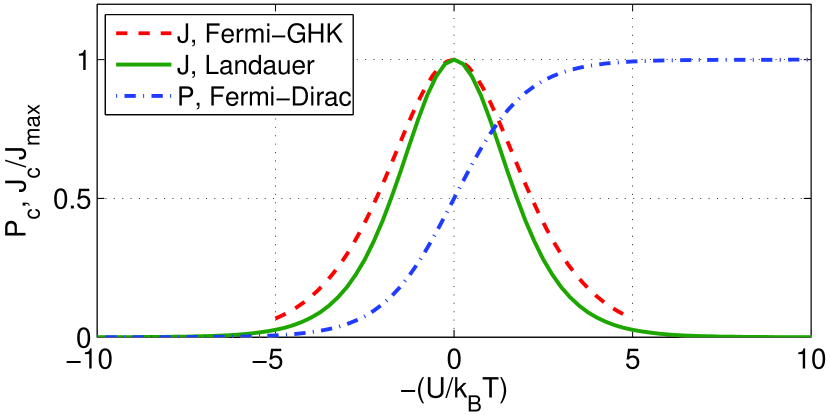
Fig. 4 reveals a resonant conductivity as (or equivalently ) is varied. The current in both the Landauer and Fermi-GHK approximations (Eqs. (7) and (8)) exhibits a resonant peak coinciding with the maximum in the derivative of , . In practical terms, the difference between the two approximations is small. The form of this current is similar to that of the tunneling current in a quantum dot Alhassid (2000): an even, double-exponential function of , reflecting the symmetry of escape and relaxation trajectories Luchinsky and McClintock (1997).
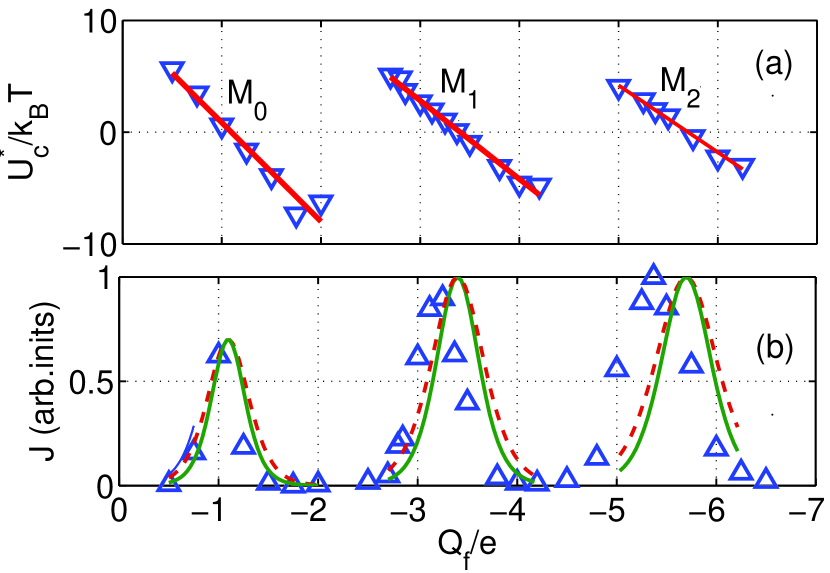
For a quantitative fit of the theory to , we calculate the effective (excess) well depth as:
| (9) |
The FD function (6) predicts that should be linear in and also (due to the relatively narrow transition region) in , i.e. (9) represents linearising coordinates for the FD equation (6). Indeed, as shown in Fig. 5(a), exhibits a piece-wise linear dependence on with a high correlation coefficient , confirming that the transitions obey the FD function (6) of .
Fig. 5(b) compares the ionic CB model with the the BD-simulated conduction bands , , Kaufman et al. (2013a). Landauer and Fermi-GHK peaks are calulated using (7) and (8) respectively with the values of taken from plot (a) and there are no adjustable parameters. The BD peak shapes and positions are described reasonably well by the model, extending the simpler fitting in Kaufman et al. (2013b, c). The discrepancies are attributable to our neglect of interaction effects.
Although an ion moving inside a channel or nanopore is a classical system described by Newtonian dynamics, it exhibits some quantum-like mesoscopic features including, in particular, ionic CB Krems and Di Ventra (2013); Meyertholen and Di Ventra (2013) at , the FD distribution of , and resonant barrier-less conduction at . We attribute such behavior to charge discreteness, confinement effects, and the fact that while . It is interesting to note that 1D stochastic ionic dynamics inside the SF can be described by a Shrödinger-like wave equation Kamenev et al. (2006).
In conclusion, we have shown that Ca2+ channel permeation is analogous to mesoscopic transport in quantum dots: the electrostatic exclusion principle leads to an FD distribution of channel occupancy; the stop-bands correspond to CB; the barrier-less conduction peaks are similar to those in resonant tunneling and can be described self-consistently in terms of the Landauer formula. The ionic CB model provides a good account of the experimental (AMFE and valence selectivity) and simulated (discrete multi-ion conduction and occupancy bands) phenomena observed in model Ca2+ channels. The results are should be applicable to other ion channels and to biomimetic nanopores with charged walls.
We are grateful to Will Gibby, Dmitrii Luchinsky and Rodrigue Tindjong for valuable discussions. The research was supported by the Engineering and Physical Sciences Research Council UK (grant No. EP/G070660/1).
References
- Hille (2001) B. Hille, Ion Channels Of Excitable Membranes (Sinauer Associates, Sunderland, MA, 2001), 3rd ed.
- F. M. Ashcroft (2006) F. F. M. Ashcroft, Nature 440, 440 (2006).
- Eisenberg (2013) B. Eisenberg, Physiol. 28, 28 (2013).
- Sather and McCleskey (2003) W. A. Sather and E. W. McCleskey, Ann. Rev. Physiol. 65, 133 (2003).
- Tang et al. (2014) L. Tang, T. M. G. El-Din, J. Payandeh, G. Q. Martinez, T. M. Heard, T. Scheuer, N. Zheng, and W. A. Catterall, Nature 505, 56 (2014).
- Payandeh et al. (2011) J. Payandeh, T. Scheuer, N. Zheng, and W. A. Catterall, Nature 475, 353 (2011).
- Hodgkin and Keynes (1955) A. L. Hodgkin and R. D. Keynes, J. Physiol. 128, 61 (1955).
- Armstrong and Neyton (1991) C. M. Armstrong and J. Neyton, Ann. New York. Acad. Sci. 635, 18 (1991).
- Roux et al. (2004) B. Roux, T. Allen, S. Berneche, and W. Im, Quart. Rev. Biophys. 37, 15 (2004).
- Kharkyanen et al. (2010) V. N. Kharkyanen, S. O. Yesylevskyy, and N. M. Berezetskaya, Phys. Rev. E 82, 051103 (2010).
- Corry et al. (2005) B. Corry, T. Vora, and S. H. Chung, Biochim. Biophys. Acta-Biomembranes 1711, 72 (2005).
- Boda et al. (2008) D. Boda, W. Nonner, D. Henderson, B. Eisenberg, and D. Gillespie, Biophys. J. 94, 3486 (2008).
- Csányi et al. (2012) E. Csányi, D. Boda, D. Gillespie, and T. Krist f, Biochim. Biophys. Acta (BBA) – Biomembranes 1818, 592 (2012).
- Krems and Di Ventra (2013) M. Krems and M. Di Ventra, Journal of Physics: Condensed Matter 25, 065101 (2013).
- Meyertholen and Di Ventra (2013) A. Meyertholen and M. Di Ventra, arXiv preprint arXiv:1305.7450 (2013).
- Alhassid (2000) Y. Alhassid, Reviews of Modern Physics 72, 895 (2000).
- Beenakker (1991) C. Beenakker, Physical Review B 44, 1646 (1991).
- Pekola et al. (2013) J. P. Pekola, O.-P. Saira, V. F. Maisi, A. Kemppinen, M. Möttönen, Y. A. Pashkin, and D. V. Averin, Reviews of Modern Physics 85, 1421 (2013).
- Zhang et al. (2005) J. Zhang, A. Kamenev, and B. I. Shklovskii, Phys. Rev. Lett. 95, 148101 (2005).
- Kamenev et al. (2006) A. Kamenev, J. Zhang, A. I. Larkin, and B. I. Shklovskii, Physica A 359, 129 (2006).
- Zhang et al. (2006) J. Zhang, A. Kamenev, and B. I. Shklovskii, Phys. Rev. E 73, 051205 (2006).
- Kaufman et al. (2013a) I. Kaufman, D. G. Luchinsky, R. Tindjong, P. V. E. McClintock, and R. S. Eisenberg, Phys. Biol. 10, 026007 (2013a).
- Kaufman et al. (2013b) I. Kaufman, D. G. Luchinsky, R. Tindjong, P. V. E. McClintock, and R. S. Eisenberg, Phys. Rev. E 88, 052712 (2013b).
- Eisenberg (1996) R. S. Eisenberg, in New Developments in Theoretical Studies of Proteins, edited by R. Elber (World Scientific, Singapore, 1996), pp. 269–357.
- Heinemann et al. (1992) S. H. Heinemann, H. Teriau, W. Stuhmer, K. Imoto, and S. Numa, Nature 356, 441 (1992).
- Tang et al. (1993) S. Q. Tang, G. Mikala, A. Bahinski, A. Yatani, G. Varadi, and A. Schwartz, J. Biol. Chem. 268, 13026 (1993).
- Shaya et al. (2011) D. Shaya, M. Kreir, R. A. Robbins, S. Wong, J. Hammon, A. Brueggemann, and D. L. J. Minor, Proc. Natl. Acad. Sci. USA 108, 12313 (2011).
- Kaufman et al. (2013c) I. Kaufman, R. Tindjong, D. G. Luchinsky, P. V. E. McClintock, and R. S. Eisenberg, in 22nd Intern. Conf. on Noise and Fluctuations (ICNF), Montpellier, 24–28 June 2013, edited by L. V. J. M. Routoure and F. Pascal (IEEE Conf. Proc., 2013c), p. doi: 10.1109/ICNF.2013.6578926.
- Parsegian (1969) A. Parsegian, Nature 221, 844 (1969).
- Laio and Torre (1999) A. Laio and V. Torre, Biophys. J. 76, 129 (1999).
- Zwolak et al. (2009) M. Zwolak, J. Lagerqvist, and M. Di Ventra, Phys. Rev. Lett. 103, 128102 (2009).
- Corry (2011) B. Corry, Energy & Env. Sci. 4, 751 (2011).
- Garcia-Fandiño and Sansom (2012) R. Garcia-Fandiño and M. S. P. Sansom, Proc. Natl. Acad. Sci. USA 109, 6939 (2012).
- Tieleman et al. (2001) D. P. Tieleman, P. C. Biggin, G. R. Smith, and M. S. P. Sansom, Quart. Rev. Biophys. 34, 473 (2001).
- Nelissen et al. (2007) K. Nelissen, V. R. Misko, and F. M. Peeters, EPL (Europhys. Lett.) 80, 56004 (2007).
- Corry (2013) B. Corry, PeerJ 16, DOI10.7717/peerj.16 (2013).
- Gillespie (2008) D. Gillespie, Biophys. J. 94, 1169 (2008).
- Giri et al. (2011) J. Giri, J. E. Fonseca, D. Boda, D. Henderson, and B. Eisenberg, Phys. Biol. 8, 026004 (2011).
- Tindjong et al. (2013) R. Tindjong, I. Kaufman, D. G. Luchinsky, P. V. E. McClintock, I. Khovanov, and R. S. Eisenberg, New J. Phys. 15, 103005 (2013).
- Nelson (2011) P. H. Nelson, J. Chem. Phys. 134, 165102 (2011).
- Dirac (1930) P. A. M. Dirac, The Principles of Quantum Mechanics (OUP, Oxford, 1930).
- Kaniadakis and Quarati (1993) G. Kaniadakis and P. Quarati, Phys. Rev. E 48, 4263 (1993).
- Liu and Eisenberg (2013) J.-L. Liu and R. Eisenberg, J. Phys. Chem. B 117, 12051 (2013).
- Fowler (1935) R. H. Fowler, in Mathematical Proceedings of the Cambridge Philosophical Society (CUP, Cambridge, 1935), vol. 31, pp. 260–264.
- Tindjong et al. (2012) R. Tindjong, I. Kaufman, P. V. E. McClintock, D. G. Luchinsky, and R. S. Eisenberg, Fluct. Noise Lett. 11, 1240016 (2012).
- Kulik and Shekhter (1975) I. Kulik and R. Shekhter, Zhur. Eksper. Teoret. Fiziki 68, 623 (1975).
- Luchinsky and McClintock (1997) D. G. Luchinsky and P. V. E. McClintock, Nature 389, 463 (1997).