The FEROS–Lick/SDSS observational database of spectral indices of FGK stars for stellar population studies
Abstract
We present FEROS–Lick/SDSS, an empirical database of Lick/SDSS spectral indices of FGK stars to be used in population synthesis projects for discriminating different stellar populations within the integrated light of galaxies and globular clusters. From about 2500 FEROS stellar spectra obtained from the ESO Science Archive Facility we computed line–strength indices for 1085 non–supergiant stars with atmospheric parameter estimates from the AMBRE project.
Two samples of 312 dwarfs and of 83 subgiants with solar chemical composition and no significant –element abundance enhancement are used to compare their observational indices with the predictions of the Lick/SDSS library of synthetic indices. In general, the synthetic library reproduces very well the behaviour of observational indices as a function of temperature, but in the case of low temperature ( 5000 K) dwarfs; low temperature subgiants are not numerous enough to derive any conclusion. Several possible causes of the disagreement are discussed and promising theoretical improvements are presented.
keywords:
stars: late-type – stars: fundamental parameters – astronomical data bases: miscellaneous.1 Introduction
Spectra of galaxies and globular clusters carry a wealth of information about gas and different stellar populations properties. The analysis of stellar populations is of primary importance for the understanding of the physical processes involved in the formation and evolution of galaxies because it provides a unique tool to evaluate metal enrichment and star formation epoch(s).
There are several approaches to get information about abundance patterns in stellar populations that use colours (e.g. James et al. 2006; Carter et al. 2009), broad and narrow spectral features or indices (e.g. Rose 1994; Worthey et al. 1994; Cenarro et al. 2009; Worthey, Tang, & Serven 2014b; Vazdekis et al. 2010; Sansom et al. 2013), or full spectral fitting (e.g. Walcher et al. 2009). Colours are still useful in studying faint objects for which spectral features may not be obtainable, but are strongly affected by dust extinction.
Full spectral fitting and spectral indices, on the other hand, are preferred when studying brighter objects because they allow studies of individual chemical species. These spectroscopic studies involve a process that compares model predictions with observed spectra for the brightest objects or with line intensities of the most prominent atomic and molecular absorptions for fainter objects. Additionally, the latter, unlike broad band colours and full spectra, are almost unaffected by interstellar reddening (e.g. MacArthur 2005) and by spectral energy calibration uncertainties.
For a long time, spectroscopic analyses of stellar populations have relied on the Lick/IDS system of indices (Gorgas et al. 1993; Worthey et al. 1994; Worthey & Ottaviani 1997). It is important to remark, however, that the Lick/IDS system was defined at a resolution (R630) which is much lower than the ones of recent and forthcoming surveys (like, for example, the Sloan Digital Sky Survey, SDSS York et al. 2000, and the Large Sky Area Multi–Object Fiber Spectroscopic Telescope survey, LAMOST111http://www.lamost.org/LAMOST). Furthermore, as discussed in Worthey et al. (1994), several uncertainties in both IDS response function and wavelength calibration make it difficult to transform new observational indices into the original Lick/IDS system thus introducing possible systematic errors even if several improvements with respect to the past are now possible by using Worthey, Danilet & Faber (2014a).
At times when there is an easy access to huge high quality spectral surveys, it is of fundamental importance to test, evaluate and eventually improve the current theoretical machinery, to keep pace with the fast observational development.
Franchini et al. (2010) presented a new synthetic library, the Lick/SDSS library, of indices in a Lick–like system fine tuned to analyze data at medium resolution like those of SDSS and LAMOST. The use of R=1800 (Sloan/SDSS resolution) allows us to avoid a potential loss of information that would occur in degrading SDSS spectra. Furthermore, the Lick/SDSS system was built from flux calibrated spectral energy distributions and therefore is not characterized by any instrumental signature.
The Lick/SDSS library is primarily aimed at applications in stellar population synthesis, specifically to the study of old and intermediate–age stellar populations, but it also represents a useful tool for determining F,G, and K stellar atmospheric parameters and abundance ratios, in particular [Ca/Fe] and [Mg/Fe], (Franchini et al., 2011). In fact, the study of abundance patterns like, for example, –element enhancement, gives insight into the role of SNe I and SNe II in the chemical enrichment of galaxies. Moreover, the library can be used to complement empirical libraries in segments of the stellar parameter space, metallicity in particular, that are not homogeneously covered by observations. In fact, in general, empirical libraries are built with objects that carry on the imprints of the local properties of the solar neighbourhood, hence, might not be applicable to study the integrated spectra of stellar systems with different star formation histories, such as elliptical galaxies. It is fair to mention that synthetic libraries do not suffer from the above mentioned limitation but, on the other hand, the synthetic approach is prone to uncertainties that are mostly related to the approximations associated with theoretical model atmospheres and with the completeness of the lines lists used in computing synthetic spectra. It is therefore mandatory, before blindly using libraries of synthetic indices, to perform exhaustive checks on how well the theoretical predictions match the available observations of real stars, and to quantitatively establish their applicability and limitations.
Along this line, in this paper we produce an empirical library of Lick/SDSS indices for 1085 non–supergiant stars obtained by using observations taken with the Fibered Extended Range Optical Spectrograph (FEROS) (Kaufer et al., 1999). In Section 2 we describe the sample of the analyzed stars and the computation of their observational indices, and present the obtained FEROS–Lick/SDSS database. Eventually, in Section 3 we compare the observational indices of two sub–samples of 312 dwarfs and of 83 subgiants of solar chemical composition (-0.2[M/H]+0.2) with the predictions of the Lick/SDSS library and discuss the results.

2 Program stars and observational FEROS–Lick/SDSS indices
In order to build an empirical database of observational indices, we need a set of stars with reliable estimates of atmospheric parameters (i.e. effective temperature (), surface gravity (log ), and global metallicity ([M/H])) from whose spectra observational indices can be computed. After such a collection has been assembled, the comparison between observational indices and predictions of theoretical libraries built from model atmospheres and synthetic spectra is straightforward by imposing the match of the stellar and model atmospheric parameter values.
The stars observed by FEROS and studied by the AMBRE project (Worley et al., 2012) constitute an ideal working dataset for our purposes since they include a large number of non–supergiant FGK stars with individual estimates of , log , [M/H], and to iron ratio ([/Fe]).
We searched the ESO Science Archive Facility and retrieved, through the FEROS/HARPS pipeline processed data Query Form222http://archive.eso.org/wdb/wdb/eso/repro/form, all the public available spectra of FGK stars with AMBRE atmospheric parameter values in the following ranges: K, , and global metallicity [M/H].
A list of 1085 stars, corresponding to 2511 available spectra, was obtained. Since AMBRE provides individual estimates of stellar parameters derived from each spectrum, we computed for 202 stars with more than one observed spectrum average atmospheric parameter values. In any case the dispersion of values for the same object resulted to be less than the external errors associated with AMBRE results.
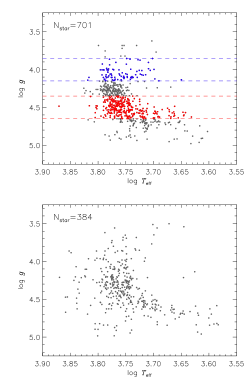
Figure 1a shows the distributions of , log , [M/H], and [/Fe] values for the 1085 stars333Only 1079 stars have [/Fe] estimates built by using half–bin sizes corresponding to the external errors given in AMBRE (i.e. =120 K, log =0.2 dex, [M/H]=0.1 dex, and [/Fe]=0.1 dex). As can be seen, most of the stars have dwarf or subgiant surface gravities, solar metallicity, and no significant –element abundance enhancement. In Fig. 1b we show, in the upper panel, the log –log diagrams for the 701 solar metallicity stars (-0.2[M/H]+0.2 and -0.2[/Fe]+0.2) while the other 384 stars are shown in the lower panel.
In order to compute observational Lick/SDSS indices, all 2511 spectra were corrected for radial velocity adopting the values given in AMBRE, and, subsequently, degraded to the resolution of the Lick/SDSS library (=1800). A set of FEROS indices were computed for each spectrum and averaged in the case of multiple observations of the same star. An additional step is required to transform FEROS indices into the Lick/SDSS system since FEROS spectra are not flux calibrated and thus can be impacted to a certain extent by the instrumental response. In order to perform such a transformation, we looked for FEROS stars in common with those contained in at least one of the databases used in Franchini et al. (2010) to calibrate the Lick/SDSS library, namely, ELODIE (Moultaka et al., 2004), INDO–U.S.(Valdes et al., 2004), and MILES (Cenarro et al., 2007).
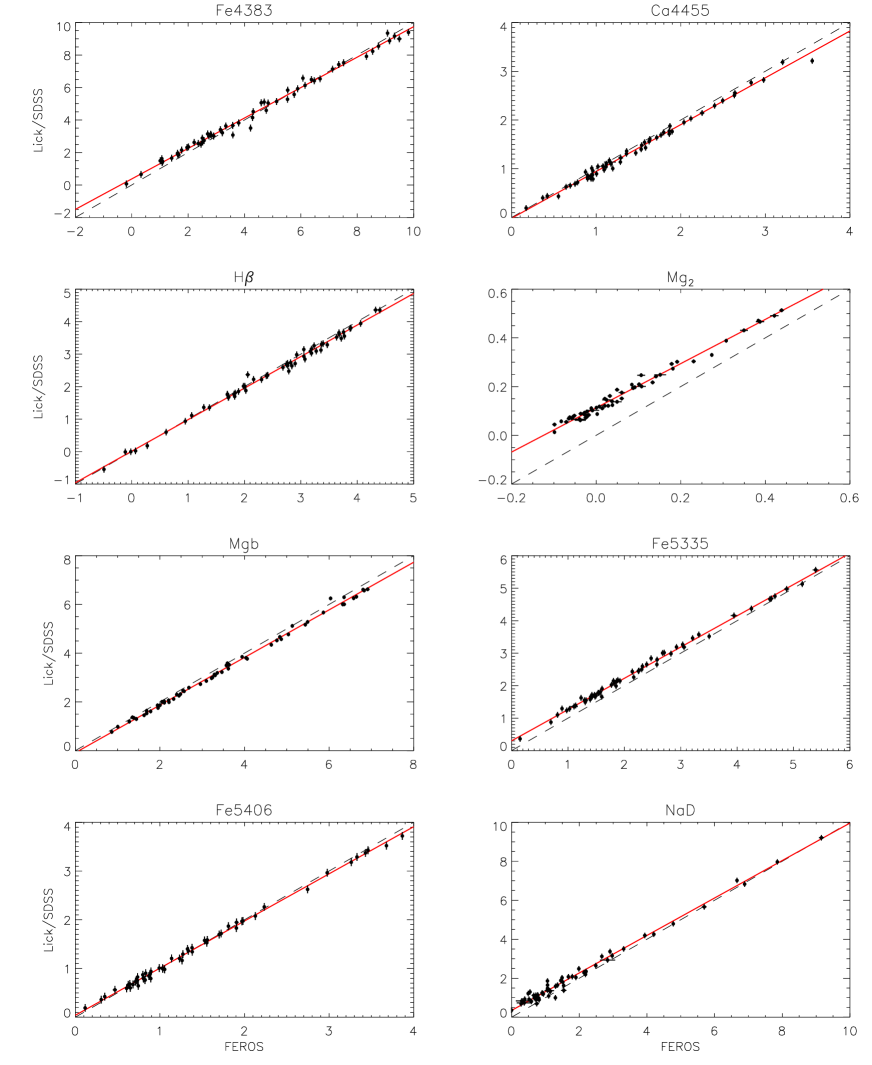
Figure 2 shows some examples of the comparison between FEROS and reference Lick/SDSS values from the above mentioned databases for the 58 FEROS stars in common. In general, the regression lines present slopes very close to one and small systematic offsets. Exceptions are the CaHK index, whose index definition wavelength interval falls in the blue region of FEROS spectra where the SNR is, in general, low, and the Mg1 and Mg2 indices which span such a large wavelength interval to make the FEROS instrumental response variation quite important. The scatter around the regression lines is always consistent with the typical errors given in Franchini et al. (2010) thus showing the reliability of the transformation of FEROS indices into the Lick/SDSS system.
The set of transformation coefficients of the linear regressions such as those shown in Fig. 2 were used to transform the FEROS index values into the Lick/SDSS system thus obtaining the FEROS–Lick/SDSS library, i.e. the empirical database of FEROS–Lick/SDSS index values of 1085 FGK stars, which is presented in Table 1. For each star we provide the number of FEROS spectra, , the mean atmospheric parameter values together with their standard deviations, and the mean index values with the corresponding standard deviations.
| Name | log | [M/H] | [/Fe] | CaHK | CN1 | ||||||||
|---|---|---|---|---|---|---|---|---|---|---|---|---|---|
| K | K | dex | dex | dex | Å | Å | mag | mag | |||||
| HD 224725 | 1 | 6319 | 38 | 4.98 | 0.16 | -0.38 | 0.08 | 0.07 | 0.05 | 8.901 | — | -0.044 | — |
| HD 224810 | 1 | 5738 | 12 | 4.30 | 0.10 | 0.06 | 0.04 | 0.02 | 0.02 | 2.919 | — | -0.027 | — |
| HD 224828 | 1 | 5598 | 12 | 4.45 | 0.04 | -0.47 | 0.02 | 0.16 | 0.01 | 7.591 | — | -0.084 | — |
| HIP 112 | 3 | 3970 | 7 | 4.84 | 0.01 | 0.27 | 0.03 | -0.30 | 0.01 | 13.000 | 3.693 | — | — |
| … | … | … | … | … | … | … | … | … | … | … | … | … | … |
3 Comparison with the Lick/SDSS library
In order to check the ability of synthetic Lick/SDSS indices to reproduce the observations of non–supergiant FGK stars, we can use the derived empirical FEROS–Lick/SDSS database presented in the previous section. Statistically sound results can be obtained only for solar chemical composition dwarfs and subgiants due to the paucity and inhomogeneous distribution of the other stars in the parameter space. Therefore, we extracted out of the 1085 FEROS stars the following two groups of objects:
- (1).
- (2).
The intervals in log , [M/H], and [/Fe] were chosen taking into account the corresponding external errors given in AMBRE in order to obtain two practically non–overlapping groups to be compared with the Lick/SDSS library predictions for [M/H]=0.0, [/Fe]=0.0, and log =4.0 and log =4.5, respectively.
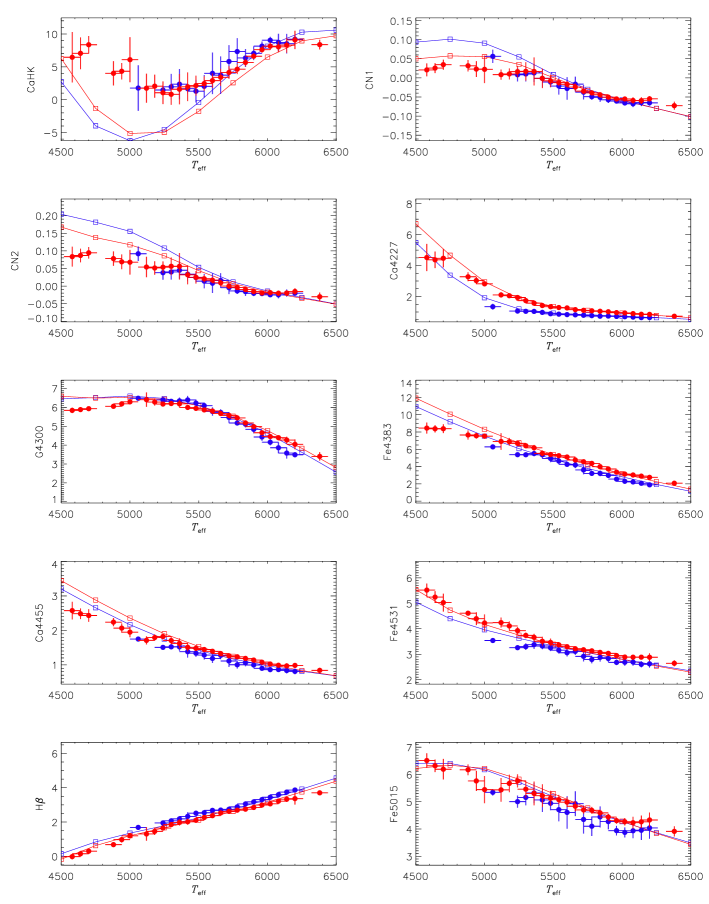
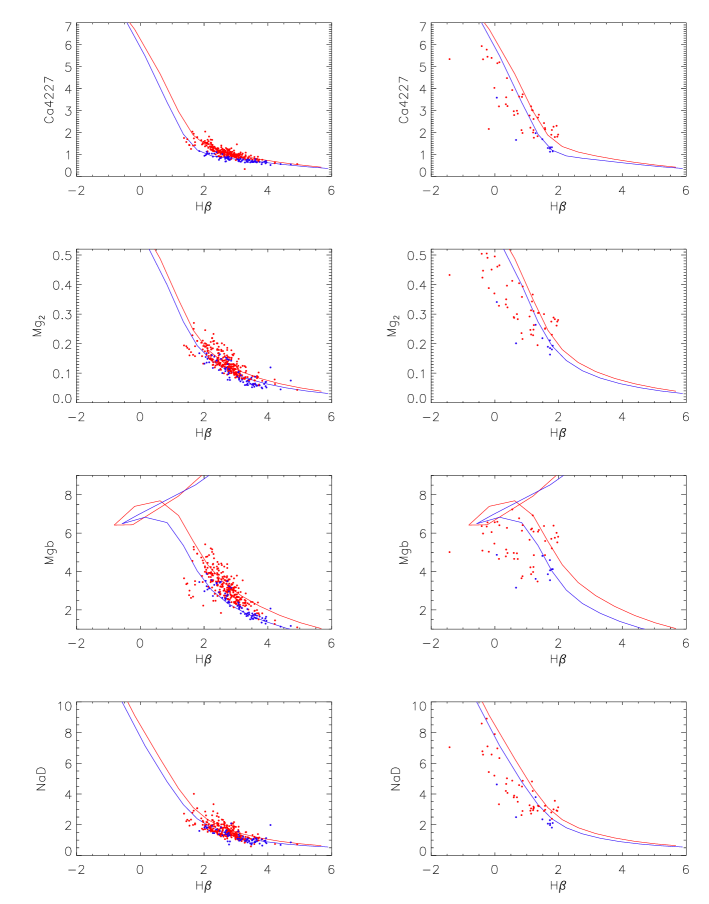
Figure 3 shows the re–binned observational FEROS–Lick/SDSS index values versus for the subgiants and dwarfs superimposed onto the predictions of the Lick/SDSS library. There is a general good agreement of dwarfs (red points) and subgiants (blue points) with the log =4.5 and log =4.0 lines (red and blue, respectively) for K.
In the following we describe in more detail the comparison for each individual index:
-
CaHK: The observational values for this index are always higher than the predicted ones for the dwarfs with the only exception of the higher temperatures ( 6000 K); there is a good agreement for the subgiants for 5500 K. We recall that this index fall in the extreme blue region of FEROS spectra which is, in general, characterized by a low SNR, and where the transformation of empirical FEROS indices into the Lick/SDSS system is more critical. Nevertheless, we cannot be sure that the disagreement between observational and synthetic values can be totally due to these observational problems;
-
CN1, CN2: The predictions of the Lick/SDSS library match the observational indices for dwarfs for 5300 K for both indices, while for the subgiants a good agreement is achieved for 5600 K only. These indices are very sensitive to the abundances of C, N, and O and no information about these elements in AMBRE;
-
Ca4227: Observational and synthetic index values agree for dwarfs for 4750 K; subgiants data are available only for 5000 K and show hints of an overestimation of the index by the Lick/SDSS library below 5250 K;
-
G4300: There is a very good agreement for dwarfs for all temperatures above 5100 K; discrepancies can be seen for dwarfs for 5000 K and for subgiants for 6000 K. This index, as CN1, CN2 may be affected by uncertainties in Carbon abundance.
-
Fe4383: Observational and synthetic index values agree very well for dwarfs for 5100 K and for subgiants for 5400 K. The synthetic index values overestimate the observational ones for the coolest dwarfs;
-
Ca4455: This index behaves as Fe4383;
-
Fe4531: The Lick/SDSS library predictions reproduce very well the values of observational indices for dwarfs for all temperatures and for subgiants for 5300 K. Synthetic index values are larger than the observational ones for the coolest subgiants;
-
H: There is a very good agreement both for dwarfs and subgiants for all temperatures. It is worth stressing the goodness of this result since, for this index, significant discrepancies between theoretical predictions and observations in the Lick/IDS system are shown in Fig. 1 by Worthey, Tang, & Serven (2014b);
-
Fe5015: This index shows a quite large observational scatter. The synthetic index values are larger than the observational ones for subgiants and for dwarfs for 4900 5200 K;
-
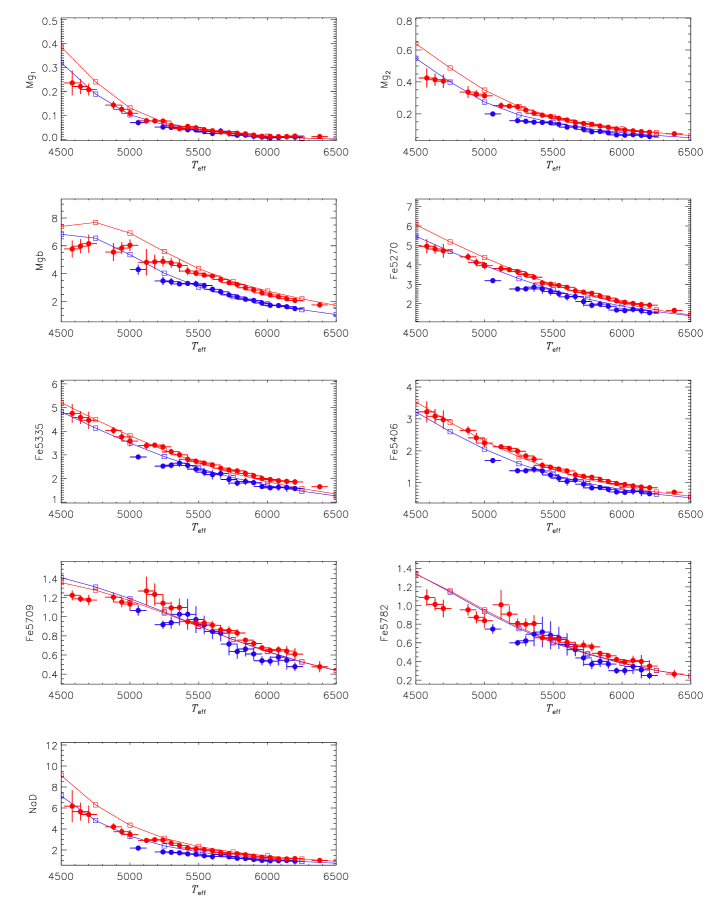
Mg1, Mg2, and Mgb: Observational values for dwarfs and subgiants are very well in agreement with the Lick/SDSS library predictions for 5250 K, for Mg1 and Mg2, and for 5500 K for Mgb. At lower temperatures the observational indices fall below the predicted ones. It is worth noticing that no agreement was achieved between empirical and synthetic Mgb values in the Lick/IDS system (see Fig. 1, by Worthey, Tang, & Serven 2014b);
-
Fe5270: There is a very good agreement for dwarfs for all temperatures above 5100 K and for subgiants for 5400 K. In this case, the agreement between theory and observations is much better than in the Lick/IDS system (see again Fig. 1, by Worthey, Tang, & Serven 2014b). Moreover, the improvement in sensitivity to surface gravity of the Lick/SDSS Fe5270 index with respect to the Lick/IDS one is also evident since subgiant and dwarf observational sequences are well separated in the diagram;
-
Fe5335 and Fe5406: There is a very good agreement for dwarfs for all temperatures while for subgiants this index behaves as Fe5270;
-
Fe5709 and Fe5782: These two indices are almost insensitive to surface gravity; the observational index values show a quite large scatter and fall below the Lick/SDSS library predictions for 4750 K for dwarfs;
-
NaD: The synthetic index values overestimate the observational ones in particular for the coolest dwarfs for 5250 K.
In conclusion, there is a generally good agreement between theoretical predictions and observational index values for temperatures above 5250 K showing that the Lick/SDSS library can be safely used to complement empirical databases for relatively “hot” FGK stars. At lower temperatures there is a reasonable agreement for Ca4227, Fe4531, H, Fe5335, and Fe5406 for dwarfs while the paucity of “cool” subgiants prevent us to draw a sound conclusion for this kind of stars. In all the other cases the Lick/SDSS library predicts too strong index values for temperatures below 5250 K.
An apparent disagreement between the Lick/SDSS library synthetic indices and observed ones was already found by Franchini et al. (2010) by using SDSS–DR7 stellar spectra. This disagreement was explained by systematic offsets in the stellar estimates derived by using SEGUE Stellar Parameter Pipeline (Lee et al., 2008) with respect to the temperature scale of the Lick/SDSS library444The persistence of these systematic offsets after the changes and improvements made on the SSPP and described in Smolinski et al. (2011) should be investigated.. A similar explanation for the discrepancies found in this work seems untenable, since Fig. 3 shows a good match for the the most sensitive index, i.e. H. A further indication that the problem is not in the AMBRE temperature determinations is given by Fig. 5 where we compare predicted and observational indices in index–index diagrams which are independent of temperature determinations. As can be seen, the indices of most of the stars with AMBRE temperature estimates below 5250 K (right panels in Fig. 5) fall in regions which are not consistent with any prediction of the Lick/SDSS library even if large systematic errors in their effective temperature estimates are assumed. In conclusion, the inconsistency of synthetic and observational indices for cool dwarfs must be ascribed to inadequacies or incorrect assumptions in the models and/or synthetic spectra used to compute the Lick/SDSS library for K. In order to improve the theoretical predictions for these temperatures, we are now computing new atmosphere models and new synthetic spectra to derive more reliable estimates of synthetic Lick/SDSS indices. The main differences between the new library and the published one will be:
-
1.
the use of new molecular opacities (in particular we now use a new release of the H2O line list made by Kurucz from Partridge & Schwenke555http://kurucz.harvard.edu/molecules/h2o/h2ofastfix.readme);
- 2.
-
3.
the use of a new updated version of the SPECTRUM code (i. e. v2.76f666http://www.appstate.edu/ grayro/spectrum/spectrum.html) by Gray & Corbally (1994) to compute synthetic spectra;
-
4.
the use of a new revised line list containing TiO data from Plez (1998). This line list (based on cool5.iso.lst, kindly provided to us by R. O. Gray 2010, private communication) will be characterized by the use of empirical log gf values for the strongest lines which we are deriving from the comparison between solar synthetic and observed high resolution spectra. The line list will include also improvements from SpectroWeb (Lobel, 2008).
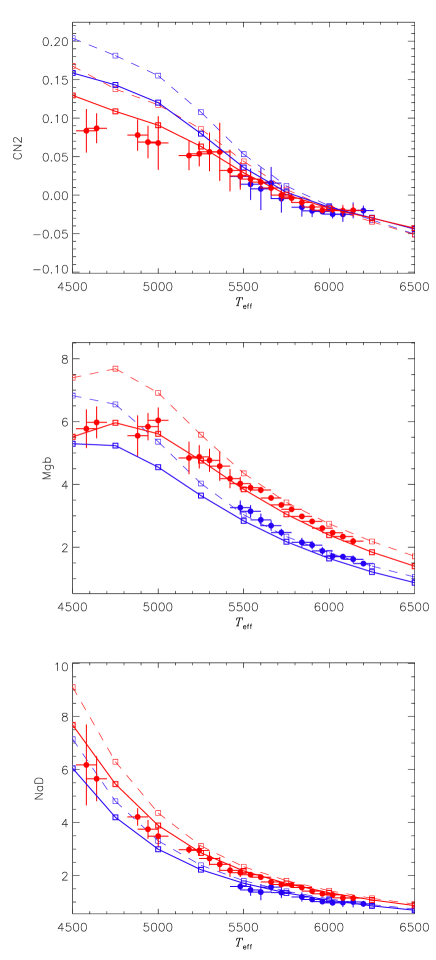
Preliminary results are shown in Fig. 6 for CN2, Mgb, and NaD: the new synthetic index values are in much better agreement with the observational ones than the original Lick/SDSS library predictions. These results show that significant improvements can be achieved with the above described updated tools and suggest that the already very good reliability of the Lick/SDSS library for K could be extended also for lower temperatures in the forthcoming new version of the library (Franchini et al. 2014).
Acknowledgments
Based on data obtained from the ESO Science Archive Facility under request numbers 88412 and 92380. This work received partial financial support from the Mexican CONACyT via grant SEP-2009-134985 and from PRIN MIUR 2010–2011 project “The Chemical and dynamical Evolution of the Milky Way and Local Group Galaxies”, prot. 2010LY5N2T.
References
- Carter et al. (2009) Carter D., et al., 2009, MNRAS, 397, 695
- Cenarro et al. (2009) Cenarro A. J., Cardiel N., Vazdekis A., Gorgas J., 2009, MNRAS, 396, 1895
- Cenarro et al. (2007) Cenarro A. J. et al., 2007, MNRAS, 374, 664
- Franchini et al. (2010) Franchini M., Morossi C., Di Marcantonio P., Malagnini M. L., Chavez M., 2010, ApJ, 719, 240
- Franchini et al. (2011) Franchini M., Morossi C., Di Marcantonio P., Malagnini M. L., Chavez M., 2011, ApJ, 730, 117
- Franchini et al. (2014) Franchini M., Morossi C., Di Marcantonio P., Malagnini M. L., Chavez M., 2014, in preparation
- Gorgas et al. (1993) Gorgas J., Faber S. M., Burstein D., González J. J., Courteau S., Prosser C., 1993, ApJS, 86, 153
- Gray & Corbally (1994) Gray R. O., & Corbally D. J. L. I. 1994, AJ, 107, 742
- James et al. (2006) James P. A., Salaris M., Davies J. I., Phillipps S.; Cassisi S., 2006 MNRAS, 367, 339
- Kaufer et al. (1999) Kaufer A., Stahl O., Tubbesing S., Nørregaard P., Avila G., Francois P., Pasquini L., Pizzella A., 1999, The Messenger 95,8
- Kurucz (2005) Kurucz R. 2008, Mem. S.A.It. Suppl. Vol. 8, 14
- Lee et al. (2008) Lee Y. S., et al., 2008, AJ, 136, 2022
- Lobel (2008) Lobel A., 2008, JPhCS 130, 2015
- MacArthur (2005) MacArthur, L. A., 2005 ApJ, 623, 795
- Moultaka et al. (2004) Moultaka J., Ilovaisky S. A., Prugniel P., Soubiran C., 2004, PASP, 116, 693
- Plez (1998) Plez B, 1998, A&A 337, 495
- Rose (1994) Rose J. A., 1994, AJ, 107, 206
- Sansom et al. (2013) Sansom, A. E., Milone A. de Castro, Vazdekis A, Sánchez–Blázques P. 2013, MNRAS, 435, 952
- Smolinski et al. (2011) Smolinski et al., 2011, AJ, 141, 89
- Valdes et al. (2004) Valdes F., Gupta R., Rose J. A., SinghH. P., Bell, D. J., 2004, ApJS, 152, 251 (INDO–U.S.)
- Vazdekis et al. (2010) Vazdekis A., Sànchez–Blázquez P., Falcón-Barroso J., Cenarro A. J., Beasley M. A., Cardiel N., Gorgas J., Peletier R. F., 2010, MNRAS, 404, 1639
- Walcher et al. (2009) Walcher C. J., Coelho P., Gallazzi A., Charlot S., 2009, MNRAS, 398, L44
- Worley et al. (2012) Worley C. C. et al., 2012, A&A, 542, A48
- Worthey et al. (1994) Worthey G. et al., 1994, ApJS, 94, 687
- Worthey & Ottaviani (1997) Worthey G., Ottaviani D. L., 1997, ApJS, 111, 377
- Worthey, Danilet & Faber (2014a) Worthey G., Danilet A. B. , Faber S. M., 2014a, A&A 561, A36
- Worthey, Tang, & Serven (2014b) Worthey G., Tang B., Serven J., 2014b ApJ, 783, 20
- York et al. (2000) York, D. G. et al. 2000, AJ, 120, 1579