FSQ-12-026
\RCS \RCS \cmsNoteHeaderFSQ-12-026, CERN-PH-EP-DRAFT-TOTEM-2014-002
Measurement of pseudorapidity distributions of charged particles in proton-proton collisions at \TeVby the CMS and TOTEM experiments
Abstract
Pseudorapidity () distributions of charged particles produced in proton-proton collisions at a centre-of-mass energy of 8\TeVare measured in the ranges and covered by the CMS and TOTEM detectors, respectively. The data correspond to an integrated luminosity of \mubinv. Measurements are presented for three event categories. The most inclusive category is sensitive to 91–96% of the total inelastic proton-proton cross section. The other two categories are disjoint subsets of the inclusive sample that are either enhanced or depleted in single diffractive dissociation events. The data are compared to models used to describe high-energy hadronic interactions. None of the models considered provide a consistent description of the measured distributions.
0.1 Introduction
Measurements of the yields and kinematic distributions of particles produced in proton-proton (pp) collisions at the Large Hadron Collider (LHC) can provide a better understanding of the mechanisms of hadron production in high-energy hadronic interactions. Two types of processes contribute to the production of most of the final-state particles at LHC energies. Semi-hard (multi)parton scattering, with exchanged momenta of a few \GeV, is the dominant contribution. Diffractive scattering in more peripheral pp interactions, where one or both protons survive the interaction and/or are excited into a low-mass state, accounts for 15–40% [1, 2] of the pp inelastic cross section. As the particle multiplicity produced in these processes is modeled phenomenologically in the existing Monte Carlo (MC) event generators of hadronic interactions, experimental results provide an important input for tuning of the models.
The results presented here focus on the charged-particle multiplicity density (, also referred to as the pseudorapidity distribution) corrected down to zero transverse momentum (\pt), in the pseudorapidity ranges and , where is defined as , with being the polar angle of the particle trajectory with respect to the anticlockwise-beam direction. Inclusive measurements of the and \ptdistributions of charged particles have previously been performed in pp and collisions for different centre-of-mass energies and phase space regions [3, 4, 5, 6, 7, 8, 9, 10, 11, 12, 13, 14].
In this paper, the data samples were collected with a minimum bias trigger generated by at least one arm of the TOTEM T2 telescopes, which also triggered the readout of the Compact Muon Solenoid (CMS). Three event samples with different final state topologies are selected offline: a sample of inclusive inelastic pp events, a sample dominated by non single diffractive dissociation (NSD) events, and a sample enriched in single diffractive dissociation (SD) events. The measured data are compared to the predictions of MC event generators that model pp collider data and high-energy cosmic ray hadronic interactions.
0.2 Experimental setup
The CMS and TOTEM experiments use a right-handed coordinate system, with the origin at the nominal interaction point (IP), the -axis pointing to the centre of the LHC ring, the -axis pointing upwards, and the -axis pointing along the anticlockwise-beam direction. The azimuthal angle, , is measured in the plane, where is the and is the direction.
A complete description of the CMS detector can be found in Ref. [15]. The central feature of the CMS apparatus is a superconducting solenoid of 6\unitm internal diameter, providing a uniform magnetic field of 3.8\unitT parallel to the beam axis. Inside the magnetic field are the pixel tracker, the silicon-strip tracker, the lead tungstate electromagnetic calorimeter, and the brass/scintillator hadron calorimeter. Muons are measured in gas-ionisation detectors embedded in the steel return yoke outside the solenoid. In addition to the barrel and endcap detectors, which extend up to , the steel/quartz-fibre hadron forward calorimeters (HF) cover the region . The tracking detector consists of 1440 silicon pixel and 15 148 silicon strip detector modules. The barrel is composed of 3 pixel and 10 strip layers around the interaction point at radii from 4.4 to 110\unitcm. The forward and backward endcaps each consist of 2 pixel disks and 12 strip disks in up to 9 rings. Three of the strip rings and four of the barrel strip layers contain an additional plane, with a stereo angle of 100\unitmrad, to provide a measurement of the -coordinate and -coordinate, respectively. The tracker is designed to provide a longitudinal and transverse impact parameter resolution of about 100\mumand a \ptresolution of about 0.7% for 1\GeVccharged particles at [16].
The TOTEM experiment [17, 18] is composed of three subdetectors: the Roman pots, and the T1 and T2 telescopes. Minimum bias events are triggered by the two T2 telescopes, which are placed symmetrically on each side of the IP at about 14\unitm. They detect charged particles produced in the polar angular range of 3–10\unitmrad (), with full azimuthal acceptance. Each telescope consists of two half-arms, with each half-arm composed of 10 semicircular planes of triple-GEM (gas electron multiplier) chambers, arranged within a 40\unitcm space along the -axis. Each chamber provides two-dimensional information on the track position covering 192∘ in azimuthal angle with a small vertical overlap region between chambers of two neighbouring half-arms. Every chamber has a double-layered readout board containing two columns of 256 concentric strips (400\mumpitch, 80\mumwidth) to measure the radial coordinate and a matrix of 1560 pads, each covering , to measure the azimuthal coordinate, and for triggering. The radial and azimuthal coordinate resolutions are about 110\mumand 1∘, respectively [19]. Local angles of single tracks are reconstructed with an average resolution of 0.5\unitmrad, and the track pseudorapidity resolution for charged particles is better than 0.05 [20], once the track is identified as coming from the vertex.
The detailed MC simulations of the CMS and TOTEM detectors are based on \GEANTfour [21]. Simulated events are processed and reconstructed in the same manner as collision data.
0.3 Monte Carlo models
Various MC event generators for hadronic collisions are used for data corrections and for comparison with the final, fully corrected results. The \PYTHIA6 (version 6.426) [22] generator is used with tune Z2* and \PYTHIA8 (version 8.153) [23] with tune 4C [24]. These programs provide different descriptions of the diffractive component and they both use a model [25] in which multiple partonic interactions are interleaved with parton showering. The Z2* tune [26] uses the CTEQ6L1 [27] parton distribution function (PDF) set. Tune 4C of \PYTHIA8 is based on early LHC data [24]. Parton showers in \PYTHIAare modeled according to the Dokshitzer–Gribov–Lipatov–Altarelli–Parisi (DGLAP) [28, 29, 30] prescription and hadronisation is based on the Lund string fragmentation model [31]. Diffractive cross sections are described by the Schuler–Sjöstrand model [32]. In \PYTHIA6, particle production from a low-mass state, , with \GeVccis treated as an isotropic two-body decay, while for high-mass states it is based on the string model. In \PYTHIA8, the same model is used to generate the cross section and the diffractive mass, but particle production is modeled differently. For low-mass states, the string model is used, but for higher masses (\GeVcc) a perturbative description of pomeron-proton scattering is introduced, based on diffractive PDFs [33, 34, 35], which represent probability distributions for partons in the proton under the constraint that the proton emerges intact from the collision. The non-perturbative string model introduces a mass dependence on the relative probability for a pomeron to couple to a quark or a gluon [36]. The perturbative treatment of pomeron-proton scattering results in harder \ptspectra and higher multiplicity for diffractive events generated with \PYTHIA8 than for those obtained with \PYTHIA6.
The \HERWIGpp(version 2.5.0) [37] MC event generator, with a recent tune to LHC data (UE-EE-3 with CTEQ6L1 PDFs [27, 38]), is also used for comparison with the data. This generator is based on matrix element calculations similar to those used in \PYTHIA. However, \HERWIGppfeatures DGLAP based parton showers ordered in angle and uses cluster fragmentation for the hadronisation [39]. The description of hard diffractive processes also makes use of diffractive PDFs; however soft diffraction is not implemented.
The data are also compared to predictions from two MC event generators used in cosmic ray physics [40]: epos [41] with the LHC tune (based on epos 1.99) [42] and qgsjetII-04 [43]. Both models include contributions from soft- and hard-parton dynamics. The soft component is described in terms of the exchange of virtual quasi-particle states, as in Gribov’s Reggeon field theory [44], with multi-pomeron exchanges accounting for underlying-event effects. At higher energies, the interaction is described in terms of the same degrees of freedom, but generalised to include hard processes via hard-Pomeron scattering diagrams, which are equivalent to a leading-order perturbative Quantum Chromodynamics (QCD) approach with DGLAP evolution. These models are retuned to LHC data [45], including cross section measurements by TOTEM, and charged-particle multiplicity measurements in the central region, by ALICE and CMS, at \TeV.
0.4 Datasets
The data were collected in July 2012 during a dedicated run with low probability (4%) of overlapping pp interactions in the same bunch crossing (pileup) and a non-standard = 90\unitm optics configuration, where is the amplitude function of the beam at the interaction point. These data correspond to an integrated luminosity of . A minimum bias trigger was provided by the TOTEM T2 telescopes and contributed to the CMS global trigger decision, which initiated simultaneous readout of both the CMS and TOTEM detectors. The CMS orbit-counter reset signal delivered to the TOTEM electronics at the start of the run assures the time synchronisation of the two experiments. Events are combined offline by requiring that both the CMS and TOTEM reconstructed events have the same LHC orbit and bunch numbers. The minimum bias trigger required at least one track candidate (trigger track) in the T2 detector, in either -direction [46]. With this selection the visible cross section seen by T2 has been estimated to be 91–96% of the total pp inelastic cross section at \TeV [47]. Zero bias data, obtained by triggering on random bunch crossings, are used to measure the trigger efficiency and to cross-check the pileup probability estimate.
MC samples were used to determine the event selection efficiency and the tracking performance. The efficiency corrections and related uncertainties for the CMS tracker are based on the \PYTHIA6 and epos samples. The MC-based corrections for the TOTEM T2 detector and the corresponding uncertainties were determined by using \PYTHIA8 and epos, which were found to bracket the measured distributions in the forward region.
0.5 Event selection and track reconstruction
The T2 track reconstruction is based on a Kalman filter-like algorithm, simplified thanks to the small amount of material in the GEM planes and the weak magnetic field in the T2 region [20]. In these conditions, the particle trajectory can be successfully reconstructed with a straight-line fit. Single tracks are reconstructed with almost 100% efficiency for , but because of multiple scattering and the magnetic field, tracks can be identified as coming from the IP with an efficiency that increases as a function of \ptand is greater than 80% for [18]. The pseudorapidity of a track in T2 is defined as the average pseudorapidity of all T2 track hits, calculated from the angle between the -axis and the line joining the hit and the nominal IP. This definition is adopted on the basis of MC simulation studies and gives an optimal estimation of the pseudorapidity of the selected primary (\ieproduced at the IP) particle. Because of the small scattering angle of the particles reconstructed in T2, the position of the vertex does not affect significantly the reconstruction of the track pseudorapidity. Due to the limited number of primary particles in T2 per event, no vertex reconstruction based on T2 information is used for the analysis. The pseudorapidity region is not included in the analysis because of the large effect that the beam pipe cone at has on the propagation of the primary particles.
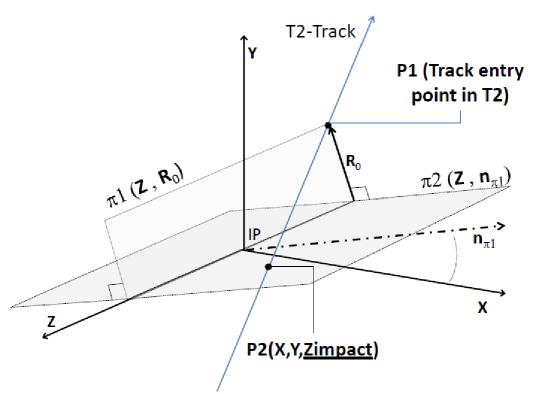
About 80% of the reconstructed tracks in T2 are due to non-primary particles, hereafter referred to as secondary particles, that are mainly electrons and positrons generated by photon conversions at the edge of the HF calorimeter of CMS and in the conical section of the beam pipe at . It is therefore important to discriminate these particles from the primary charged particles. The most effective primary/secondary particle separation is achieved by using the track parameter (see Fig. 1), which is defined as the coordinate of the intersection point between the track and the plane “2”. This is the plane which contains the -axis and is orthogonal to the plane “1” defined by the -axis and containing the track entry point in T2 [9]. This parameter is found to be stable against residual misalignment biases.
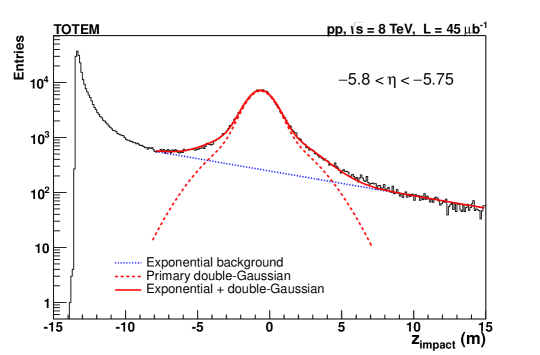
Simulation studies demonstrate that the distribution in the primary-particle region can be described by the sum of two Gaussian distributions plus an exponential distribution. The Gaussians, hereafter referred to as a “double-Gaussian” distribution, are mainly due to primary particles, whereas the exponential distribution accounts for most secondary particles. Simulations predict a contamination of the double-Gaussian distribution by secondary particles of about 20%, primarily given by photons converted in the material between the IP and T2, with a contribution from decay products of strange particles; the distribution of these particles is a Gaussian centred around .
Figure 2 shows the distribution at the median of the inclusive forward pseudorapidity distribution. A combined fit is performed for each bin of the distribution with the sum of a double-Gaussian and an exponential function, yielding standard deviations (amplitudes) of both Gaussian functions that increase (decrease) with . The mean, required to be the same for both Gaussian distributions, the standard deviations, and the amplitudes of the two Gaussian functions, as well as the mean and the amplitude of the exponential, are left free in the fit. The widths of the double-Gaussian distributions are consistent with the observed angular resolution of about 0.5\unitmrad for the T2 track reconstruction. The relative abundance of secondary particles is found to be smaller for higher . The fit of the distribution is also repeated by using a second degree polynomial for the description of the background. The results are found to be stable with respect to the choice of the background function. The integral of the fitting function approximates the area of the distribution to within 1%.
The T2 tracks are considered “primary candidates” if they are in the range corresponding to 96% of the area of the double-Gaussian, taken symmetrically around the mean.
The standard CMS track reconstruction algorithm is based on a combinatorial track finder (CTF) [16]. The collection of reconstructed tracks is produced by multiple iterations of the CTF track reconstruction sequence, in a process called iterative tracking. The reconstruction of the interaction vertices in the event uses the available reconstructed track collection. Prompt tracks are selected based on given quality criteria, and the selected tracks are then clustered in using a “deterministic annealing” (DA) algorithm [48]. After identifying candidate vertices based on the DA clustering, the candidates containing at least two tracks are fitted by means of an adaptive vertex fit, where tracks in the vertex are assigned a weight between 0 and 1 based on their compatibility with the common vertex. In the central region, covered by the CMS tracker, high-purity primary tracks [49] are selected with \GeVcand relative \ptuncertainty less than 10%. To maximise the track-vertex association efficiency, a selection is applied on the track impact parameter, both along the -axis and in the transverse plane. The impact parameter with respect to the beam spot in the transverse plane, , is required to be , while for the point of closest approach to the primary vertex along the -direction, , the requirement is imposed. Here and denote the uncertainties in and , respectively. The analysis is restricted to , to avoid effects from tracks close to the geometric edge of the tracker. Events with more than one reconstructed vertex are discarded, thus reducing the effect of pileup to a negligible level (%).
The pseudorapidity distributions of the charged particles are measured in the central and forward regions for three different event samples, with topologies corresponding to three different event selection criteria. An inclusive sample of events is selected by requiring at least one primary track candidate in T2. Event samples enhanced in non single diffractive dissociation (NSD) and single diffractive dissociation (SD) events are also selected, the former defined by requiring a least one primary candidate in each of the two T2 telescopes and the latter by selecting events with at least one primary candidate in one T2 telescope and none in the other. Therefore, the intersection of the NSD-enhanced and SD-enhanced samples is empty, while the union is the inclusive sample.
The inclusive sample includes 99% of non-diffractive events. The reconstruction efficiency for diffractive events is 50% for a diffractive mass \GeVccand increases rapidly to 99% for \GeVcc. Most of the non-diffractive and double diffractive events, as well as the single diffractive events with masses larger than 1.3\TeVcc, produce particles in both T2 telescopes and are therefore included in the NSD-enhanced sample. Simulation studies based on \PYTHIA8 and epos show that the fraction of NSD events in the SD-enhanced sample amounts to 45–65%.
0.6 Data analysis
The pseudorapidity density measurements presented here refer to “stable” primary charged particles, with an average lifetime longer than s, either directly produced in pp collisions or from decays of particles with shorter lifetimes. Such a definition, consistent with that of previous studies [3, 4, 5, 6, 7, 9], considers as secondary particles the decay products of \PKzS and \PgL hadrons and all of the charged particles generated by interactions with the material in front and around the detectors.
0.6.1 Trigger efficiency correction
The trigger efficiency is determined with a zero bias event sample separately for events with primary track candidates reconstructed offline in both arms of T2 and in only one arm. All zero bias data taken were used to determine the trigger inefficiency. The inefficiency of the trigger is mainly due to non-operating and noisy channels. For each event category, the trigger efficiency is calculated as a function of the total number of tracks reconstructed offline in T2, , as = , where is the number of events with the total T2 track multiplicity passing the trigger selection and is the number of events with tracks selected with the zero bias trigger. The measured trigger efficiency is shown in Fig. 3.
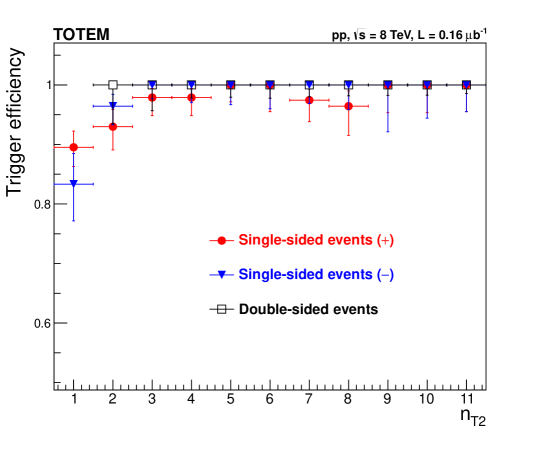
The trigger efficiency correction, , is applied separately for the three event categories and is significant for events with , while it approaches unity for . The overall trigger inefficiency results in a 0.1–0.2% relative correction to the total distributions for the three event categories. The value of the associated systematic uncertainty is conservatively assumed to be equal to this relative correction.
0.6.2 Event selection correction
In order to take into account the differences between the sample defined at the MC-particle level (“gen selected”) and the one selected based on the reconstructed tracks (“reco selected”), a correction factor needs to be introduced. This correction is calculated for each bin and event category from the ratio
| (1) |
where the numerator is the pseudorapidity density obtained from the MC simulation for events selected based on the charged particles within the T2 acceptance, while the denominator is the density obtained by selecting the simulated events according to the topology of the primary candidates in T2, as explained in Section 5. In general, is different from unity because of migrations between the different event categories. Because of misidentification of secondary particles as primaries and of track reconstruction inefficiencies, an event can be classified (according to the configuration of its reconstructed tracks) in a category that does not reflect its true charged-particle content.
For the inclusive and NSD-enhanced analysis, is evaluated with \PYTHIA8 and epos. Moreover, to quantify possible biases related to this correction, the analyses are repeated with the same selection method defined in Section 0.5 but without the primary candidate requirement.
As the SD-enhanced multiplicity is smaller than the NSD-enhanced multiplicity, a larger selection inefficiency is expected for the former class of events. Moreover, as the SD-enhanced sample represents only 26% of the inclusive sample, the NSD events that are wrongly identified as SD can introduce a large bias in the measured SD-enhanced distributions. Additional studies of the event selection strategy for the SD-enhanced analysis are therefore performed. The analysis is repeated with different event selection strategies and is reevaluated for each as a function of and of the track multiplicity in T2. The selection methods differ in the maximum number of tracks and of primary candidates reconstructed in T2 on each side of the IP. Simulation studies show that, depending on the method and the MC generator used, the selection efficiency is in the range of 70–90%. The purity of the SD-enhanced sample, defined as the fraction of the selected events with primary charged particles in only one arm of T2, varies between 66% and 81%. The dependence of the SD-enhanced distributions on the selection methods is used to evaluate the systematic uncertainty related to the event selection. More details on the numerical values of are given in Sections 0.6.3 and 0.6.4.
0.6.3 Measurement of in the central region
The charged particle pseudorapidity distributions in the central region are obtained from the raw distributions of charged tracks after applying a number of corrections according to the formula:
| (2) |
where is the sample of tracks that pass the selection criteria for a given bin, and is the total number of reconstructed tracks in the CMS tracker and T2, respectively, is the number of triggered events in the corresponding track multiplicity bins, corrects for the trigger and the vertex reconstruction efficiencies, corrects for the tracking efficiency and the effect of non-primary tracks, and corrects for the effect of the event and primary track selection with T2. The bin width in is .
The event correction, , depends on the track multiplicity in T2, , as well as on the multiplicity in the CMS tracker because of the minimum number of tracks required in the vertex reconstruction. It is given by:
| (3) |
where is the trigger efficiency (Fig. 3) and is the primary vertex reconstruction and selection efficiency, calculated with \PYTHIA6 as the ratio of the number of reconstructed events satisfying the primary vertex selection to the total number of generated events.
The correction for the tracking efficiency and non-primary tracks, , is defined as:
| (4) |
Here, corrects for the geometric detector acceptance and the reconstruction tracking efficiency; the correction factor accounts for the fraction of non-primary tracks, \iesecondary and misidentified tracks, while corrects for the effect of single charged particles that are reconstructed multiple times. These quantities are obtained from a detector simulation in bins of , \pt, and . The effect of bin migrations is found to be negligible. Reconstructed events are required to pass the event selection and the generated particles are matched to the reconstructed tracks by using spatial and momentum information.
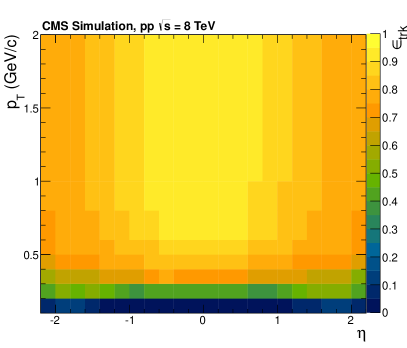
The tracking efficiency, , is determined as the ratio of the number of all reconstructed tracks that are matched to generated particles and satisfy the track selection criteria in an () bin to the number of generated primary charged particles in that bin. As shown in Fig. 4 (Left), approaches unity for tracks with \GeVcand .
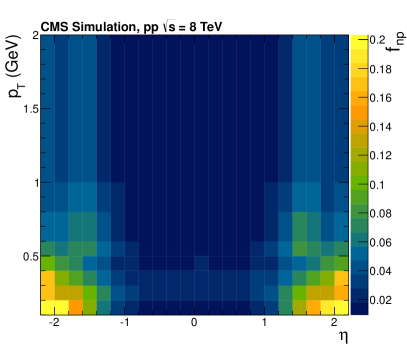
The correction for non-primary tracks, , is estimated as the ratio of the number of reconstructed tracks not matched to a generated primary particle in a bin to all reconstructed tracks in that bin. The correction varies as a function of and \ptof the tracks, as shown in Fig. 4 (Right), and reaches its lowest values of about 2% for and \GeVc. It becomes as large as 20% at very low transverse momentum (\GeVc) and large pseudorapidity ().
The correction factor for multiply reconstructed particles, , is estimated as the ratio of the number of generated primary charged particles that are associated to multiply reconstructed tracks in a given , \pt, bin to the number of generated charged particles in that bin. It is found to be below 1%.
The model dependence of the corrections is determined by using \PYTHIA6, epos, and \PYTHIA8. The corrected data, based on correction factors derived from each generator independently, are found to differ by 1–4% depending on the pseudorapidity bin. This amount is taken as a systematic uncertainty.
The average correction factor for the event selection, , defined in Section 0.6.2, is found to be 1.01, 1.025, and 0.94 for the inclusive, NSD-enhanced, and SD-enhanced samples, respectively, independent of pseudorapidity. The correction factor is obtained from epos and \PYTHIA8. The average value of the correction factors from the two generators is applied to the data, while the relative difference between the two generators is taken as a systematic uncertainty. In addition, the event selection bias and the corresponding systematic uncertainty is estimated for each bin as described in Section 0.6.2 by comparing the pseudorapidity distributions obtained with different methods. For the inclusive and NSD-enhanced samples, the systematic uncertainty in the event selection is found to be 3–5% and 4–6%, respectively, while for the SD-enhanced sample it is 9–16%.
Corrections of 4–6% are applied to the final results to extrapolate to \pt = 0. The corrections are determined from the spectrum of primary charged particles predicted by \PYTHIA6 and \PYTHIA8. The corrections obtained from the two MC generators differ by about 3%, resulting in a systematic uncertainty in the distributions of about 0.2%. The same corrections are also estimated from Tsallis fits [50] to the \ptdistributions for each bin, giving consistent results.
A summary of the systematic uncertainties is given in Table 0.6.3. The uncertainties associated with the tracking efficiency are treated as uncorrelated between the bins. For the inclusive and the NSD-enhanced samples, the most significant systematic uncertainties are those due to the uncertainty in the tracking efficiency and the event selection. The model dependence of and the uncertainty in the event selection are dominant for the SD-enhanced sample. The total uncertainty in the tracking efficiency is estimated to be 3.9% from a comparison of two-body and four-body \PDz decays in data and simulated samples [51]. The uncertainties related to the primary vertex selection, the trigger efficiency, and pileup events are found to be around 0.1% and are neglected.
Systematic and statistical uncertainties of the measurement in the central region. The given ranges indicate the dependence of the uncertainties. Source Inclusive NSD-enhanced SD-enhanced Event and primary track selection () 3–5% 4–6% 9–16% Tracking efficiency 3.9% 3.9% 3.9% Trigger efficiency 0.1% 0.1% 0.1% Model dependence of track corrections () 1–4% 1–4% 1–4% Correction to 0.2% 0.2% 0.2% Statistical 0.1% 0.1% 0.1% Total 5–7% 6–8% 10–17%
0.6.4 Measurement of in the forward region
The pseudorapidity density in the forward region is measured for each T2 half-arm independently, thus providing a consistency check, as each half-arm differs in its alignment and track reconstruction efficiency. The number of primary track candidates passing the parameter selection criteria is calculated for each bin as a function of the -value with the double-Gaussian and exponential fits described in Section 0.5. The fraction of tracks associated to the double-Gaussian distribution core ranges from about 74% (lower bins) to about 92% (higher bins), and is used to weight each track by the probability for the track to be primary.
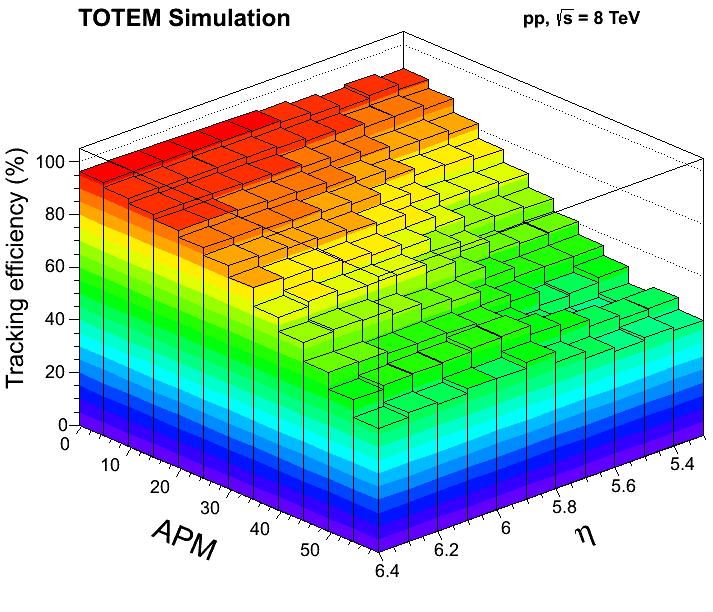
Each track is also weighted by the primary track efficiency, which depends on and on the average pad cluster multiplicity (APM) per plane in the corresponding half-arm. This efficiency, evaluated from MC generators, is defined as the probability to successfully reconstruct, with a parameter within the allowed region, a generated primary particle that falls within the acceptance of the detector. As shown in fig. 5 for one of the T2 half-arms, the tracking efficiency decreases with increasing APM, since the reconstruction of tracks with sufficient number of hits becomes more difficult with larger occupancy. The average primary track efficiency ranges from about 73% (lower bins) to about 87% (higher bins), as shown in Fig. 5 for one of the T2 half-arms.
The APM probability is a rapidly decreasing distribution, with and , for the inclusive selection. The rate of multiple associations of reconstructed tracks to the primary particle is negligible (0.4%) once the requirement is imposed.
Conversion of photons from \Pgpz decays in the material between the IP and T2, as well as decay products of strange particles, also contribute to the double-Gaussian peak. The overall non-primary contribution, to be subtracted from the double-Gaussian peak, was estimated as a function of with \PYTHIA8, epos, and sibyll 2.1 [52]. The first two generators bracket the data in the forward region, while sibyll is introduced to also enclose the measurements from the LHCf experiment of the photon distribution [53]. The value of this correction is about 18% and is obtained as the average of the three MC predictions.
The correction factors for the event selection bias () are about 1.05, 1.06, and 1.00 for the inclusive, NSD-enhanced, and SD-enhanced event samples, respectively.
Bin migration effects in are corrected for with \PYTHIA8, which gives the best description of the slope of the measured distribution. The effects are typically at the few percent level.
Events characterised by a high T2 hit multiplicity, typically due to showers generated by particles interacting with the material before T2, are not included in the analysis. These events, for which track reconstruction capability is limited, are characterised by an APM value larger than 60 and constitute 13.5%, 16.5%, and 6.3% of the inclusive, NSD-enhanced, and SD-enhanced samples, respectively. The effect of removing these events is evaluated in a MC study, which yields overall correction factors of about 1.05, 1.04, and 1.06 for the inclusive, NSD-enhanced, and SD-enhanced samples, respectively. To verify the stability of this correction, the analysis is also repeated after excluding events with APM values larger than 45 and re-evaluating the corresponding MC corrections. The results of the two analyses agree within 1%. In addition, this correction is also estimated by extrapolating the measured average multiplicity obtained as a function of the maximum APM included in the sample and without correcting for the missing fraction of the sample. The extrapolation, performed with a second degree polynomial, gives a correction that is within the MC uncertainty.
The fully corrected distributions in each bin are determined from:
| (5) |
where is the sample of tracks with satisfying the selection criteria above, is the bin width, is the correction factor related to the event selection defined in Section 0.6.2, is the bin migration correction associated with the th bin in . In addition, is the azimuthal acceptance of each T2 half-arm, is the trigger efficiency correction, is the number of selected events with track multiplicity , and is defined as:
| (6) |
where is the probability for a track to be primary. Here, is the primary track efficiency, is the correction factor for the non-primary contribution to the double-Gaussian peak, and is the correction factor for the exclusion of events with APM values above 60.
The distribution thus obtained refers to charged particles with \MeVc, corresponding to the nominal acceptance of T2. A MC-based estimation obtained with epos LHC and \PYTHIA8 4C is used to correct the measurement down to . This correction, taken from the average of the two MC predictions, is about 2%.
The evaluation of the systematic uncertainties for the distributions is performed similarly to that discussed in [9]. Details are given in the following only for the most significant contributions.
The systematic uncertainty in the function, which is of order 4–5%, is evaluated by including four effects: (a) the sensitivity to the misalignment corrections, quantified by varying the corrections within their uncertainties, (b) the sensitivity to the parameter fitting range, which was changed by either one or two meters depending on the bin, (c) the sensitivity to the background parametrisation, obtained by replacing the exponential function with a second degree polynomial, and (d) the difference between the area estimated by the fitting function and the integral of the distribution.
The systematic uncertainty in the primary-track efficiency is evaluated in studies where tracks are reconstructed with a set of five detector planes (out of the total of ten) in a single T2 half-arm. The track reconstruction efficiency is determined with the other set of detector planes in the same half-arm. The 5–6% difference between the results obtained from simulation and from data is taken as an estimate of the systematic uncertainty.
The systematic uncertainty due to non-primary tracks included in the double-Gaussian once the exponential contribution has been removed, , is evaluated by considering the range of the predictions of the epos, \PYTHIA8, and sibyll MC generators, and is about 5%.
The uncertainty in the correction for the exclusion of events with high secondary-particle multiplicity () is taken as the difference between the epos and \PYTHIA8 predictions, which is about 3%. The uncertainty on the correction for the event selection () is evaluated by taking into account both the dependence of the correction from the MCs mentioned above and the dependence of the results on the different event selection strategies discussed earlier. This uncertainty is 13–15% for the SD-enhanced sample and 2–3% for the inclusive and NSD-enhanced samples.
The possible bias due to the material uncertainty and therefore on the production of secondary tracks is evaluated as a function of from the MC vs. data discrepancy of the ratio between the number of tracks contained in the 96% double-Gaussian area and all the tracks in the same range. The average discrepancy is in the range of 2–6%. Simulation studies are also performed by varying the thickness of the material in front of T2 by 40%. This part of the material is the main source of secondary tracks that contribute to the double-Gaussian. The effect of the change of the material results in a possible bias of less than 3%.
Table 0.6.4 shows the uncertainties due to the corrections.
Systematic and statistical uncertainties of the measurement with the T2 detector in the forward region. The first two contributions are half-arm dependent and partly -uncorrelated, while the remaining, excluding the statistical one, are half-arm independent and correlated across bins in . The given ranges indicate the dependence of the uncertainties. Source Inclusive NSD-enhanced SD-enhanced Tracking efficiency data-MC discrepancy 5–6% 5–6% 5–6% Primary selection (including alignment) 4–5% 4–5% 4–5% Non-primaries in the double-Gaussian peak 5% 5% 5% Material effects 3–6% 3–6% 3–6% High-multiplicity events 3% 3% 3% Event selection 2–3% 2–3% 13–15% Tracking efficiency dependence 2% 2% 2% on energy spectrum and magnetic field Track quality criterion 1% 1% 1% Correction to 0.5% 0.5% 0.5% Trigger efficiency 0.2% 0.2% 0.2% Statistical 0.1% 0.1% 0.1% Total (after averaging half-arms) 10–12% 10–12% 16–18%
To compute the total systematic uncertainty the errors are first separated into half-arm-correlated and uncorrelated parts and a weighted average between the four half-arms is taken. The measurements obtained for the different T2 half-arms are found to be compatible.
The first two systematic uncertainties in Table 0.6.4 vary as a function of and contribute to the uncorrelated bin-by-bin uncertainties. Conversely, the remaining systematic uncertainties affect all bins in the same direction. The effect that systematic uncertainties might introduce in the difference of the values at the beginning and at the end of the T2 acceptance is estimated to be at most 7%.
The total uncertainty is obtained by adding in quadrature the -correlated uncertainty and the -uncorrelated one and the (negligible) statistical uncertainty.
0.7 Results
The combined CMS-TOTEM charged particle pseudorapidity distributions are presented in Fig. 6 for the three event selection samples shown in Table 0.7. The results are derived in the central region by averaging the data points in the corresponding bins and in the forward region by averaging over the four T2 half-arms. The uncertainty band represents the total uncertainty, while the bars show the statistical and uncorrelated systematics between neighbouring bins.
Event selection criteria applied at the stable-particle level in the MC simulation. Inclusive sample in or , NSD-enhanced sample in and , SD-enhanced sample in only or only in ,
In the central region, the pseudorapidity density at is for the inclusive sample, for the NSD-enhanced sample, and for the SD-enhanced sample, with negligible statistical uncertainties. The predictions from various MC event generators differ from the data by up to 20% for the inclusive and NSD-enhanced samples, with even larger discrepancies for the SD-enhanced sample. The data are well described by \PYTHIA6 and qgsjetII-04 for the inclusive selection. For the NSD-enhanced sample, the predictions obtained from \PYTHIA6 and qgsjetII-04 agree with the data for most bins. A good description of the measurement for the SD-enhanced sample is provided by both epos and \PYTHIA6.
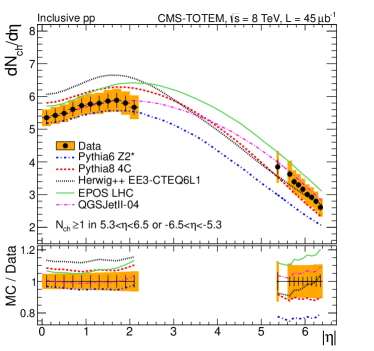
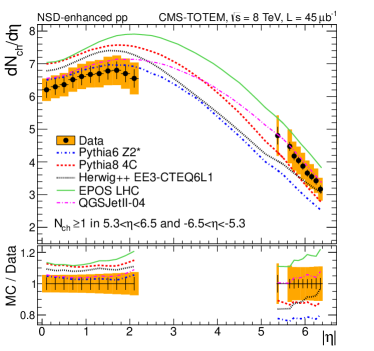
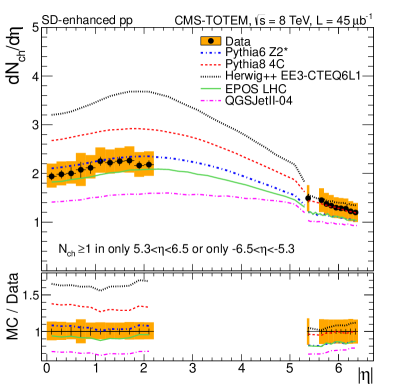
The forward pseudorapidity density decreases with . In the inclusive sample, is at and at , with negligible statistical uncertainty. The pseudorapidity density of the NSD-enhanced sample ranges between and , while for the SD-enhanced sample it is in the range of to . The MC predictions for the three samples differ from the data by up to about 30%. For the inclusive and NSD-enhanced samples, the data in the forward region are in agreement with the prediction from qgsjetII-04 and are between the epos and \PYTHIA8 results. For the SD-enhanced selection, the TOTEM data points are close to the \PYTHIA8 and \HERWIGpppredictions, while qgsjetII-04 underestimates the data. The change in the slope of the MC curves close to , more visible for the NSD- and SD-enhanced distributions, is due to the event selection requirement of at least one charged particle in the pseudorapidity region of T2.
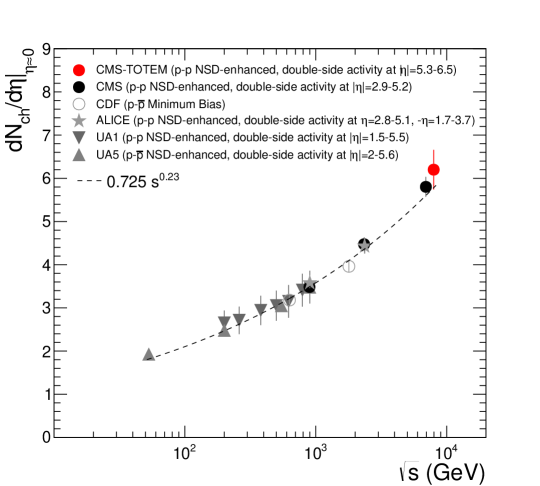
The centre-of-mass energy dependence of the pseudorapidity distribution at is shown in Fig. 7, which includes data from various other experiments for NSD events in pp and pp̄ collisions. Although the different experiments do not use identical event selection criteria, they all include a large fraction of NSD events. Particle production at is expected to follow a power-law dependence, , with in the range 0.14–0.24 [40]. The result of fitting the high-energy pp and central-pseudorapidity particle densities with this function is shown in Fig. 7. A value of is obtained.
0.8 Summary
Measurements of charged-particle densities over a large pseudorapidity range are presented for proton-proton (pp) collisions at a centre-of-mass energy of 8\TeV. The data were collected concurrently with the CMS and TOTEM detectors during a dedicated run with low probability for overlapping pp interactions in the same bunch crossing, and correspond to an integrated luminosity of . Pseudorapidity distributions of charged particles within and have been measured for three event samples with different final state topologies: a sample of inclusive inelastic pp events, a sample dominated by non single diffractive dissociation (NSD) events, and a sample enriched in single diffractive dissociation (SD) events. The data are compared to theoretical predictions obtained from five different MC event generators and tunes (\PYTHIA6 Z2*, \PYTHIA8 4C, \HERWIGppUE-EE-3, epos LHC tune, and qgsjetII-04).
In the central region, the inclusive and NSD-enhanced samples are well described by \PYTHIA6 and qgsjetII. For the SD-enhanced sample a good description of the data is provided by both \PYTHIA6 and epos. In the forward region, the pseudorapidity distributions for the inclusive and NSD-enhanced samples are between the \PYTHIA8 and epos predictions. The qgsjetII predictions are compatible with the data. The pseudorapidity distribution in the SD-enhanced sample, affected by a larger systematic uncertainty, is best described by \PYTHIA8 and \HERWIGpp.
The charged-particle densities obtained in this paper span the largest pseudorapidity interval ever measured at the LHC and have the unique potential to probe the correlation between particle production in the central region and that in the forward region. With the tunes used, none of the MC event generators are able to consistently describe the data over the whole region and for all event samples.
Acknowledgements
We congratulate our colleagues in the CERN accelerator departments for the excellent performance of the LHC. We especially thank the beam optics development team for the design and the successful commissioning of the high -optics and the LHC machine coordinators for scheduling the dedicated fills. We are grateful to the technical and administrative staffs at CERN and at other CMS and TOTEM institutes for their contributions to the success of the CMS and TOTEM efforts. In addition, we gratefully acknowledge the computing centres and personnel of the Worldwide LHC Computing Grid for delivering so effectively the computing infrastructure essential to our analyses. We acknowledge the enduring support for the construction and operation of the LHC and the CMS and TOTEM detectors provided by our affiliated institutions as included in the lists of authors and the following funding agencies: the Austrian Federal Ministry of Science, Research and Economy and the Austrian Science Fund; the Belgian Fonds de la Recherche Scientifique, and Fonds voor Wetenschappelijk Onderzoek; the Brazilian Funding Agencies (CNPq, CAPES, FAPERJ, and FAPESP); the Bulgarian Ministry of Education, Youth and Science; CERN; the Chinese Academy of Sciences, Ministry of Science and Technology, and National Natural Science Foundation of China; the Colombian Funding Agency (COLCIENCIAS); the Croatian Ministry of Science, Education and Sport, and the Croatian Science Foundation; the Research Promotion Foundation, Cyprus; the Ministry of Education and Research, Estonian Research Council via IUT23-4 and IUT23-6 and European Regional Development Fund, Estonia; the Academy of Finland, Finnish Ministry of Education and Culture, and Helsinki Institute of Physics; the Institut National de Physique Nucléaire et de Physique des Particules / CNRS, and Commissariat à l’Énergie Atomique et aux Énergies Alternatives / CEA, France; the Bundesministerium für Bildung und Forschung, Deutsche Forschungsgemeinschaft, and Helmholtz-Gemeinschaft Deutscher Forschungszentren, Germany; the General Secretariat for Research and Technology, Greece; the National Scientific Research Foundation, National Innovation Office, and the OTKA grant NK 101438, 73143, Hungary; the Department of Atomic Energy and the Department of Science and Technology, India; the Institute for Studies in Theoretical Physics and Mathematics, Iran; the Science Foundation, Ireland; the Istituto Nazionale di Fisica Nucleare, Italy; the Korean Ministry of Education, Science and Technology and the World Class University program of NRF, Republic of Korea; the Lithuanian Academy of Sciences; the Ministry of Education, and University of Malaya (Malaysia); the Mexican Funding Agencies (CINVESTAV, CONACYT, SEP, and UASLP-FAI); the Ministry of Business, Innovation and Employment, New Zealand; the Pakistan Atomic Energy Commission; the Ministry of Science and Higher Education and the National Science Centre, Poland; the Fundação para a Ciência e a Tecnologia, Portugal; JINR (Armenia, Belarus, Georgia, Ukraine, Uzbekistan); the Ministry of Education and Science of the Russian Federation, the Federal Agency of Atomic Energy of the Russian Federation, Russian Academy of Sciences, and the Russian Foundation for Basic Research; the Ministry of Education, Science and Technological Development of Serbia; the Secretaría de Estado de Investigación, Desarrollo e Innovación and Programa Consolider-Ingenio 2010, Spain; the Swiss Funding Agencies (ETH Board, ETH Zurich, PSI, SNF, UniZH, Canton Zurich, and SER); the Ministry of Science and Technology, Taipei; the Thailand Center of Excellence in Physics, the Institute for the Promotion of Teaching Science and Technology of Thailand, Special Task Force for Activating Research and the National Science and Technology Development Agency of Thailand; the Scientific and Technical Research Council of Turkey, and Turkish Atomic Energy Authority; the National Academy of Sciences of Ukraine, and State Fund for Fundamental Researches, Ukraine; the Science and Technology Facilities Council, UK; the US Department of Energy, and the US National Science Foundation.
Individuals have received support from the Marie-Curie programme and the European Research Council and EPLANET (European Union); the Leventis Foundation; the A. P. Sloan Foundation; the Alexander von Humboldt Foundation; the Belgian Federal Science Policy Office; the Fonds pour la Formation à la Recherche dans l’Industrie et dans l’Agriculture (FRIA-Belgium); the Agentschap voor Innovatie door Wetenschap en Technologie (IWT-Belgium); the Ministry of Education, Youth and Sports (MEYS) of the Czech Republic; the Magnus Ehrnrooth foundation and the Waldemar von Frenckell foundation, Finland; the Finnish Academy of Science and Letters (The Vilho, Yrjö and Kalle Väisälä Fund), and the Charles Simonyi Fund (Hungary); the Council of Science and Industrial Research, India; the Compagnia di San Paolo (Torino); the HOMING PLUS programme of Foundation for Polish Science, cofinanced by EU, Regional Development Fund; and the Thalis and Aristeia programmes cofinanced by EU-ESF and the Greek NSRF.
References
- [1] S. Ostapchenko, “On the model dependence of the relation between minimum-bias and inelastic proton-proton cross sections”, Phys. Lett. B 703 (2011) 588, 10.1016/j.physletb.2011.08.050, arXiv:1103.5684.
- [2] ALICE Collaboration, “Measurement of inelastic, single- and double-diffraction cross sections in proton–proton collisions at the LHC with ALICE”, Eur. Phys. J. C 73 (2013) 2456, 10.1140/epjc/s10052-013-2456-0, arXiv:1208.4968.
- [3] CMS Collaboration, “Transverse momentum and pseudorapidity distributions of charged hadrons in pp collisions at = 0.9 and 2.36 TeV”, JHEP 02 (2010) 041, 10.1007/JHEP02(2010)041.
- [4] CMS Collaboration, “Transverse-momentum and pseudorapidity distributions of charged hadrons in pp collisions at = 7 TeV”, Phys. Rev. Lett. 105 (2010) 022002, 10.1103/PhysRevLett.105.022002.
- [5] ATLAS Collaboration, “Charged-particle multiplicities in pp interactions measured with the ATLAS detector at the LHC”, New J. Phys. 13 (2011) 053033, 10.1088/1367-2630/13/5/053033.
- [6] ALICE Collaboration, “Charged-particle multiplicity measurement in proton-proton collisions at = 0.9 and 2.36 TeV with ALICE at LHC”, Eur. Phys. J. C 68 (2010) 89, 10.1140/epjc/s10052-010-1339-x.
- [7] ALICE Collaboration, “Charged-particle multiplicity measurement in proton–proton collisions at = 7 TeV with ALICE at LHC”, Eur. Phys. J. C 68 (2010) 345, 10.1140/epjc/s10052-010-1350-2.
- [8] LHCb Collaboration, “Measurement of charged particle multiplicities in pp collisions at = 7 TeV in the forward region”, Eur. Phys. J. C 72 (2012) 1947, 10.1140/epjc/s10052-012-1947-8.
- [9] TOTEM Collaboration, “Measurement of the forward charged-particle pseudorapidity density in pp collisions at = 7 TeV with the TOTEM experiment”, Europhys. Lett. 98 (2012) 31002, 10.1209/0295-5075/98/31002.
- [10] CDF Collaboration, “Measurement of particle production and Inclusive Differential Cross Sections in pp̄ Collisions at TeV”, Phys. Rev. D 79 (2009) 112005, 10.1103/PhysRevD.79.112005. [Erratum \DOI10.1103/PhysRevD.82.119903].
- [11] CDF Collaboration, “Pseudorapidity distributions of charged particles produced in pp̄ interactions at = 630 GeV and 1800 GeV”, Phys. Rev. D 41 (1990) 2330, 10.1103/PhysRevD.41.2330.
- [12] UA1 Collaboration, “A study of the general characteristics of proton-antiproton collisions at = 0.2 to 0.9 TeV”, Nucl. Phys. B 335 (1990) 261, 10.1016/0550-3213(90)90493-W.
- [13] UA4 Collaboration, “Pseudorapidity distribution of charged particles in diffraction dissociation events at the CERN SPS collider”, Phys. Lett. B 166 (1986) 459, 10.1016/0370-2693(86)91598-4.
- [14] UA5 Collaboration, “Scaling of pseudorapidity distributions at c.m. energies up to 0.9 TeV”, Z. Phys. C 33 (1986) 1, 10.1007/BF01410446.
- [15] CMS Collaboration, “The CMS experiment at the CERN LHC”, JINST 3 (2008) S08004, 10.1088/1748-0221/3/08/S08004.
- [16] CMS Collaboration, “Track and vertex reconstruction in CMS”, Nucl. Inst. Meth. A 582 (2007) 781, 10.1016/j.nima.2007.07.091.
- [17] TOTEM Collaboration, “The TOTEM Experiment at the CERN Large Hadron Collider”, JINST 3 (2008) S08007, 10.1088/1748-0221/3/08/S08007.
- [18] TOTEM Collaboration, “Performance of the TOTEM Detectors at the LHC”, Int. J. Mod. Phys. A 28 (2013) 1330046, 10.1142/S0217751X13300469, arXiv:1310.2908.
- [19] M. Bagliesi et al., “The TOTEM T2 telescope based on triple-GEM chambers”, Nucl. Inst. Meth. A 617 (2010) 134, 10.1016/j.nima.2009.07.006.
- [20] M. Berretti, “Measurement of the forward charged particle pseudorapidity density in pp collisions at = 7 TeV with the TOTEM experiment”. PhD thesis, Siena, 2012. CERN-THESIS-2012-231, chap. 3.
- [21] GEANT4 Collaboration, “GEANT4—a simulation toolkit”, Nucl. Inst. Meth. A 506 (2003) 250, 10.1016/S0168-9002(03)01368-8.
- [22] T. Sjöstrand, S. Mrenna, and P. Skands, “PYTHIA 6.4 physics and manual”, JHEP 05 (2006) 026, 10.1088/1126-6708/2006/05/026.
- [23] T. Sjöstrand, S. Mrenna, and P. Skands, “A brief introduction to PYTHIA 8.1”, Comput. Phys. Commun. 178 (2008) 852, 10.1016/j.cpc.2008.01.036.
- [24] R. Corke and T. Sjöstrand, “Interleaved parton showers and tuning prospects”, JHEP 03 (2011) 032, 10.1007/JHEP03(2011)032, arXiv:1011.1759.
- [25] P. Skands and D. Wicke, “Non-perturbative QCD effects and the top mass at the Tevatron”, Eur. Phys. J. C 52 (2007) 133, 10.1140/epjc/s10052-007-0352-1.
- [26] CMS Collaboration, “Measurement of energy flow at large pseudorapidities in collisions at and 7 TeV”, JHEP 11 (2011) 148, 10.1007/JHEP11(2011)148, arXiv:1110.0211. [Erratum \DOI10.1007/JHEP02(2012)055].
- [27] Pumplin et al., “New generation of parton distributions with uncertainties from global QCD analysis”, JHEP 07 (2002) 012, 10.1088/1126-6708/2002/07/012, arXiv:hep-ph/0201195.
- [28] V. N. Gribov and L. N. Lipatov, “Deep inelastic e p scattering in perturbation theory”, Sov. J. Nucl. Phys. 15 (1972) 438.
- [29] G. Altarelli and G. Parisi, “Asymptotic Freedom in Parton Language”, Nucl. Phys. B 126 (1977) 298, 10.1016/0550-3213(77)90384-4.
- [30] Y. L. Dokshitzer, “Calculation of the Structure Functions for Deep Inelastic Scattering and e+ e- Annihilation by Perturbation Theory in Quantum Chromodynamics.”, Sov. Phys. JETP 46 (1977) 641.
- [31] B. Andersson, G. Gustafson, G. Ingelman, and T. Sjöstrand, “Parton fragmentation and string dynamics”, Phys. Rept. 97 (1983) 31, 10.1016/0370-1573(83)90080-7.
- [32] G. A. Schuler and T. Sjöstrand, “Hadronic diffractive cross sections and the rise of the total cross section”, Phys. Rev. D 49 (1994) 2257, 10.1103/PhysRevD.49.2257.
- [33] H1 Collaboration, “Measurement and QCD analysis of the diffractive deep-inelastic scattering cross-section at HERA”, Eur. Phys. J. C 48 (2006) 715, 10.1140/epjc/s10052-006-0035-3, arXiv:hep-ex/0606004.
- [34] H1 Collaboration, “Dijet cross sections and parton densities in diffractive DIS at HERA”, JHEP 10 (2007) 042, 10.1088/1126-6708/2007/10/042, arXiv:0708.3217.
- [35] P. Newman and M. Wing, “The hadronic final state at HERA”, Rev. Mod. Phys. 86 (2014) 1037, 10.1103/RevModPhys.86.1037, arXiv:1308.3368.
- [36] S. Navin, “Diffraction in PYTHIA”, (2010). arXiv:1005.3894. LUTP-09-23, MCnet/10/09.
- [37] M. Bähr et al., “Herwig++ physics and manual”, Eur. Phys. J. C 58 (2008) 639, 10.1140/epjc/s10052-008-0798-9.
- [38] S. Gieseke, C. Röhr, and A. Siódmok, “Colour reconnections in Herwig++”, Eur. Phys. J. C 72 (2012) 2225, 10.1140/epjc/s10052-012-2225-5, arXiv:1206.0041.
- [39] S. Gieseke et al., “Herwig++ 2.5 Release Note”, (2011). arXiv:1102.1672. DCPT/11/18, DESY 11-018, IPPP/11/09, KA-TP-04-2011, MCnet-11-04.
- [40] D. d’Enterria, R. Engel, T. Pierog, S. Ostapchenko, and K. Werner, “Constraints from the first LHC data on hadronic event generators for ultra-high energy cosmic-ray physics”, Astropart. Phys. 35 (2011) 98, 10.1016/j.astropartphys.2011.05.002, arXiv:1101.5596.
- [41] K. Werner, F. M. Liu, and T. Pierog, “Parton ladder splitting and the rapidity dependence of transverse momentum spectra in deuteron-gold collisions at RHIC”, Phys. Rev. C 74 (2006) 044902, 10.1103/PhysRevC.74.044902, arXiv:hep-ph/0506232.
- [42] T. Pierog et al., “EPOS LHC: test of collective hadronization with LHC data”, (2013). arXiv:1306.0121.
- [43] S. Ostapchenko, “Monte Carlo treatment of hadronic interactions in enhanced Pomeron scheme: I. QGSJET-II model”, Phys. Rev. D 83 (2011) 014018, 10.1103/PhysRevD.83.014018.
- [44] V. N. Gribov, “A reggeon diagram technique”, Sov. Phys. JETP 26 (1968) 414.
- [45] T. Pierog, “LHC Results and High Energy Cosmic Ray Interaction Models”, J. Phys.: Conf. Ser. 409 (2013) 012008, 10.1088/1742-6596/409/1/012008.
- [46] TOTEM Collaboration, “Measurement of proton-proton inelastic scattering cross-section at = 7 TeV”, Europhys. Lett. 101 (2013) 21003, 10.1209/0295-5075/101/21003.
- [47] TOTEM Collaboration, “Luminosity-Independent Measurement of the Proton-Proton Total Cross Section at = 8 TeV”, Phys. Rev. Lett. 111 (2013) 012001, 10.1103/PhysRevLett.111.012001.
- [48] K. Rose, “Deterministic annealing for clustering, compression, classification, regression, and related optimization problems”, Proceedings of the IEEE 86 (Issue 11) (1998) 2210, 10.1109/5.726788.
- [49] CMS Collaboration, “Tracking and Vertexing Results from First Collisions”, CMS Physics Analysis Summary CMS-PAS-TRK-10-001, 2010.
- [50] C. Tsallis, “Possible generalization of Boltzmann-Gibbs statistics”, J. Statist. Phys. 52 (1988) 479, 10.1007/BF01016429.
- [51] CMS Collaboration, “Measurement of Tracking Efficiency”, CMS Physics Analysis Summary CMS-PAS-TRK-10-002, 2010.
- [52] E.-J. Ahn et al., “Cosmic ray interaction event generator SIBYLL 2.1”, Phys.Rev. D 80 (2009) 094003, 10.1103/PhysRevD.80.094003, arXiv:0906.4113.
- [53] LHCf Collaboration, “Measurement of zero degree single photon energy spectra for TeV proton-proton collisions at LHC”, Phys. Lett. B 703 (2011) 128, 10.1016/j.physletb.2011.07.077, arXiv:1104.5294.