Escape fraction of ionizing photons during reionization: effects due to supernova feedback and runaway OB stars
Abstract
The fraction of hydrogen ionizing photons escaping from galaxies into the intergalactic medium is a critical ingredient in the theory of reionization. We use two zoomed-in, high-resolution (4 pc), cosmological radiation hydrodynamic simulations with adaptive mesh refinement to investigate the impact of two physical mechanisms (supernova feedback and runaway OB stars) on the escape fraction () at the epoch of reionization (). We implement a new, physically motivated supernova feedback model that can approximate the Sedov solutions at all (from the free expansion to snowplow) stages. We find that there is a significant time delay of about ten million years between the peak of star formation and that of escape fraction, due to the time required for the build-up and subsequent destruction of the star-forming cloud by supernova feedback. Consequently, the photon number-weighted mean escape fraction for dwarf galaxies in halos of mass is found to be , although instantaneous values of are common when star formation is strongly modulated by the supernova explosions. We find that the inclusion of runaway OB stars increases the mean escape fraction by 22% to . As supernovae resulting from runaway OB stars tend to occur in less dense environments, the feedback effect is enhanced and star formation is further suppressed in halos with in the simulation with runaway OB stars compared with the model without them. While both our models produce enough ionizing photons to maintain a fully ionized universe at as observed, a still higher amount of ionizing photons at appears necessary to accommodate the high observed electron optical depth inferred from cosmic microwave background observations.
Subject headings:
galaxies: high-redshift — intergalactic medium – H ii regions1. Introduction
Gunn & Peterson (1965) predicted that Ly absorption would give rise to a sudden drop of continuum flux at wavelengths shorter than 1216 if a tiny amount of neutral hydrogen is present along the line of sight. The dramatic clearing of the Gunn-Peterson trough from the observation of quasars at demonstrates that hydrogen in the Universe is highly ionized at (Becker et al., 2001; Fan et al., 2001, 2006). Polarization signals from the comic microwave background (CMB) also suggest that a large fraction of hydrogen may already be ionized by (Komatsu et al., 2011; Planck Collaboration et al., 2013). Yet, the detailed processes on how reionization has occurred remain unclear.
In the standard CDM universe, dwarf galaxies form early (e.g., Somerville et al., 2003) and could dominate the budget of hydrogen ionizing photons at the epoch of reionization. Photons that escape from the porous interstellar medium (ISM, Clarke & Oey, 2002), driven by supernova (SN) explosions (McKee & Ostriker, 1977), to the intergalactic medium (IGM) create H ii bubbles, which expand as more stars form. The eventual percolation of H ii bubbles would mark the end of the cosmological reionization (e.g., Gnedin, 2000a; McQuinn et al., 2007; Shin et al., 2008). This stellar reionization scenario has been studied extensively, both (semi-) analytically (e.g. Madau et al., 1999; Miralda-Escudé et al., 2000; Barkana & Loeb, 2001; Bianchi et al., 2001; Cen, 2003; Wyithe & Loeb, 2003; Somerville et al., 2003; Bolton & Haehnelt, 2007; Wyithe & Cen, 2007; Kuhlen & Faucher-Giguère, 2012; Robertson et al., 2013) and numerically (e.g. Gnedin, 2000a; Razoumov et al., 2002; Ciardi et al., 2003; Fujita et al., 2003; Trac & Cen, 2007; Gnedin et al., 2008; Wise & Cen, 2009; Razoumov & Sommer-Larsen, 2010; Yajima et al., 2011; Paardekooper et al., 2013). It appears that dwarf galaxies are the most plausible source of the ionizing photons, provided that the escape fraction is significant (). Active galactic nuclei also contribute to ionizing photons in both the ultraviolet (UV) and X-ray bands but are generally believed to be sub-dominant to stellar sources (Haehnelt et al., 2001; Wyithe & Loeb, 2003; Schirber & Bullock, 2003; Faucher-Giguère et al., 2008; Cowie et al., 2009; Willott et al., 2010; Fontanot et al., 2014). The strong accretion shock present in massive halos () may also produce a non-negligible amount of hydrogen ionizing photons in the vicinity of the galactic gaseous disk (Dopita et al., 2011).
The major uncertainty in the dwarf galaxy-driven reionization picture is the escape fraction of ionizing photons. Observationally, this is difficult to probe, because the hydrogen ionizing photons escaping from dwarf galaxies will get easily absorbed by the IGM during reionization (). Besides, it requires a large sample of galaxies to obtain a statistically significant estimate of the escape fraction (). Nevertheless, it is worth noting that galaxies at higher redshift often exhibit a larger relative escape fraction (), which is defined as the ratio of the escape fraction at 900 and 1500, than their low- counterparts (Siana et al., 2010). Observations of star-forming galaxies at indicate that the relative escape fraction is only a few percent (Leitherer et al., 1995; Deharveng et al., 2001; Malkan et al., 2003; Siana et al., 2007; Cowie et al., 2009; Bridge et al., 2010; Siana et al., 2010). The only exception reported so far is Haro 11, which shows (Bergvall et al., 2006). On the other hand, a non-negligible fraction () of star-forming galaxies at reveals a high escape of (Shapley et al., 2006; Iwata et al., 2009; Nestor et al., 2011, 2013; Cooke et al., 2014). For typical Lyman break galaxies at in which 20–25% of UV photons are escaping (Reddy et al., 2008), the relative fraction corresponds to a high escape fraction of . Given that galaxies are more actively star forming at high redshift (e.g. Bouwens et al., 2012; Dunlop et al., 2012), it has been suggested that there may be a correlation between star formation rate and , and possibly evolving with redshift (Kuhlen & Faucher-Giguère, 2012).
Predicting the escape fraction in theory is also a very challenging task. This is essentially because there is little understanding on the structure of the ISM at high- dwarf galaxies. Numerical simulations are perhaps the most suited to investigate this subject, but different subgrid prescriptions and/or finite resolution often lead to different conclusions. Using an adaptive mesh refinement (AMR) code, ART (Kravtsov et al., 1997), with SN-driven energy feedback, Gnedin et al. (2008) claim that the angle-averaged escape fraction increases with galaxy mass from to a few percents in the range . They attributed this trend to the fact that more massive galaxies have smaller gas-to-stellar scale-height than lower mass galaxies in their simulations. On the other hand, Razoumov & Sommer-Larsen (2010) argue based on cosmological TreeSPH simulations (Sommer-Larsen et al., 2003) that more than 60% of the hydrogen ionizing photons escape from dwarf galaxies in dark matter halos of . More massive halos of are predicted to have a considerably smaller (). A similar conclusion is reached by Yajima et al. (2011). It should be noted, however, that resolution could potentially be an issue in these two studies in the sense that their resolution of a few hundreds to thousands of parsec is unable to resolve most star-forming regions and hence capture obscuring column densities and a porous ISM. Wise & Cen (2009) performed cosmological radiation hydrodynamic simulations employing very high resolution (0.1 pc), and found that the neutral hydrogen column density varies over the solid angles from to with the aid of SN explosions and photo-ionization. Because of the porous ISM, a high of is achieved in small halos of . Wise et al. (2014) show that an even higher fraction () of hydrogen ionizing photons escapes from minihalos of .
Another potentially important source of ionizing radiation is runaway OB stars that are dynamically displaced from their birthplace. The runaway OB stars are normally defined by their peculiar motion (, Blaauw, 1961), and roughly of OB stars are classified as runaways in the Milky Way (Stone, 1991; Hoogerwerf et al., 2001; Tetzlaff et al., 2011). Although the fraction is still uncertain, their peculiar speed of means that the runaway OB stars can, in principle, travel away from the birthplace by 200 pc in 5 Myrs, making them an attractive source for the ionizing photons. The runaway OB stars are thought to originate from a three-body interaction with other stars in a young cluster (Leonard & Duncan, 1988), and/or from a SN explosion of a companion in a binary system (Blaauw, 1961). Conroy & Kratter (2012) evaluated the impact of the inclusion of runaway OB stars on using a simple analytic argument, and concluded that the runaway OB stars may enhance by a factor of up to in halos with .
The aim of this study is to investigate the importance of the aforementioned two processes by measuring the escape fraction from high-resolution cosmological radiation hydrodynamics simulations. First, given that modeling the SN explosion as thermal energy is well known to have the artificial radiative cooling problem (e.g. Katz, 1992; Slyz et al., 2005), we expect that the role of the SN is likely to be underestimated in some cosmological simulations (e.g. Gnedin et al., 2008). With a new physically based SN feedback model that captures all stages of the Sedov explosion from the free expansion to the snowplow phase, we study the connection between the escape of ionizing photons and feedback processes in dwarf galaxies. Second, we extend the idea by Conroy & Kratter (2012), and quantify the impact from the runaway OB stars on reionization in a more realistic environment.
We first describe the details of our cosmological radiation hydrodynamics simulations including the implementation of runaway OB stars in Section 2. We present the feedback-regulated evolution of the escape fraction and the impact of the inclusion of runaway OB stars in Section 3. We summarize and discuss our findings in Section 4. Our new mechanical feedback from SN explosions is detailed in Appendix.
2. Method
2.1. Hydrodynamics code
We make use of the Eulerian adaptive mesh refinement code, ramses (Teyssier, 2002, ver. 3.07), to investigate the escape of ionizing radiation from high- galaxies. ramses is based on the fully threaded oct-tree structure (Khokhlov, 1998), and uses the second-order Godunov scheme to solve Euler equations. The hydrodynamic states reconstructed at the cell interface are limited using the MinMod method, and then advanced using the Harten-Lax-van Leer contact wave Riemann solver (HLLC, Toro et al., 1994). We adopt a typical Courant number of 0.8. The poisson equation is solved using the adaptive particle-mesh method. Gas can effectively cool down to K by atomic and metal cooling (Sutherland & Dopita, 1993). Below K, metal fine-structure transitions, such as [CII] 158, can further lower the temperature down to 10 K, as in Rosen & Bregman (1995). We set the initial metallicity to , as primordial SNe can quickly enrich metals in mini-halos of mass (e.g., Whalen et al., 2008), which our simulations cannot resolve properly.
We use the multi-group radiative transfer (RT) module developed by Rosdahl et al. (2013) to compute the photoionization by stars. The module solves the moment equations for three photon packets (Hii, Heii, and Heiii ionizing photons) using a first-order Godunov method with M1 closure for the Eddington tensor. We adopt the Harten-Lax-van Leer (HLL, Harten et al., 1983) intercell flux function. Ionizing photons from each star are taken into consideration in every fine step. Note that an advantage of the moment-based RT is that it is not limited by the number of sources. The production rate of the ionizing photon varies with time for a given initial mass function (IMF, Leitherer et al., 1999, see also Rosdahl et al. 2013). The majority of the ionizing photons are released in 5 Myr of stellar age. We adopt the production rate equivalent to that of Kroupa IMF (Kroupa, 2001) from the Starburst99 library (Leitherer et al., 1999)111Note that we use the Chabrier IMF to estimate the frequency of SN explosions. We choose the number of ionizing photons equivalent to that of the Kroupa IMF, because the models with the Chabrier IMF is not yet available in the Starburst99 (Leitherer et al., 1999). The radiation is coupled with gas via photo-ionization and photo-heating, and a set of non-equilibrium chemistry equations for Hii, Heii, and Heiii are solved similarly as in Anninos et al. (1997). We assume that photons emitted by recombination are immediately absorbed by nearby atoms (case B). The speed of light is reduced for the speed-up of the simulations by 0.01 (e.g. Gnedin & Abel, 2001). This is justifiable because we are mainly interested in the flux of escaping photons at the virial sphere.
| Model | SNII | RT | Run- | |||
|---|---|---|---|---|---|---|
| aways | [pc] | [] | [] | |||
| FR | – | 4.2 | 49 | 1.6 | ||
| FRU | 4.2 | 49 | 1.6 |

2.2. Cosmological Simulations
We carry out cosmological simulations to investigate the escape fraction in realistic environments. For this purpose, we generate the initial condition using the music software (Hahn & Abel, 2011), with the WMAP7 cosmological parameters (Komatsu et al., 2011): . A large volume of is employed to include the effect of the large-scale tidal field. To achieve high mass resolution, we first run dark matter-only simulations with 2563 particles, and identify a rectangular region of Mpc (comoving) that encloses two dark matter halos of at . Then, we further refine the mass distribution of the zoomed-in region, such that the mass of a dark matter particle is , which corresponds to 20483 particles in effect. Despite that we purposely select the region in which two massive dark matter halos are present at , a comparison with the number of dark matter halos per volume predicted by Jenkins et al. (2001) shows that our simulated box represents an average region of the universe at (Figure 1).
The level of the root grid in the zoomed-in region is 11, consistent with the dark matter resolution. Further 12 levels of refinement are triggered if the dark matter plus baryon mass in a cell exceeds 8 times the mass of a dark matter particle. We keep the minimum physical size of a cell to over the entire redshift. However, this refinement criterion is not optimized to resolve the structure of the ISM, unless extremely high mass resolution is adopted. For example, for a gas cell of , the criterion will come into play only if the size of the cell is larger than 160 pc. In order to better resolve the structure of the ISM, we enforce a cell with to be resolved on . In a similar context, we apply more aggressive refinement criterion for the star-forming gas in such a way that gas with () is always resolved on a 8.5 pc (4.2 pc) cell. We adopt very high stellar mass resolution of . This means that a star particle with the minimum mass will produce a single SN event for the Chabrier IMF.
We run two sets of cosmological simulations, FR and FRU, with the identical initial condition down to . Both runs include star formation, metallicity-dependent radiative cooling (Sutherland & Dopita, 1993; Rosen & Bregman, 1995), thermal stellar winds, mechanical feedback from SN explosions, and photoionization by stellar radiation. The runaway OB stars are included only in the FRU run. In Figure 2, we show an example of the growth of H ii bubbles in the FR run. Our simulated region is nearly ionized at .
Dark matter (sub) halos are identified using the Amiga halo finder (Ahf, Gill et al., 2004; Knollmann & Knebe, 2009). Ahf first constructs the adaptive meshes based on the particle distribution, finds the density minima, and determines physical quantities based on a virial overdensity (). Gravitationally unbound particles are removed iteratively if they move faster than the local escape velocity during this procedure. The virial radius is defined such that the mass enclosed within the virial sphere is the virial overdensity times the critical density of the universe times the volume, i.e. . We take , appropriate for a -dominated universe at (Bryan & Norman, 1998). This results in 796, 443, and 183 dark matter halos of mass immune to the contamination by coarse dark matter particles () at , 9, and 11, respectively.
2.3. Star Formation and Feedback
Stars form in a very dense, compact molecular core. Infrared extinction maps of nearby interstellar cores indicate that their size ranges from 0.01 to 0.4 pc (e.g. Alves et al., 2007; Könyves et al., 2010), which is difficult to resolve in current cosmological simulations. Nevertheless, studies of gravitational collapse in converging flows (Gong & Ostriker, 2011) seem to suggest that a gravitationally bound cloud is likely to experience runaway collapse no matter how the collapse is initiated. In a similar spirit, we assume that stars would form in a cell if the following conditions are met simultaneously (e.g. Cen & Ostriker, 1992):
-
1.
the flow is convergent () ,
-
2.
the cooling time is shorter than the dynamical time,
-
3.
the gas is Jeans unstable, and
-
4.
the number density of hydrogen exceeds the threshold density .
The last condition is motivated by the density of a Larson-Penston profile (Larson, 1969; Penston, 1969) at , , where is the sound speed and is the size of the most refined cell. Star particles are created based on the Schmidt law (Schmidt, 1959), , assuming that 2% of the star-forming gas () is converted into stars per its free-fall time () (Krumholz & Tan, 2007; Kennicutt, 1998). The mass of each star particle is determined as , where is the threshold density for star formation, is the size of the most refined cell, and is a parameter that controls the minimum mass of a star particle. is the number of star particles to be formed in a cell, which is drawn from a Poisson random distribution, . Here the Poissonian mean () is computed as where is the simulation time step, and is the minimum stellar mass (i.e. ).
We describe the SN feedback using a new physical model which captures the SN explosion at all stages from the early free expansion to the final momentum-conserving snowplow phase. Briefly, we deposit radial momentum to the cells affected by supernova feedback, conserving energy appropriately. The amount of input momentum is determined by the stage the blast wave is in, which in turn is dependent upon the physical condition (density and metallicity) of the gas being swept up and simulation resolution. The virtue of our scheme is that an approximately (within 20%) correct amount of momentum is imparted to the surrounding gas regardless of the resolution. Thus, this prescription should be useful to cosmological simulations, especially those with finite resolution that potentially suffer from the artificial radiative cooling. The details of our implementation and a simple test are included in the Appendix.
The frequency of a SN per solar mass is estimated assuming the Chabrier IMF (Chabrier, 2003). For the simple stellar population with a low- (high-) mass cut-off of 0.1 (100) , the total mass fraction between 8 to 100 is 0.317, and the mean SN progenitor mass is 15.2 on the zero-age main sequence. At the time of the explosion, we also deposit newly processed metals into the surrounding. The mass fraction of newly synthesized metals in stellar ejecta is taken to be 0.05 following Arnett (1996). A star particle is assumed to undergo the SN phase after the main sequence lifetime of the mean SN progenitor (10 Myr, Schaller et al., 1992). As discussed in Slyz et al. (2005), allowing for the delay between the star formation and explosion (i.e. stellar lifetimes) is crucial to the formation of hot bubble in the ISM. We find that the physically based SN feedback employed in this study drives stronger galactic winds than the runs with thermal feedback or kinetic feedback that are valid only under certain conditions (Dubois & Teyssier, 2008, see below). Stellar winds from massive stars are modeled as thermal input, based on Leitherer et al. (1999).
2.4. Runaway OB Stars
Our implementation of runaway OB stars is largely motivated by Tetzlaff et al. (2011), who compiled candidates of runaway stars younger than 50 Myr for the 7663 Hipparcos sample. By correcting the solar motion and Galactic rotation, they found that the peculiar space velocity of the stars may be decomposed into two Maxwellian distributions intersecting at 28 . Assuming that each Maxwellian distribution represents a kinematically distinctive population, they estimated the fraction of the runaways to be for the sample with full kinematic information. The dispersion of the Maxwellian distribution is measured as 24.4 for the high-velocity group.
Since either runaway OB stars formed through the explosion of a SN in a binary or those dynamically ejected in a cluster are not resolved in our simulations, we crudely approximate this by splitting a star particle into a normal (70% in mass) and a runaway particle (30 %) at the time of star formation. While the initial velocity of the normal star is chosen as the velocity of the birth cloud, we add a velocity drawn from the Maxwellian distribution on top of the motion of the birth cloud for runaway particles. To do so, we generate the distribution following the Maxwellian with the dispersion of and the minimum space velocity of using the rejection method (Press et al., 1992). The direction of the runaway motion is chosen randomly for simplicity. A similar approach is taken by Ceverino & Klypin (2009) to study the formation of disk galaxies in a cosmological context.
2.5. Estimation of Escape Fraction
The fraction of escaping ionizing photons () is measured by comparing the photon flux at the virial radius and the photon production rate from young massive stars. Since the speed of light is finite, there is a small delay in time between the photons produced by the stars and the photons escaping at the virial sphere. In order to take this into account, we use the photon production rate at earlier time (), where is the reduced speed of light used in the simulations. The escape fraction is then computed as
| (1) |
where is the ionizing photon flux, is the solid angle, is the mass of each star particle, is the photon production rate of a simple stellar population of age per solar mass, and is the Heaviside step function. Here, we approximate the delay time to be a constant, , for each halo assuming that the central source is point-like. Since only outflowing photons are considered in Equation 1, we find that a minor fraction () of galaxies exhibit greater than 1. This happens mostly when there is little absorbers left in the halo after disruptive SN explosions. In this case, we randomly assign between 0.9 and 1.0. We confirm that the photon production rate-averaged escape fraction, which is the most important quantity in this study, is little affected by this choice even if the net flux is used, and thus we decide to take a simpler method.
Dust can also affect the determination of the escape of the hydrogen ionizing photons. However, given that our simulated galaxies are very metal-poor () and galaxies with lower metallicity have a progressively lower amount of dust (Lisenfeld & Ferrara, 1998; Engelbracht et al., 2008; Galametz et al., 2011; Fisher et al., 2013), it is unlikely that dust decreases the escape fraction substantially. Thus, we neglect the absorption of hydrogen ionizing photons by dust in this study.
3. Results
3.1. Feedback-regulated Escape of Ionizing Photons
Cosmological hydrodynamics simulations often suffer from the artificial over-cooling problem in forming disk galaxies (e.g. Kimm et al., 2011a; Hummels & Bryan, 2012), mainly because the energy from SN explosions is radiated away before it is properly transferred to momentum due to inadequate resolution of the multi-phase ISM. This directly affects the escape of ionizing photons. Motivated by this challenge, we have implemented a SN feedback scheme that reasonably approximates the Sedov blast waves from the free expansion to snowplow stages. In Figure 3, we present the baryon-to-star conversion efficiency () of the central galaxies in dark matter halos at from the FR run. It shows that our new physically motivated SN feedback is very effective at suppressing star formation. For example, the most massive halo with at shows . Although the direct comparison may be difficult due to a different initial condition used, it is worth noting that the conversion efficiency is about a factor of 7 smaller than that found in the NutFB run (Kimm et al., 2011a, see Fig.13), shown as a star in Figure 3. We note that the momentum input from SN explosions used in the NutFB run is a factor of smaller compared with that at the end of the cooling phase (see Appendix, Blondin et al., 1998). For lower mass halos, the conversion efficiency is found to be even lower, reaching at . It is also interesting to note that the conversion efficiency at also agrees reasonably well within error bars with the semi-analytic results obtained to reproduce the observed stellar mass function, star formation rate, and cosmic star formation rate density (e.g., Behroozi et al., 2013, Figure 7). As the feedback becomes more effective and fewer stars are formed, the stellar metallicity of these high- galaxies would be lower. We find that the most massive galaxy in our sample () has a stellar metallicity of 0.05 . This is at least factor of 2–3 smaller than the prediction by Finlator et al. (2011) at the same epoch. Kimm & Cen (2013) also investigated UV properties of galaxies of stellar mass using a SN energy-based feedback scheme, and found that stellar metallicities are generally higher than those found in the FR run. Kimm & Cen (2013) found that the stellar metallicity for galaxies of mass falls in the range of . The gas metallicities () are also different in the two simulations. The gas metallicity of the ISM within kpc for the galaxies is in the FR run, which is about a factor of 3 lower, on average, than that of Kimm & Cen (2013) (). These comparisons lead us to conclude that our physically based feedback scheme is effective in alleviating the overcooling problem.
One may wonder whether stars form inefficiently in these small haloes () because gas accretion is suppressed due to the ionizing background radiation (Shapiro et al., 1994; Thoul & Weinberg, 1996; Gnedin, 2000b; Dijkstra et al., 2004; Sobacchi & Mesinger, 2013; Noh & McQuinn, 2014). However, this is unlikely the case, given that galaxies in the atomic cooling halos are fed mainly by dense filaments and satellites at high redshift (e.g., Powell et al., 2011), which are self-shielded from the background radiation (Faucher-Giguère et al., 2010; Rosdahl & Blaizot, 2012). Even in the absence of the self-shielding, Geen et al. (2013) find no clear sign that reionization suppresses star formation in such halos at . Wise et al. (2014) also show that the fraction of baryons in a - halo is reduced only by less than a factor of two compared with the cosmic mean in their cosmological radiation hydrodynamics simulations with thermal supernova feedback and reionization. Indeed, we confirm that our mechanical supernova feedback is primarily responsible for the low conversion efficiency by directly comparing the stellar mass of the dwarf galaxies between the simulations with and without ionizing radiation (see the Appendix).
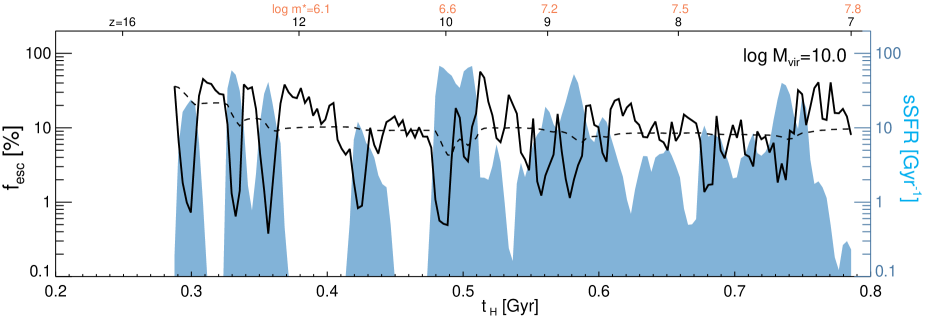
We now present the time evolution of star formation rate and ionizing photon escape fraction of two randomly chosen relatively massive galaxies in Figure 4. The plot corroborates that the feedback from stars governs the evolution of galaxies. The top and bottom panels show the evolution of specific star formation rate (sSFR) and instantaneous of the central galaxy in dark matter halos of mass and , respectively. The SFR is computed by averaging the mass of newly formed stars over 3 Myr. It is evident that star formation is episodic on a time scale of Myr with both the frequency and oscillation amplitude decreasing with increasing stellar mass. This means that SN explosions effectively control the growth and disruption of star-forming clouds. When the galaxies are small (), the explosions even completely shut down the star formation across the galaxies, as stars form only in a few dense clouds. During these quiet periods, is kept high (). On the other hand, massive galaxies contain many star-forming clumps, as can be seen in the projected density plot (middle row). The fact that the episodic star formation history becomes more smooth at late times indicates that these clumps are not entirely susceptible, but somewhat resilient to the SN explosions arising from neighboring star clusters.
More importantly, we find that there is a time delay between the peak of and sSFR. This is essentially because massive stars with explode 10 Myr after their birth in our simulation. Let us suppose a dense cloud that just begins to form stars. Since the gas flow is usually convergent in these regions, the density of the gas will rise with time, and so does the SFR. This means that more and more massive stars will explode as time goes on. Once enough SNe that can significantly redistribute the birth cloud go off, SFR will begin to drop, and will increase. Note that the increase in the number of SNe continues even after the peak of SFR, as massive stars live 10 Myr. Once the massive stars formed at the peak of SFR evolve off, star formation will be further suppressed as a result of the destruction of the star-forming clouds, and strong outflows are likely to be produced, thus maximizing . Therefore, the time delay stems from the interplay between the build-up of a non-coeval star cluster and subsequent SN explosions after the lifetime of the massive stars ( 10 Myr). The projected density distributions of gas at two snapshots, one of which displays the peak in sSFR (a) and the other shows the peak in (b), substantiates that it is indeed the strong outflow that elevates (middle row). When sSFR is at the peak value, the central galaxy appears relatively quiet (panel-(a)), whereas strong outflows are seen when is highest and sSFR drops rapidly (panel-(b)). As one can read from the figure, this mis-match of SFR and means that a large amount of ionizing photons at the peak of SF are absorbed by their birth clouds. Although is high in the early time (), the photon number-weighted mean (dashed lines) stays at around level in these two examples.
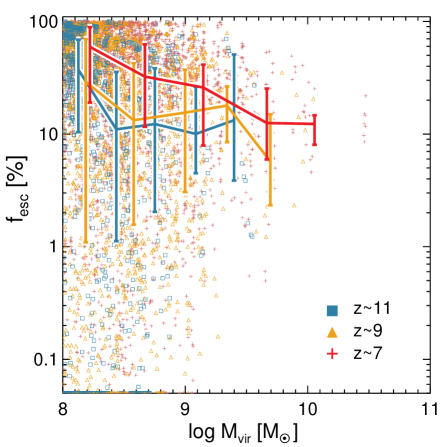
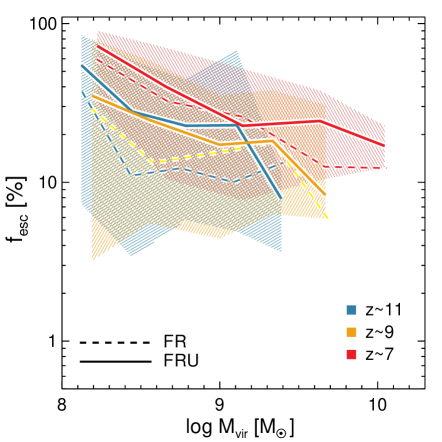
We present statistical results of the escape fraction in Figure 5. Since there are a limited number of galaxies in our simulated volume and varies significantly on 10 Myrs, we compute the median and interquartile range of by combining the results from seven consecutive snapshots spanning 21 Myrs. Several features can be gleaned from this figure. First, although there is a considerable scatter, high- galaxies exhibit a high on the order of 10%, which is normally required by semi-analytic calculations of reionization to ionize the universe by (Wyithe & Cen, 2007; Shull et al., 2012; Robertson et al., 2013). Second, there is a hint that photons can escape more easily in the galaxies hosted by lower mass halos. We attribute this to the fact that feedback from stars efficiently destroys a few star-forming clouds that are responsible for the total SF in smaller halos, as opposed to larger ones in which young massive stars are buried in many star-forming clouds that are relatively resilient to the SN feedback arising from neighboring star clusters. As shown in the top and bottom panels of Figure 4, when galaxies are small, the entire star formation can be suppressed due to the energetic outflows driven by SN explosions. Third, we find that is slightly higher at lower redshift for a given halo mass, consistent with Paardekooper et al. (2013). This is essentially because the mean density of the gas is smaller at lower redshift, and the impact from SNe becomes more effective.
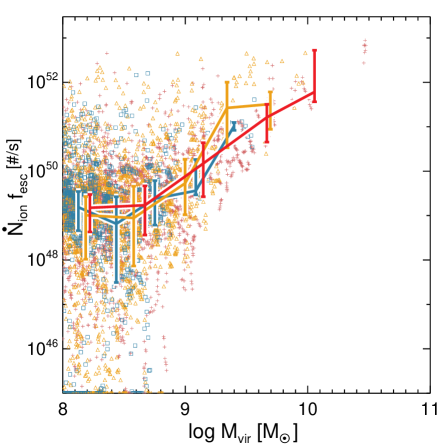
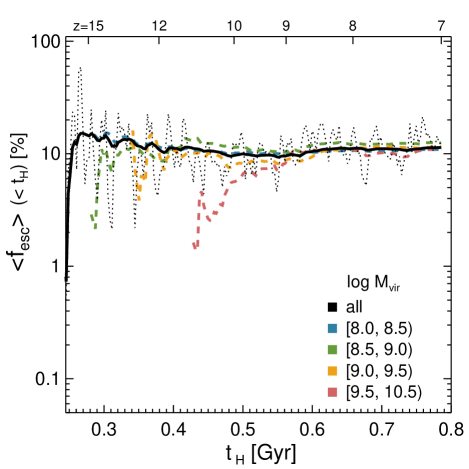
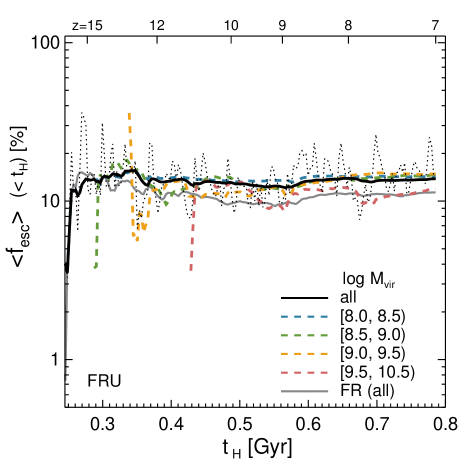
Note that high does not necessarily mean that more photons would leave their host halo. Star clusters older than 5 Myr would not contribute significantly to the total ionizing photon budget even if their is 1. The more relevant quantity for reionization should take into account the photon production rate, and we find that the (weak) redshift dependence of disappears when the photon escape rate is plotted (right panel in Figure 5). Since the instantaneous measurement of could be misleading, we also present the photon production rate-weighted, time-averaged escape fraction, in Figure 6 (left panel). This is a better quantity to be used for the semi-analytic calculations of reionization than from Figure 5. Overall, we find that the time-averaged escape fraction at is around 10%, regardless of the halo mass in the range considered. Also included as the black dotted line in Figure 6 is the photon production rate-weighted average of of all the samples at different times (). Again, the value is found to fluctuate around 10%, but no clear sign of redshift dependence is detected.
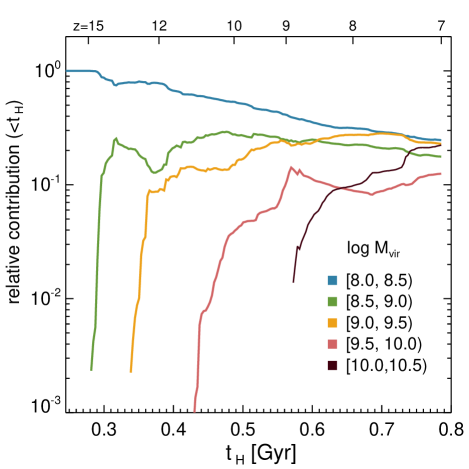
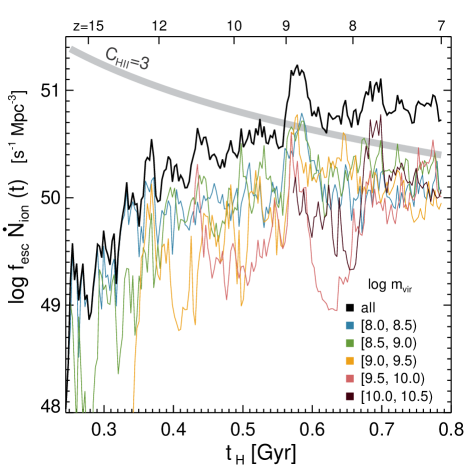
The relative contributions from halos of different masses to the total escaping ionizing photons are compared in Figure 6 (right panel). As the small structures form first in the CDM universe, the small halos of mass dominate down to . More massive halos and galaxies emerge later, and their cumulative contribution becomes comparable with that of the smallest halos () by . In our simulations, 14 most massive halos supply more ionizing photons than 556 smallest halos with at . This is mainly because is much higher in the more massive halos than in the small halos, while the effective escape fraction is similar. The typical number of escaping photons per second in halos with is , whereas the number can increase up to in the most massive halos () (Figure 5, right panel). Notice, however, that this does not necessarily translate to their relative role to the reionization of the universe. Small halos at high redshift may make a more significant contribution to the Thompson optical depth (Wyithe & Cen, 2007; Shull et al., 2012; Kuhlen & Faucher-Giguère, 2012; Robertson et al., 2013).
It is noted that the recombination timescale corresponding to the mean density of the universe at () is relatively long ( 50–100 Myr)222Given that gas accretion is mostly filamentary (e.g. Ocvirk et al., 2008; Dekel et al., 2009; Kimm et al., 2011b; Stewart et al., 2011), the actual density of the gas that occupies most of the volume in the halo is likely to be even lower than the mean density of the universe, and the recombination timescale could be longer., and thus the halo gas around a galaxy may be kept partially ionized even though it is irradiated by the galaxy intermittently. Figure 4 (the second panel in the middle row) indeed shows that a large fraction of the IGM in the vicinity of the central galaxy is largely ionized despite the fact that instantaneous is low. Although we do not include the whole distribution of the ionized hydrogen inside the halo, we confirm that the halo gas between 2 kpc and 12 kpc (virial radius) is fully ionized apart from the small region taken by cold filamentary gas. In fact, the volume filling fraction of the neutral hydrogen () inside (2.3 kpc) is found to be 25% larger in the snapshot (b) () than that in the snapshot (a), suggesting that dense star-forming gas plays a more important role in determining the escape fraction than volume-filling diffuse neutral gas.
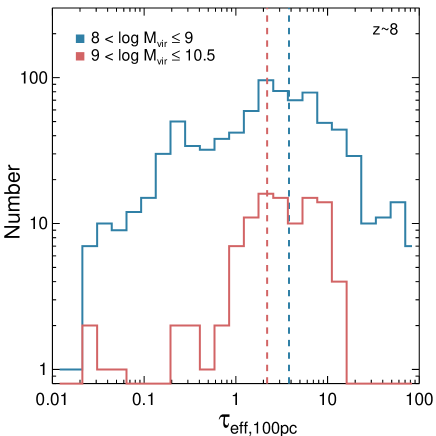
Figure 7 demonstrates the importance of resolving the ISM in predicting the escape of ionizing photons. In order to estimate the optical depth by neutral hydrogen in the vicinity of each star particle ( 100 pc), we spawn 768 rays per particle using the Healpix algorithm (Górski et al., 2005). Each ray carries the spectral energy distribution determined by the age and mass of the star particle (Leitherer et al., 1999). As the ray propagates, we compute the absorption of the Lyman continuum by neutral hydrogen as, , where () is the optical depth and is the hydrogen ionization cross section (Osterbrock & Ferland, 2006) We then combine the attenuated spectral energy distributions propagated out to 100 pc from each star particle, and measure the remaining number of ionizing photons () per galaxy. This is compared with the initial number of ionizing photons () to obtain the effective optical depth as . Figure 7 shows the distribution of the effective optical depth by the nearby gas for the galaxies with a low escape fraction () at . We find that shows a wide distribution ranging from 0.01 to 100, with the photon production rate-weighted averages of 3.8 and 1.9 for less () and more massive () halo groups, respectively. This indicates that the number of escaping photons is reduced by a factor of due to the gas near young stars in galaxies with the small . In this regard, one may find it reconcilable that results from cosmological simulations with limited resolutions (e.g., Fujita et al., 2003; Razoumov & Sommer-Larsen, 2010; Yajima et al., 2011) often give discrepant results.
To summarize, we find that there is a time delay between the peak of star formation activity and the escape fraction due to the delay in the onset of effective feedback processes that can blow birth clouds away. Because of the delay, only 11.4 % of the ionizing photons could escape from their host halos when photon production rate-averaged over all halos at different redshifts, despite the fact that the instantaneous could reach a very high value temporarily. Halos of different masses () contribute comparably per logarithmic mass interval to reionization, and a photon production rate-averaged escape fraction () shows a weak dependence on redshift in the range examined (c.f., Kuhlen & Faucher-Giguère, 2012).
3.2. Escape Fraction Enhanced by Runaway OB Stars
Ionizing photons can not only escape from their birth clouds by destroying them through feedback processes, but also emerge from runaway OB stars displaced from the birth clouds. If we take the typical velocity of the runaway OB stars (Stone, 1991; Hoogerwerf et al., 2001; Tetzlaff et al., 2011), they could travel a distance of 200 pc in 5 Myr. Conroy & Kratter (2012) examined the possible ramification of the inclusion of the runaway OB stars using a simple analytic formulation, and concluded that can be enhanced by a factor of up to 4.5 from to in halos of mass . Given the complexity of the ISM dynamics (e.g. McKee & Ostriker, 2007), it would seem prudent to examine this issue in greater details in realistic environments. To do so, we have performed a twin cosmological simulation of the FR run by designating 30% of mass in each stellar particle as a separate runaway particle and dynamically follow their motion.
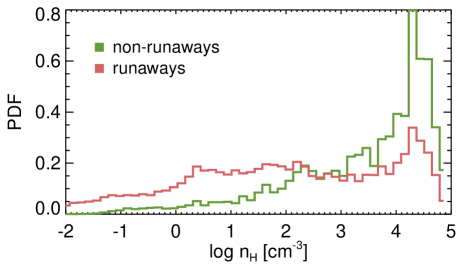
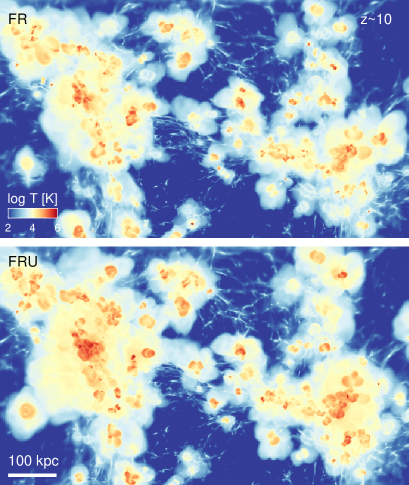
Figure 8 shows an example of the difference in environment between runaway and non-runaway particles in a galaxy in a halo at . At this redshift, the central galaxy shows . The average hydrogen number density for runaways younger than 5 Myr () is found to be roughly 20 times smaller than that of non-runaways (). Given that these stars will explode in the next 5–10 Myrs, the fact that the local density of some runaway OB stars is smaller than non-runaways suggests that the impact from SN explosions will be enhanced. Indeed, we find that the stellar mass of the galaxies in halos of mass is smaller by a factor of 1.7 on average, compared with that from the FR run (see Figure 3). For galaxies in smaller halos, there is no clear hint that the runaway OB stars help suppress the star formation. This is partly because runaway OB stars can not only provide energy but also distribute metals more efficiently, which can increase the cooling rate in halos. Comparison of the temperature distribution between the two runs further substantiates the claim that runaway OB stars help regulate the star formation (Figure 9). The volume of gas inside the zoomed-in region in the FRU run ( 7 kpc3, physical) is 30% larger than that in the FR run.
The left panel in Figure 10 shows the instantaneous measured at three different redshifts from the FRU run. Again, less massive galaxies tend to exhibit a higher , which can be attributed to the fact that star formation in smaller halos is more easily affected by the energetic explosions. As expected, the inclusion of the runaway OB stars increases the instantaneous escape fraction on average. The photon production rate-weighted average of (right panel in Figure 10) shows this more clearly. In our fiducial run (FR), 11.4% of the ionizing photons produced escaped from the halos of mass at . On the other hand, the FRU run yields higher of 13.8%, which is enhanced by 22% compared with that of the FR run. Although this increase is not as large as claimed in Conroy & Kratter (2012), the contribution from the runaway OB stars is certainly significant. Similarly as in the FR run, no clear dependence of on halo mass is found.
It is interesting to discuss possible origins of the significantly different enhancement in the escape fraction due to runaway OB stars found in our simulations compared with the estimate by Conroy & Kratter (2012). First, while their model predicts of non-runaways to be about 2–4% in halos of mass , we find that the self-regulation of star formation via SN explosions leads to a high escape of 10% in our fiducial model (FR). Second, while their model finds that runaway OB stars are found to have high (=30–80%), our results imply that the mean escape fraction of ionizing photons from runaway OB stars is about (). We also make a more elaborate estimate as follows. We measure the optical depth in the Lyman continuum for the gas inside each halo along 768 sightlines per star particle, and combine the attenuated spectral energy distributions. These are used to count the number of hydrogen ionizing photons for runaways and non-runaways separately. We find that the relative contribution from the runaways to the total number of escaping photons is comparable with that of the non-runaways. Considering that the runaway particle is assumed to explain only 30% of all the OB stars, the net for the runaways can be estimated to be roughly 23% (). This is twice higher chance of escaping than the non-runaways, but much smaller than computed in the analytic model. If the escape fraction of non-runaway OB stars were 2% in our simulations, the total escape fraction would become , corresponding to an increase of a factor of 4.2. It is thus clear that most of the discrepancies arise in a large part due to different escape fraction values for non-runaway OB stars and also due to different escape fraction values for runaway OB stars.
Although is 22% larger in the FRU run than FR, the cumulative number of photons escaped in halos with by () is found to be similar to that of the FR run (). This is because star formation is suppressed in relatively massive halos ().
One question is whether or not enough photons escape to keep the universe at ionized. The critical photon rate density that can balance the recombination of ionized hydrogen is
| (2) |
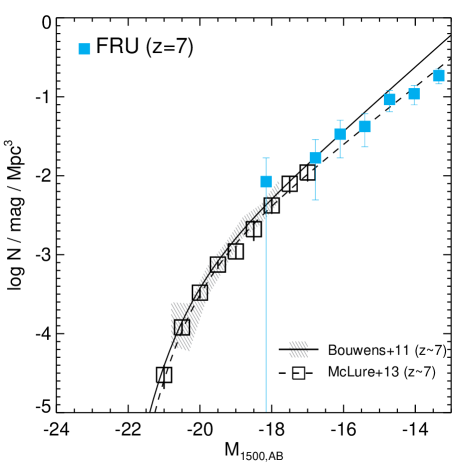
where is the case B recombination coefficient, is the number density of electron, is the number density of ionized hydrogen, and is the clumping factor of ionized gas. For a choice of the clumping factor (Pawlik et al., 2009; Raičević et al., 2011) and the temperature , . Figure 11 shows that the escaped photons in FRU can balance the recombination at . We find that the photon rate density at is , consistent with observational findings. Ouchi et al. (2009) estimated the ionizing photon density to be by integrating the UV luminosity function (UVLF) down to (lower) or (upper estimate) with a slope of at with . If the slope found in the more recent literature (McLure et al., 2013), , is used, the maximum photon rate density derived would increase to , which is in agreement with our estimation. Note that the photons escaping from halos of mass account for more than 90% of the total escaping photons if the baryon-to-star conversion efficiency derived in our simulation is extrapolated to smaller halos (, see below), and hence our results should be compared with the maximum photon rate density. Given that their chosen is closed to what our simulation yields (13.8%), the agreement implies that SFRs of the galaxies are well reproduced in our simulation. Indeed, we find that our simulated UVLF measured at 1500Å (rest-frame) shows excellent agreement with the LF with the slope of (McLure et al., 2013) down to (Figure 12). Here we neglect the effect of dust extinction, as the galaxies in our sample are very metal-poor ().
| 8.25 | 0.144 0.038 |
|---|---|
| 8.75 | 0.146 0.064 |
| 9.25 | 0.148 0.077 |
| 9.75 | 0.128 0.069 |
| 10.25 | 0.113 0.079 |
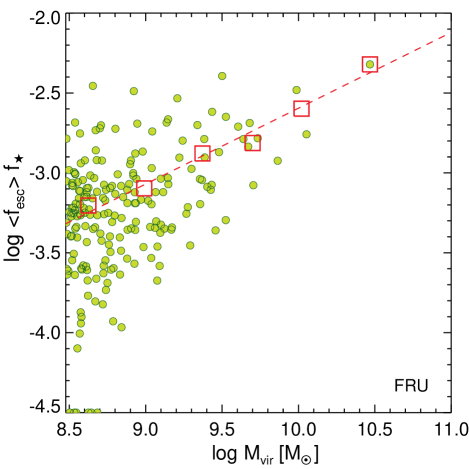
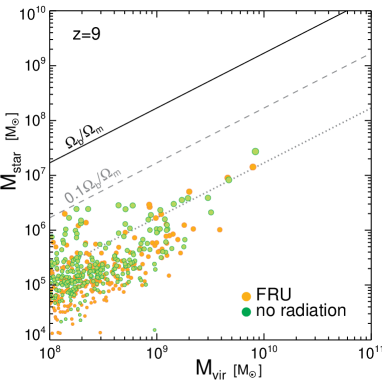
In Figure 13, we plot the product of photon number-weighted escape fraction () and baryon-to-star conversion efficiency () at . Notice that we include all stars within the virial radius of a dark matter halo in this measurement. Since there is little evolution in with redshift (Figure 10, right panel), we combine of the halos in the same mass range at to obtain the mean escape fraction as a function of halo mass (Table LABEL:table2). We then use a simple fit to the mean, as
| (3) |
We limit our fit to the sample with , where each halo is resolved with 2000 dark matter particles and more. There is a trend that more massive halos contribute more to the total number of ionizing photons per mass, which essentially reflects the fact that low-mass halos are inefficient in forming stars (see also Figure 3). The average of different halo masses can be fitted with
| (4) |
shown as the red dashed line in Figure 13. We note that becomes as low as in small halos (), which is roughly 40 times smaller than the results from Wise & Cen (2009) (). The difference can be attributed to two factors. First, our is smaller by a factor of than that of Wise & Cen (2009). This is probably due to the fact that their cosmological runs start from the initial condition extracted from adiabatic simulations in which no prior star formation is included. Since radiative cooling and star formation are suddenly turned on at some redshift, the gas in the halo rapidly collapses and forms too many stars in their cosmological runs. This is likely to have resulted in stronger starbursts in the galaxies, leading to a higher escape probability. Second, because of the same reason, is considerably higher in the Wise & Cen (2009) halos than in our halos. For halos of masses with , we find that , which is smaller by a factor of than those in Wise & Cen (2009). Indeed, we find fairly good agreement with the latest determination of in halos of by Wise et al. (2014), who model star formation self-consistently in their cosmological radiation hydrodynamics simulations.
It is worth mentioning that adopting high spatial resolution (or gravitational softening length) is important to accurately predict the escape fraction. If the resolution is not high enough to capture the rapid collapse of gas clouds, the resulting star formation histories would become less episodic, leading to a longer time delay between the peak of star formation and escape fraction. This in turn would reduce the fraction of escaping photons. To examine this issue, we run two additional simulations with the identical initial condition and other parameters, but with one less or more level of refinement, corresponding to 8.5 pc or 2.1 pc (physical) resolution, respectively. We find that the run with the lower resolution yields a factor of two smaller mean escape fraction at z=9 (, see Appendix). On the contrary, higher resolution run exhibits a comparable mean escape fraction of at , suggesting that the results are reasonably converged for the parameters used in the FRU run.
4. Discussion
Recent studies show that the escape fraction should be larger than 20% to re-ionize the universe by matching the Thomson optical depth inferred from the CMB (Kuhlen & Faucher-Giguère, 2012; Shull et al., 2012; Robertson et al., 2013). This can be obtained by numerically solving the simple differential equation for the H ii bubble
| (5) |
where is the volume filling fraction of the bubble, is the comoving mean density of the universe, and is the recombination timescale for a given clumping factor and temperature. Here is a correction factor that accounts for the additional contribution of singly () or doubly () ionized helium to the number density of electron (e.g., Kuhlen & Faucher-Giguère, 2012). We adopt a redshift-dependent clumping factor of at or at following Pawlik et al. (2009). Once is determined, the Thomson optical depth as a function of redshift can be calculated as
| (6) |
where is the Thomson electron cross section, and is the Hubble parameter. We follow the exercise by using the ionizing photon density from Figure 11 to examine whether our models provide a reasonable explanation for the reionization history. For at , we extrapolate based on the simple fit to the results in Figure 11. This simple experiment indicates that the universe can be re-ionized by . However, the evolution of the photon density from the FRU run predicts a smaller volume filling fraction of the H ii bubble at (), compared with other analytic models (, e.g. Shull et al., 2012) that could reproduce the CMB measurement (, Komatsu et al., 2011). Consequently, the FRU run yields the Thomson optical depth of , which is consistent only within 2 with the CMB measurement. This implies that more ionizing photons are required to escape from halos at high redshift to explain the reionization history of the Universe.
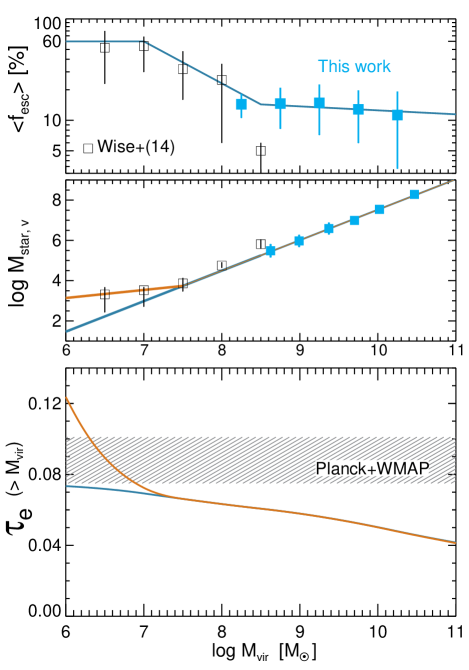
The deficiency of ionizing photons may in part be attributed to the fact that our simulations cannot resolve the collapse of small-mass halos () due to finite mass resolution. Paardekooper et al. (2013) argue that reionization is driven by dwarf-sized halos of masses with high of 0.4–0.9. Similarly, Wise et al. (2014) find that the ionizing photons from the minihalos with is crucial at reproducing the Thompson optical depth from the CMB measurements. In order to examine the importance of the minihalos in light of our new results, we estimate the optical depth as a function of the minimum halo mass that can contribute to reionization. To do so, we use the theoretical halo mass functions at different redshifts (Jenkins et al., 2001), convolved with the baryon-to-star conversion efficiency measured at from the FRU run for and Wise et al. (2014) for (orange line in the middle panel of Figure 14), to derive the increase in the stellar mass density with redshift. The number of escaping ionizing photons is then calculated by multiplying the number of photons produced with the halo mass-dependent escape fraction based on our results and Wise et al. (2014), as (Figure 14, top panel)
| (7) |
We neglect the contribution from rare massive halos with . Figure 14 (orange line, bottom panel) shows that the minihalos of can indeed provide enough photons to match inferred from the CMB measurement. While the ionizing photons from only gives , the additional photons arising from the minihalos augment the optical depth to 0.122. However, we note that this sensitively depends on the assumption on the baryon-to-star conversion efficiency in the minihalos. For example, when the stellar mass-halo mass relation found in the FRU is extrapolated to the minihalos (blue line in the bottom panel), the optical depth for the entire halos is only . Given that these minihalos would host a handful of star particles with in current numerical simulations, it is unclear how the mass resolution affects the conversion efficiency, and further investigations on star formation in the minihalos will be useful to better understand their relative role to the total ionizing budget.
In our simulation, we approximate that massive stars () evolve off and explode after 10 Myr. We note that this is roughly the timescale of the delay between the peak of star formation and escape fraction. In reality, the SN can emerge as early as 3 Myr for a simple population (Schaller et al., 1992). Stellar winds, photo-ionization, and radiation pressure acting on electron and dust can come into play even earlier. Walch et al. (2012) claims that a molecular cloud of the radius 6.4 pc can be dispersed on a 1-2 Myr timescale by the overpressure of H ii regions. Moreover, it is also plausible that the ionization front instabilities may lead to the higher escape probability of ionizing photons (Whalen & Norman, 2008). If these mechanisms played a role in shaping the evolution of individual molecular clouds, the escape fraction measured in our simulations would have been higher than 14%. In this regard, our photon number-weighted mean is likely to represent the minimum escape of ionizing photons. When a higher of 30% is assumed for the star formation history in the FRU run, dark matter halos of alone can achieve , suggesting that a more precise determination of the escape fraction is as equally important as resolving ultra-faint galaxies with . Future studies focusing on the interplay between the feedback processes will shed more light on the reionization history of the Universe.
5. Conclusions
The escape fraction of hydrogen ionizing photons is a critical ingredient in the theory of reionization. Despite its importance, only a handful of studies examined the escape fraction () of high- galaxies in a cosmological context (Wise & Cen, 2009; Razoumov & Sommer-Larsen, 2010; Yajima et al., 2011; Paardekooper et al., 2013; Wise et al., 2014). To better understand the physics behind the escape of ionizing photons and quantify , we have carried out two zoomed-in cosmological radiation hydrodynamics simulations of Mpc3 box (comoving) with the Ramses code (Teyssier, 2002; Rosdahl et al., 2013) with high spatial ( 4 pc, physical) and stellar mass resolution of 49 . Because energy-based feedback from SN explosions suffers from the artificial radiative cooling if the cooling length is under-resolved, we have implemented a new mechanical feedback scheme that can approximate all stages of a SN explosion from the free expansion to snowplow phase. With the physically based feedback model, we have investigated the connection between the regulation of star formation and corresponding evolution of the escape of ionizing photons. We have also explored the relative importance of runaway OB stars to the escape fraction by comparing the twin simulations with (FRU) and without (FR) runaways. Our findings can be summarized as follows.
-
1.
When a dense cloud begins to form a cluster of stars, the escape fraction is negligible. As energetic explosions by massive stars follow after 10 Myr, it blows the star forming gas away, increasing the instantaneous escape fraction () to 10%. Although is kept high in this phase, subsequent star formation is markedly suppressed, and only a small number of photons escapes from their host dark matter halo (Figure 4). This time delay between the peak of star formation and the escape fraction is crucial in predicting the actual escape probability of ionizing photons. While the instantaneous can easily attain in halos of mass on average (Figure 5), the photon number-weighted mean of the escape fraction () is found to be 11.4% (Figure 6).
-
2.
tends to be higher in less massive halos and at lower redshift for a give halo mass (Figure 5). This is essentially because less dense and smaller galaxies are more susceptible to SN explosions. However, the photon production rate-averaged escape fractions show no clear dependence on halo mass and redshift, again implying that the interplay between star formation and the delay in the onset of negative feedback is more important in determining the actual escape probability.
-
3.
Absorption of ionizing photons by neutral hydrogen in the ISM is significant (Figure 7). For galaxies with a low escape fraction (), the effective optical depth by the gas within 100 pc from each young star particles is found to be at . The nearby neutral gas alone can reduce the number of ionizing photons by 7–45 in this case, demonstrating the importance of properly resolving the ISM to predict a more accurate escape fraction.
-
4.
Our physically based SN feedback effectively regulates star formation. Only 0.1% to 10% of the baryons are converted into stars in galaxies at (Figure 3). The energetic explosions sometimes completely shut down star formation when galaxies are small. The baryon-to-star conversion ratio is smaller in less massive halos. Consequently, halos of different masses contribute comparably to the total number of ionizing photons escaped by (Figure 6).
-
5.
Inclusion of runaway OB stars increases the escape fraction to from 11.4% (Figure 10). Since the runaway OB stars tend to move to lower density regions, photons from them have a higher chance of escaping. Moreover, as the runaway OB stars explode in a less dense medium, feedback from SNe becomes more effective, resulting in reduced star formation in halos , compared with the FR run. Because of the balance between the increase in and the decrease in star formation, the total number of ionizing photons escaped by is found to be comparable in the two runs.
-
6.
A sufficient amount of photons escape from the dark matter halos with to keep the universe ionized at . The simulated UV luminosity function with a faint end slope of -1.9 is consistent with observations.
Appendix A A New Physical Scheme For Supernova Feedback
It is well established that feedback from SN explosions is crucial to understanding many aspects of galaxy evolution (e.g., Dekel & Silk, 1986). Detailed implementation of SN feedback has progressed over time. Early works have included it by depositing internal energy into the parent cell of the SN particle, but the energy is found to be radiated away quickly, making the feedback ineffective (e.g. Katz, 1992; Abadi et al., 2003; Slyz et al., 2005; Hummels & Bryan, 2012). To alleviate the problem, Cen & Ostriker (2006) distributed the thermal energy over 27 neighboring cells weighted by specific volume, which has the virtue of being able to mimic propagation of an explosion that is preferentially channelled into more diffuse regions. Some groups have adopted unconventional schemes to regulate star formation and gas dynamics. These include increasing the total energy from the SN (Thacker & Couchman, 2000), making the SN event more episodic and stronger (Scannapieco et al., 2006; Dalla Vecchia & Schaye, 2012), decoupling hydrodynamic interactions of super-wind particles with the ambient medium (Oppenheimer & Davé, 2006), turning off gas cooling after deposition of SN energy for a significant period of time (Mori et al., 1997; Stinson et al., 2006; Governato et al., 2007), or disabling cooling when the turbulence measured locally is significant (Teyssier et al., 2013). Alternatively, the explosion can be provided in kinetic form (Navarro & White, 1993; Dubois & Teyssier, 2008; Dalla Vecchia & Schaye, 2008). This is not immune to the artificial cooling problem, because the kinetic energy is converted into heat through shocks immediately after launching given the typical high Mach number, ambient density, and limited numerical resolution.
So far there is no satisfactory scheme for modeling the SN feedback that is robust and does not strongly depend on simulation resolution. We have devised a new physical scheme that is reasonably accurate. Before going into details, it is useful to gain a basic physical understanding of the Sedov explosion. The Sedov explosion consists of four stages. In the first stage, the SN ejecta sweep up an insignificant amount of mass compared with the initial ejecta mass, and both energy and momentum are conserved. In the second stage, the swept-up ISM mass is now comparable to or exceeds the initial ejecta mass so the explosion now enters a self-similar phase. Cooling has not set in so energy is conserved up to this stage. As a result, the radial outward momentum increases as the square root of the total shell mass. The third stage is the cooling phase, which is normally very brief in an isobaric gas. The last stage is called the snow-plow phase, when the total linear radial outward momentum is conserved. In essence, the problem of excessive cooling in some simulations is a result of not giving the surrounding gas an adequate amount of momentum that is commensurate with the stage it is supposed to be in, given the physical conditions. For example, in some cosmological simulations with limited resolution, a single cell is already larger than the expected radius at which the snow-plow phase commences. In this case, a physically correct way would be to deposit the maximum expected momentum, as at the end of the cooling phase (i.e., the end of the third stage), to the surrounding cells. If one instead deposits thermal energy with no momentum or a combination of thermal energy and an inadequate amount of momentum, the final momentum would fall short of the true expected momentum. We now describe our new physical scheme in detail.
The momentum input from SN explosions is modeled as
| (A1) |
where is the solid angle subtended by a neighboring cell, is the total explosion energy, is the total ejecta mass, and are the hydrogen number density and gas metallicity of the cell into which the blast wave propagates, and is introduced to smoothly connect the two regimes. The most important quantity in this equation is
| (A2) |
which is the ratio of the shell (ejecta plus mass swept up) to ejecta mass along some solid angle () (see Equation A6). The first part of Equation A1 is valid up to the cooling phase and the second after that. A new and critical element is that we differentiate the energy-conserving and momentum-conserving phase by introducing a mass ratio at the transition (). In actual implementations, the swept-up mass in direction is taken as the sum of the gas mass in the adjacent cell in direction and some fraction of the gas mass in the SN cell (see below).
A simple estimate of momentum budget per SN at the free expansion phase is if the typical SN progenitor mass of on the zero-age main sequence, appropriate for the Chabrier IMF (Chabrier, 2003) with the lower (upper) mass of 8 (100) , is used. On the other hand, the momentum of the SN bubble at the end of the adiabatic phase is much higher (Chevalier, 1974; Cioffi et al., 1988; Blondin et al., 1998),
| (A3) |
where is the energy in the unit of . In addition, Thornton et al. (1998) showed that the momentum input is a decreasing function of the metallicity of ambient medium (). Below atomic cooling is primarily responsible for radiative energy loss, and no dependence with metallicity is seen. Motivated by this, we take the momentum
| (A4) |
during the momentum-conserving phase (i.e., ). It is worth noting that the momentum transfer from SN explosions at the snowplow phase is essential to understanding the self-regulation of star formation in the local ISM (e.g. Shetty & Ostriker, 2012; Kim et al., 2013).
The mass ratio at the transition () is estimated by equating Equation A4 to , where is the kinetic energy at the transition (Blondin et al., 1998), and is the total number of SN events in a cell. This yields
| (A5) |
where . Note that Equation A1 is correct when energy is conserved, and provides a good approximation until . On the other hand, all the momentum available () will be transferred to the surrounding gas when SNe explode in a cell in which a large amount of gas exists ().
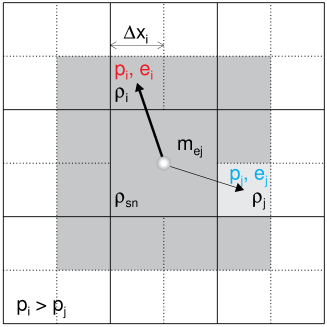
Along with the momentum, mass (ejecta plus mass swept up) and energy are added to the neighboring cells. To illustrate this, let us suppose that a cell in which a SN sits is surrounded by further refined cells (Figure 15). In this case, the total number of adjacent cells except for the ones near 8 vertices is 48 in three-dimensional space. Note that even when the neighbors are not further refined, the following scheme can be applied pretending that the cells are composed of refined cells with the same physical properties. We assume that the gas mass entrained from the SN cell and ejecta are evenly distributed (by the volume) to the cells that are directly affected by the SN (shaded region in Figure 15). The total shell mass entrained in a neighboring cell is then
| (A6) |
where and are the density and size of the SN cell, respectively, is the ejecta mass from SN explosions in the SN cell, and is the mass fraction of 8–100 stars for a simple stellar population with the Chabrier IMF. The corresponding stellar ejecta in the neighboring cell is . We take a simple approximation that . In Equation A6, determines how much fraction of the gas entrained is left behind in the SN cell. In the case of unigrid or smoothed particle hydrodynamics (SPH) simulations, this number can simply be chosen as the ratio of the volume taken by the SN cell and total volume that are directly affected, i.e., . We take so that mass is evenly distributed when the neighboring cell has the same level of refinement as the SN cell.
Note that this scheme can easily be implemented in SPH simulations by computing the local mass loading through some solid angle for the N nearest particles. While this paper was being written, we came to know that a similar approach for SN feedback is implemented by Hopkins et al. (2013), based on the cooling radii of individual blast waves, . It is useful to point out that there are two significant differences between the two models. First, the momentum input at solar metallicity is about twice larger in Hopkins et al. (2013) than the measurements from a set of high-resolution hydrodynamics simulations of SN explosions that we use (Thornton et al., 1998). Second, their input momentum has a steeper dependence on metallicity () than that our case (, Thornton et al., 1998). We note that the combination may result in the overestimation of the impact of SN explosions by a factor of 2.4 for the gas with in their case.
Finally, we ensure that the total energy is conserved before and after the momentum injection; the residual (total minus kinetic) surplus energy is added as thermal energy to the affected cells in our case.
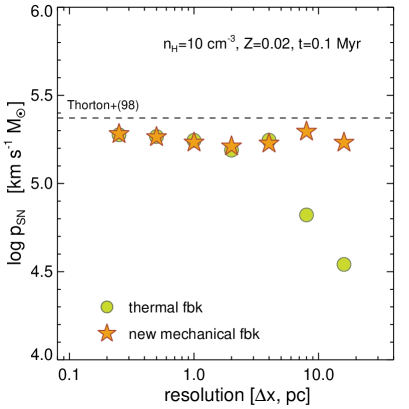
In order to examine how the new model compares with the standard energy feedback scheme, we perform idealized simulations by placing a SN in a uniform medium of number density with solar metallicity. The radiative cooling is included in all calculations. The size of the simulated box is set to 128 pc (or 256 pc for the coarsest resolution run) while increasing the number of cells from to . Then we measure the radial momentum from the explosion at the momentum-conserving phase (0.1Myr, Thornton et al., 1998). Note that the mass swept up by supernova ejecta is different depending on the resolution in our new feedback model, which in turn change the input momentum to the adjacent cells at the time of explosion. For example, varies from 1.0006 to 164.3 for the runs with 0.25 to 16 pc, respectively. The corresponding momentum input based on Equation A1 is 1.0003 to 7.136 times , and thus the different resolution runs correspond to different stages of the explosion from the adiabatic to momentum-conserving phase in practice. Figure 16 shows that approximately the same amount of momentum is transferred to the surrounding medium with our new mechanical feedback scheme. For comparison, we also run the same set of simulations with thermal feedback which distributes the SN energy into the 27 surrounding cells. We find that although the amount of momentum at the snowplow phase is roughly smaller than the prediction by 1D hydrodynamics simulations (Thornton et al., 1998), the results from the thermal and our mechanical model are very similar when high resolution is employed ( 4 pc). On the other hands, the thermal feedback exhibits the well-known overcooling problem in lower resolution runs ( 8 pc). We also perform the same experiment in gas with , and find that at least 1pc resolution is required to properly model the momentum transfer with thermal feedback, while the momentum transfer is again not sensitive to the resolution with our mechanical feedback scheme.
Appendix B Suppression of star formation in low-mass halos
In the main text, we show that stars form inefficiently in a low-mass halo with , and attribute this to the fact that supernova feedback is very effective. However, photoionizing background radiation may also prevent gas from collapsing into the small halos (e.g. Shapiro et al., 1994; Thoul & Weinberg, 1996). In order to substantiate our claim, we carry out a hydrodynamics+N-body version of the FRU run down to , with a radiative transfer module turned off. Other physical and numerical parameters including the initial condition are kept fixed. Note that we expect a stronger impact from reionization in the FRU run, as the escape of ionizing photons is more significant than in the FR run. Figure 17 shows that only a small fraction of baryons () is converted into stars in the small halos even in the absence of ionizing radiation, demonstrating that supernova feedback is primarily responsible for the low conversion efficiency found in our simulations.
Appendix C Effect of spatial resolution
We examine the effect of varying the spatial resolution on the mean escape fraction in Figure 18. All other parameters are fixed as in the FRU run. We run the lower (higher) resolution simulation down to z=9 (z=10), and compare the photon number-weighted time average of the escape fraction () with that from the FRU run. While the lower resolution run (8.5 pc, dotted) shows a lower mean escape of than the FRU, a similar fraction (13.9%) of ionizing photons is escaped from halos in the higher resolution run (2.1pc, dot-dashed), indicating that the escape fraction in our fiducial run is reasonably converged for the parameters used. We carefully inspect the cause of the lower escape fraction in the 8.5 pc run, and find that this is due to a longer time delay between the peak of star formation and escape fraction as gas clouds collapse slowly compared with the higher resolution runs (2.1 or 4.2 pc).

References
- Abadi et al. (2003) Abadi, M. G., Navarro, J. F., Steinmetz, M., & Eke, V. R. 2003, ApJ, 597, 21
- Alves et al. (2007) Alves, J., Lombardi, M., & Lada, C. J. 2007, A&A, 462, L17
- Anninos et al. (1997) Anninos, P., Zhang, Y., Abel, T., & Norman, M. L. 1997, New A, 2, 209
- Arnett (1996) Arnett, D. 1996, Supernovae and Nucleosynthesis: An Investigation of the History of Matter from the Big Bang to the Present
- Barkana & Loeb (2001) Barkana, R., & Loeb, A. 2001, Phys. Rep., 349, 125
- Becker et al. (2001) Becker, R. H., Fan, X., White, R. L., et al. 2001, AJ, 122, 2850
- Behroozi et al. (2013) Behroozi, P. S., Wechsler, R. H., & Conroy, C. 2013, ApJ, 770, 57
- Bergvall et al. (2006) Bergvall, N., Zackrisson, E., Andersson, B.-G., et al. 2006, A&A, 448, 513
- Bianchi et al. (2001) Bianchi, S., Cristiani, S., & Kim, T.-S. 2001, A&A, 376, 1
- Blaauw (1961) Blaauw, A. 1961, Bull. Astron. Inst. Netherlands, 15, 265
- Blondin et al. (1998) Blondin, J. M., Wright, E. B., Borkowski, K. J., & Reynolds, S. P. 1998, ApJ, 500, 342
- Bolton & Haehnelt (2007) Bolton, J. S., & Haehnelt, M. G. 2007, MNRAS, 382, 325
- Bouwens et al. (2011) Bouwens, R. J., Illingworth, G. D., Oesch, P. A., et al. 2011, ApJ, 737, 90
- Bouwens et al. (2012) —. 2012, ApJ, 754, 83
- Bridge et al. (2010) Bridge, C. R., Teplitz, H. I., Siana, B., et al. 2010, ApJ, 720, 465
- Bryan & Norman (1998) Bryan, G. L., & Norman, M. L. 1998, ApJ, 495, 80
- Cen (2003) Cen, R. 2003, ApJ, 591, 12
- Cen & Ostriker (1992) Cen, R., & Ostriker, J. P. 1992, ApJ, 399, L113
- Cen & Ostriker (2006) —. 2006, ApJ, 650, 560
- Ceverino & Klypin (2009) Ceverino, D., & Klypin, A. 2009, ApJ, 695, 292
- Chabrier (2003) Chabrier, G. 2003, PASP, 115, 763
- Chevalier (1974) Chevalier, R. A. 1974, ApJ, 188, 501
- Ciardi et al. (2003) Ciardi, B., Ferrara, A., & White, S. D. M. 2003, MNRAS, 344, L7
- Cioffi et al. (1988) Cioffi, D. F., McKee, C. F., & Bertschinger, E. 1988, ApJ, 334, 252
- Clarke & Oey (2002) Clarke, C., & Oey, M. S. 2002, MNRAS, 337, 1299
- Conroy & Kratter (2012) Conroy, C., & Kratter, K. M. 2012, ApJ, 755, 123
- Cooke et al. (2014) Cooke, J., Ryan-Weber, E. V., Garel, T., & Gonzalo Diaz, C. 2014, ArXiv e-prints, arXiv:1404.0125
- Cowie et al. (2009) Cowie, L. L., Barger, A. J., & Trouille, L. 2009, ApJ, 692, 1476
- Dalla Vecchia & Schaye (2008) Dalla Vecchia, C., & Schaye, J. 2008, MNRAS, 387, 1431
- Dalla Vecchia & Schaye (2012) —. 2012, MNRAS, 426, 140
- Deharveng et al. (2001) Deharveng, J.-M., Buat, V., Le Brun, V., et al. 2001, A&A, 375, 805
- Dekel & Silk (1986) Dekel, A., & Silk, J. 1986, ApJ, 303, 39
- Dekel et al. (2009) Dekel, A., Birnboim, Y., Engel, G., et al. 2009, Nature, 457, 451
- Dijkstra et al. (2004) Dijkstra, M., Haiman, Z., Rees, M. J., & Weinberg, D. H. 2004, ApJ, 601, 666
- Dopita et al. (2011) Dopita, M. A., Krauss, L. M., Sutherland, R. S., Kobayashi, C., & Lineweaver, C. H. 2011, Ap&SS, 335, 345
- Dubois & Teyssier (2008) Dubois, Y., & Teyssier, R. 2008, A&A, 477, 79
- Dunlop et al. (2012) Dunlop, J. S., Rogers, A. B., McLure, R. J., et al. 2012, ArXiv e-prints, arXiv:1212.0860 [astro-ph.CO]
- Engelbracht et al. (2008) Engelbracht, C. W., Rieke, G. H., Gordon, K. D., et al. 2008, ApJ, 678, 804
- Fan et al. (2001) Fan, X., Narayanan, V. K., Lupton, R. H., et al. 2001, AJ, 122, 2833
- Fan et al. (2006) Fan, X., Strauss, M. A., Becker, R. H., et al. 2006, AJ, 132, 117
- Faucher-Giguère et al. (2010) Faucher-Giguère, C.-A., Kereš, D., Dijkstra, M., Hernquist, L., & Zaldarriaga, M. 2010, ApJ, 725, 633
- Faucher-Giguère et al. (2008) Faucher-Giguère, C.-A., Lidz, A., Hernquist, L., & Zaldarriaga, M. 2008, ApJ, 688, 85
- Finlator et al. (2011) Finlator, K., Oppenheimer, B. D., & Davé, R. 2011, MNRAS, 410, 1703
- Fisher et al. (2013) Fisher, D. B., Bolatto, A. D., Herrera-Camus, R., et al. 2013, ArXiv e-prints, arXiv:1310.4842 [astro-ph.CO]
- Fontanot et al. (2014) Fontanot, F., Cristiani, S., Pfrommer, C., Cupani, G., & Vanzella, E. 2014, MNRAS, arXiv:1312.0615 [astro-ph.CO]
- Fujita et al. (2003) Fujita, A., Martin, C. L., Mac Low, M.-M., & Abel, T. 2003, ApJ, 599, 50
- Galametz et al. (2011) Galametz, M., Madden, S. C., Galliano, F., et al. 2011, A&A, 532, A56
- Geen et al. (2013) Geen, S., Slyz, A., & Devriendt, J. 2013, MNRAS, 429, 633
- Gill et al. (2004) Gill, S. P. D., Knebe, A., & Gibson, B. K. 2004, MNRAS, 351, 399
- Gnedin (2000a) Gnedin, N. Y. 2000a, ApJ, 535, 530
- Gnedin (2000b) —. 2000b, ApJ, 542, 535
- Gnedin & Abel (2001) Gnedin, N. Y., & Abel, T. 2001, New Astronomy, 6, 437
- Gnedin et al. (2008) Gnedin, N. Y., Kravtsov, A. V., & Chen, H.-W. 2008, ApJ, 672, 765
- Gong & Ostriker (2011) Gong, H., & Ostriker, E. C. 2011, ApJ, 729, 120
- Górski et al. (2005) Górski, K. M., Hivon, E., Banday, A. J., et al. 2005, ApJ, 622, 759
- Governato et al. (2007) Governato, F., Willman, B., Mayer, L., et al. 2007, MNRAS, 374, 1479
- Gunn & Peterson (1965) Gunn, J. E., & Peterson, B. A. 1965, ApJ, 142, 1633
- Haehnelt et al. (2001) Haehnelt, M. G., Madau, P., Kudritzki, R., & Haardt, F. 2001, ApJ, 549, L151
- Hahn & Abel (2011) Hahn, O., & Abel, T. 2011, MNRAS, 415, 2101
- Harten et al. (1983) Harten, A., Lax, P., & van Leer, B. 1983, SIAM, 25, 35
- Hoogerwerf et al. (2001) Hoogerwerf, R., de Bruijne, J. H. J., & de Zeeuw, P. T. 2001, A&A, 365, 49
- Hopkins et al. (2013) Hopkins, P. F., Keres, D., Onorbe, J., et al. 2013, ArXiv e-prints, arXiv:1311.2073 [astro-ph.CO]
- Hummels & Bryan (2012) Hummels, C. B., & Bryan, G. L. 2012, ApJ, 749, 140
- Iwata et al. (2009) Iwata, I., Inoue, A. K., Matsuda, Y., et al. 2009, ApJ, 692, 1287
- Jenkins et al. (2001) Jenkins, A., Frenk, C. S., White, S. D. M., et al. 2001, MNRAS, 321, 372
- Katz (1992) Katz, N. 1992, ApJ, 391, 502
- Kennicutt (1998) Kennicutt, Jr., R. C. 1998, ApJ, 498, 541
- Khokhlov (1998) Khokhlov, A. M. 1998, J. Comp. Phys., 143, 519
- Kim et al. (2013) Kim, C.-G., Ostriker, E. C., & Kim, W.-T. 2013, ApJ, 776, 1
- Kimm & Cen (2013) Kimm, T., & Cen, R. 2013, ApJ, 776, 35
- Kimm et al. (2011a) Kimm, T., Devriendt, J., Slyz, A., et al. 2011a, ArXiv e-prints, arXiv:1106.0538 [astro-ph.CO]
- Kimm et al. (2011b) Kimm, T., Slyz, A., Devriendt, J., & Pichon, C. 2011b, MNRAS, 413, L51
- Knollmann & Knebe (2009) Knollmann, S. R., & Knebe, A. 2009, ApJS, 182, 608
- Komatsu et al. (2011) Komatsu, E., Smith, K. M., Dunkley, J., Bennett, C. L., & Gold, B. 2011, ApJS, 192, 18
- Könyves et al. (2010) Könyves, V., André, P., Men’shchikov, A., et al. 2010, A&A, 518, L106
- Kravtsov et al. (1997) Kravtsov, A. V., Klypin, A. A., & Khokhlov, A. M. 1997, ApJS, 111, 73
- Kroupa (2001) Kroupa, P. 2001, MNRAS, 322, 231
- Krumholz & Tan (2007) Krumholz, M. R., & Tan, J. C. 2007, ApJ, 654, 304
- Kuhlen & Faucher-Giguère (2012) Kuhlen, M., & Faucher-Giguère, C.-A. 2012, MNRAS, 423, 862
- Larson (1969) Larson, R. B. 1969, MNRAS, 145, 271
- Leitherer et al. (1995) Leitherer, C., Ferguson, H. C., Heckman, T. M., & Lowenthal, J. D. 1995, ApJ, 454, L19
- Leitherer et al. (1999) Leitherer, C., Schaerer, D., Goldader, J. D., et al. 1999, ApJS, 123, 3
- Leonard & Duncan (1988) Leonard, P. J. T., & Duncan, M. J. 1988, AJ, 96, 222
- Lisenfeld & Ferrara (1998) Lisenfeld, U., & Ferrara, A. 1998, ApJ, 496, 145
- Madau et al. (1999) Madau, P., Haardt, F., & Rees, M. J. 1999, ApJ, 514, 648
- Malkan et al. (2003) Malkan, M., Webb, W., & Konopacky, Q. 2003, ApJ, 598, 878
- McKee & Ostriker (2007) McKee, C. F., & Ostriker, E. C. 2007, ARA&A, 45, 565
- McKee & Ostriker (1977) McKee, C. F., & Ostriker, J. P. 1977, ApJ, 218, 148
- McLure et al. (2013) McLure, R. J., Dunlop, J. S., Bowler, R. A. A., et al. 2013, MNRAS, 432, 2696
- McQuinn et al. (2007) McQuinn, M., Lidz, A., Zahn, O., et al. 2007, MNRAS, 377, 1043
- Miralda-Escudé et al. (2000) Miralda-Escudé, J., Haehnelt, M., & Rees, M. J. 2000, ApJ, 530, 1
- Mori et al. (1997) Mori, M., Yoshii, Y., Tsujimoto, T., & Nomoto, K. 1997, ApJ, 478, L21
- Navarro & White (1993) Navarro, J. F., & White, S. D. M. 1993, MNRAS, 265, 271
- Nestor et al. (2013) Nestor, D. B., Shapley, A. E., Kornei, K. A., Steidel, C. C., & Siana, B. 2013, ApJ, 765, 47
- Nestor et al. (2011) Nestor, D. B., Shapley, A. E., Steidel, C. C., & Siana, B. 2011, ApJ, 736, 18
- Noh & McQuinn (2014) Noh, Y., & McQuinn, M. 2014, ArXiv e-prints, arXiv:1401.0737 [astro-ph.CO]
- Ocvirk et al. (2008) Ocvirk, P., Pichon, C., & Teyssier, R. 2008, MNRAS, 390, 1326
- Oppenheimer & Davé (2006) Oppenheimer, B. D., & Davé, R. 2006, MNRAS, 373, 1265
- Osterbrock & Ferland (2006) Osterbrock, D. E., & Ferland, G. J. 2006, Astrophysics of gaseous nebulae and active galactic nuclei
- Ouchi et al. (2009) Ouchi, M., Mobasher, B., Shimasaku, K., et al. 2009, ApJ, 706, 1136
- Paardekooper et al. (2013) Paardekooper, J.-P., Khochfar, S., & Dalla Vecchia, C. 2013, MNRAS, 429, L94
- Pawlik et al. (2009) Pawlik, A. H., Schaye, J., & van Scherpenzeel, E. 2009, MNRAS, 394, 1812
- Penston (1969) Penston, M. V. 1969, MNRAS, 144, 425
- Planck Collaboration et al. (2013) Planck Collaboration, Ade, P. A. R., Aghanim, N., et al. 2013, ArXiv e-prints, arXiv:1303.5076 [astro-ph.CO]
- Powell et al. (2011) Powell, L. C., Slyz, A., & Devriendt, J. 2011, MNRAS, 414, 3671
- Press et al. (1992) Press, W. H., Teukolsky, S. A., Vetterling, W. T., & Flannery, B. P. 1992, Numerical recipes in FORTRAN. The art of scientific computing
- Raičević et al. (2011) Raičević, M., Theuns, T., & Lacey, C. 2011, MNRAS, 410, 775
- Razoumov et al. (2002) Razoumov, A. O., Norman, M. L., Abel, T., & Scott, D. 2002, ApJ, 572, 695
- Razoumov & Sommer-Larsen (2010) Razoumov, A. O., & Sommer-Larsen, J. 2010, ApJ, 710, 1239
- Reddy et al. (2008) Reddy, N. A., Steidel, C. C., Pettini, M., et al. 2008, ApJS, 175, 48
- Robertson et al. (2013) Robertson, B. E., Furlanetto, S. R., Schneider, E., et al. 2013, ApJ, 768, 71
- Rosdahl & Blaizot (2012) Rosdahl, J., & Blaizot, J. 2012, MNRAS, 423, 344
- Rosdahl et al. (2013) Rosdahl, J., Blaizot, J., Aubert, D., Stranex, T., & Teyssier, R. 2013, ArXiv e-prints, arXiv:1304.7126 [astro-ph.CO]
- Rosen & Bregman (1995) Rosen, A., & Bregman, J. N. 1995, ApJ, 440, 634
- Scannapieco et al. (2006) Scannapieco, C., Tissera, P. B., White, S. D. M., & Springel, V. 2006, MNRAS, 371, 1125
- Schaller et al. (1992) Schaller, G., Schaerer, D., Meynet, G., & Maeder, A. 1992, A&AS, 96, 269
- Schirber & Bullock (2003) Schirber, M., & Bullock, J. S. 2003, ApJ, 584, 110
- Schmidt (1959) Schmidt, M. 1959, ApJ, 129, 243
- Shapiro et al. (1994) Shapiro, P. R., Giroux, M. L., & Babul, A. 1994, ApJ, 427, 25
- Shapley et al. (2006) Shapley, A. E., Steidel, C. C., Pettini, M., Adelberger, K. L., & Erb, D. K. 2006, ApJ, 651, 688
- Shetty & Ostriker (2012) Shetty, R., & Ostriker, E. C. 2012, ApJ, 754, 2
- Shin et al. (2008) Shin, M.-S., Trac, H., & Cen, R. 2008, ApJ, 681, 756
- Shull et al. (2012) Shull, J. M., Harness, A., Trenti, M., & Smith, B. D. 2012, ApJ, 747, 100
- Siana et al. (2007) Siana, B., Teplitz, H. I., Colbert, J., et al. 2007, ApJ, 668, 62
- Siana et al. (2010) Siana, B., Teplitz, H. I., Ferguson, H. C., et al. 2010, ApJ, 723, 241
- Slyz et al. (2005) Slyz, A. D., Devriendt, J. E. G., Bryan, G., & Silk, J. 2005, MNRAS, 356, 737
- Sobacchi & Mesinger (2013) Sobacchi, E., & Mesinger, A. 2013, MNRAS, 432, L51
- Somerville et al. (2003) Somerville, R. S., Bullock, J. S., & Livio, M. 2003, ApJ, 593, 616
- Sommer-Larsen et al. (2003) Sommer-Larsen, J., Götz, M., & Portinari, L. 2003, ApJ, 596, 47
- Stewart et al. (2011) Stewart, K. R., Kaufmann, T., Bullock, J. S., et al. 2011, ApJ, 735, L1
- Stinson et al. (2006) Stinson, G., Seth, A., Katz, N., et al. 2006, MNRAS, 373, 1074
- Stone (1991) Stone, R. C. 1991, AJ, 102, 333
- Sutherland & Dopita (1993) Sutherland, R. S., & Dopita, M. A. 1993, ApJS, 88, 253
- Tetzlaff et al. (2011) Tetzlaff, N., Neuhäuser, R., & Hohle, M. M. 2011, MNRAS, 410, 190
- Teyssier (2002) Teyssier, R. 2002, A&A, 385, 337
- Teyssier et al. (2013) Teyssier, R., Pontzen, A., Dubois, Y., & Read, J. I. 2013, MNRAS, 429, 3068
- Thacker & Couchman (2000) Thacker, R. J., & Couchman, H. M. P. 2000, ApJ, 545, 728
- Thornton et al. (1998) Thornton, K., Gaudlitz, M., Janka, H.-T., & Steinmetz, M. 1998, ApJ, 500, 95
- Thoul & Weinberg (1996) Thoul, A. A., & Weinberg, D. H. 1996, ApJ, 465, 608
- Toro et al. (1994) Toro, E. F., Spruce, M., & Speares, W. 1994, Shock Waves, 4, 25
- Trac & Cen (2007) Trac, H., & Cen, R. 2007, ApJ, 671, 1
- Walch et al. (2012) Walch, S. K., Whitworth, A. P., Bisbas, T., Wünsch, R., & Hubber, D. 2012, MNRAS, 427, 625
- Whalen & Norman (2008) Whalen, D., & Norman, M. L. 2008, ApJ, 673, 664
- Whalen et al. (2008) Whalen, D., van Veelen, B., O’Shea, B. W., & Norman, M. L. 2008, ApJ, 682, 49
- Willott et al. (2010) Willott, C. J., Delorme, P., Reylé, C., et al. 2010, AJ, 139, 906
- Wise & Cen (2009) Wise, J. H., & Cen, R. 2009, ApJ, 693, 984
- Wise et al. (2014) Wise, J. H., Demchenko, V. G., Halicek, M. T., et al. 2014, ArXiv e-prints, arXiv:1403.6123
- Wyithe & Cen (2007) Wyithe, J. S. B., & Cen, R. 2007, ApJ, 659, 890
- Wyithe & Loeb (2003) Wyithe, J. S. B., & Loeb, A. 2003, ApJ, 586, 693
- Yajima et al. (2011) Yajima, H., Choi, J.-H., & Nagamine, K. 2011, MNRAS, 412, 411