WISEP J061135.13041024.0AB: A -Band Flux Reversal Binary at the L/T Transition
Abstract
We present Keck II laser guide star adaptive optics observations of the brown dwarf WISEP J061135.13041024.0 showing it is a binary with a component separation of 04. This system is one of the six known resolved binaries in which the magnitude differences between the components show a reversal in sign between the / band and the / bands. Deconvolution of the composite spectrum results in a best fit binary solution with L9 and T1.5 components. We also present a preliminary parallax placing the system at a distance of 21.21.3 pc. Using the distance and resolved magnitudes we are able to place WISEP J061135.13041024.0AB on a color-absolute magnitude diagram, showing that this system contributes to the well-known “-band bump” and the components’ properties appear similar to other late-type L and early-type T dwarfs. Fitting our data to a set of cloudy atmosphere models suggests the system has an age 1 Gyr with WISE 06110410A having an effective temperature () of 1275-1325 K and mass of 64–65 , and WISE 06110410B having = 1075–1115 K and mass 40–65 .
1 Introduction
The -band flux of stellar objects changes by nearly 12 orders of magnitude from O stars down to the Y dwarfs (Kirkpatrick et al. 2012). The progression of absolute magnitude () along this sequence is fairly smooth except for two major kinks111There could be a third kink in this sequence in the Y dwarfs (Kirkpatrick et al. 2012). The first occurs in the early-type M dwarfs, where the formation of H2 at these temperatures results in a short plateau in (Mould 1976; Mould & Hyland 1976). The other kink lies at the transition between the L and T dwarfs. It is here that the absolute magnitude shows a distinct flattening before turning downward at the early-mid type T dwarfs (Tinney et al. 2003). The source of this flattening, and the slight increase in absolute at these same spectral types, is not understood, but could be related to clouds, as discussed below.
Clouds are required in the atmospheric models of L dwarfs in order to replicate the observed spectral and photometric trends. Conversely, models to match the observed properties of T dwarfs require the clouds to be completely dissipated, leaving the atmospheres clear of condensates. The transition from the cloudy L dwarfs to the clear T dwarfs is not well understood and has been notoriously difficult to model. A gradual lowering of a cloud deck through the L to T cooling sequence using a single sedimentation efficiency (; Ackerman & Marley 2001) produces a shift in the near-IR magnitudes that is too slow to account for the observed colors and absolute magnitudes of L and T dwarfs (Knapp et al. 2004). However, if increases from 2 for the L dwarfs to infinity for the T dwarfs, giving the T dwarfs cloud-free atmospheres, then the bump in absolute magnitude can be modeled. Conceptually, the change in means that condensates in the L dwarfs would precipitate out of the clouds like a light rain shower. As the object cools to later spectral types, the clouds fall deeper in the atmosphere and the condensates rain out progressively harder and harder, until the clouds drop below the photosphere and the atmosphere appears cloud-free.
The rapid clearing of the clouds and transition from L dwarf to T dwarf can also be explained by holes in the clouds (Ackerman & Marley 2001; Burgasser et al. 2002; Marley et al. 2010; Skemer et al. 2013). Small holes in the cloud deck allow hotter flux from deeper layers to emerge, analogous to Jupiter’s 5 “hot-spots” (Westphal et al. 1974). The presence of the holes results in a slightly brighter luminosity and bluer color. The coverage area of the holes would rapidly progress from 0% for the cloudy L dwarfs to 100% for the clear T dwarfs.
In addition to the bump in absolute magnitude, the L-T transition region is also characterized by a resurgence in the strength of FeH absorption at 9896 Å (Burgasser et al. 2002). This feature becomes weaker through the L dwarf sequence, nearly disappearing in L8 dwarfs, but then reappears in the mid-T dwarfs. Both the “sudden downpour” and the “cloud disruption” models can account for this resurgence in the FeH feature. In the sudden downpour model, the increase in means that the Fe cloud becomes thinner and drops deeper into the atmosphere. Consequently, the amount of FeH that is visible increases, thereby increasing the strength of the absorption feature (Cushing et al. 2008). Conversely, the holes in the cloud disruption model allows gaseous FeH below the cloud deck to become visible (Burgasser et al. 2002), which results in stronger FeH features in the observed spectra of early-T dwarfs.
Although some objects on the bright end of the bump may be unresolved binaries (Burrows et al. 2006), these “crypto-binaries” cannot account for all objects in the bump. Several binary systems, typically consisting of a late-L to early-T dwarf primary and an early- to mid-T dwarf secondary, have been discovered in which the secondary component is brighter than the primary in the 1.0-1.3 region (see Table 1). These systems indicate that the brightening in -band from late-type L to early-type T is an intrinsic property of these objects and not the result of some selection effect. For example, the theory that the apparent brightening in the color-magnitude diagram is caused by objects with widely varying gravities (Tsuji & Nakajima 2003) can be discounted because such a scenario requires objects at vastly different ages, which is not likely in these presumably coeval binary systems.
In this paper we present the sixth binary showing a flux reversal in the 1.0-1.3 region. WISEP J061135.13041024.0 (WISE 06110410, hereafter) was first presented in Kirkpatrick et al. (2011) as a T0 with a spectro-photometric distance of 17.7 pc. It was discovered in a Wide-field Infrared Survey Explorer (WISE; Wright et al. 2010) search for bright sources with brown dwarf-like colors and no counterpart in the Two Micron All Sky Survey catalog (2MASS; Skrutskie et al. 2006). Such properties are indicative of a source that either has a large proper motion or one with a very red color. In the case of WISE 06110410 the source is present in the 2MASS catalog (See Table 2 for a summary of the photometry of this object), but its position has moved by more than 3 between the two surveys. Follow-up observations discussed here have accurately measured the proper motion and provide a first determination of the parallax. We also show resolved photometry and spectral deconvolution that clearly demonstrate the flux reversal in the 1.0-1.3 µm region.
2 Observations
2.1 NTT
Parallax observations were carried out using the European Southern Observatory (ESO) 3.5m New Technology Telescope (NTT) and its infrared spectrograph and imaging camera SofI (Son of ISAAC; Moorwood et al. 1998) as part of program 186.C-0756: NTT Parallaxes of Southern Extremely Cool objects. The observing, analysis, and reduction procedures are described in detail in Smart et al. (2013) and are only briefly summarized here. The observations were obtained in SofI’s large field mode, providing a 4949 field with 0288 pix-1 in the band. Each epoch consists of 18 dithered observations of 430s at each pointing for a total exposure time of 36 minutes. The observations were combined using the jitter routine of the Eclipse (Devillard 1997, version 5.0) package. Objects in the field were found and centroided using the Cambridge Astrometry Survey Unit s imcore maximum likelihood barycenter software (CASUTOOLS222http://apm49.ast.cam.ac.uk/surveys-projects/software-release, v 1.0.21).
During nights of exceptional seeing, one of us (RAM), noted that the point spread function (PSF) of WISE 06110410 was slightly elliptical compared to other objects in the field. This prompted the high-resolution follow-up and spectral analysis discussed here.
2.2 Keck II/NIRC2
High resolution images of WISE 06110410 were obtained using the Keck II laser guide star adaptive optics (LGS-AO) system (Wizinowich et al. 2006; van Dam et al. 2006) with NIRC2 on the nights of 2012 January 13, 2012 April 15, 2012 September 06, 2012 November 29, and 2013 September 21 (see Table 3). Our target was too faint in -band to serve as a tip-tilt reference star for the wavefront corrector, so we used the USNO-B star 0858-0074221 (Monet et al. 2003) with =16.5 and located 35 from our target. Our interest was focused on the target and its immediate vicinity, so we used the narrow camera mode with a nominal pixel scale of 10 mas pix-1 and single-image field of view of 10. We used a 3-point dither pattern to avoid the high noise levels in the lower-left quadrant of the array. This pattern was repeated with different offsets to build up a longer exposure. The Mauna Kea Observatories (MKO; Tokunaga et al. 2002) , , , , and filters were used on one or more nights (Table 3).
The images were reduced using scripts in the IDL (Interactive Data Language) environment. A dark frame was first subtracted from each science frame. Then, a sky frame, created from the median average of all images acquired for WISE 06110410 exclusive of the frame being reduced, was subtracted. The sky-subtracted frames were then divided by a dome flat. Finally, the images were shifted to align the target to a common location and a deep mosaic was created from the median average of the stack. For the single image obtained on 2012 November 29, we could only dark subtract and flat-field the science frame. Fortunately, since our interest in that data was to follow the relative motions of the objects, the lack of a sky frame did not impede our goals. Table 3 lists the total exposure times for each of the mosaics, as well as the full-width at half-maximum (FWHM) and Strehl ratios for the objects in frames.
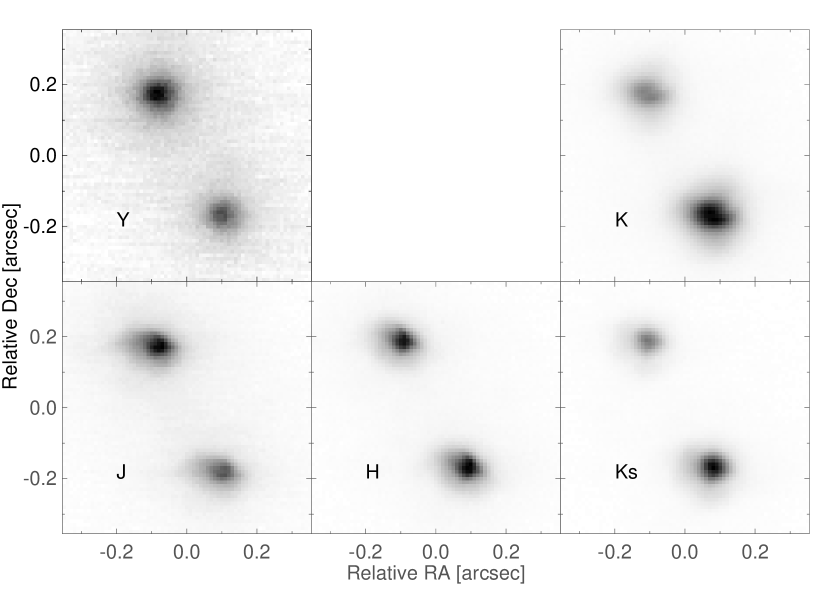
The , , , , and mosaics from the 2012 April 15 and 2013 September 21 nights are shown in Figure 1. As was suspected from the NTT data, this source is easily resolved into two components. Visual inspection of the images shows that the relative brightness changes sign between the & and , , & images. We discuss the implications of this below.
3 Analysis
3.1 Parallax and Proper Motion
We have 20 observations of WISE 06110410 from 2010 December 23 through 2013 February 8. An observation in the middle is chosen as the master frame and the measured coordinates transformed to a standard system using 2MASS objects in the field. All other observations are transformed to this standard system using all common objects and a simple linear transformation. Once all frames are on the same system, the motion of the target is fit for the astrometric parameters: position, relative proper motion, and relative parallax. This procedure is iterated while removing reference stars, which have brightnesses straddling that of WISE 06110410, with high scatter about the transformation. One epoch with an anomalously large residual (3) compared to the best fit was also dropped. After this iteration a correction of the relative parallax to an absolute value is calculated using the galaxy model of Mendez & van Altena (1996). The resulting astrometric motion of WISE 06110410 across the sky from these 19 epochs, along with our fit, is shown in Figure 2 and the astrometric parameters are produced in Table 4.
3.2 Resolved Photometry
Our Keck imaging easily resolves WISE 06110410 into its component sources, allowing for simple calculation of the magnitude differences in the five filters. To derive the MKO-based photometry of the two components, we need MKO magnitudes for the composite source in those filters. MKO , , and images of WISE 06110410 were obtained by the UKIRT Infrared Deep Sky Survey (UKIDSS; Lawrence et al. 2007) Galactic Clusters Survey. The and data were obtained from the public Data Release 9; -band data comes from unreleased images observed on 2012 Dec 09. These images show an elliptical source, similar to what is seen in the NTT data. No MKO or images of this field have been obtained. This UKIDSS photometry, as well as the 2MASS photometry, is given in Table 2.
The separation between the two components is large enough that basic aperture photometry can be used to measure the magnitude differences. We use the data from 2012 April 15 and 2013 September 21 for the photometry since they are of the highest quality and include the largest set of filters. The photometry is performed on the mosaicked images (Figure 1) and is presented in Table 5. We denote the source that is fainter at and as component A in this system.
3.3 Resolved Astrometry and Companionship
We have observed WISE 06110410AB using high-resolution imaging on five different epochs with the purposes of confirming a common proper motion between the sources and searching for any orbital motion. For a given epoch, we measure the separation in RA and Dec from source A to source B on all of the individual images. We then take the average separations from the measurements and assign the standard deviation as the error in those quantities. Since the 2012 September 06 epoch only contained a single, good quality image, we conservatively set the separation error in each axis to be 10 mas (1 pixel).
The final measurements are shown in Table 6 and graphically in Figure 3. If source B was a background object, then its position would have changed by 480 mas over the course of the NIRC2 observations. A positional offset that large is easily detectable in these high quality observations. However, there is no significant change in the relative position of source B over the five epochs. Therefore, we can confidently confirm that these sources are physically bound and, additionally, no orbital motion is yet detected. The parallax and proper motion fit also do not show any evidence for binary motion over more than 2 years of NTT observations.
3.4 Composite Spectrum Deconvolution
To determine the spectral types of the individual components of WISE 06110410AB we used a three-step deconvolution procedure, similar to that described in Day-Jones et al. (2013). First we fit the entire spectrum (0.85-2.45 m) of our target (Kirkpatrick et al. 2011) with the near-infrared spectroscopic standards defined in Kirkpatrick et al. (2010) and Burgasser et al. (2006a) to determine the best-fit standard via minimization. The best-fit standard selected this way is SDSS J120747.17+024424.8 with spectral type T0, identical to the spectral type found by Kirkpatrick et al. (2011).
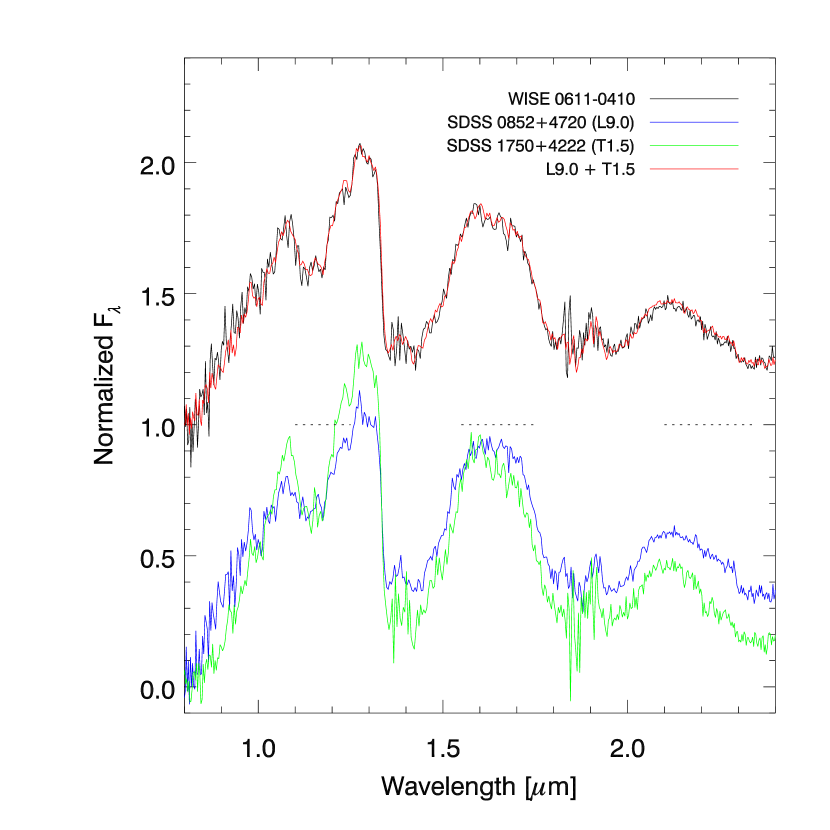
Then we repeated the fit using a set of synthetic binaries. Synthetic binaries were created combining the template spectra taken from the SpeX-Prism library333http://pono.ucsd.edu/$∼$adam/browndwarfs/spexprism/, scaling them to the appropriate relative flux level using the spectral typeabsolute magnitude calibration presented in Marocco et al. (2010). We selected only those binaries giving a lower compared to the standard template. Among those binary pairs, the best-fit binary was found by only fitting three regions of the spectrum: 1.10-1.25 m (containing CH4 and H2O absorption bands), 1.55-1.75 m (containing the CH4 absorption band), and 2.10-2.35 m (containing the CO absorption band). The features within these intervals change significantly at the transition between L and T types, and are therefore the most suitable to identify and deconvolve unresolved L/T pairs. The best-fit template identified with this procedure (see Figure 4) consists of a L9 dwarf (SDSS J085234.90+472035.0) and a T1.5 dwarf (SDSS J175024.01+422237.8).
We tested the significance of our deconvolution using an F-test to compare the result of the fit with synthetic binaries against the fit with the standard template alone (Burgasser et al. 2010). We use an F distribution threshold of 99.5, which translates to a critical value () of 1.41. If the ratio of the two (defined as ) is larger than , then the combined template provides a better fit at the 99.5 confidence level. We obtained = 1.73 for the binary fit using L9 and T1.5 templates and, therefore, assign those spectral types to the two components.
3.5 Discussion
3.5.1 Comparison to Cloudy Models
A true test to firmly pin down the atmospheric properties of these brown dwarfs requires high resolution, high signal-to-noise ratio spectroscopy. With such data it would be possible to distinguish the effects of gravity and non-equilibrium chemistry that are discernible in the models. With no resolved spectroscopy we will attempt to estimate the physical properties of WISE 06110410AB using our measured photometry and distance.
We use the atmosphere models of Saumon & Marley (2008) and Stephens et al. (2009) for comparison to our binary. These models incorporate a variety of cloud sedimentation efficiencies (; Ackerman & Marley 2001) that dictate the size of the condensate particles and the thickness of the cloud deck. Small values of produce thick clouds comprised of small particles, whereas large values of produce thin clouds with large particles. These models also include a vertical mixing component through the eddy diffusion coefficient, . This vertical mixing can throw the observable abundances of molecules such as CO, CH4, H2O, NH3, and N2 out of chemical equilibrium by dredging up molecules favored at high temperatures and pressures (eg., N2 and CO) and mixing them higher in the atmosphere, where cooler temperature molecules (eg., CH4, H2O, NH3) are favored. If the replenishment of the “hot” molecules is faster than the reaction to convert them to the “cold” molecules, then there will be an over-abundance of CO compared to CH4, for example. Values of are typically - cm2 s-1; in our model suite is “0” (representing the chemical equilibrium case and not =1), 2, 4, and 6.
It is important to note that the models we are utilizing are atmosphere models computed at a fixed grid of and . The evolutionary models of Saumon & Marley (2008) are then used to compute the mass. These evolutionary models are computed for clear atmospheres (not used in our analysis) and cloudy models with =2. The masses and ages for other values of are approximate and based on =2 models with similar and . Furthermore, although we show models with as high as 5.477 (cm s-2), these models produce objects that are physically impossible (Saumon & Marley 2008). In fact, the maximum value of for a cloudy set of models is 5.38 (cm s-2).
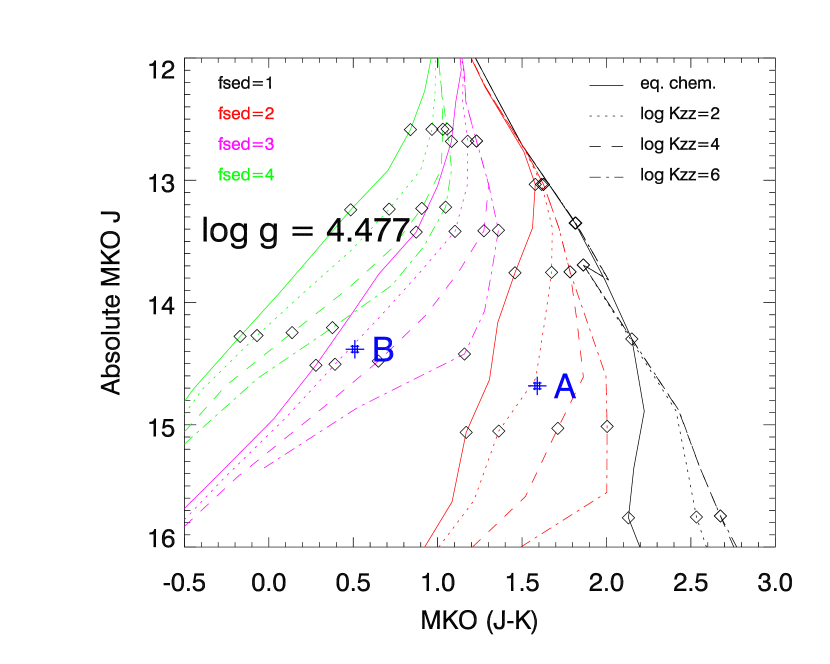
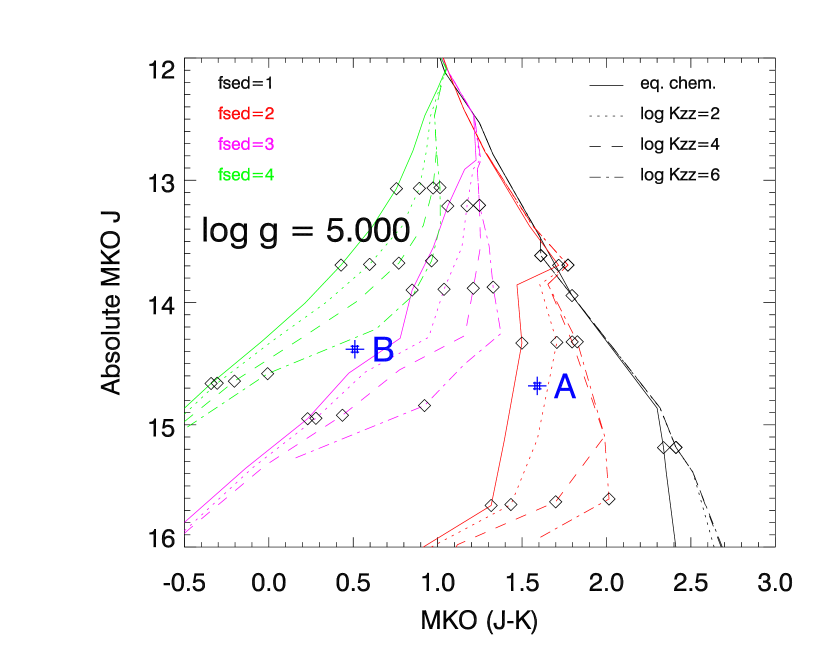
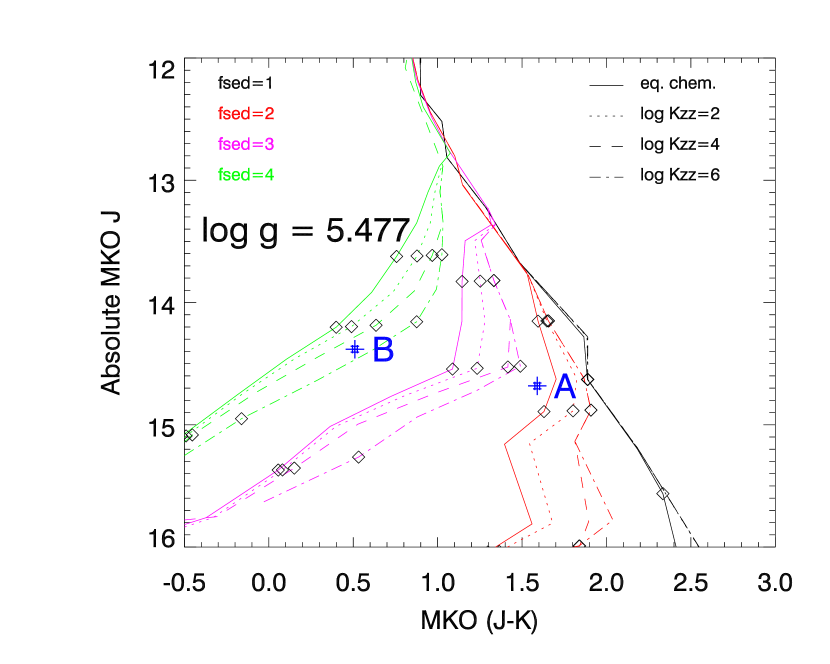
Figures 5, 6, and 7 show as a function of for models at a variety of effective temperatures, , and with =4.477, 5.0, and 5.477 (cm s-2). As shown in these figures, increasing the model gravity tends to shift absolute magnitudes to fainter values and the color to the blue. Likewise, models with a higher sedimentation efficiency are bluer in than lower models since the high models more closely resemble cloud-free atmospheres. Finally, increasing tends to produce redder colors while leaving relatively unchanged.
Since the grid of and gravities can be somewhat coarse for a given value of and we have constructed a 2-d interpolation using steps of 10 K and 0.1 (cm s-2) for the and axes, respectively. We acknowledge that this interpolated grid of models may not reproduce a model computed at each and , but feel that the interpolation does a sufficient job of estimating the actual model properties.
To find the best fitting model, we minimize as given in the following equation
| (1) |
where and ) are the absolute magnitude and the standard deviation of the observed absolute magnitude, respectively, and is the absolute magnitude from the model. The minimization is performed for each discrete set of and models. Errors in the best fit parameters (mass, , and ) are computed by randomly and independently varying the , , and absolute magnitudes over the range expected from their errors.
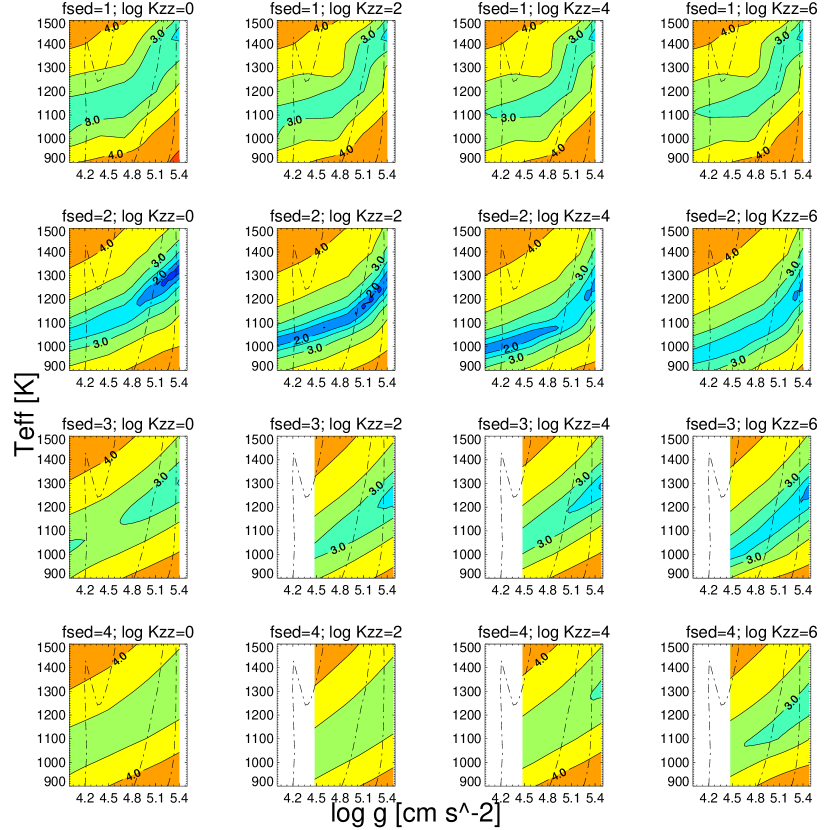
The results of the minimization calculations as a function of and are shown in Figures 8 & 9 for each set of and model. Also shown on these plots are the loci of =2 models having ages of 0.1, 1, and 6 Gyr. In general, WISE 06110410A (Figure 8) is fit well by =2 models having relatively high gravity (5 [cm s-2]) and 1200-1300 K. The corresponding mass for these models is 50-65 with ages 1 Gyr.
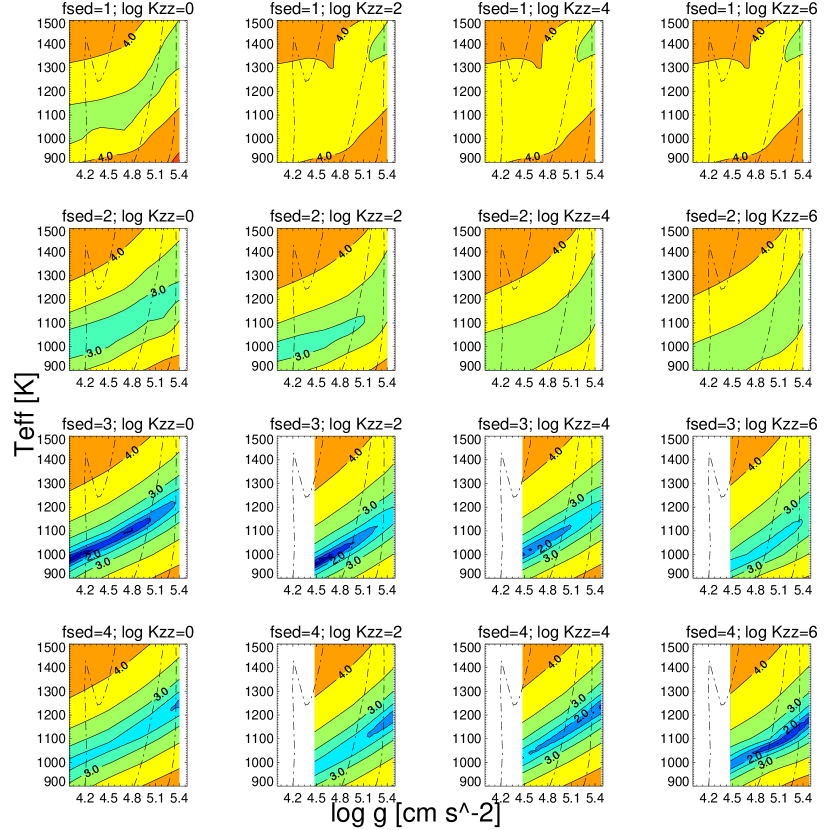
Conversely, the ranges of and of the best fitting models for WISE 06110410B greatly depend on the cloud and mixing properties (Figure 9). Strictly speaking, the best-fitting models are with =3 and very low gravity. The ages inferred from these models (1 Gyr) are inconsistent with the ages for the WISE 06110410A models. The =4 models that provide a good fit to WISE 06110410B have larger gravities and older ages, but do not fit the data quite as well as the =3 models. To determine which set of models are a better physical fit to WISE 06110410AB, we need to look at other observables that constrain the age of the system.
The space motion of WISE 06110410AB effectively rules out membership of any known young moving group. Using the method from Marocco et al. (2010), and assuming a radial velocity range of 100 km s-1, we find that WISE 06110410AB has a low probability of 12% of being younger than 500 Myr and 7% of being younger than 100 Myr. The composite spectrum does not show any indicators that this system is very young, so we can assume that the age of the system is more than a few hundred million years old (Kirkpatrick 2005). This effectively rules out the low-gravity, =3 models for WISE 06110410B, so we adopt the higher gravity, older =4 models.
The parameters for the best-fitting models with age1 Gyr are shown in Table 7. WISE 06110410A is best fit by a model with 1300 K, whereas WISE 06110410B is best fit by a model with 1100 K. The effective temperatures for both objects are largely consistent with those expected for late-type L dwarfs and early-type T dwarfs (Stephens et al. 2009) . Likewise, the cloud properties are also not unusual for these types. Being a late-type L dwarf, WISE 06110410A is expected to have thick clouds covering most of its atmosphere. Models with =2 are generally the best types for fitting late-type L dwarfs (Saumon & Marley 2008). Early-mid T dwarfs require models that are less cloudy than the L dwarfs, making an =4 model appropriate. However, an alternate model can also be used to characterize WISE 06110410B (Section 3.5.2).
Finally, one interesting aspect of the model fitting is the very different levels of atmospheric mixing implied for the two objects. While this could represent a genuine physical difference between these objects, it is impossible to make this assessment based entirely on the broad-band photometry in three filters. High resolution spectroscopy of both components is needed to truly ascertain if either object shows non-equilibrium chemistry.
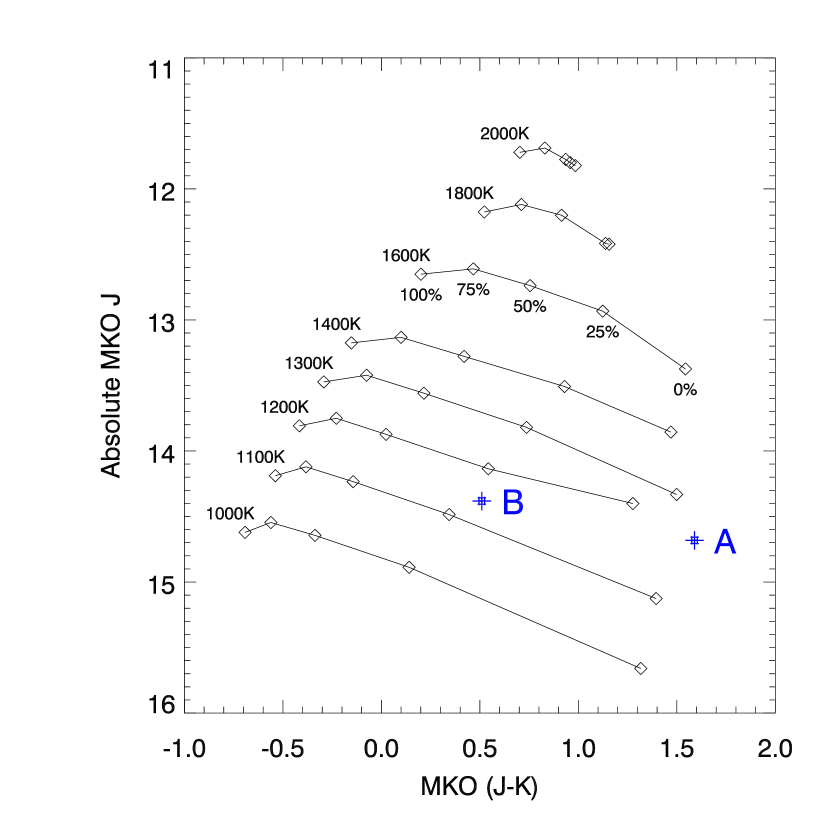
3.5.2 Comparison to Partly Cloudy Models
WISE 06110410B falls in the transition region between the late L dwarfs and the early T dwarfs, where models with partial cloud coverage can be used to describe the source. We use the models of Marley et al. (2010) to infer an alternate physical description of this source. These models, shown in Figure 10, compute the emitted flux for brown dwarfs with fixed masses and temperatures, but having different fractions of cloud coverage. All models have =2, =5.0, and equilibrium chemistry. As expected, WISE 06110410A is consistent with having a completely cloudy atmosphere (no holes in the cloud decks). WISE 06110410B has 1200K and hole fraction=25% for this set of models. If a different set of base models was used, then the best fitting and hole fraction would be different (Marley et al. 2010), so caution should be used when implying a definite atmospheric structure based on this one case. Nonetheless, it is important to point out that the inferred by the partly cloudy models is consistent with the inferred from the cloudy models with varying degrees of and atmospheric mixing.
3.5.3 Comparison to Other Brown Dwarfs
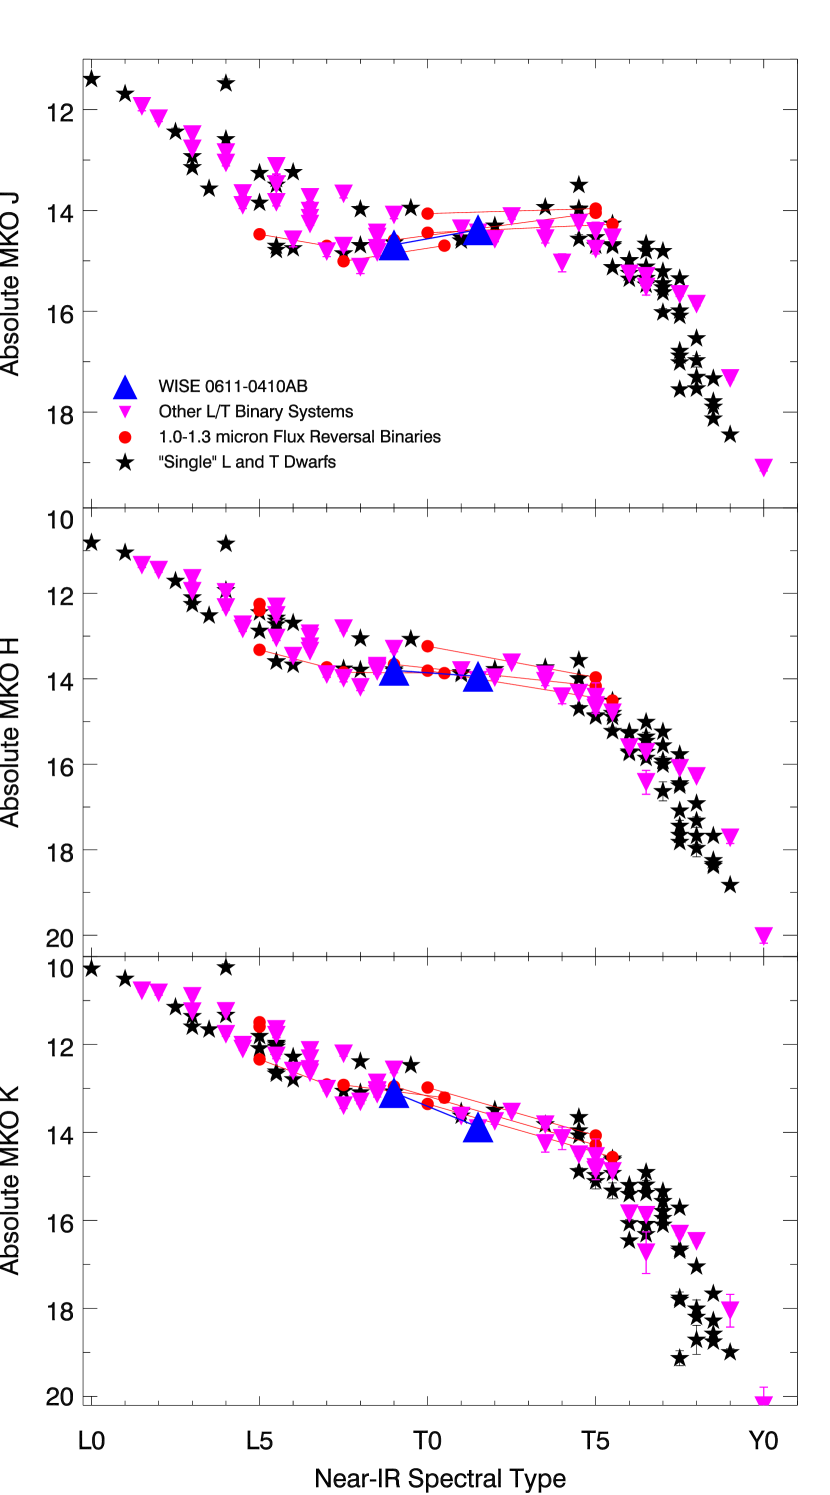
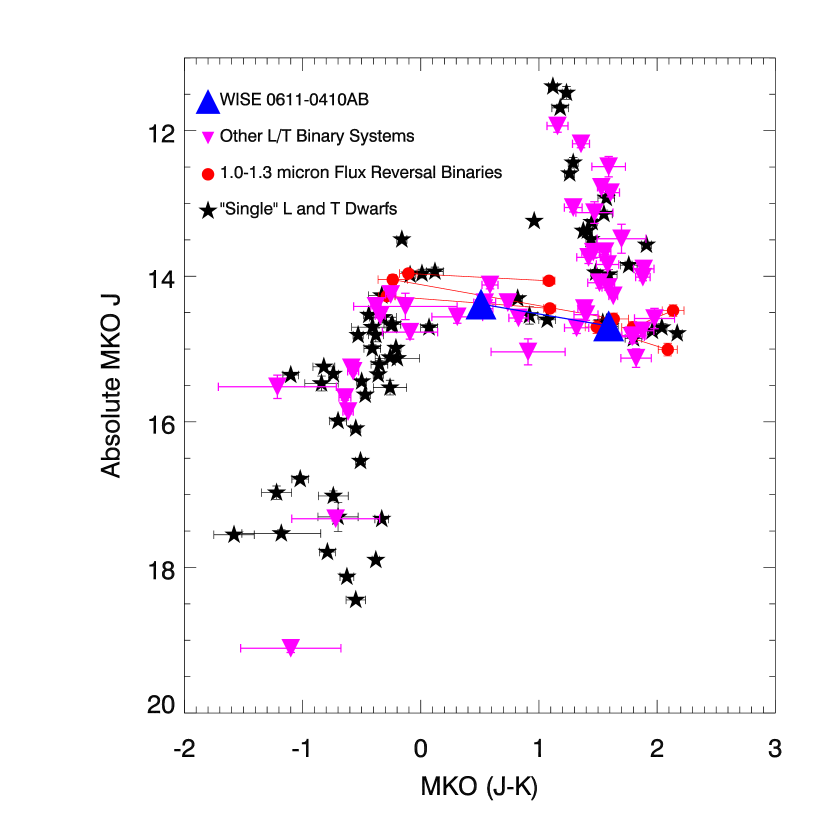
The resolved photometry and parallax measured here allow us to compare WISE 06110410AB to other brown dwarfs. In Figure 11 we use the absolute magnitudes and spectral types estimated from the spectrum deconvolution to compare WISE 06110410AB to other L and T dwarfs compiled by Dupuy & Liu (2012, and references therein) and Burgasser et al. (2013). Both components appear to be normal with respect to similarly-typed brown dwarfs. However, since both spectral types are determined from the deconvolution of the composite spectrum, they should only be regarded as estimates. The color-magnitude diagram shown in Figure 12 bypasses the spectral type uncertainty by making the comparison based entirely on the well-measured photometry and parallax. The photometry of WISE 06110410AB is well-matched to the photometry of objects with similar spectral types and colors, indicating that WISE 06110410AB does not have significantly different metallicity or cloud properties compared to most other brown dwarfs.
3.5.4 Orbit Estimations
In order to estimate the orbital period of this system we first need to estimate the orbital semi-major axis and the masses of the components. Since we have not detected any significant orbital motion of the secondary, we need to estimate the semi-major axis using a conversion factor from the projected separation to semi-major axis. We use the conversion given in Dupuy & Liu (2011) rather than the more commonly used conversion in (Fischer & Marcy 1992) because the former is based on very low-mass star and brown dwarf binaries, whereas the latter is based on higher mass, stellar binaries. Dupuy & Liu (2011) compute several conversion factors based on the discovery method and binary type. For these observations, we use the “moderate discovery bias,” for which the inner working angle of our observations is approximately half of the true semi-major axis. Using the factor for all very low-mass binaries (=1.08) and the projected separation from the most recent epoch (8.1 AU), we estimate the true semi-major axis to be 8.80.5 AU. The mass estimates are done using the model fitting described in the previous sections and are presented in Table 7. The orbital period for the best-fitting model parameters is then 788 years.
4 Conclusions
We have discovered a new brown dwarf binary system that straddles the L/T dwarf transition. Resolved, differential photometry shows that the earlier-type primary is fainter than the cooler secondary in the and bands, but brighter in and , making this one of six known systems that shows a flux reversal in the 1.0-1.3 µm region. Although we do not have resolved spectroscopy of the components, deconvolving the composite spectrum into two spectra indicates the best-fit spectral types are L9 and T1.5. We also present a new parallax of the system placing it at 21.21.3 pc. Comparison to other L and T dwarfs shows that this system does not appear to have any unusual metallicity or age properties compared to the bulk of the field brown dwarfs, making it a good system to study for characterizing solivagant444Solivagant means “wandering alone” and is used to denote brown dwarfs that are isolated from other stars or brown dwarfs. brown dwarfs. However, with an orbital period estimated at 78 years, it will be some time before a good determination of the component masses can be made.


| Binary | SpTA | SpTB | Reference |
|---|---|---|---|
| WISEP J061135.13041024.0AB | L9 | T1.5 | 1 |
| SDSS J102109.69030420.1AB | T1 | T4 | 2 |
| WISE J104915.57531906.1AB | L7.5 | T0.5 | 3 |
| 2MASS J140449413159329AB | T11 | T51 | 4 |
| SDSS J153417.05+161546.1AB | T1.5 | T5.5 | 5 |
| 2MASS J17281150+3948593AB | L5 | L6.5 | 6, 7 |
| Property | Value | Reference |
|---|---|---|
| Spectral Type (near-IR) | T0 | 4 |
| 2MASS | 15.4890.055 | 1 |
| 2MASS | 14.6450.048 | 1 |
| 2MASS | 14.2210.070 | 1 |
| MKO | 15.3980.006 | 3 |
| MKO | 14.7430.005 | 3 |
| MKO | 14.2920.005 | 3 |
| IRAC 3.6 m | 13.0690.017 | 4 |
| IRAC 4.5 m | 12.9240.017 | 4 |
| WISE aaIts designation in the AllWISE Source Catalog is WISEA J061135.13-041024.1. | 13.5590.026 | 5 |
| WISE aaIts designation in the AllWISE Source Catalog is WISEA J061135.13-041024.1. | 12.9200.027 | 5 |
| WISE aaIts designation in the AllWISE Source Catalog is WISEA J061135.13-041024.1. | 11.9260.282 | 5 |
| WISE aaIts designation in the AllWISE Source Catalog is WISEA J061135.13-041024.1. | 8.619 | 5 |
| Date [UT] | FilteraaAll filters are on the MKO system (Tokunaga et al. 2002) | Exposure [sec] | FWHM [mas] | Strehl [%] |
|---|---|---|---|---|
| 2012 Jan 13 | 1800 | 147 | 0.3 | |
| 2012 Apr 15 | 180 | 75 | 2.5 | |
| 180 | 70 | 6.3 | ||
| 180 | 67 | 14.4 | ||
| 2012 Sep 06bbOnly a single image was obtained on this date. | 30 | 100 | 2.0 | |
| 2012 Nov 29 | 360 | 69 | 5.3 | |
| 2013 Sep 21 | 360 | 129 | 0.7 | |
| 360 | 98 | 9.2 |
| Parameter | Value |
|---|---|
| , (J2000) | 6:11:35.0, 4:10:24.9 |
| Epoch [yr] | 2013.1629 |
| Absolute parallax [mas] | 47.253.22 |
| Distance [pc] | 21.21.3 |
| [mas yr-1] | 83.702.50 |
| [mas yr-1] | 279.132.02 |
| Relative to absolute correction [mas] | 0.84 |
| Duration of observations [yrs] | 2.18 |
| reference stars, no. of observations | 291, 19 |
| ParameteraaAll magnitudes are apparent magnitudes. | A | B | |
|---|---|---|---|
| MKO [mag] | 0.400.01 | ||
| MKO [mag] | 16.310.01 | 16.010.01 | 0.300.01 |
| MKO [mag] | 15.430.01 | 15.570.01 | +0.140.01 |
| MKO [mag] | +0.660.01 | ||
| MKO [mag] | 14.720.01 | 15.500.01 | +0.780.01 |
| MKO [mag] | 1.590.01 | 0.510.01 | |
| Est. Sp. Type | L9 | T1.5 |
| Measured | Predicted if BG object | |||
|---|---|---|---|---|
| Date [UT] | () [mas] | [mas] | () [mas] | [mas] |
| 2012 Jan 13 | 177.215.8 | 346.85.8 | 177.2 | 346.8 |
| 2012 Apr 15 | 184.46.5 | 353.43.2 | 205.7 | 424.3 |
| 2012 Sep 06 | 18010 | 34910 | 234.3 | 530.1 |
| 2012 Nov 29 | 182.53.7 | 346.64.9 | 256.1 | 591.9 |
| 2013 Sep 21 | 181.83.4 | 338.61.9 | 322.6 | 808.6 |
| WISE 06110410A | WISE 06110410B | |
|---|---|---|
| 17.74.8 | 9.85.5 | |
| mass [] | 64.80.4 | 52.112.0 |
| [K] | 130026 | 109620 |
| [cm s-2] | 5.30.1 | 5.10.1 |
| 2 | 4 | |
| log | 0 | 6 |
| Approx. age [Gyr] | 1.5-4.0 | 1.0-2.0 |
References
- Ackerman & Marley (2001) Ackerman, A. S., & Marley, M. S. 2001, ApJ, 556, 872
- Burgasser et al. (2010) Burgasser, A. J., Cruz, K. L., Cushing, M., Gelino, C. R., Looper, D. L., Faherty, J. K., Kirkpatrick, J. D., & Reid, I. N. 2010, ApJ, 710, 1142
- Burgasser et al. (2006a) Burgasser, A. J., Geballe, T. R., Leggett, S. K., Kirkpatrick, J. D., & Golimowski, D. A. 2006a, ApJ, 637, 1067
- Burgasser et al. (2006b) Burgasser, A. J., Kirkpatrick, J. D., Cruz, K. L., Reid, I. N., Leggett, S. K., Liebert, J., Burrows, A., & Brown, M. E. 2006b, ApJS, 166, 585
- Burgasser et al. (2002) Burgasser, A. J., Marley, M. S., Ackerman, A. S., Saumon, D., Lodders, K., Dahn, C. C., Harris, H. C., & Kirkpatrick, J. D. 2002, ApJ, 571, L151
- Burgasser et al. (2013) Burgasser, A. J., Sheppard, S. S., & Luhman, K. L. 2013, ApJ, 772, 129
- Burrows et al. (2006) Burrows, A., Sudarsky, D., & Hubeny, I. 2006, ApJ, 640, 1063
- Cushing et al. (2008) Cushing, M. C., et al. 2008, ApJ, 678, 1372
- Cutri et al. (2013) Cutri, R. M., et al. 2013, Explanatory Supplement to the AllWISE Data Release Products, Tech. rep.
- Day-Jones et al. (2013) Day-Jones, A. C., et al. 2013, MNRAS, 430, 1171
- Devillard (1997) Devillard, N. 1997, The Messenger, 87, 19
- Dupuy & Liu (2011) Dupuy, T. J., & Liu, M. C. 2011, ApJ, 733, 122
- Dupuy & Liu (2012) —. 2012, ApJS, 201, 19
- Fischer & Marcy (1992) Fischer, D. A., & Marcy, G. W. 1992, ApJ, 396, 178
- Gizis et al. (2003) Gizis, J. E., Reid, I. N., Knapp, G. R., Liebert, J., Kirkpatrick, J. D., Koerner, D. W., & Burgasser, A. J. 2003, AJ, 125, 3302
- Kirkpatrick (2005) Kirkpatrick, J. D. 2005, ARA&A, 43, 195
- Kirkpatrick et al. (2010) Kirkpatrick, J. D., et al. 2010, ApJS, 190, 100
- Kirkpatrick et al. (2011) —. 2011, ApJS, 197, 19
- Kirkpatrick et al. (2012) —. 2012, ApJ, 753, 156
- Knapp et al. (2004) Knapp, G. R., et al. 2004, AJ, 127, 3553
- Lawrence et al. (2007) Lawrence, A., et al. 2007, MNRAS, 379, 1599
- Liu et al. (2006) Liu, M. C., Leggett, S. K., Golimowski, D. A., Chiu, K., Fan, X., Geballe, T. R., Schneider, D. P., & Brinkmann, J. 2006, ApJ, 647, 1393
- Looper et al. (2008) Looper, D. L., Gelino, C. R., Burgasser, A. J., & Kirkpatrick, J. D. 2008, ApJ, 685, 1183
- Marley et al. (2010) Marley, M. S., Saumon, D., & Goldblatt, C. 2010, ApJ, 723, L117
- Marocco et al. (2010) Marocco, F., et al. 2010, A&A, 524, A38
- Mendez & van Altena (1996) Mendez, R. A., & van Altena, W. F. 1996, AJ, 112, 655
- Monet et al. (2003) Monet, D. G., et al. 2003, AJ, 125, 984
- Moorwood et al. (1998) Moorwood, A., Cuby, J.-G., & Lidman, C. 1998, The Messenger, 91, 9
- Mould (1976) Mould, J. R. 1976, A&A, 48, 443
- Mould & Hyland (1976) Mould, J. R., & Hyland, A. R. 1976, ApJ, 208, 399
- Saumon & Marley (2008) Saumon, D., & Marley, M. S. 2008, ApJ, 689, 1327
- Skemer et al. (2013) Skemer, A. J., et al. 2013, ArXiv e-prints
- Skrutskie et al. (2006) Skrutskie, M. F., et al. 2006, AJ, 131, 1163
- Smart et al. (2013) Smart, R. L., et al. 2013, MNRAS, 433, 2054
- Stephens et al. (2009) Stephens, D. C., et al. 2009, ApJ, 702, 154
- Tinney et al. (2003) Tinney, C. G., Burgasser, A. J., & Kirkpatrick, J. D. 2003, AJ, 126, 975
- Tokunaga et al. (2002) Tokunaga, A. T., Simons, D. A., & Vacca, W. D. 2002, PASP, 114, 180
- Tsuji & Nakajima (2003) Tsuji, T., & Nakajima, T. 2003, ApJ, 585, L151
- van Dam et al. (2006) van Dam, M. A., et al. 2006, PASP, 118, 310
- Westphal et al. (1974) Westphal, J. A., Matthews, K., & Terrile, R. J. 1974, ApJ, 188, L111
- Wizinowich et al. (2006) Wizinowich, P. L., et al. 2006, PASP, 118, 297
- Wright et al. (2010) Wright, E. L., et al. 2010, AJ, 140, 1868