Probing the elastic limit of DNA bending
Abstract
Many structures inside the cell such as nucleosomes and protein-mediated DNA loops contain sharply bent double-stranded (ds) DNA. Therefore, the energetics of strong dsDNA bending constitutes an essential part of cellular thermodynamics. Although the thermomechanical behavior of long dsDNA is well described by the worm-like chain (WLC) model, the length limit of such elastic behavior remains controversial. To investigate the energetics of strong dsDNA bending, we measured the opening rate of small dsDNA loops with contour lengths of 40-200 bp using Fluorescence Resonance Energy Transfer (FRET). From the measured relationship of loop stability to loop size, we observed a transition between two separate bending regimes at a critical loop size below 100 bp. Above this loop size, the loop lifetime decreased with decreasing loop size in a manner consistent with an elastic bending stress. Below the critical loop size, however, the loop lifetime became less sensitive to loop size, indicative of softening of the double helix. The critical loop size was measured to be 60 bp with sodium only and 100 bp with 5 mM magnesium, which suggests that magnesium facilitates the softening transition. We show that our results are in quantitative agreement with the kinkable worm-like chain model. Furthermore, the model parameters constrained by our data can reproduce previously measured J factors between 50 and 200 bp. Our work provides powerful means to study dsDNA bending in the strong bending regime.
pacs:
82.39.Pj,87.14.gk,87.14.G-,87.80.Nj,87.19.rd,87.10.Rt,87.64.kvI Introduction
Double-stranded DNA (dsDNA) can bend, twist, stretch, and adopt various structures under thermal excitationOlson and Zhurkin (2000); Strick et al. (2000); Nikolova et al. (2011); Maehigashi et al. (2012). Despite this wide range of thermal fluctuations, mechanical properties of DNA at large length scales can be well-described by the worm-like chain (WLC) model Shimada and Yamakawa (1984). According to this model, directional change in the chain contour costs energy quadratically dependent on bending angle. Chain stiffness can be described by the persistence length below which thermally induced bending fluctuation becomes negligible. The persistence length of dsDNA has been estimated to be 45-50 nm by various methodsElias and Eden (1981); Bednar et al. (1995); Smith et al. (1996); Bouchiat et al. (1999); Shore et al. (1981); Taylor and Hagerman (1990), and shown to be largely independent of monovalent salt concentration above 20 mMPorschke (1991); Baumann et al. (1997); Wenner et al. (2002).
Strong bending of dsDNA, which refers to deflection of larger than between adjacent base pairs (or equivalently, one turn per persistence length), occurs in transcriptional repressionBond et al. (2010), nucleosome formationAndrews and Luger (2011), and viral DNA packagingBaker et al. (1999). Since the WLC is valid only within the elastic limit of dsDNA, the actual bending energy of dsDNA in such processes may deviate from the WLC prediction. The free energy cost of dsDNA bending can be experimentally determined by measuring the efficiency with which a linear dsDNA can be ligated into a circle. By comparing the rates of circle and dimer formation in the ligation reaction, one can obtain an effective molar concentration of one end of the DNA around the other end, which is known as the J factorShore et al. (1981). Using this ligase-dependent cyclization assay, the Widom group showed that the J factors of dsDNAs shorter than 150 bp were several orders of magnitude higher than the WLC predictionsCloutier and Widom (2004, 2005).
Subsequently, several other groups used different experimental methods to draw similar conclusions that dsDNA bends more readily than predictedWiggins et al. (2006); Yuan et al. (2008); Han et al. (2009). To explain the apparent failure of the WLC model, structural inhomogeneities such as bubbles or kinks have been proposed as mechanisms for enhanced flexibility in the strong bending regimeYan and Marko (2004); Wiggins et al. (2005). The meltable or kinkable WLC model could correctly predict the measured J factors, but the parameters used are not supported by experimental dataSivak and Geissler (2012).
Du et al. later pointed out that the ligase concentration used in the first study by the Widom group was too high to correctly estimate the J factorDu et al. (2005a). They measured the bimolecular rate constant of dimerization in a separate ligation reaction using low ligase concentration, and showed that the measured J factor is in agreement with the WLC model. The other experimental studies that reported high J factors used AFM on surface-confined DNA and tethered particle motion on protein-mediated DNA looping. These techniques can bias the equilibrium looping probability distribution due to surface interactionDestainville et al. (2009), nonspecific binding of proteins to DNAYuan et al. (2007); Manzo et al. (2012) or the presence of a beadHan et al. (2009).
As an alternative method free of these concerns, single-molecule FRET has recently been used to measure the J factors of short dsDNAsVafabakhsh and Ha (2012). In this method, DNA loop formation can be detected using FRET without the need to use external agents. Vafabakhsh and Ha found that J factors in the range between 65 and 110 bp determined from looping kinetics were a few orders of magnitude higher than the WLC model prediction. The results from this study suggest a significant departure of dsDNA from either the WLC model or 45-50-nm persistence length. However, other experimental factors could have led to an overestimation of the J factor: (1) using synthetic oligos may introduce mismatched base pairsVologodskii and Frank-Kamenetskii (2013), (2) high salt conditions (1 M sodium or 10 mM magnesium) can increase DNA curvature and flexibilityBrukner et al. (1994); Strauss and Maher (1994); Williams and Maher III (2000); Stellwagen and Lu (2010) and/or (3) long sticky ends used in the experiment can increase the apparent looping probabilityPeters and Maher (2010); Vologodskii et al. (2013). (1) can be addressed by using PCR-based DNA assemblyVologodskii and Frank-Kamenetskii (2013); Le and Kim (2013), but (2) and (3) cannot be easily addressed because lowering salt concentration or shortening the sticky ends severely reduce the frequency of looping events observable by FRET for short DNA molecules.
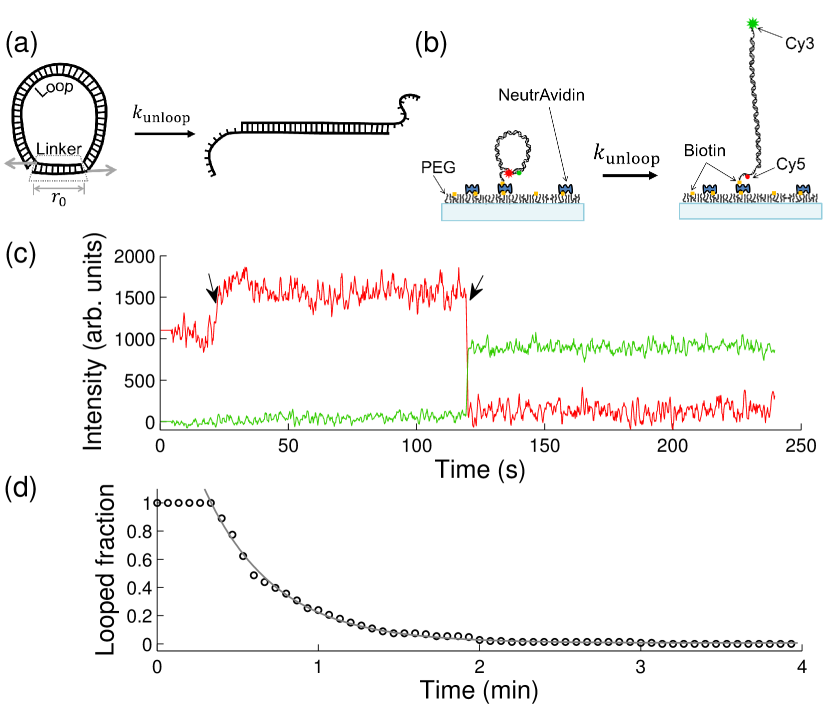
In this paper, we take a different FRET-based approach to test the WLC model at short length scales. The key idea is that stability of end-to-end annealed DNA loops is highly sensitive to loop size due to internal bending stress as depicted in FIG. 1(a). In our FRET assay, the looped state of a dsDNA is stabilized by formation of a transient linker duplex of 10 bp between its sticky ends. The lifetime of this linker duplex depends on the shear force exerted along its helical axis by the looped DNA. Since different DNA models make different predictions about how this shear force depends on the loop length, we can experimentally test these models by measuring linker lifetime vs. loop size.
Our unlooping-based approach has unique capabilities that complement the ligation-based or FRET-based J factor measurements: (1) unlooping rates can be measured with good statistics in moderate salt conditions where looping of short dsDNA rarely occurs; (2) only the molecules that were able to loop are followed in the loop breakage assay, which automatically filters out dysfunctional molecules; and (3) the unlooping rate is related to the shear force, which is easier to compute than the J factor.
Using this unlooping assay, we measured the lifetime of small DNA loops as a function of loop size in the strong bending regime. We found that the loop lifetime decreases with decreasing loop size, indicative of increasing bending stress. The bending stress, however, ceased to increase elastically below a critical loop size, reminiscent of a structural transition in dsDNA, such as kink formation. Based on this apparent transition, we estimate the free energy of kink formation to be larger than . We also found that this energy cost was significantly lowered by magnesium to . Based on our findings, we propose a kinkable worm-like chain (KWLC) model with salt-dependent kinkability to resolve the apparent discrepancy between previous J factor measurements.
II Results
DNA molecules with sticky ends were constructed using a PCR-based protocolLe and Kim (2013). Cy3 and Cy5, the donor-acceptor pair for FRET are incorporated near the sticky ends of the DNA so that loop stabilization by the sticky ends results in high FRET efficiency. A biotin linker extends from one end for surface immobilization (FIG. 1(b)). The DNA sequences used in this study are random and do not contain A-tracts which can produce curved molecules. The DNA molecules immobilized to the surface are first stabilized in the looped state in a buffer with 2 M [Na+]Vafabakhsh and Ha (2012). Once equilibrium is reached, an imaging buffer containing 50-200 mM [Na+] is perfused into the sample chamber, and Cy3 and Cy5 fluorescence intensities are continuously monitored (FIG. 1(c)). The number of remaining high-FRET molecules is recorded as a function of time, and the decay curve is fitted with a single exponential function to extract the linker lifetime (FIG. 1(d)).
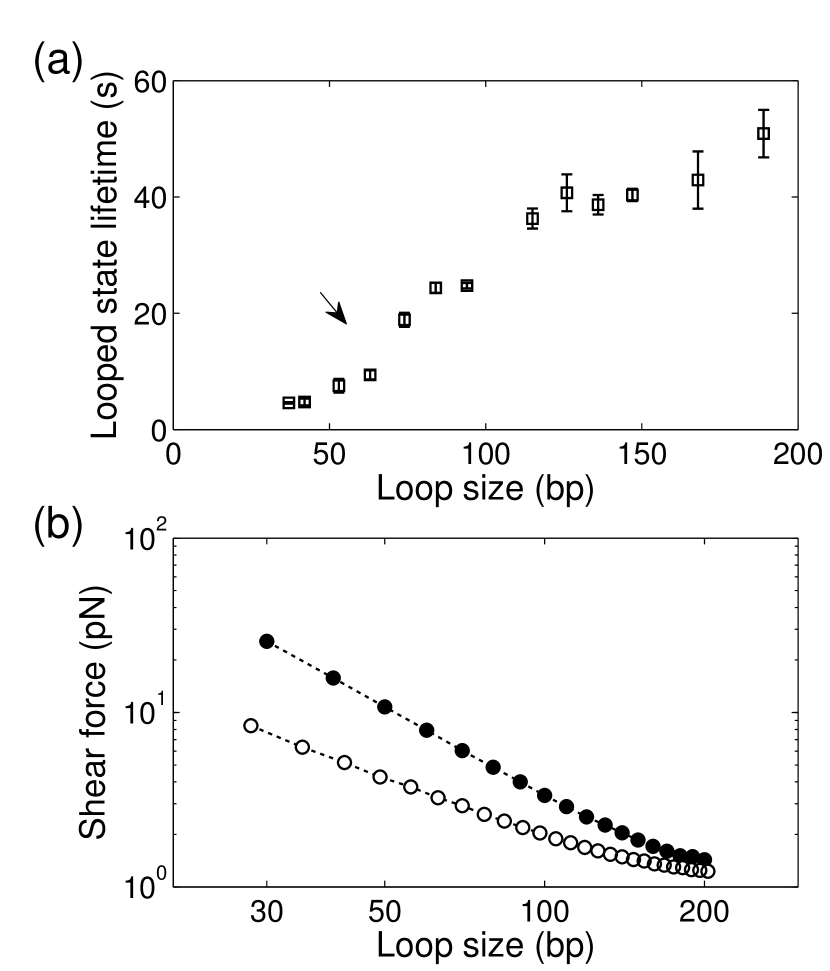
We repeated this salt drop experiment for different lengths of DNA molecules ranging from 40 to 200 bp. In this length range, the bending energy dominates the free energy of looping. Since the total bending energy of the loop increases as the loop size decreases (Supplementary Information and FIG. S1), we expect smaller loops to become less stable. In support of this notion, the linker lifetime decreased as the DNA length was reduced (FIG. 2(a)). Interestingly, the curve exhibits inflection near 70 bp from concave up to concave down.
To gain more insights into this apparent inflection, we formulate the relationship between the lifetime and the loop size by using the shear force exerted on the linker duplex as an intermediate variable. The lifetime () of the linker duplex of length subjected to a shear force () can be modeled by the Bell relationshipBell (1978); Bustamante et al. (2004)
| (1a) | |||
| (1b) | |||
where is the elongation of the linker duplex at the transition state. Meanwhile, the dependence of shear force on loop size can be calculated from the thermodynamic relation
| (2) |
where is the equilibrium radial distribution function of end-to-end distance of a polymer.
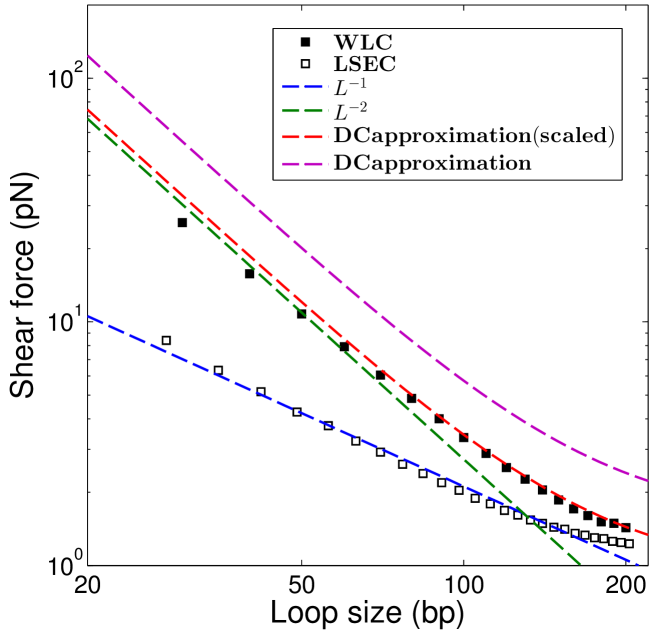
To obtain , we considered two continuous polymer models: the WLC model and the linear subelastic chain (LSEC) model. The WLC model is the canonical elastic DNA model with a quadratic dependence of deformation energy on bending angle. In comparison, the LSEC model assumes a linear relationship between them, and has been proposed as a phenomenological DNA model in the strong bending regimeWiggins et al. (2006); Wiggins and Nelson (2006). The parameters of both models are strongly constrained by the persistence length of 50 nm in the long limit (FIG. S2). When constrained in this fashion, the LSEC model predicts high-curvature conformations more frequently than the WLC modelWiggins et al. (2006); Wiggins and Nelson (2006). We performed the biased Monte Carlo (MC) simulation to calculate the shear force as a function of loop size (see Methods). The LSEC model produces a significantly weaker shear force and a more moderate length-dependence than the WLC model (FIG. 2(b)). We note that the calculated shear force depends only weakly on near the value chosen for our analysis (FIG. S3).
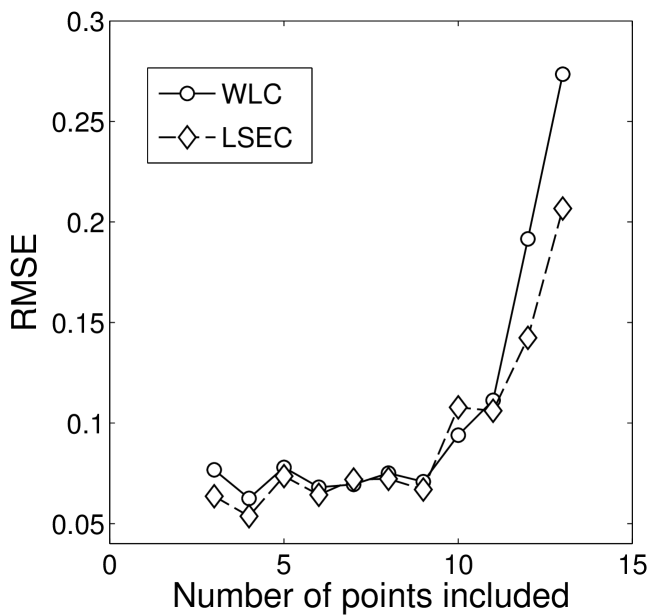
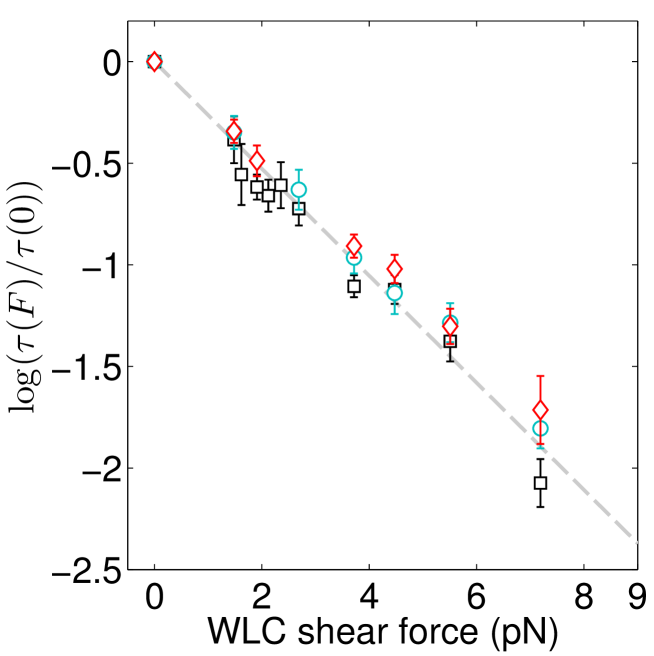
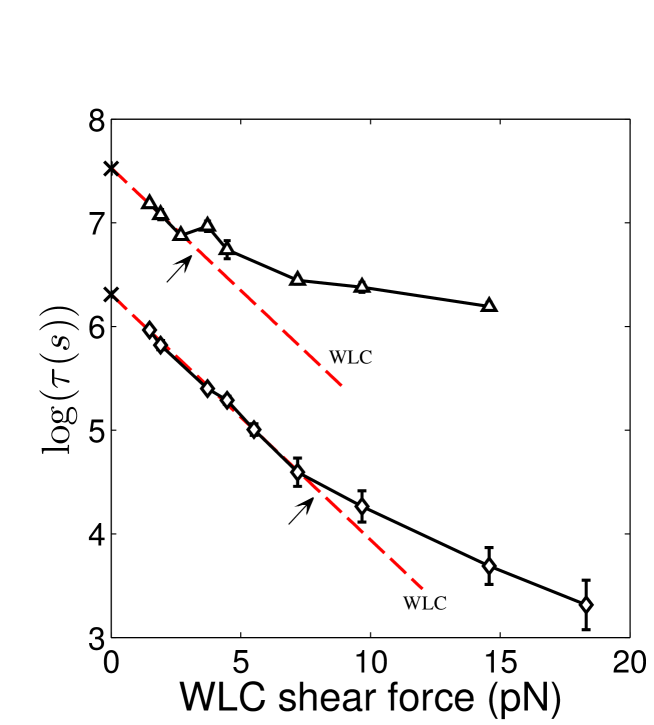
We plotted the logarithm of the measured lifetime vs. the calculated forces, which is expected to be a straight line according to Eq. ˜1. As shown in FIG. 3, the overall relationship follows a straight line between 60 and 200 bp, but deviates from it at smaller loop sizes (also see the root mean squared error (RMSE) analysis in FIG. S4). This deviation, which corresponds to the inflection point in FIG. 2(a), indicates a softening transition of the loop where the actual force becomes weaker than the force predicted by each model. The relationship in the linear regime can be fitted with Eq. ˜1b to obtain the negative slope () and the y-intercept (), both of which are related to the dissociation kinetics of the linker duplex. Since the WLC and LSEC models predict markedly different (1.10 0.14 nm vs. 3.18 0.48 nm) and (72.24 10.28 sec vs. 132.83 6.20 sec), we can compare these fitting parameters with experimental values to identify the correct model before the softening transition.
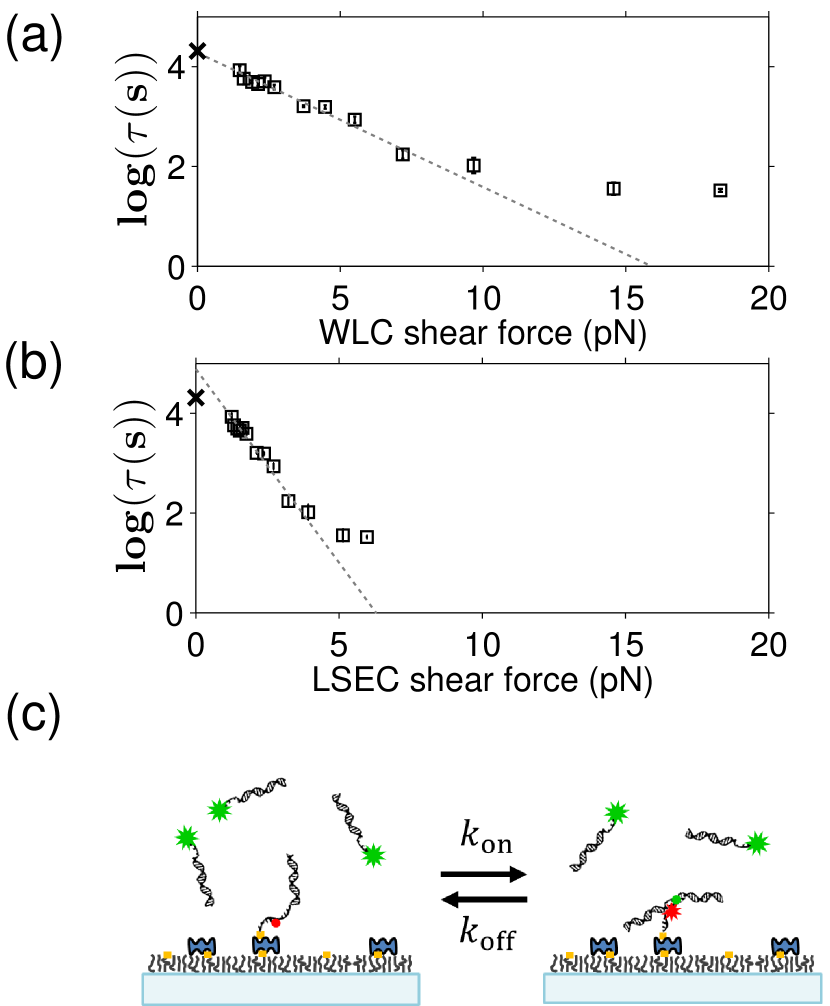
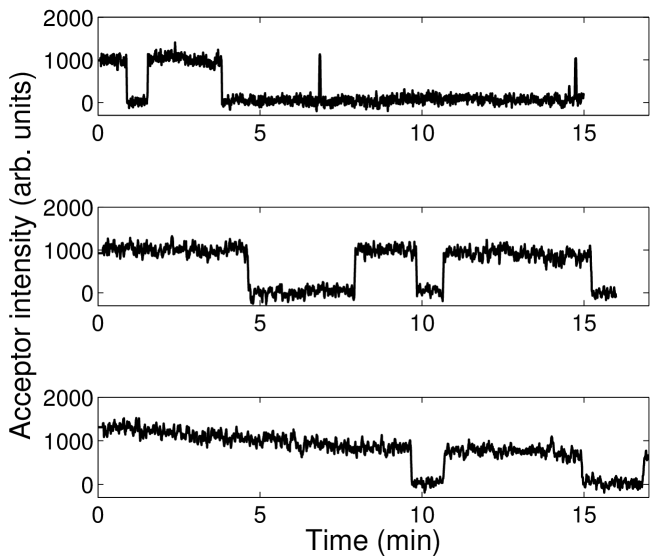
The linker lifetime with zero shear force, , can be measured using the same linker without the loop. For this experiment, we prepared two separate DNA molecules identical to the end-segments of the DNA used in the unlooping assay so that they can form the same linker without the shear force (FIG. S5 and Supplementary Information). We immobilized the Cy5 DNA on the surface and introduced the Cy3 DNA at 20 nM concentration (FIG. 3(b)). Linker formation and separation resulted in two-state fluctuation in Cy5 intensity due to FRET (FIG. S6). Linker separation could be well-described by first-order kinetics, from which the lifetime was extracted. We find that the measured (marked ‘’ in FIG. 3(a,b)) agrees well with the WLC model prediction, but not with LSEC.
On the other hand, was previously measured to be 1 Å per base pair by pulling short DNA duplexes at opposite -endsStrunz et al. (1999). In our stretched linker duplex, the total number of complementary base pairs is 13, but the largest number of consecutive base pairs is 9 due to Cy5 in the backbone. Therefore, can be estimated to be in the range of 0.9 nm to 1.3 nm, which includes the prediction of the WLC model but not the LSEC model. Since both parameters and are compatible with the WLC model, but not with the LSEC model, we conclude that the free energy of dsDNA loop as small as 60 bp is better described by the WLC model.
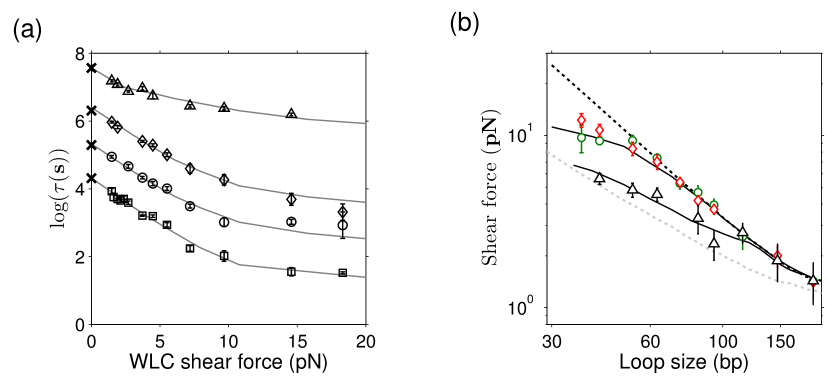
To confirm that our conclusion is not affected by duplex dissociation kinetics, we conducted the unlooping assay at different [Na+] concentrations. In the range between 50 and 200 mM [Na+], is expected to increase with [Na+]Braunlin and Bloomfield (1991); Dupuis et al. (2013) whereas the persistence length of dsDNA should not depend on [Na+]. As expected, the linker lifetime was significantly prolonged at higher salt concentrations (FIG. 4(a)). Despite changes in loop lifetimes as a function of [Na+], all curves exhibit a softening transition near 60 bp, and all values (marked ‘’ in FIG. 4(a)) overlap nicely with the values extrapolated by the WLC model. The observed relationships at different [Na+] also collapsed to the same line when normalized by (Supplementary FIG. S7). This result further supports our conclusion that the WLC model correctly describes the free energy of dsDNA bending prior to the softening transition.
We also investigated how magnesium affects strong bending of dsDNA. Magnesium is essential for the activity of the ligase in the cyclization assay, and the restriction enzyme in DNA minicircle digestion. Therefore, almost all enzyme-based experiments on strong dsDNA bending have been performed in the presence of magnesium at relatively high concentrations (5-10 mM). Interestingly, we found that in the presence of 5 mM [Mg2+], the softening transition of dsDNA occurs near 100 bp (FIG. 4(a) and Supplementary FIG. S8). This result indicates that magnesium can dramatically increase the apparent flexibility of dsDNA in the strong bending regime.
III Discussion
Using a FRET-based unlooping assay, we probed the energetics of dsDNA bending in the strong bending regime. We measured the loop lifetime as a function of loop size. In standard Na+ concentrations between 50 and 200 mM, the observed relationship in the range between 60 and 200 bp was consistent with the WLC model. Below 60 bp, we observed that dsDNA loses elastic rigidity, which leads to a weaker dependence of the shear force on the loop size. The critical loop size where softening occurs corresponds to a maximum bending angle of /bp in a teardrop shape. In the presence of 5 mM [Mg2+], the critical loop size increased to 100 bp, corresponding to /bp. This result suggests that in cyclization experiments that typically use 10 mM [Mg2+], subelastic bending can enhance the looping probability of dsDNA shorter than 100 bp.
The interpretation of our results relies on the Bell relationship between duplex lifetime and stretching forceBell (1978). In general, a bond can dissociate through several different pathwaysHinczewski et al. (2013), which may give rise to a nontrivial relationship between bond lifetime and the applied forceEvans et al. (2004). However, our assumption of the Bell model is justified by previous experimental studiesStrunz et al. (1999); Comstock et al. (2011). Notably, a DNA duplex pulled at the opposite -ends by AFM, in the same shear geometry as in our DNA loop, exhibited strand separation kinetics consistent with a single energy barrier along the mechanical separation path. Also, the Chemla group recently demonstrated that DNA duplex dissociation under a constant tensile force follows the Bell relationship by combining fluorescence with optical tweezersComstock et al. (2011). In that study, the relationship between and duplex length () was extracted to be (nm), and has been more precisely determined as (nm) (personal communication with Dr. Chemla). Either estimation puts to be in the range consistent with the WLC model but not with the LSEC model.
The breakdown of continuous models below the critical loop size is likely due to structural transition in the dsDNA helix such as kink formationCrick and Klug (1975); Lankaš et al. (2006) that renders DNA softer. For free DNA, kinks are rare, transient deformations only occurring at a rate of Zeida et al. (2012); Frank-Kamenetskii and Prakash (2014), but they can become significant in sharply bent DNALankaš et al. (2006); Lee and Sung (2012); Fields et al. (2013). We can use the apparent critical loop size to set the lower limit on the energy barrier for kink formation. To account for the effect of kinking on loop stability, we consider the kinkable worm-like chain (KWLC) modelYan and Marko (2004); Wiggins et al. (2005); Vologodskii and Frank-Kamenetskii (2013) cast in a simple functional form proposed by Vologodskii and Frank-KamenetskiiVologodskii and Frank-Kamenetskii (2013). In this model, the dinucleotide bending energy () is given by
| (3) |
where is the bending rigidity identical to that of the WLC model, is the energy barrier of kinking, and specifies the range of bending angles at the kink. We varied while fixing in our simulation to find that is most compatible with the observed critical length of 60 bp. The parameter b was chosen to be 0.3 which allows kink angles up to Vologodskii and Frank-Kamenetskii (2013) based on other calculations and molecular dynamics simulationsCrick and Klug (1975); Lankaš et al. (2006); Mitchell et al. (2011). As shown in FIG. 4, and can produce a transition in the shear force below 60 bp, which is consistent with our observation. Using this value, we can also calculate the free energy of kink formation () (more details in the Supplementary Information) to be , which is similar to the upper limits of previous estimationsZheng and Vologodskii (2009); Fields et al. (2013). In comparison to and in the KWLC model, the lifetime vs. loop size relationship taken at 5 mM [Mg2+] yields and . These parameters correspond to a lower free energy of kink formation of and larger kink angles up to .
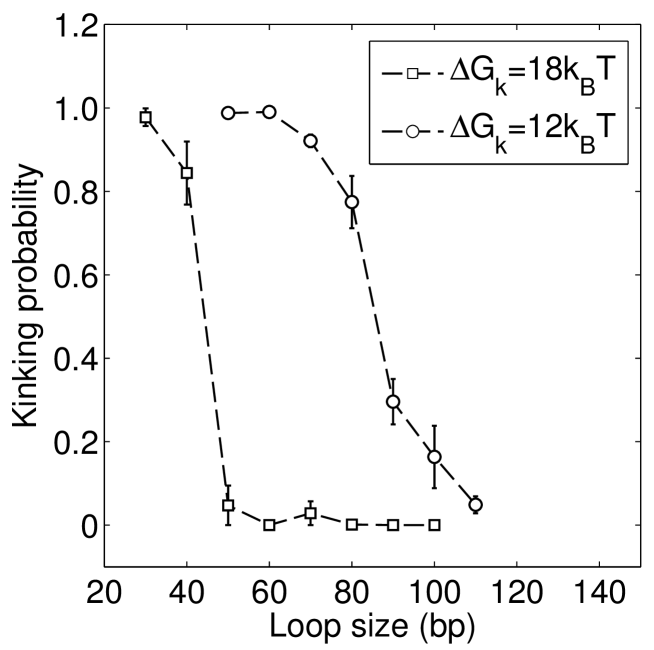
Using the parameters, h and b, constrained by our data, we can also determine the probability of kink formation in a DNA minicircle as a function of loop size. We performed a restrained MC simulation of DNA minicircles of various sizes (see Methods) to measure the frequency of large angle deflections in thermal equilibrium. In our simulation, we only consider the effect of bending stress on kink formation. As shown in FIG. S10, in the absence of magnesium, kink formation is negligible even in 60-bp loops due to a high energy barrier. In the presence of 5 mM [Mg2+], however, the kinking probability increases sharply with decreasing loop size, approaching unity at 70 bp while remains insignificant for DNA over 100 bp. This simulation result agrees well with a previous minicircle digestion study that detected kinks in 60-bp minicircles due to bending stress aloneDu et al. (2008).
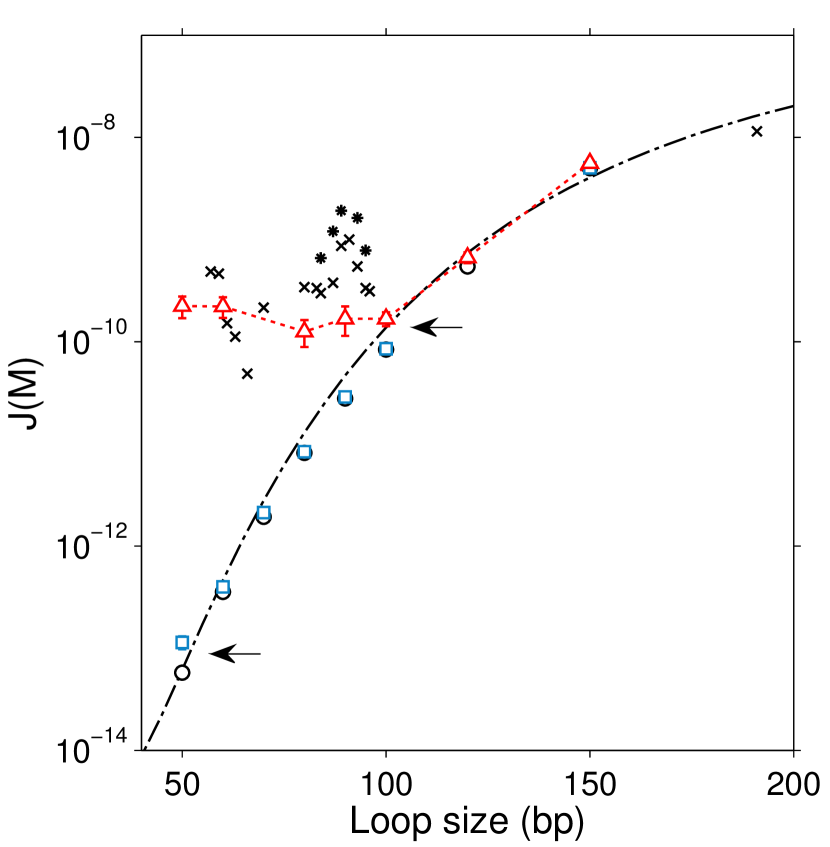
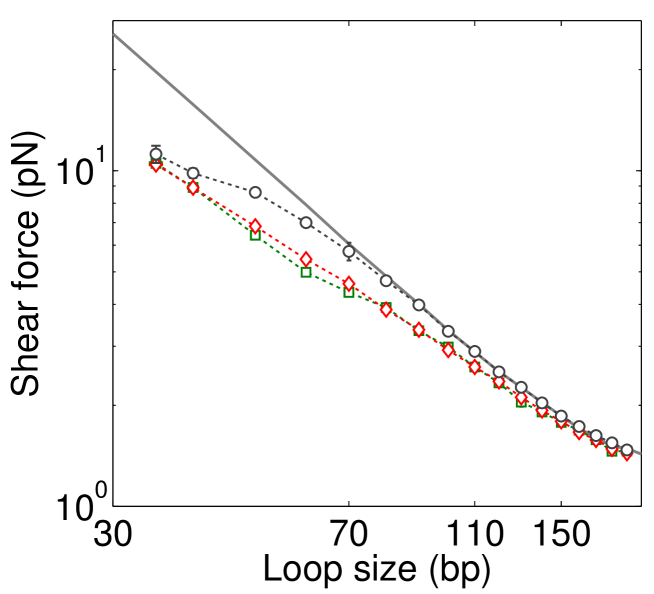
Our results suggest that magnesium can promote subelastic bending above a critical bending angle of /bp by stabilizing large-angle deformations. This interpretation is similar to the conclusion of a recent study with DNA visesFields et al. (2013). Therefore, we considered whether magnesium-facilitated softening could explain high J factors reported previouslyVafabakhsh and Ha (2012). We thus calculated the J factor as a function of length using the KWLC model with and constrained by the data taken at 5 mM [Mg2+]. As shown in FIG. 5, while the KWLC model produces J factors similar to the WLC model prediction above 100 bp as previously demonstratedDu et al. (2005a), it also predicts substantially higher J factors for DNA below 100 bp, matching the J factors determined from the single-molecule FRET cyclization studyVafabakhsh and Ha (2012) within a factor of 10. The agreement between our KWLC model and the result of the FRET study may be closer if the difference in the buffer condition (5 mM vs. 10 mM [Mg2+]) and the uncertainty associated with J factor determination is accounted for (Supplementary Information). In the absence of magnesium, however, our KWLC model predicts that the WLC model will be valid at least down to 55 bp (blue squares, FIG. 5). This may explain why some studies lacking magnesium did not observe enhanced dsDNA flexibility at short length scalesSchöpflin et al. (2012); Shi et al. (2013).
Our unlooping assay enables investigation of strong dsDNA bending in buffer conditions not compatible with the ligation-based cyclization, the FRET-based cyclization, and the AFM assay. In the ligation assay, magnesium must be present at high concentrations for ligase activity. For AFM, magnesium is necessary to bind DNA to the surfaceMantelli et al. (2011). In the FRET-based cyclization assay, high magnesium or sodium concentration is necessary to produce a statistically significant number of looping events. In this study, we demonstrated that effects of small amounts of monovalent and divalent ions on the elastic limit of dsDNA can be studied separately. Moreover, the unlooping assay is more well-suited to the study of kink formation than the cyclization assay because the probability of kink formation increases with bending stress. Our unlooping assay is similar in some ways to previous methods employing small DNA loopsShroff et al. (2008); Wang et al. (2013); Fields et al. (2013). In these studies, electrophoretic mobility or intramolecular FRET of these loops was measured to investigate kinking. Our approach differs from theirs in two ways. First, we measure kinetic decay of the looped state instead of equilibrium distribution between alternative conformations in the looped state. Second, we do not need to include stretching or twisting energy in the Hamiltonian for single-stranded parts or twisted dsDNA. Therefore, our method allows a more direct link between the measurable quantities and dsDNA bending rigidity and holds great promise for studying the effect of sequence, salt, and temperature on strong dsDNA bending.
Methods
Materials
The DNA molecules used in this unlooping assay have a double-stranded part with variable length from 37 bp to 189 bp and 13-nucleotide (nt) long single-stranded complementary overhangs (sticky ends). One overhang contains Cy3, and the other contains Cy5 and biotin (FIG. 1b). The sequences of these overhangs are ATAG/iCy5/GAATTTACC, where /iCy5/ represents the internally labeled Cy5, and GGTAAATTCACTAT with the underlined ‘A’ inserted as a spacer opposite to iCy5 to increase the likelihood of base pairing around iCy5 that interrupts the backbone. All DNA molecules are derived from a master sequence that is 50 % in GC content and does not have curvature-inducing patterns such as GGGCCC or A-tracts. The master sequence was constructed by annealing the ends of two 113-nt long single-stranded DNAs over a 16-nt region and extending their -ends using DNA polymerase. The 210-bp master DNA was purified by gel electrophoresis, and PCR-amplified with dangling-end primers to generate DNAs with common terminating sequences. The annealing location of one of the primers was varied to generate DNAs with different lengths. These PCR products were used as templates in another round of PCR to incorporate fluorescent labels and a biotin as previously describedLe and Kim (2013). Strands were exchanged between these PCR products to obtain the final DNA constructs for our experiment. Detailed sequences can be found in the Supplementary Information.
Single-molecule unlooping assay
The DNA molecules were immobilized on a PEG-coated glass surface through NeutrAvidin-biotin interaction. The immobilized molecules were excited by the evanescent wave of a 532-nm laser (NT66-968, B&W Tek, Newark, DE) totally internally reflected through a high NA objective (UApo N 100/1.49, Olympus). The power of the 532 nm laser was W when measured after the microscope objective before reaching the critical angle of incidence. For a split view of Cy3 and Cy5 images, the fluorescence image was split into the Cy3 and Cy5 channels outside the microscope and relayed onto an EMCCD (DU-897ECS0-# BV, Andor). A lab-written C program was used to view and save live images from the CCD. The raw image data were processed by MATLAB to generate single-molecule time traces of Cy3 and Cy5 intensities. In the loop breakage assay, immobilized DNA molecules were first incubated in 2 M NaCl buffer for up to an hour to generate looped molecules. We then introduced the imaging buffer (5 mM PCA, 100 mM PCD, 1 mM Trolox) that contains 2 M NaCl to start image acquisition. After 20 seconds, new imaging buffer with 50-200 mM NaCl was perfused into the imaging channel at a flow rate of 75 L/min, which corresponds to 1 cm/s in flow velocity through the channel. The typical dimension of the channel cross-section is 0.075 mm 2.0 mm. We recorded the times it takes for molecules to unloop from single-molecule time traces, built the survival time histogram, and fitted it with a single exponential function to extract the linker lifetime.
Force calculation for different DNA models
To calculate the shear force (Eq.˜2), we used umbrella sampling to generate the radial probability distribution (P(r)). dsDNA was treated as a chain of rigid monomers, and bending energy was assigned to each angle between adjacent monomers. Thus, the Hamiltonian was the sum of the total bending energy of the polymer from all monomer steps for WLC and for LSEC where is the angle between the i-th monomer and the i+1-th monomer) and the harmonic potential () with stiffness that restrains the end-to-end distance near . For the WLC model, each base pair was treated as a monomer, similar to the dinucleotide model. For the LSEC model, we tried 7-bp long monomers as publishedWiggins and Nelson (2006); Wiggins et al. (2006). The bending rigidity constants were chosen so that both models predict a persistence length of 50 nm in the long limit (see Supplementary Information). We also considered the KWLC modelVologodskii and Frank-Kamenetskii (2013) that allows for kink formation at large bending angles. The bending energy for the (i,i+1)-th dinucleotide step is . In this formula, is the bending rigidity which is the same as in the WLC model, and is the energy barrier for kinkingVologodskii and Frank-Kamenetskii (2013). was fixed to 0.3 radians (if not mentioned otherwise) to allow the kinks to adopt bending angles up to 90.
Except for the bias potential for umbrella sampling, we did not apply constraints on relative bending or torsional angles between the two ends because flexible gaps at the ends of the linker effectively relax bending and torsional stress. The lack of angular constraints in the loop geometry of our DNA construct is supported by the observation that the J-factor of DNA with gaps does not oscillate with the helical phase of DNADu et al. (2005b), in contrast to intact DNA circlesPeters and Maher (2010); Vologodskaia and Vologodskii (2002).
In principle, the force can be obtained from the derivative of the unbiased radial probability distribution at according to Eq.˜2. Because short distances are rarely populated, we used umbrella sampling where a biasing harmonic potential of stiffness is applied near to obtain a sufficient number of looped conformations. The spring constant for the biasing potential in the case of the WLC model and the LSEC model was set to 8 pN nm/(1 bp)2 and 400 pN nm/(7 bp)2, respectively. The biased force () is then given byKästner and Thiel (2005)
| (4) |
Thus, the unbiased force () is equal to if evaluated at , which enables us to use Eq.˜4 to calculate directly from a biased radial probability distribution. Since derivatives are sensitive to statistical noise, we instead used an approximation that contains averagingHwang (2007)
| (5) |
where is the deviation of the end-to-end distance from . and are the mean and the variance of these deviations, respectively. Pivot moves were used to sample the conformational space of the chain, and Metropolis criterion was applied to accept conformations consistent with the Boltzmann distribution. The chain was equilibrated for MC steps starting from the minimum energy conformation, and approximately conformations after equilibration were used to obtain . The calculated force for a specific loop size did not depend on the value of . For the WLC and the LSEC models with monotonically increasing bending energy, the calculated force varied little between simulations. For the KWLC model with a discontinuous slope, the calculated force for small loop sizes was more variable and, therefore, we increased the number of simulations until the SEM was smaller than 8% of the mean.
Analysis of linker lifetime vs. force
To analyze the linker lifetime vs. shear force, we performed linear regression with the ‘robustfit’ function (MATLAB). We also examined how the goodness of fit changes with the range of fitting using the standard regression error or RMSE (root mean squared error) as an indicator. As shown in FIG. S4, the RMSEs for both WLC and LSEC models increase significantly when points below 60 bp were included. This analysis indicates that Eq.˜1 does not hold below this length because the calculated forces are overestimated compared to the actual forces exerted on the linker. Therefore, we did not include these points when extracting the fitting parameters, and for WLC and LSEC models.
J factor calculation
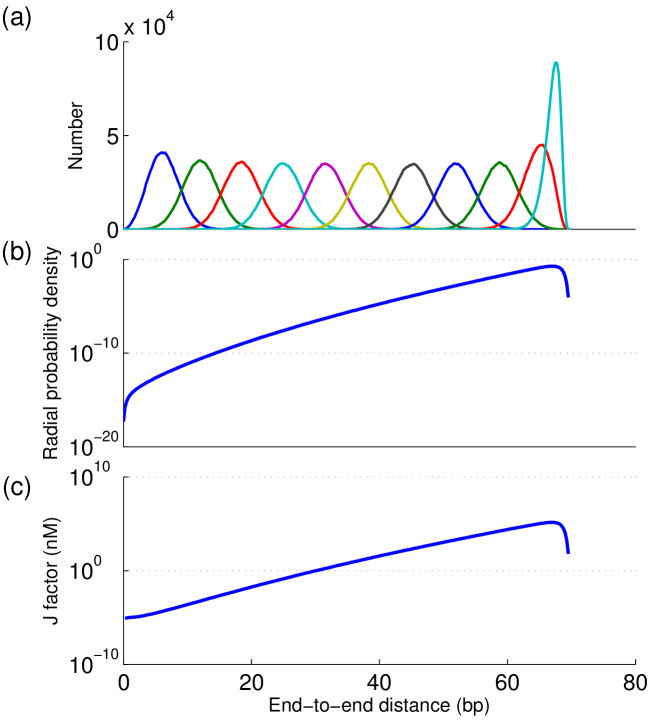
The J factor is calculated by Weighted Histogram Analysis Method (WHAM)Kumar et al. (1992); Becker et al. (2010). A number of umbrella sampling simulations were carried out, each having its own restraint energy where is the simulation index, and is the bin index. In the -th simulation, one obtains the number of counts in the -th bin with the total counts equal to . Using the bias factor in each bin , we can obtain the radial probability density of the unrestrained chain ()
| (6a) | |||
| (6b) | |||
These equations were solved iteratively by updating the equations until converges. We adjusted the spring constant and restraint coordinates so that there is significant overlap between adjacent histograms. Typically, each individual histogram was built from chains. The J factor was obtained by normalizing , dividing it by , and converting it to molar units.
Minicircle simulations
The MC simulation for a DNA minicircle was implemented as previously describedZheng and Vologodskii (2009). We applied the KWLC bending energy to each link and calculated the total bending energy of the minicircle. Random conformations generated by crankshaft rotations were selected based on the Metropolis criteria. In one course of simulation, conformations were typically collected. To enhance the sampling efficiency, we randomly picked angles for the crankshaft rotation from two uniform distributions across two intervals, [, ] and [, ]. For each accepted conformation, all the dinucleotide angles were recorded to determine if the minicircle has kinks. A kink was assigned if the bending angle exceeds the critical kink angle defined as the intercept of the two energy terms in Eq. 3. For each loop size, we calculated the kinking probability, which is the fraction of accepted conformations with at least one kink.
Acknowledgements.
We thank the lab members for critical discussions and reading of the manuscript. H.D.K and co-workers are funded by the Georgia Institute of Technology start-up funds, the Burroughs Welcome Fund Career Award at the Scientific Interface, and Physics of Living Systems student research network grant from the National Science Foundation. T.T.L acknowledges the financial support from the GANN and COS Molecular Biophysics Students funding.Authors contributions
T.T.L. and H.D.K. designed the study. T.T.L prepared the sample and collected data. T.T.L and H.D.K analyzed the data and wrote the paper.
Competing interests
The authors declare no competing financial interests.
Supplementary Information
DNA sequences (from )
III.0.1 Master 210 bp DNA
\DNA! gtgccagcaacagatagcctatccatagactattacctacaagcccaatagcgtacgggatcatccccgccagttacgtctgccacccttcttaacgacacgtgaagggacgaaccgcatacttacgatcaggcatagatcttacaccgtagcaggtagtgccaggcatcgtgttcgtaaccttacttcaaccattcgagctcgttgttg !
III.0.2 189 bp
\DNA! gtgccagcaacagatagcctatccatagactattacctacaagcccaatagcgtacgggatcatccccgccagttacgtctgccacccttcttaacgacacgtgaagggacgaaccgcatacttacgatcaggcatagatcttacaccgtagcaggtagtgccaggcatcgcattcgagctcgttgttg !
III.0.3 168 bp
\DNA! gtgccagcaacagatagcctatccatagactattacctacaagcccaatagcgtacgggatcatccccgccagttacgtctgccacccttcttaacgacacgtgaagggacgaaccgcatacttacgatcaggcatagatcttacaccgtcattcgagctcgttgttg !
III.0.4 147 bp
\DNA! gtgccagcaacagatagcctatccatagactattacctacaagcccaatagcgtacgggatcatccccgccagttacgtctgccacccttcttaacgacacgtgaagggacgaaccgcatacttacgatcattcgagctcgttgttg !
III.0.5 136 bp
\DNA! gtgccagcaacagatagcctatccatagactattacctacaagcccaatagcgtacgggatcatccccgccagttacgtctgccacccttcttaacgacacgtgaagggacgaaccgccattcgagctcgttgttg !
III.0.6 126 bp
\DNA! gtgccagcaacagatagcctatccatagactattacctacaagcccaatagcgtacgggatcatccccgccagttacgtctgccacccttcttaacgacacgtgaaggcattcgagctcgttgttg !
III.0.7 115 bp
\DNA! gtgccagcaacagatagcctatccatagactattacctacaagcccaatagcgtacgggatcatccccgccagttacgtctgccacccttcttaacgcattcgagctcgttgttg !
III.0.8 94 bp
\DNA! gtgccagcaacagatagcctatccatagactattacctacaagcccaatagcgtacgggatcatccccgccagttacattcgagctcgttgttg !
III.0.9 84 bp
\DNA! gtgccagcaacagatagcctatccatagactattacctacaagcccaatagcgtacgggatcatcccattcgagctcgttgttg !
III.0.10 74 bp
\DNA! gtgccagcaacagatagcctatccatagactattacctacaagcccaatagcgtaccattcgagctcgttgttg !
III.0.11 63 bp
\DNA! gtgccagcaacagatagcctatccatagactattacctacaagcccattcgagctcgttgttg !
III.0.12 53 bp
\DNA! gtgccagcaacagatagcctatccatagactattacattcgagctcgttgttg !
III.0.13 42 bp
\DNA! gtgccagcaacagatagcctatcccattcgagctcgttgttg !
III.0.14 37 bp
\DNA! gtgccagcaacagatagcccattcgagctcgttgttg !
Preparing partially hybridized DNA molecules for measurement (italic: double-stranded region)
Cy3-DNA:
- Cy3-ggtaaattcactat caacaacgagctcgaatg -
- gttgttgctcgagcttac - (blocking oligo)
Cy5-DNA:
– BiotinTEG - gaaacatag/ iCy5 /gaatttacc gtgccagcaacagatagc -
- cacggtcgttgtctatcg - (blocking oligo)
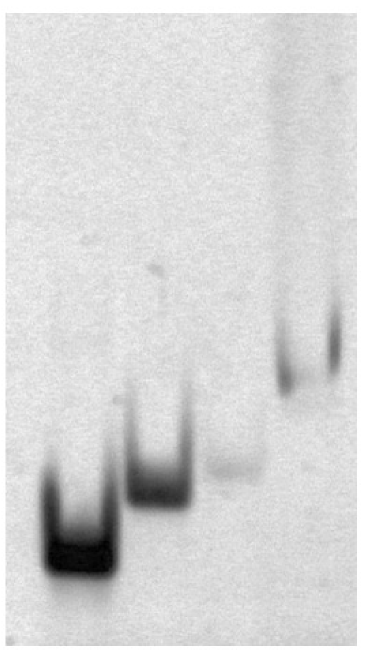
We mixed equal amounts of the two partially hybridized DNA molecules in annealing buffer (100mM NaCl, 10 mM TrisHCl pH 7.0, 1 mM EDTA) to obtain a final concentration of 5 M. The mixture was heated at 95∘C for 5 minutes, slowly cooled down to room temperature, and loaded on a polyacrylamide gel (19:1 Acryl:Bis, 15% (w/v) in TBE 1X pH 8.0). Linear dimers were extracted from the gel using an electroelution kit (G-CAPSULE, 786-001, G-Biosciences) after running the gel at 10 V/cm for 1 hour (see Supplementary FIG. S5).
Shear force vs. loop length
Here, we derive an approximate relationship between the total bending energy of a circular loop and loop length (). From this relationship, we can obtain the shear force. We assume that the loop takes the shape of a circular arc with the two ends separated by distance . If the bending rigidity of the chain is , the total bending energy of the loop is calculated as
| (S1) |
where is the distance coordinate along the contour, and is the radius curvature, which is constant for a circular arc. is for the linear subelastic chain model, and for the WLC model. We make the assumption that is much smaller than . Differentiating the bending energy with , we can obtain the shear force acting along ,
| (S2) |
Thus, at short end-to-end distances, we expect the shear force to scale as for a worm-like chain, and for a subelastic chain. As shown in FIG. S1, this approximate expression can explain the scaling force vs. length computed from the MC simulation to some degree. However, it overestimates the absolute force values because the dominant loop conformation of a worm-like chain is closer to a teardrop, which is overall less stressed than a circular arc.
A more accurate description of the shear force requires the full probability distribution of end-to-end distances. An exact analytical expression does not exist in a closed form, and therefore, we use an approximation that best describes the probability distribution at short end-to-end distances in the stiff limitBecker et al. (2010). Douarche and Cocco proposed such approximation (DC approximation) that considers both the Boltzmann weight due to the elastic energy of the loop and the fluctuation around the minimum energy conformationDouarche and Cocco (2005); Allemand et al. (2006). The cyclization factor is given byAllemand et al. (2006)
| (S3) |
Multiplying this by and differentiating,
| (S4) |
Using = 50 nm and =5 nm (14.7 bp), we obtain the relationship between the shear force in piconewton and DNA length in units of base pair number ().
| (S5) |
This expression with no further adjustment can well describe the scaling of the relationship, but overestimates the force almost by a constant scaling factor. If we multiply the force by 0.6, we find an excellent agreement across the length range of interest. It is not surprising that the approximation overestimates the absolute force value. When compared with the exact density, the DC probability density is shown to have a steeper slope at short extensionBecker et al. (2010), which results in slightly higher force values.
Parameter choice for polymer models
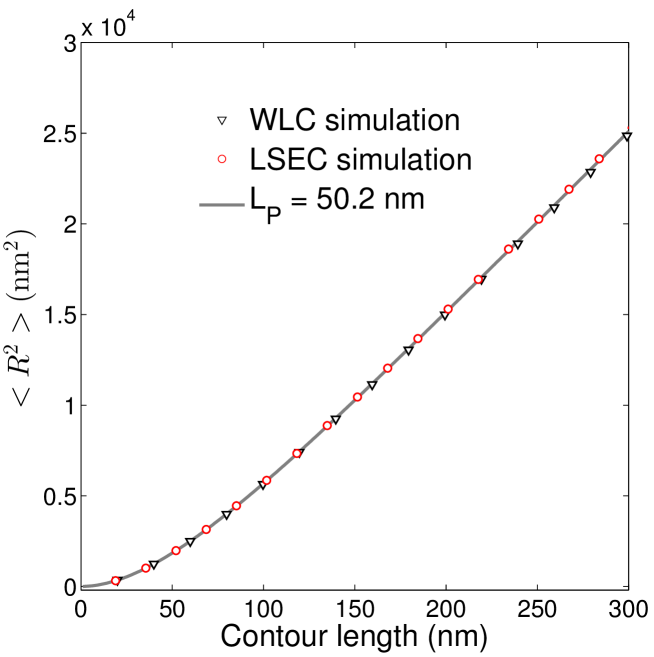
The length of the monomer and the value of the rigidity constant are chosen so that the known statistical mechanical properties of the polymer in the long limit can be reproduced by simulation. In the case of dsDNA, these parameters can be determined based on the persistence length () of the polymer, which is approximately 50 nm. A linear dsDNA molecule longer than the persistence length can be well described as a worm-like chain, and the mean-square end-to-end distance is related to its contour length as
| (S6) |
To calculate , one can generate a large set of chains using the Gaussian sampling method. For the WLC model, we chose the bending rigidity constant to be 73.53 for each 1-bp long monomer. For the LSEC modelWiggins et al. (2006); Wiggins and Nelson (2006), we chose = 7.84 for each 7-bp long monomer (2.37 nm). The chosen parameters all predict a persistence length of 50 nm at large length scales (FIG. S2).
J factor
The looping probability () is the colocalization probability of two reactive ends of the same polymer within a small reaction volume . We do not know a priori what is, but it should be small enough to allow for the two ends of the polymer to react. Therefore, for cyclization of dsDNA with complementary single-stranded overhangs, its dimension should be on the order of the length of the single-stranded overhang (5 nm). The J factor is the effective concentration of one freely diffusing reactive end around the other that would give rise to the same colocalization probability, and can be determined without knowledge of .
Without losing generality, we can fix one reactive end inside and let other reactive ends freely diffuse at a molar concentration of . The rate of a reactant diffusing into is proportional to () whereas the rate of the reactant diffusing out of the volume is concentration-independent (). In typical aqueous reactions, the diffusive encounter between the two ends is much slower than the diffusive separation ()Wang and Davidson (1966). The equilibrium probability of intermolecular colocalization () is a function of :
| (S7) |
Therefore, the J factor is defined by
| (S8) |
The J factor can be determined by measuring both intramolecular and intermolecular reaction kinetics. Both reactions follow a three-state reaction kinetics scheme:
| (S9) |
Here, is the state of end-to-end colocalization without interaction, and is the high-FRET state stabilized by end-to-end annealing. If , the apparent rate of formation () is proportional to the equilibrium probability of state :
| (S10) |
We denote the rate of annealing () as for looping and for dimerization. The apparent looping rate () is
| (S11) |
and the apparent dimerization rate () is
| (S12) |
where we used Eq.˜S7. The second-order rate constant is usually referred to as the annealing rate constant in most other studiesGao et al. (2006); Cisse et al. (2012); Rauzan et al. (2013). According to Eq.˜S8, the J factor is related to the apparent rates by
| (S13) |
Therefore, only if can we determine the J factor from the apparent rates in an unbiased manner.
For looping of long dsDNA, is generally acceptedWang and Davidson (1966). For looping of short dsDNA, however, may be violated. In dimerization, the two ends approach each other from all 4 steradians. In many of these colocalization events, the sticky ends are not optimally aligned for annealing. In looping, the reactive ends approach each other at a much narrower range of angles. As a result, the dangling overhangs with intrastrand stackingOhmichi et al. (2002) may find each other in an anti-parallel orientation more often than in free diffusion. Hence, the entropic barrier for would be lower than for . This effect is conceptually similar to rate enhancement in intramolecular reactions that far exceeds local concentration effect due to entropyPage and Jencks (1971) or orientation-dependent reactivityDafforn and Koshland Jr (1971); Mazor et al. (1990).
Calcuating the free energy of kink formation
We adopted the computational method in Zheng and Vologodskii (2009), which is also conceptually similar to a more theoretical approachSivak and Geissler (2012). We considered the dinucleotide bending energy with both the elastic bending term and kinking term using the functional form in Eq. 3. The critical kink angle () was defined as the intercept of the two terms. The equilibrium probability density () or the partition function of the bending angle is proportional to the multiplicity of and the Boltzmann factor
| (S14) |
The kinking probability () is the probability for to exceed the critical kink angle , which is
| (S15) |
The free energy of kink formation can be directly calculated from as . For example, if we consider an energy function with and for kink formation, . If we assume no additional energy cost of kinkingWiggins et al. (2005), we have a little lower of , as expected.
References
- Olson and Zhurkin (2000) W. K. Olson and V. B. Zhurkin, Current opinion in structural biology 10, 286 (2000).
- Strick et al. (2000) T. Strick, J.-F. Allemand, V. Croquette, and D. Bensimon, Progress in biophysics and molecular biology 74, 115 (2000).
- Nikolova et al. (2011) E. N. Nikolova, E. Kim, A. A. Wise, P. J. O’Brien, I. Andricioaei, and H. M. Al-Hashimi, Nature 470, 498 (2011).
- Maehigashi et al. (2012) T. Maehigashi, C. Hsiao, K. K. Woods, T. Moulaei, N. V. Hud, and L. D. Williams, Nucleic acids research 40, 3714 (2012).
- Shimada and Yamakawa (1984) J. Shimada and H. Yamakawa, Macromolecules 17, 689 (1984).
- Elias and Eden (1981) J. G. Elias and D. Eden, Macromolecules 14, 410 (1981).
- Bednar et al. (1995) J. Bednar, P. Furrer, V. Katritch, A. Stasiak, J. Dubochet, and A. Stasiak, Journal of molecular biology 254, 579 (1995).
- Smith et al. (1996) S. B. Smith, Y. Cui, and C. Bustamante, Science 271, 795 (1996).
- Bouchiat et al. (1999) C. Bouchiat, M. Wang, J.-F. Allemand, T. Strick, S. Block, and V. Croquette, Biophysical journal 76, 409 (1999).
- Shore et al. (1981) D. Shore, J. Langowski, and R. L. Baldwin, Proceedings of the National Academy of Sciences 78, 4833 (1981).
- Taylor and Hagerman (1990) W. H. Taylor and P. J. Hagerman, Journal of molecular biology 212, 363 (1990).
- Porschke (1991) D. Porschke, Biophysical chemistry 40, 169 (1991).
- Baumann et al. (1997) C. G. Baumann, S. B. Smith, V. A. Bloomfield, and C. Bustamante, Proceedings of the National Academy of Sciences 94, 6185 (1997).
- Wenner et al. (2002) J. R. Wenner, M. C. Williams, I. Rouzina, and V. A. Bloomfield, Biophysical journal 82, 3160 (2002).
- Bond et al. (2010) L. M. Bond, J. P. Peters, N. A. Becker, J. D. Kahn, and L. J. Maher, Nucleic acids research 38, 8072 (2010).
- Andrews and Luger (2011) A. J. Andrews and K. Luger, Annual review of biophysics 40, 99 (2011).
- Baker et al. (1999) T. Baker, N. Olson, and S. Fuller, Microbiology and Molecular Biology Reviews 63, 862 (1999).
- Cloutier and Widom (2004) T. E. Cloutier and J. Widom, Molecular cell 14, 355 (2004).
- Cloutier and Widom (2005) T. Cloutier and J. Widom, Proceedings of the National Academy of Sciences of the United States of America 102, 3645 (2005).
- Wiggins et al. (2006) P. A. Wiggins, T. Van Der Heijden, F. Moreno-Herrero, A. Spakowitz, R. Phillips, J. Widom, C. Dekker, and P. C. Nelson, Nature nanotechnology 1, 137 (2006).
- Yuan et al. (2008) C. Yuan, H. Chen, X. W. Lou, and L. A. Archer, Physical review letters 100, 018102 (2008).
- Han et al. (2009) L. Han, H. G. Garcia, S. Blumberg, K. B. Towles, J. F. Beausang, P. C. Nelson, and R. Phillips, PloS one 4, e5621 (2009).
- Yan and Marko (2004) J. Yan and J. F. Marko, Physical review letters 93, 108108 (2004).
- Wiggins et al. (2005) P. A. Wiggins, R. Phillips, and P. C. Nelson, Physical Review E 71, 021909 (2005).
- Sivak and Geissler (2012) D. A. Sivak and P. L. Geissler, The Journal of chemical physics 136, 045102 (2012).
- Du et al. (2005a) Q. Du, C. Smith, N. Shiffeldrim, M. Vologodskaia, and A. Vologodskii, Proceedings of the National Academy of Sciences of the United States of America 102, 5397 (2005a).
- Destainville et al. (2009) N. Destainville, M. Manghi, and J. Palmeri, Biophysical journal 96, 4464 (2009).
- Yuan et al. (2007) C. Yuan, X. W. Lou, E. Rhoades, H. Chen, and L. A. Archer, Nucleic acids research 35, 5294 (2007).
- Manzo et al. (2012) C. Manzo, C. Zurla, D. D. Dunlap, and L. Finzi, Biophysical journal 103, 1753 (2012).
- Vafabakhsh and Ha (2012) R. Vafabakhsh and T. Ha, Science 337, 1097 (2012).
- Vologodskii and Frank-Kamenetskii (2013) A. Vologodskii and M. D. Frank-Kamenetskii, Nucleic acids research 41, 6785 (2013).
- Brukner et al. (1994) I. Brukner, S. Susic, M. Dlakic, A. Savic, and S. Pongor, Journal of molecular biology 236, 26 (1994).
- Strauss and Maher (1994) J. K. Strauss and L. J. Maher, Science 266, 1829 (1994).
- Williams and Maher III (2000) L. D. Williams and L. J. Maher III, Annual review of biophysics and biomolecular structure 29, 497 (2000).
- Stellwagen and Lu (2010) N. C. Stellwagen and Y. Lu, Journal of Physics: Condensed Matter 22, 494110 (2010).
- Peters and Maher (2010) J. P. Peters and L. J. Maher, Quarterly reviews of biophysics 43, 23 (2010).
- Vologodskii et al. (2013) A. Vologodskii, Q. Du, M. D. Frank-Kamenetskii, et al., Artif. DNA: PNA XNA 4, 1 (2013).
- Le and Kim (2013) T. T. Le and H. D. Kim, Biophysical journal 104, 2068 (2013).
- Bell (1978) G. I. Bell, Science 200, 618 (1978).
- Bustamante et al. (2004) C. Bustamante, Y. R. Chemla, N. R. Forde, and D. Izhaky, Annual review of biochemistry 73, 705 (2004).
- Wiggins and Nelson (2006) P. A. Wiggins and P. C. Nelson, Physical Review E 73, 031906 (2006).
- Strunz et al. (1999) T. Strunz, K. Oroszlan, R. Schäfer, and H.-J. Güntherodt, Proceedings of the National Academy of Sciences 96, 11277 (1999).
- Braunlin and Bloomfield (1991) W. H. Braunlin and V. A. Bloomfield, Biochemistry 30, 754 (1991).
- Dupuis et al. (2013) N. F. Dupuis, E. D. Holmstrom, and D. J. Nesbitt, Biophysical journal 105, 756 (2013).
- Hinczewski et al. (2013) M. Hinczewski, J. C. M. Gebhardt, M. Rief, and D. Thirumalai, Proceedings of the National Academy of Sciences 110, 4500 (2013).
- Evans et al. (2004) E. Evans, A. Leung, V. Heinrich, and C. Zhu, Proceedings of the National Academy of Sciences of the United States of America 101, 11281 (2004).
- Comstock et al. (2011) M. J. Comstock, T. Ha, and Y. R. Chemla, Nature methods 8, 335 (2011).
- Crick and Klug (1975) F. Crick and A. Klug, Nature 255, 530 (1975).
- Lankaš et al. (2006) F. Lankaš, R. Lavery, and J. H. Maddocks, Structure 14, 1527 (2006).
- Zeida et al. (2012) A. Zeida, M. R. Machado, P. D. Dans, and S. Pantano, Physical Review E 86, 021903 (2012).
- Frank-Kamenetskii and Prakash (2014) M. D. Frank-Kamenetskii and S. Prakash, Physics of Life Reviews (2014).
- Lee and Sung (2012) O.-c. Lee and W. Sung, Physical Review E 85, 021902 (2012).
- Fields et al. (2013) A. P. Fields, E. A. Meyer, and A. E. Cohen, Nucleic acids research 41, 9881 (2013).
- Mitchell et al. (2011) J. Mitchell, C. Laughton, and S. A. Harris, Nucleic acids research 39, 3928 (2011).
- Zheng and Vologodskii (2009) X. Zheng and A. Vologodskii, Biophysical journal 96, 1341 (2009).
- Du et al. (2008) Q. Du, A. Kotlyar, and A. Vologodskii, Nucleic acids research 36, 1120 (2008).
- Douarche and Cocco (2005) N. Douarche and S. Cocco, Physical Review E 72, 061902 (2005).
- Schöpflin et al. (2012) R. Schöpflin, H. Brutzer, O. Müller, R. Seidel, and G. Wedemann, Biophysical journal 103, 323 (2012).
- Shi et al. (2013) X. Shi, D. Herschlag, and P. A. Harbury, Proceedings of the National Academy of Sciences 110, E1444 (2013).
- Mantelli et al. (2011) S. Mantelli, P. Muller, S. Harlepp, and M. Maaloum, Soft Matter 7, 3412 (2011).
- Shroff et al. (2008) H. Shroff, D. Sivak, J. J. Siegel, A. McEvoy, M. Siu, A. Spakowitz, P. L. Geissler, and J. Liphardt, Biophysical journal 94, 2179 (2008).
- Wang et al. (2013) J. Wang, H. Qu, and G. Zocchi, Physical Review E 88, 032712 (2013).
- Du et al. (2005b) Q. Du, M. Vologodskaia, H. Kuhn, M. Frank-Kamenetskii, and A. Vologodskii, Biophysical Journal 88, 4137 (2005b).
- Vologodskaia and Vologodskii (2002) M. Vologodskaia and A. Vologodskii, Journal of Molecular Biology 317, 205 (2002).
- Kästner and Thiel (2005) J. Kästner and W. Thiel, The Journal of chemical physics 123, 144104 (2005).
- Hwang (2007) W. Hwang, The Journal of chemical physics 127, 175104 (2007).
- Kumar et al. (1992) S. Kumar, J. M. Rosenberg, D. Bouzida, R. H. Swendsen, and P. A. Kollman, Journal of computational chemistry 13, 1011 (1992).
- Becker et al. (2010) N. Becker, A. Rosa, and R. Everaers, The European Physical Journal E 32, 53 (2010).
- Allemand et al. (2006) J.-F. Allemand, S. Cocco, N. Douarche, and G. Lia, The European Physical Journal E 19, 293 (2006).
- Wang and Davidson (1966) J. C. Wang and N. Davidson, Journal of molecular biology 19, 469 (1966).
- Gao et al. (2006) Y. Gao, L. K. Wolf, and R. M. Georgiadis, Nucleic acids research 34, 3370 (2006).
- Cisse et al. (2012) I. I. Cisse, H. Kim, and T. Ha, Nature structural & molecular biology 19, 623 (2012).
- Rauzan et al. (2013) B. Rauzan, E. McMichael, R. Cave, L. R. Sevcik, K. Ostrosky, E. Whitman, R. Stegemann, A. L. Sinclair, M. J. Serra, and A. A. Deckert, Biochemistry 52, 765 (2013).
- Ohmichi et al. (2002) T. Ohmichi, S.-i. Nakano, D. Miyoshi, and N. Sugimoto, Journal of the American Chemical Society 124, 10367 (2002).
- Page and Jencks (1971) M. I. Page and W. P. Jencks, Proceedings of the National Academy of Sciences 68, 1678 (1971).
- Dafforn and Koshland Jr (1971) G. Dafforn and D. Koshland Jr, Bioorganic Chemistry 1, 129 (1971).
- Mazor et al. (1990) M. H. Mazor, C. F. Wong, J. A. McCammon, J. M. Deutch, and G. Whitesides, Journal of Physical Chemistry 94, 3807 (1990).