Resolved Star Formation on Sub-galactic Scales in a Merger at
Abstract
We present a detailed analysis of Hubble Space Telescope (HST), Wide Field Camera 3 (WFC3) G141 grism spectroscopy for seven star-forming regions of the highly magnified lensed starburst galaxy RCSGA 032727-132609 at . We measure the spatial variations of the extinction in RCS0327 through the observed H/H emission line ratios, finding a constant average extinction of . We infer that the star formation is enhanced as a result of an ongoing interaction, with measured star formation rates derived from demagnified, extinction-corrected H line fluxes for the individual star-forming clumps falling 1–2 dex above the star formation sequence. When combining the HST/WFC3 /H emission line ratio measurements with [NII]/H line ratios from Wuyts et al. (2014), we find that the majority of the individual star-forming regions fall along the local “normal” abundance sequence. With the first detections of the He I 5876 and He II 4686 recombination lines in a distant galaxy, we probe the massive-star content of the star-forming regions in RCS0327. The majority of the star-forming regions have a He I 5876 to H ratio consistent with the saturated maximum value, which is only possible if they still contain hot O-stars. Two regions have lower ratios, implying that their last burst of new star formation ended Myr ago. Together, the He I 5876 and He II 4686 to H line ratios provide indirect evidence for the order in which star formation is stopping in individual star-forming knots of this high redshift merger. We place the spatial variations of the extinction, star formation rate and ionization conditions in the context of the star formation history of RCS0327.
Subject headings:
galaxies: strong gravitational lensing — galaxies: high-redshift1. Introduction
Detailed studies of galaxies only a few billion years after the Big Bang are critical for our understanding of galaxy formation. During this epoch, the majority of stars in the Universe were formed (Hopkins & Beacom, 2006) and central supermassive black holes were most active (Hopkins et al., 2008). Our knowledge of star formation in distant galaxies at ‘cosmic noon’, or 1–2, is largely drawn from global averages over marginally resolved galaxies. Despite the inherent challenges, these studies have enabled us to trace galaxy correlations across billions of years to reconstruct their formation histories (e.g., Marchesini et al., 2009; Whitaker et al., 2012; Bell et al., 2012; Cassata et al., 2013; Tomczak et al., 2013, and many more).
However, the internal dynamics and kinematics of galaxies are known to be more complicated. Galaxies exhibit gradients in their stellar populations, such as age, color and metallicity (Bell & de Jong, 2000; MacArthur et al., 2004; Ferreras et al., 2005; Szomoru et al., 2013; Sanchez-Blazquez et al., 2013, and numerous others). Furthermore, measurements of global extinctions vary widely amongst different star-forming populations (e.g., Erb et al., 2006; Takata et al., 2006; Garn et al., 2010; Domínguez et al., 2013; Zahid et al., 2013b; Kriek & Conroy, 2013). Although we would ideally like to resolve the spatial variations of stellar populations on sub-galactic scales for distant galaxies, we often rely upon integrated colors and spectroscopy. This issue of spatial resolution only becomes more challenging as we push studies to earlier epochs.
Although fundamental for probing global galaxy correlations across cosmic time, it is not clear if the integrated stellar populations necessarily encapsulate variations of physical properties on the smaller scales of star-forming regions. Gravitational lensing enables astronomers to probe new parameter space that would not otherwise be accessible with the current generation of telescopes. High redshift galaxies are magnified such that we can study distant samples to lower luminosities, and, for the brightest lensed sources, we can even resolve individual star forming clumps at high spatial resolution. Lensed galaxies are the ideal laboratories for studying the (spatially-resolved) properties of distant galaxies (e.g., Jones et al., 2010; Wuyts et al., 2010; Richard et al., 2011; Stark et al., 2013). For example, Yuan et al. (2011) measured the first metallicity gradient for a lensed grand-design face-on spiral galaxy at , finding well-developed spiral arms and nebular emission line dynamics indicative of a rotationally supported disk that has a significantly steeper metallicity gradient than local galaxies.
Among the brightest known distant lensed galaxies is RCSGA 032727-132609 (Wuyts et al., 2010, hereafter RCS0327). With a redshift of , it is one of the best-studied star-forming galaxies at the peak of cosmic star formation. Due to both the strong gravitational lensing magnification and enhanced star formation from an ongoing interaction, RCS0327 provides a unique opportunity to study a distant galaxy in detail on the pc spatial scales characteristic of star-forming regions. Through a kinematic analysis of adaptive optics (AO) assisted integral field spectroscopic data using the OH-Suppressing Infra-Red Imaging Spectrograph (OSIRIS), Wuyts et al. (2014) find that RCS0327 is an ongoing interaction with a large tidal tail. Four of the seven identified individual star-forming regions from Hubble Space Telescope (HST) Wide Field Camera 3 (WFC3) imaging (diameters ranging from 300 to 600 pc) were observed with high enough signal-to-noise (S/N) to show further evidence for outflows from the H emission line profiles.
The ongoing interaction within RCS0327 boosts the global specific star formation rate to a factor of three above the main sequence of star-formation at (e.g., Whitaker et al., 2012). The nature of such outliers on the star formation sequence are not well understood (e.g., Davé et al., 2012). Two possible modes of star formation that control the growth of galaxies include a relatively steady mode for disk-like galaxies (e.g., Peng et al., 2010) and a starburst mode, generally attributed to merger events (e.g., Mihos & Hernquist, 1994; Bournaud et al., 2011). Rodighiero et al. (2011) find that starburst galaxies represent only 2% of mass-selected star-forming galaxies at the peak epoch of star formation activity, and thus merger-driven starbursts play a relatively minor role in the formation of stars in galaxies. Here, we can compare the physical properties of the ongoing merger RCS0327 to understand the spatial variations in the star formation activity enhancements. In the future, larger samples of distant lensed galaxies can shed light on the primary mechanism governing the build-up of stars within these galaxies.
In this paper, we present spatially-resolved H/H, /H and /H line ratios from HST/WFC3 grism observations of RCS0327. We measure the average absolute extinction and map the variation in extinction across the giant arc in Section 4. We further map the star formation rate and ionization conditions within the galaxy in Sections 5 and 6, respectively. In particular, we present the first spatially-resolved measurements of the Helium to Hydrogen recombination line ratios for a star-forming galaxy at in Section 6.3.
We assume a CDM cosmology with =0.3, =0.7, =70 km s-1 Mpc-1 and a Kroupa (2001) initial mass function (IMF) throughout the paper. All magnitudes are given in the AB system.
2. Observations
Observations with the HST/WFC3 G141 grism were taken over two epochs on February 13, 2012 and February 21, 2013 under GO Program 12726 (PI: Rigby). During each visit, the direct image of RCS0327 was observed with the F140W filter (228 s), along with the dispersed light from the G141 grism (2603 s) for two dither positions. To minimize crowding from cluster galaxies and enable cross-checks on the measurements, the field was observed at a different roll angle for each visit separated by 5.5∘. We find consistent results between both epochs, and co-add the data for the analyses presented herein.
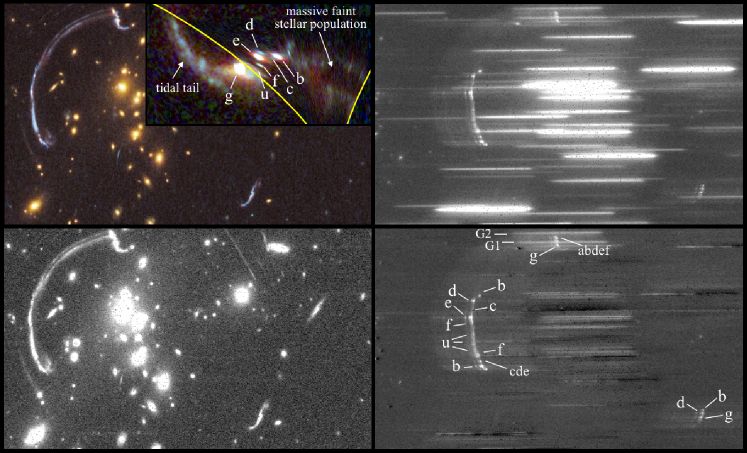
Figure 1 shows the color image and spectrum for the lensed galaxy in RCS0327. The HST/WFC3 F140W image is shown in the bottom left panel with the raw G141 grism observations in the top right panel. After subtracting the contaminating light from the foreground cluster galaxies as described in Section 3, we label the star-forming clumps on the “clean” G141 grism image presented herein (bottom right panel). The spectra were reduced as described in detail by Brammer et al. (2012b).
| Clump | H+ | H | |||
|---|---|---|---|---|---|
| b | – | ||||
| – | |||||
| – | – | ||||
| c | – | – | – | ||
| d | – | – | |||
| – | |||||
| e | |||||
| g | – | – | – | – | |
| u | – | ||||
| – | |||||
| – | – | – | |||
| cde | – |
-
•
Notes. Fluxes are not demagnified and are in units of 10-17 erg s-1 cm-2.
The top left panel of Figure 1 shows the on-sky color rendition of the giant arc from Sharon et al. (2012), including 6 HST filters: F390W (blue), F606W+F814W (green), and F098M+F125W+F160W (red). The inset panel is the reconstruction of the source from the lens model described in Sharon et al. (2012). Stellar mass surface density maps suggest that the stellar populations in clump g were established earlier than the other star-forming clumps, and clump g is merging with an old, red (faint) stellar population at the right side of the reconstructed image (Wuyts et al., 2014). The bright star-forming knots in between are likely a result of the interaction, as demonstrated herein.
3. Data Analysis
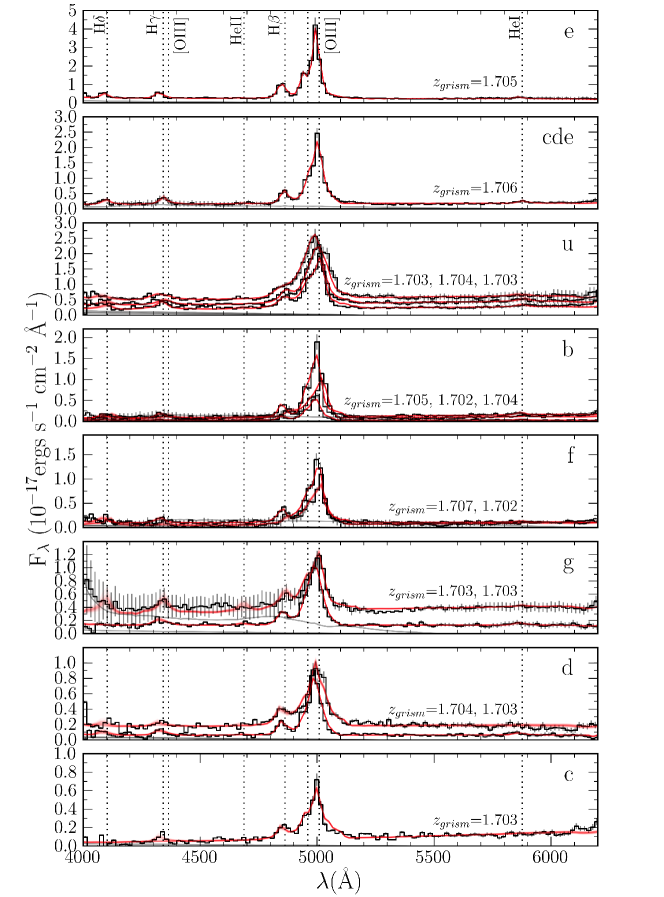
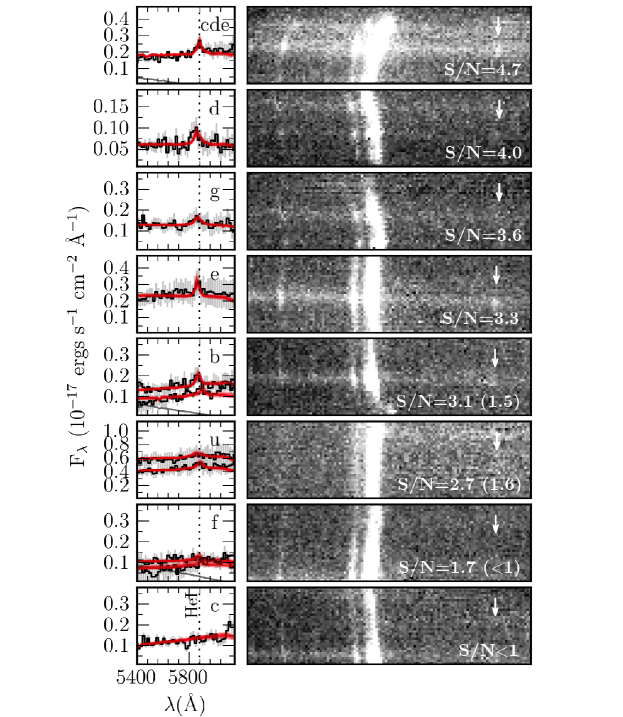
Figure 2 shows the extracted one-dimensional (1D) spectra of seven individual star-forming knots within the bright lensed galaxy RCS0327. The individual star-forming regions (clumps b, c, d, e, f, g, and u) are labeled following the definitions of Wuyts et al. (2010). Strong emission lines of and H, as well as the fainter H (blended with ), H, and emission lines are detected. Table 1 lists the measured emission line fluxes for the unique star-forming clumps. Due to the slitless configuration of the HST/WFC3 grism, the lines are broadened following the two-dimensional (2D) morphology of the source. Where multiple images are available, the effects of morphological broadening and magnification become evident from the varying line profiles and line flux strengths of the same physical regions in Figure 2. In particular, clumps u, b and f show cases where the dispersion axis is perpendicular to the arc (resulting in symmetric line profiles) and at a slight angle with respect to the dispersion axis (asymmetric line profiles).
We include only grism spectra where we are able to unambiguously isolate individual physical regions, with the exception of the blended spectrum for clumps c, d and e due to the high S/N detection of . Clump e only has one unique spectrum, as all other images of this physical region are blended with other physical regions. The image overlapping with “pointing 3” of Wuyts et al. (2014) contains two bright cluster galaxies, labeled G1 and G2 in Figure 1. These cluster galaxies highly contaminate the spectrum of clump g in this region, as seen through the large error bars and contamination (grey line) in Figure 2, rendering these data unusable. Although we include all extracted spectra that uniquely correspond to an individual star-forming region in Figure 2, we disregard this single observation of clump g, as well as one of u and clump b for the remainder of the analyses due to large uncertainties from morphological broadening and contamination.
In order to properly extract line fluxes from the grism spectrum, we generate and fit a model to the 2D spectrum following Brammer et al. (2012a). Next, we briefly summarize the main steps. The contamination from cluster galaxies is determined empirically from the observed F140W image. To generate the contamination model spectra to be subtracted, we take the observed F140W flux and full spatial profiles within each given object’s segmentation map and assume a flat spectrum in units of fλ and allow for a tilt correction. We define extraction regions following the physical regions identified in Sharon et al. (2012). We convolve the observed (contamination-subtracted) F140W arc morphology in each extraction region with a 1D spectrum that consists of a flat continuum plus individual emission lines to determine the redshift. Further details about the redshift fitting method can be found in Section 4.2 of Brammer et al. (2012b).
Once the redshift is established, the individual emission lines are fit. The model is fit to the observed 2D spectrum with parameter optimization using the Markov chain Monte Carlo (MCMC) sampler (Foreman-Mackey et al., 2013). The free parameters include the normalization and slope of a flat continuum to improve the background subtraction and the individual strengths of the emission lines , , H, , H and H. While the spectral resolution of the G141 grism () is insufficient to resolve the H and lines, the sum of these lines is well constrained by the G141 spectrum (see also Brammer et al., 2012a). When fitting the sum of these lines, we assume that the line is 10% the flux of H, as derived from H and the upper limit of measured with higher resolution Near Infrared Spectrometer (NIRSPEC) data of clumps e and u (Rigby et al., 2011). The red lines in Figure 2 show 100 samples from the MCMC chain. In the following sections, we interpret the measured line fluxes within the individual star-forming regions to measure the variation in the physical conditions within RCS0327.
4. Mapping Extinction Variations
The nature of dust in distant galaxies is not well understood: when modeling the spectral energy distributions of galaxies, one assumes a universal dust extinction law to describe how dust absorbs and re-emits the stellar light of galaxies that exhibit a vast range in their star formation histories and environments. Although still poorly understood, it is clear that the dust attenuation law is not universal (e.g., Stecher, 1965; Calzetti et al., 2000; Weingartner & Draine, 2001) and is sensitive to both the dust geometry and viewing angle. Furthermore, the amount of dust extinction in the integrated stellar continuum has been observed to be less than that from star-forming regions, as probed through recombination line ratios in local starbursting galaxies (Calzetti et al., 2000). It is important to understand the amount of dust extinction in galaxies, as extra extinction will result in an underestimate of star formation rates derived from the H line fluxes relative to those derived from the bolometric rest-frame ultraviolet luminosity. Studies of the dust properties in distant star-forming galaxies are not conclusive: while Erb et al. (2006) and Reddy et al. (2010) find no evidence for extra extinction towards star-forming regions, numerous other studies do measure varying degrees of extra extinction (Förster Schreiber et al., 2009; Yoshikawa et al., 2010; Mancini et al., 2011; Wuyts et al., 2013; Kashino et al., 2013; Price et al., 2013).
Global measurements of the Balmer decrement have been made for a few individual distant galaxies at (Teplitz et al., 2000; van Dokkum, 2005; Hainline et al., 2009), or through stacking analyses of larger samples of up to a few hundred galaxies at (e.g., Yoshikawa et al., 2010; Kashino et al., 2013). As these measurements were made using ground-based near-infrared (NIR) spectrographs, sky lines can severely contaminate the line fluxes. Ideally, one would study the nature of dust in distant galaxies using space-based spectroscopy (e.g., Price et al., 2013). Here, for a single galaxy, we are able to measure the Balmer decrement through the ratio of the H and H line fluxes from the space-based HST/WFC3 NIR grism spectroscopy, spatially-resolving the dust extinction for six individual star-forming regions for the first time in a distant galaxy.
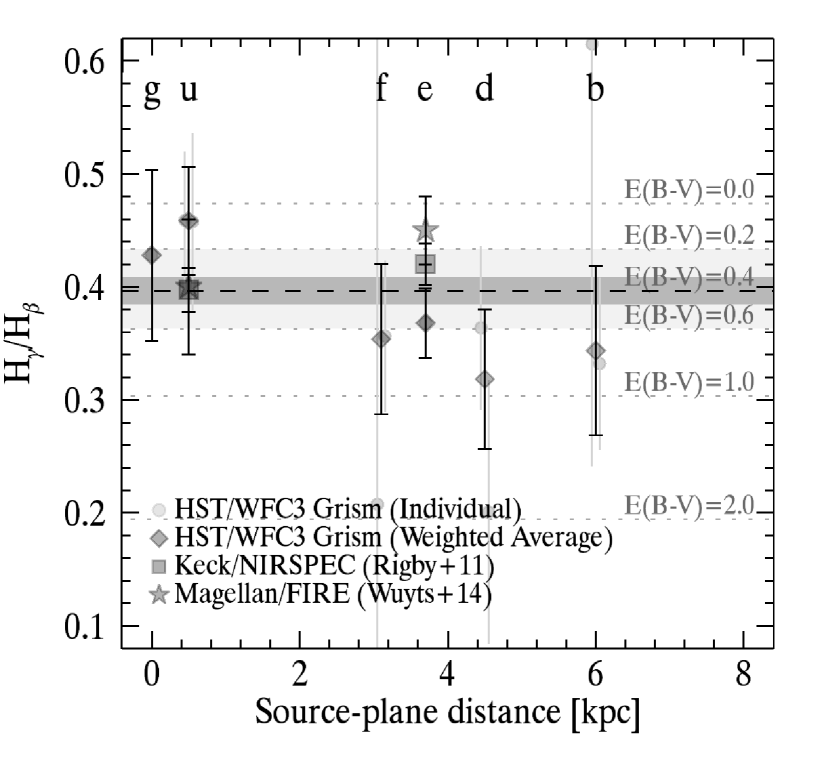
Figure 3 shows the H/H line ratios for six star-forming clumps, as a function of their source-plane distance, as derived in Wuyts et al. (2014). We exclude clump c here, as the H emission line flux is not well constrained. When defining this source-plane distance, clump g is assumed to be the center of the galaxy. This choice is justified by the fact that clump g is the only star-forming region to show up in the stellar mass surface density maps presented in Wuyts et al. (2014). We assume an absorption correction of 5 to the equivalent widths of both Balmer lines, following predictions from low-metallicity (Z=0.008) simple stellar populations in Groves et al. (2012). For multiple images of the same star-forming region, the individual measurements are shown as light grey circles with the weighted average indicated with a diamond. We include additional Balmer decrement measurements from ground-based Keck/NIRSPEC (Rigby et al., 2011, squares) and Magellan Folded-port InfraRed Echellette (FIRE) data (Wuyts et al., 2014, stars). Although the grism data alone shows a trend for higher dust extinction with increasing distance from the established stellar population in clump g, with a best-fit linear slope of , including the ground-based data yields a best-fit slope of , consistent with constant extinction across all star-forming regions in the galaxy. Down-weighting the ground-based measurements to account for systematic uncertainties in the telluric contamination does not change this result. We find the weighted average of all of the data to be (dashed line in Figure 3), with a standard deviation of 0.2. Due to the large error bars in the HST/WFC3 measurements, we do not detect significant variations in extinction between the different clumps and therefore adopt the average value for future dust corrections.
In a separate analysis, Wuyts et al. (2014) measure an average stellar extinction of from spectral energy distribution (SED) modeling. The linear ratio of the average extinction in HII regions as probed by the emission line ratios presented here, relative to the extinction of the stellar light from the SED modeling is . This indicates extra extinction towards HII regions, consistent with measurements by Price et al. (2013) and Wuyts et al. (2013).
5. The Star Formation Sequence
Galaxies are observed to show a correlation between their star formation rate (SFR) and stellar mass (M⋆) from the present day until the earliest observed epoch, less than a billion years after the Big Bang (e.g., Brinchmann et al., 2004; Noeske et al., 2007; Elbaz et al., 2007; Daddi et al., 2007; Pannella et al., 2009; Magdis et al., 2010; González et al., 2010; Whitaker et al., 2012; Guo et al., 2013). The characteristics of this relatively tight correlation are linked with the physical processes regulating galaxy formation and evolution itself (Dutton et al., 2010; Leitner, 2012).
Star formation within galaxies is believed to be regulated by the balance between gas accretion and feedback preventing this gas from cooling, where fluctuations in the gas accretion rate and star formation efficiency are thought to be encapsulated in the intrinsic scatter of the star formation sequence. This scatter has been observed to be correlated with gas mass fractions (Magdis et al., 2012), environment (Patel et al., 2011), morphology (Wuyts et al., 2011), and galaxy merger and interaction processes (Lotz et al., 2008; Jogee et al., 2009). This last correlation is of particular interest for RCS0327, an ongoing merger (Wuyts et al., 2014). Jogee et al. (2009) demonstrate that interacting galaxies out to are observed to have the highest SFRs for a given M⋆, consistent with the predicted star formation histories from the hydrodynamical merger simulations of Lotz et al. (2008).
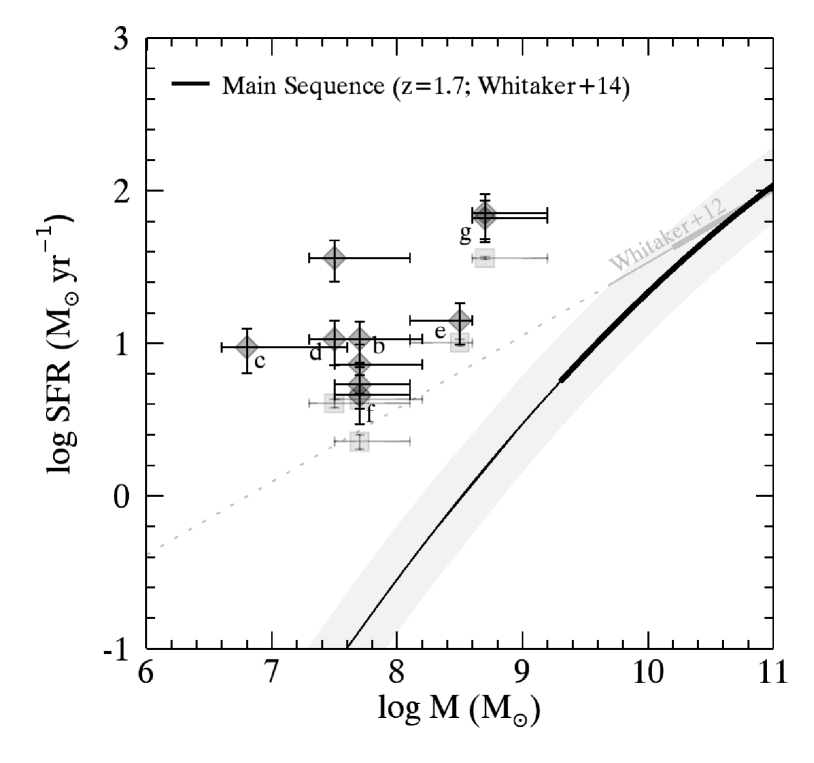
SFR estimates from the HST/WFC3 grism H line fluxes of the individual star-forming clumps of RCS0327 are presented in Figure 4 (diamonds). The H fluxes are demagnified by dividing by the median magnification from the lensing map within the extraction region for each spectrum. We correct the H line fluxes for the average measured extinction of and assume an intrinsic ratio of (H/H)int=2.86 (Osterbrock & Ferland, 2006) to convert to H. We further correct these line fluxes for the expected contribution from outflows, ranging from 30–55%, as measured for the H broad and narrow-line profiles from OSIRIS integral field spectroscopy presented in Table 3 of Wuyts et al. (2014). We also include SFRs derived from the OSIRIS demagnified H luminosities where available (squares, Wuyts et al., 2014), assuming the same dust and outflow corrections. The H luminosities are converted to SFR following the calibration in Kennicutt (1998), plus a factor of 1.7 correction to convert from Salpeter (1955) to a Chabrier (2003) IMF. In Figure 4, we see that the ground-based SFRs are systematically lower than the space-based SFRs. This difference likely results from aperture correction uncertainties in the ground-based data. The OSIRIS H fluxes are measured in an aperture derived from a 2D gaussian fit to the H image. This aperture effectively probes the ionized core of the HII region and does not capture the diffuse outer regions. Also, the AO corrections will spread out the light. Together, these effects result in systematically lower ground-based derived SFRs. Stellar masses are derived from SED modeling of the individual clumps, as described in Wuyts et al. (2014).
In the case where there are multiply lensed images of the same physical region, we find that the measured H line fluxes and inferred SFRs are consistent within the error bars. There is one notable exception; clump d has a widely varying SFR that is not understood. Although the observed H fluxes in the different spectra have similar magnitudes, the magnification is significantly smaller in the counter-arc. Adopting the individual extinction measurements does not bring these measurements into agreement.
In Whitaker et al. (2012), we measured the SFRs out to with the accurate rest-frame colors and photometric redshifts from the NEWFIRM Medium-Band Survey (NMBS, Whitaker et al., 2011) by adding the bolometric rest-frame ultraviolet luminosity to the bolometric infrared luminosity, as calibrated from Spitzer Multiband Imaging Photometer (MIPS) 24m imaging. A measurement with mass-completeness limits extending to signficantly lower stellar masses from Cosmic Assembly Near-infrared Deep Extragalactic Legacy Survey (CANDELS) and 3D-HST data is presented in Whitaker et al. (in prep)111Through a stacking analysis of the 24m imaging, Whitaker et al. (2014) circumvent the SFR completeness limits in NMBS. The trade off with this technique is that while the average relation can be measured robustly, one cannot formally measure the intrinsic scatter at low stellar masses.. In Figure 4, we compare the resolved SFRs for the star-forming clumps to the average observed relation at from Whitaker et al. in prep (black) and Whitaker et al. (2012) (silver). Thick lines indicate mass-complete samples, thin lines are mass-incomplete and the dotted line is an extrapolation. We note the danger in extrapolating the observed star formation sequence far below the mass-completeness limits: as demonstrated in Figure 4, the normalization is over-estimated by almost 2 dex and the slope is under-estimated at stellar masses of 108 M⊙ when extrapolating the NMBS data at , as compared to the deeper 3D-HST/CANDELS analysis of Whitaker et al. in prep (black)222The NMBS sample of Whitaker et al. (2012) is incomplete in M⋆ and SFR at , resulting in a dex offset (thin grey line) largely driven by the limited depth of the MIPS/24m imaging. Only galaxies with the highest sSFRs will be detected and the average relation will consequently be overestimated..
We see that all star-forming regions lie 1–2 dex above the average star formation sequence observed in a similar mass range by Whitaker et al. (in prep). We cannot compare to Whitaker et al. (2012), as there is no data in this parameter space to justify the extrapolated slope. The shaded region in Figure 4 shows the measured intrinsic scatter of 0.25 dex in the relation from Whitaker et al. (2012). Through a compilation of 25 studies in the literature, Speagle et al. (2014) find a roughly constant intrinsic scatter for the relation both with redshift and stellar mass. However, the intrinsic scatter may be larger at low stellar masses; dwarf galaxies show diverse (Weisz et al., 2011) and stochastic (Bauer et al., 2013) star formation histories. Although the scatter at the low mass end is not well understood, the intrinsic scatter in would need to increase by a factor of for the star-forming regions of RCS0327 to no longer be considered outliers.
The average specific SFR () from the HST/WFC3 measurements is 10-6.7 yr-1 with a scatter of 0.5 dex. The relatively small observed intrinsic scatter along the main star-forming sequence of 0.25 dex measured by Whitaker et al. (2012) implies that the individual star-forming clumps all lie 0.75–2.75 dex above the envelope. The average sSFR and scatter are unchanged when correcting with the individual measurements presented in Figure 3, instead of the average value. These observations confirm previous results that galaxy mergers have enhanced SFRs relative to the “normal” star formation sequence. Furthermore, the similar individual measured sSFRs imply that a global estimate for this galaxy would be generally representative of the star formation activity on sub-galactic scales. Given high SFRs and the relatively low inferred dust extinction across the entire galaxy presented in Section 4, hydrodynamical merger simulations would suggest that RCS0327 is in the mid- to final merger stages (Lotz et al., 2008).
6. High Redshift Ionization Conditions
6.1. AGN Search
We searched for the presence of an active galactic nucleus (AGN) in RCS0327 using three different methods. First, we examined the position of individual knots on the Baldwin et al. (1981) diagnostic diagram (henceforth the BPT diagram) and find that the line ratios of all star-forming regions safely fall within the HII-origin parameter space (see Section 6.2). Second, we obtained a 60 ks Chandra image through the Cycle 12 Guest Observer Program (Observation ID 12960, PI:Rigby) and searched for point sources near the nucleus. No point sources coincident with knots e and g were seen in the Chandra data, setting an upper limit on the rest-frame 2–10 keV luminosity of an AGN at erg s-1 (knot e) and erg s-1 (knot g), if we assume Galactic absorption. If we assume Compton-thick intrinsic absorption ( cm-2), then the upper limits are erg s-1 (knot e) and erg s-1 (knot g). Although we cannot rule out the possibility of a highly obscured luminous AGN, a 1045 erg s-1 AGN is more than 100 times rarer than a 1043 erg s-1 AGN at (e.g., Aird et al., 2010). From the X-ray upper limits alone, we cannot rule out the presence of a moderate luminosity AGN. Third, we difference two HST F814W images of 2100 s depth taken three months apart (Program 12371 PI:Rigby, and Program 12267, PI:Rigby). Subtraction of the two epochs of HST images reveals no significant variability. This AGN search will be presented in full in a future paper.
6.2. Dissecting the BPT Diagram
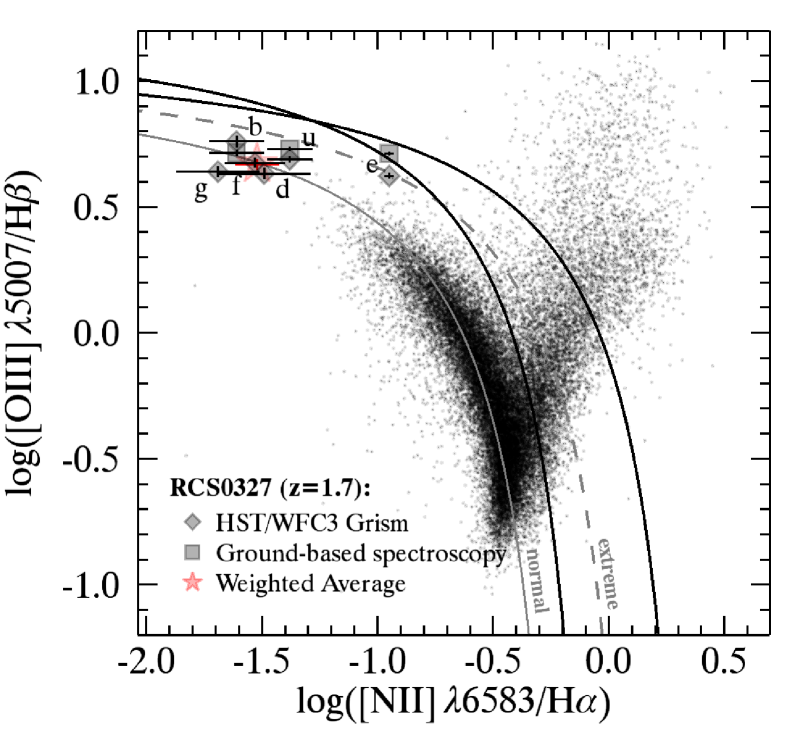
A standard method of separating line emission originating from HII regions from that of gas photoionized by a harder radiation field is using the /H versus /H line ratios. The BPT diagnostic diagram was first proposed by Baldwin et al. (1981), and later refined by Veilleux & Osterbrock (1987) and Kewley et al. (2001). A hard ionization field can either be produced from shock excitation or the accretion disk of an AGN. In the absense of this hard radiation field, star-forming galaxies form a tight sequence on the BPT diagram, often referred to as the star-forming or HII abundance sequence (Dopita & Evans, 1986). The location of this abundance sequence probes the metallicity, stellar ionizing radiation field and physical conditions of the interstellar medium surrounding star-forming regions. As detailed by Kewley et al. (2013), a harder ionizing radiation field and/or a larger electron density moves galaxies above the normal star-forming abundance sequence, whereas a larger ionization parameter can either raise or lower the line ratios, depending on the metallicity.
Kewley et al. (2013) provide theoretical predictions for the lower limit abundance sequence, as derived from “normal” star-forming conditions which assume the same shape extreme ultraviolet radiation field, electron densities and relationship between metallicity and ionization parameter as local star-forming galaxies. In this case, chemical evolution will move star-forming galaxies toward smaller /H and larger /H line ratios with cosmic time. The upper limit abundance sequence proposed by Kewley et al. (2013) propagates extreme star-forming conditions resulting from either a hard radiation field or a combination of a larger ionization parameter () and larger electron densities ( cm-3) than local galaxies for metallicities below . This upper limit star-forming abundance sequence evolves with redshift with an uncertainty of approximately 0.1 dex on the BPT diagram at a given redshift.
High redshift observations seem to indicate that the bulk of galaxies lie above the local abundance sequence (e.g., Förster Schreiber et al., 2009; Yabe et al., 2012, 2014; Newman et al., 2014; Zahid et al., 2013a; Cullen et al., 2013). However, it is unclear whether high redshift star-forming galaxies have more extreme in situ star-forming conditions or have a contribution to the line emission from AGN and/or shock excitation. The majority of studies are limited to massive, high metallicity galaxies (e.g., Förster Schreiber et al., 2009; Yabe et al., 2012) that dominate the stellar mass density budget of the universe, whereas we present data for a lower metallicity and stellar mass galaxy that is representative of the regime where galaxies have the largest number densities (Marchesini et al., 2009).
In this work, we take advantage of both the magnification from the gravitational lens and the high spatial resolution provided by the WFC3 grism to dissect the origin of line emission in six resolved star-forming clumps of RCS0327. We exclude clump c in this analysis, as and H line fluxes are not available. Figure 5 shows the BPT diagram for RCS0327 relative to the local abundance sequence and empirically and theoretically derived relations. As detailed in Section 6.1, we can rule out the presence of an unobscured high luminosity AGN in RCS0327.
Next we explore the reasons why clump e is offset in the BPT diagram. We find little evidence for an extreme ionization parameter in clump e relative to the other star-forming regions. The /H line ratios agree within 0.2 dex for all star-forming clumps. However, clump e does have a higher electron density of cm-3, as measured from the [OII] 3726,3729 doublet ratio by Wuyts et al. (2014) that is independent of the lensing magnification. Wuyts et al. (2014) measure outflow wind velocities of 145 to 315 km/s in clumps b, d, e and f. Clump e is observed to have the highest outflow velocity (315 km/s) and relative contribution of H flux in the broad component (54%).
Contribution from shock excitation may explain the peculiar behavior of clump e on the BPT diagram. Radiative shocks produce a hard ionizing radiation field that can also contaminate the measured line ratios. Slow shocks associated with galactic-scale winds have been observed locally (Rich et al., 2010, 2012) and at (Yuan et al., 2012). These shocked stellar winds can change the geometrical distribution of the gas around the ionizing source, and hence the stellar ionizing radiation field. Stellar winds will preferentially clear ionized gas from the interior of an H II region, lowering the effective ionization parameter (Yeh & Matzner, 2012). The higher measured outflow in clump e will move it down and to the right of the global average for RCS0327 in the BPT diagram. When combining this with the higher electron density, which will move clump e up and to the right in the BPT diagram, we find that clump e effectively moves to the right. We suspect that the combination of shocks and a slightly higher electron density could result in clump e lying on the upper limit “extreme” abundance sequence predicted for in Figure 5.
An alternative explanation of why clump e is offset in the BPT diagram is that it hosts an AGN. Using spatially-resolved measurements from the SINS survey (Förster Schreiber et al., 2009), Newman et al. (2014) find that the inner regions of galaxies are offset to higher excitation relative to their outer regions. Active nuclei could explain the higher excitation found in the central regions of galaxies by Newman et al. (2014). Without the added spatial resolution and magnification from gravitational lensing, it is difficult to distinguish the origin of this offset given the large range of possible physical mechanisms listed above. Here, we do not find such a trend, with five out of six star-forming regions following the local abundance sequence (including the “central” clump g). Even if we instead assume that clump e is the center of the galaxy, contrary to the spatially-resolved stellar mass analysis, the evidence still shows that clump e does not appear to host an AGN.
6.3. He I/H Line Ratio Diagnostics
We detect the He I Å emission line in several knots of the WFC3 grism data of RCS0327. As the He I Å emission line has not been used previously, to our knowledge, to study distant galaxies, we now explore the origin of this emission. We then examine the strength of the line in the bright knots of RCS0327, compare to theoretical predictions from the Cloudy plasma code, and comment upon the massive star content of these star-forming regions.
Because it is a helium recombination line, He I measures the nebular ionization rate, and thus, probes how many extremely massive stars are present in a star-forming region. The ratio of a Helium recombination line to a Hydrogen recombination line has long been recognized as a diagnostic that is sensitive to the relative sizes of the He II and H II Stromgren spheres (Bashkin & Stoner, 1975). As Osterbrock & Ferland (2006) explain, there are two limiting cases. In the case of a soft ionizing spectrum, there are far more photons capable of ionizing H than photons capable of ionizing He, resulting in a He II Stromgren sphere much smaller than the H II Stromgren sphere. In the case of a hard ionizing spectrum, the ionizing spectrum contains so many photons with energies exceeding the first ionization potential of He (24.6 eV), that these photons dominate the ionization of both H and He. In this hard case, the H II and He II Stromgren spheres overlap, and there is a single region in which both H and He are ionized.
Simple models (Osterbrock & Ferland, 2006, Figures 2.4 and 2.5) show that this hard case occurs, i.e. the Stromgren spheres overlap, when the stellar effective temperature is at least 40,000 K. This is roughly equivalent to an O7 V star (Table 2.3 of Osterbrock & Ferland, 2006), with a mass of M⊙ (Gies et al., 2002; Niemela & Bassino, 1994). Once the Stromgren spheres overlap, a He I to H I recombination line ratio saturates at its maximum value; successively harder spectra do not change the ratio. The value at which the line ratio saturates is sensitive to the He abundance, and is insensitive to density, ionization parameter, electron temperature, or other nuisance variables (Vanzi et al., 1996; Förster Schreiber et al., 2001).
Although such simple models are appropriate for the simplest Galactic H II regions where a single star dominates the ionizing continuum (Oey et al., 2000; Kennicutt et al., 2000), it is not appropriate to characterize the ionizing spectrum with an effective temperature when the ionizing source is not one hot star, but many hot stars, as in the case of large H II regions or super star clusters. However, a simple rule-of-thumb emerges: a region that is forming stars continuously with a Salpeter (1955)-slope IMF extending past 40–60 M⊙ will have a sufficiently hard enough spectrum that the Stromgren spheres overlap, and a He I to H I line ratio will saturate (Rigby & Rieke, 2004).
6.3.1 He I/H Line Measurements
The 2D spectra in the right panel of Figure 6 show a clear He I detection in four of the seven star-forming knots at . Among the cases that lack an obvious detection, the He I line has large morphological broadening in knot u, we report a upper limit for the marginal detection in knot f, and there is no formal detection in the faintest knot c. The 1D spectra for all grism extractions of the star-forming regions are shown in the left panels of Figure 6, ranked by S/N.
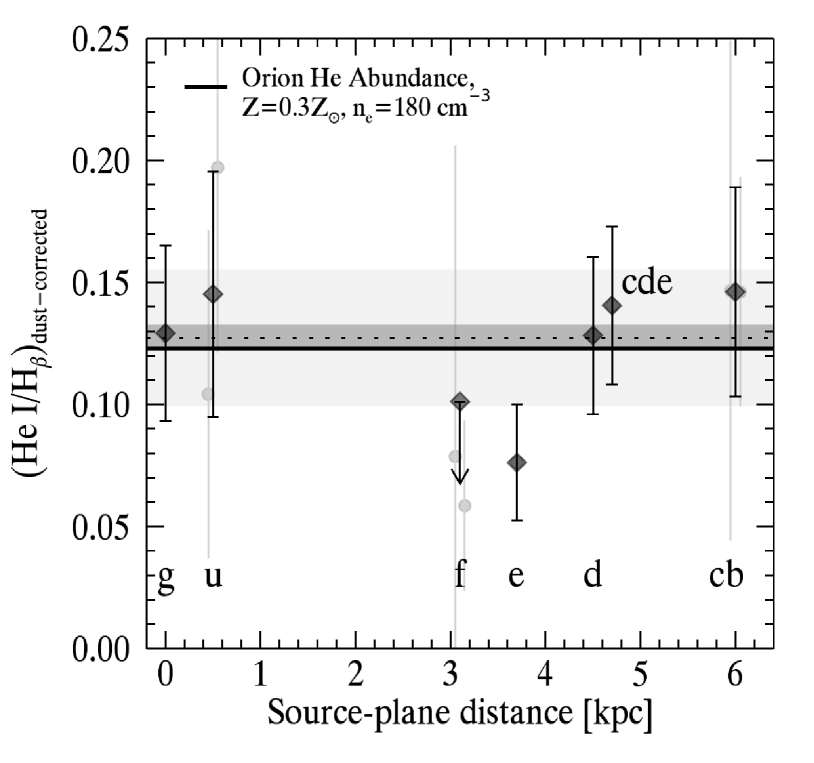
By combining the He I measurements with the well-detected H line fluxes, we make the unique measurement of the number of Helium to Hydrogen ionizing photons for individual star-forming regions within a merging galaxy at . These ratios have been corrected for the average line ratio of measured in Section 4, converted into an average dust extinction within the galaxy assuming the Calzetti et al. (2000) law. We note that although correcting by the individual measurements presented in Figure 3 does not significantly change the results, we chose to adopt the average correction.
In Figure 7, we see that the majority of the clumps have a similarly high He I to H ratio, with a weighted mean value of and a standard deviation of 0.028. Both measurements include the uncertainty in the mean dust extinction correction. The ratio measured for the high S/N spectra of knot e is below the average value, as weighted by the demagnified F160W flux within each extraction region rather than the individual measurement errors. Similarly, we present the upper limit for knot f.
In addition to He I , we also formally detect He II in knot g with a line flux measurement of erg s-1 cm-2. Together with our H line fluxes, we find a He II /H line ratio of in knot g. We also constrain the He II /H line ratio for knot e, finding a value of . The error bars for the remainder of the knots are too large to constrain the He II /H line ratio.
6.3.2 Models
To analyze the He I and He II to H line ratios we observe in RCS0327, we generate theoretical spectra of star-forming regions using the stellar synthesis code Starburst 99 (Leitherer et al., 1999; Vázquez & Leitherer, 2005; Leitherer et al., 2010) and the plasma code Cloudy (Ferland et al., 2013). We generate ionizing spectra using Starburst 99 (version 6.0.4), assuming continuous star formation with a metallicity of solar333Starburst99 has only a set number of stellar spectral templates; 40 of solar is the closest match to the measured metallicity measured by Wuyts et al. (2014) for RCS0327., and a Salpeter (1955) IMF high-mass slope444The slope of the IMF at the massive end is the same for the Chabrier (2003) IMF, adopted throughout the rest of this paper. The ionizing spectrum originates solely from the high mass end where the Chabrier (2003) and Salpeter (1955) IMFs will produce identical results.. We feed the ionizing spectrum from Starburst99 into Cloudy (version 13.02, Ferland et al., 2013) assuming 30 solar metallicity, a hydrogen density of either 180 cm-3 or 600 cm-3 (as measured by Wuyts et al. (2014), using data from Rigby et al. (2011) for knots u and e, respectively), and an ionization parameter of , which is the value measured by Rigby et al. (2011) scaled for the average extinction we measure here. Wuyts et al. (2014) find the [NII]/H ratios are constant for all but clump e, indicating a constant metallicity555As noted earlier, clump e suffers from contribution to the line emission from outflows and a higher measured electron density, and we therefore suspect that the higher [NII]/H ratio does not indicate a higher metallicity. Moreover, Wuyts et al. (2014) find that the metallicity indicator (Zaritsky et al., 1994; Kobulnicky & Kewley, 2004) is consistent amongst all of the clumps.. We further assume that the region is radiation-bounded. At these relatively low densities and electron temperatures, the emission from He I is almost entirely recombination; collisional excitation contributes (Porter et al., 2009).
One complication in the plasma modeling is that, in the low density limit, an infinite number of energy levels of the H and He atoms would need to be treated to correctly calculate the recombination line fluxes (Bauman et al., 2005; Porter et al., 2005, 2007). However, each atom must be approximated with a finite number of energy levels. The default settings of Cloudy have insufficient levels to correctly predict He I/H I recombination line ratios. Therefore, we follow Porter et al. (2007), who calculated theoretical He I/H I recombination line ratios for the Orion nebula, by using 40 resolved levels and 60 collapsed levels for both the H I and He I atoms. Such models push high-end desktop computers to their limits; each Cloudy model took 3 days to run (versus 10 minutes for models with the default number of levels for He and H). Although we cannot formally prove that this finite numerical approximation yields the correct answer, we do find that the line ratios converge as the number of levels increases: increasing the number of resolved levels from 6 (default) to 40 changes the predicted He I line ratio by ; increasing from 40 to 50 resolved levels changes the line ratio by only .
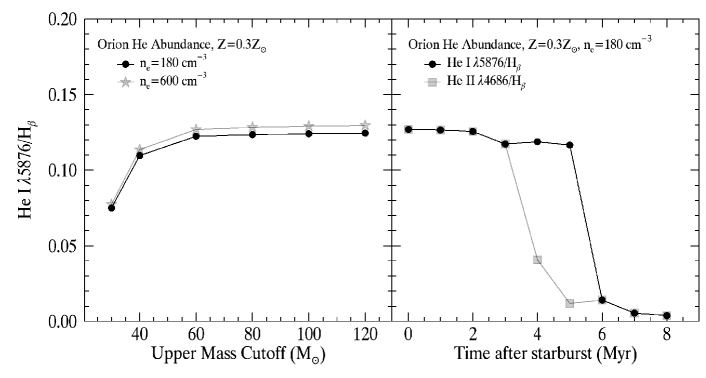
Figure 8 shows the theoretical value of the He I /H line ratio (left panel), as computed from our Cloudy models. For continuous star formation with an Orion He abundance pattern, 30% solar metalicity, density of 180 cm-3, and a Salpeter (1955) IMF with an upper mass cutoff anywhere in the range of 60 to 120 M⊙, the saturated He I /H ratio is 0.123.
The saturated value of the ratio is sensitive to the He/H abundance ratio and the population of massive stars, and is remarkably insensitive to anything else. The relationship with He abundance is linear: for example, increasing the relative He abundance by 10% increases the He I/H line ratio by 10%. The saturated value is insensitive to gas-phase metallicity; increasing the metallicity from 30% to 40% increases the saturated value by only 1.5%. The saturated value is insensitive to density: increasing the density from 180 cm-3 to 600 cm-3 increases the saturated value by only 5%. We choose the Orion He abundance pattern (Yp=0.29)666Calculated from Table 7.2 from the Hazy documentation for Cloudy, http://data.nublado.org/cloudy_releases/c13/, as this is equivalent to the Solar He abundance and most useful for future reference. As the saturated ratio scales linearly with He abundance, the value we calculated can be adopted to other He/H abundances.
To explore the evolution of line ratios after star formation ceases, we assume an instantaneous starburst and age the spectrum to compute both the He I /H and He II /H line ratios with time (right panel of Figure 8). The He I /H line ratio steeply drops from the saturated value after 5 Myr, when the hottest stars die. Similarly, the He II /H line ratio, sensitive to very hard ultraviolet photons, drops after only 3 Myr. In reality, there will be a more gradual evolution of these line ratios as star formation is not truncated instantaneously. Figure 8 illustrates the general trends for this simplified case of an instantaneous starburst.
6.3.3 Interpretation
Figure 7 shows that the He I /H ratios for four knots are consistent with the saturated value, within the error bars. This implies that their ionizing spectra are similar to that of a Salpeter (1955) present-day mass function extending above 60 M⊙. The high He II /H and He I /H line ratios for knot g suggest that massive stars have formed within the last 3 Myr.
Two knots, e and f, have measured He I /H ratios below the saturated value. Karczewski et al. (2013) measure a similar ratio of 0.079 in a local irregular starburst galaxy NGC 4449, although earlier measurements by Martin & Kennicutt (1997) of 4 local irregular galaxies found a lower ratio of only 0.01–0.02. Interestingly, these galaxies are considered to be starbursting in the local Universe, but they would be considered “normal” at due to the strong evolution in the SFRs of galaxies (e.g., Whitaker et al., 2012). If the low values we measure in this paper are not due to measurement errors, there are three straight forward interpretations of the lower He I /H ratios measured in clumps e and f. The first explanation would be that those clumps have a lower Helium to Hydrogen abundance ratio. Alternatively, these clumps could be missing their most massive stars. Such a situation could arise if either the IMF has an upper mass cutoff such that the most massive stars never formed, or if the IMF extends to high masses, but enough time has passed that the most massive stars have died. The intermediate He I /H line ratio value together with the low He II /H line ratio of in knot e suggest that star formation shut down about 5-–6 Myr ago (see Figure 8, right panel).
The latter interpretation fits in with our understanding of the merger history of RCS0327. It is possible that all of the star-forming clumps are formed from gas clouds near the established stellar population in knot g as a result of the gravitational interaction. In this simple picture, those star-forming clumps physically closest to knot g formed earliest and the clumps increasingly further from knot g formed at later times. As knot u is physically closest to knot g, the gas reservoir may continue to be replenished even though this clump was likely the first to form, yet still has a high observed He I/H ratio. On the other hand, knots f and e formed next in our simple picture and their low He I /H line ratios (and He II /H for knot e) imply that they have already depleted their gas supply and are no longer actively forming new stars. Finally, knots d, c and b are the furthest in distance from knot g and the last to form their stars. Given the high observed He I /H line ratios, the most massive stars in these star-forming regions must still be contributing to the ionizing spectrum. Although we cannot formally constrain the absolute ages of the different star-forming knots with the He to H line ratio diagnostic, we are able to set limits on the time since the last burst of new star formation. This diagnostic therefore provides indirect evidence for the order in which star formation is stopping in the individual star-forming clumps.
7. Discussion
The data presented herein enables the unique opportunity to study in great detail the physical properties of individual star-forming regions in the ongoing merger RCS0327 at , the epoch marking the cosmic peak of star formation activity. Through a spatially-resolved kinematic analysis of the galaxy, Wuyts et al. (2014) find evidence that the gas-rich knot g has an established stellar population that interacted with an older, gas-poor and similarly massive stellar population. Consistent with this scenario, Wuyts et al. (2014) observe both a tidal arm extending west of knot g, as well as chain of star-forming clumps extending east that are thought to have formed from a stream of gas pulled away from knot g as a result of the interaction (see Figure 1).
Here, we present the results from HST/WFC3 grism spectroscopy and place them in the context of our current understanding of star formation history of RCS0327. We measure the spatial variations of the extinction in RCS0327 through the observed H/H line ratios, finding an average extinction of . When combined with the SED modeling analysis of Wuyts et al. (2014), we find the ratio of the average extinction of the gas relative to the stars is . This value is consistent with the results in the literature (Wuyts et al., 2013; Price et al., 2013; Kashino et al., 2013), who measure similar levels of extra extinction towards the star-forming regions in distant galaxies.
There is a marginal trend at the 2 significance level within the grism observations alone for spatial variations in the extinction, with the slightly larger values measured with increased distance from the established stellar population of knot g. However, when including higher spectral resolution ground-based Keck/NIRSPEC (Rigby et al., 2011) and Magellan/FIRE (Wuyts et al., 2014) ground-based measurements, this trend is no longer statistically significant. In this galaxy, the extinction does not appear to have significant variations amongst the different star-forming regions, and a global measurement should therefore adequately describe the properties of RCS0327.
Combining the [OIII]5007/H line ratio measurements from the WFC3 grism spectroscopy with [NII]/H line ratios from Wuyts et al. (2014), we find that the majority of the star-forming regions in RCS0327 fall along the local abundance sequence in the BPT diagram, albeit extended into the low-metallicity regime that is not well populated in the local Universe. Consistent with our understanding of the star formation history, we expect the measured metallicities (as implied by the [NII]/H line ratios presented in Figure 5) for these star-forming knots to be the same as their suspected gas reservoir source, knot g. We observe a higher [NII]/H line ratio in knot e alone, falling along the extreme abundance sequence for predicted by Kewley et al. (2013). We attribute this discrepency to the combination of a higher electron density (Wuyts et al., 2014) and shock excitation. As no discrepancy exists for the metallicity indicators (Wuyts et al., 2014), there is no strong evidence to suggest that this clump should have a different metallicity. Rich et al. (2013) demonstrate that at the mid-to-end stages of a merger, low velocity shocks have the largest contribution (40–60%) to the observed H line flux. For four clumps in RCS0327, Wuyts et al. (2014) find that the broad underlying component in the H emission line profile contributes about 40% of the total H flux, on average. Placing the Rich et al. (2013) result in the context of the BPT diagram, it is perhaps not surprising that knot e is offset, but rather that the rest of the star-forming regions appear to have “normal” emission-line ratios with little contamination from shocks.
The star formation in RCS0327 is enhanced as a result of the ongoing interaction, with measured SFRs derived from extinction-corrected H line fluxes for seven individually-resolved star forming clumps falling 1–2 dex above the observed star formation sequence. These observations confirm previous theoretical and empirical results that galaxy mergers have enhanced SFRs relative to the “normal” star formation sequence.
Merger simulations find that an AGN does not turn on until the final stages of a merger (e.g., Di Matteo et al., 2005; Springel et al., 2005; Hopkins et al., 2006), after the black holes have coalesced. These findings are generally supported by observations (e.g., Teng & Veilleux, 2010). The stellar population is predicted to be detected as an aging starburst with an age of several 100 Myr by the time the AGN becomes visible in the optical. As RCS0327 is likely in the mid-to-end stages of a merger with two separated mass concentrations, knot g and an older stellar population (see reconstructed image in Figure 1), we do not expect to find an AGN. There is no strong evidence for an actively accreting supermassive black hole in RCS0327: the emission line ratios for all star-forming regions are consistent with the H II-origin parameter space of the BPT diagram, no point source was seen in Chandra imaging for the three star-forming regions closest to the likely nucleus, and we do not observe variability between two epochs of HST images taken over a three month timescale.
In this emerging picture, we expect the formation age of these star-forming knots to correspond to their physical distance from knot g, the suspected source of the gas reservoir. Although measuring the absolute age of the stellar populations is beyond this data set, the established stellar population in knot g and the nearby knot u, as well as the furthest (probably most recently formed) knots b, c and d have the high He I /H recombination line ratios, consistent with the saturated value. Such high helium-to-hydrogen ratios imply that these star-forming regions are dominated by hot O-stars. Knot u is physically close to knot g and may therefore still be accreting gas to fuel ongoing star-formation. As suggested by the lower He I/H line ratio measurements (and the low He II/H line ratio in knot e), the most massive stars have already died in knots f and e. Together with theoretical models, the He I/H and He II/H line ratio measurements imply that knot e had to stop actively forming stars about 5–6 Myr ago, presumably due to the depletion of the gas reservoirs and stellar feedback. Thus, we may be probing the decline of star formation in a distant galaxy on pc scales, enabled by gravitational lensing and the high spatial resolution of HST.
There is a wealth of information to be learned through such exceptional lensed galaxies as RCS0327. Through future HST/WFC3 imaging and spectroscopic studies of distant lensed galaxies, we can map the spatial variations of the extinction and star formation for larger samples to thereby better understand how distant galaxies formed their stars.
References
- Abazajian et al. (2009) Abazajian, K. N., Adelman-McCarthy, J. K., Agüeros, M. A., et al. 2009, ApJS, 182, 543
- Aird et al. (2010) Aird, J., Nandra, K., Laird, E. S., et al. 2010, MNRAS, 401, 2531
- Baldwin et al. (1981) Baldwin, J. A., Phillips, M. M., & Terlevich, R. 1981, PASP, 93, 5
- Bauer et al. (2013) Bauer, A. E., Hopkins, A. M., Gunawardhana, M., et al. 2013, MNRAS, 434, 209
- Bashkin & Stoner (1975) Bashkin, S., & Stoner, J. O. 1975, Atomic energy levels and Grotrian Diagrams - Vol.1: Hydrogen I - Phosphorus XV; Vol.2: Sulfur I - Titanium XXII
- Bauman et al. (2005) Bauman, R. P., Porter, R. L., Ferland, G. J., et al. 2005, ApJ, 628, 541
- Bell & de Jong (2000) Bell, E. F., & de Jong, R. S. 2000, MNRAS, 312, 497
- Bell et al. (2012) Bell, E. F., van der Wel, A., Papovich, C., et al. 2012, ApJ, 753, 167
- Bournaud et al. (2011) Bournaud, F., Chapon, D., Teyssier, R., et al. 2011, ApJ, 730, 4
- Brammer et al. (2012a) Brammer, G. B., Sánchez-Janssen, R., Labbé, I., et al. 2012a, ApJ, 758, L17
- Brammer et al. (2012b) Brammer, G. B., van Dokkum, P. G., Franx, M., et al. 2012b, ApJS, 200, 13
- Brinchmann et al. (2004) Brinchmann, J., Charlot, S., White, S. D. M., et al. 2004, MNRAS, 351, 1151
- Calzetti et al. (2000) Calzetti, D., Armus, L., Bohlin, R. C., et al. 2000, ApJ, 533, 682
- Cassata et al. (2013) Cassata, P., Giavalisco, M., Williams, C. C., et al. 2013, ApJ, 775, 106
- Chabrier (2003) Chabrier, G. 2003, PASP, 115, 763
- Cullen et al. (2013) Cullen, F., Cirasuolo, M., McLure, R. J., et al. 2013, ArXiv e-prints
- Daddi et al. (2007) Daddi, E., Dickinson, M., Morrison, G., et al. 2007, ApJ, 670, 156
- Davé et al. (2012) Davé, R., Finlator, K., & Oppenheimer, B. D. 2012, MNRAS, 421, 98
- Di Matteo et al. (2005) Di Matteo, T., Springel, V., & Hernquist, L. 2005, Nature, 433, 604
- Domínguez et al. (2013) Domínguez, A., Siana, B., Henry, A. L., et al. 2013, ApJ, 763, 145
- Dopita & Evans (1986) Dopita, M. A., & Evans, I. N. 1986, ApJ, 307, 431
- Dutton et al. (2010) Dutton, A. A., van den Bosch, F. C., & Dekel, A. 2010, MNRAS, 405, 1690
- Elbaz et al. (2007) Elbaz, D., Daddi, E., Le Borgne, D., et al. 2007, A&A, 468, 33
- Erb et al. (2006) Erb, D. K., Steidel, C. C., Shapley, A. E., et al. 2006, ApJ, 647, 128
- Ferland et al. (2013) Ferland, G. J., Porter, R. L., van Hoof, P. A. M., et al. 2013, RMxAA, 49, 137
- Ferreras et al. (2005) Ferreras, I., Lisker, T., Carollo, C. M., et al. 2005, ApJ, 635, 243
- Foreman-Mackey et al. (2013) Foreman-Mackey, D., Hogg, D. W., Lang, D., et al. 2013, PASP, 125, 306
- Förster Schreiber et al. (2009) Förster Schreiber, N. M., Genzel, R., Bouché, N., et al. 2009, ApJ, 706, 1364
- Förster Schreiber et al. (2001) Förster Schreiber, N. M., Genzel, R., Lutz, D., et al. 2001, ApJ, 552, 544
- Garn et al. (2010) Garn, T., Sobral, D., Best, P. N., et al. 2010, MNRAS, 402, 2017
- Gies et al. (2002) Gies, D. R., Penny, L. R., Mayer, P., et al. 2002, ApJ, 574, 957
- González et al. (2010) González, V., Labbé, I., Bouwens, R. J., et al. 2010, ApJ, 713, 115
- Groves et al. (2012) Groves, B., Brinchmann, J., & Walcher, C. J. 2012, MNRAS, 419, 1402
- Guo et al. (2013) Guo, K., Zheng, X. Z., & Fu, H. 2013, ApJ, 778, 23
- Hainline et al. (2009) Hainline, K. N., Shapley, A. E., Kornei, K. A., et al. 2009, ApJ, 701, 52
- Hopkins & Beacom (2006) Hopkins, A. M., & Beacom, J. F. 2006, ApJ, 651, 142
- Hopkins et al. (2006) Hopkins, P. F., Hernquist, L., Cox, T. J., et al. 2006, ApJS, 163, 1
- Hopkins et al. (2008) —. 2008, ApJS, 175, 356
- Jogee et al. (2009) Jogee, S., Miller, S. H., Penner, K., et al. 2009, ApJ, 697, 1971
- Jones et al. (2010) Jones, T. A., Swinbank, A. M., Ellis, R. S., et al. 2010, MNRAS, 404, 1247
- Karczewski et al. (2013) Karczewski, O. Ł., Barlow, M. J., Page, M. J., et al. 2013, MNRAS, 431, 2493
- Kashino et al. (2013) Kashino, D., Silverman, J. D., Rodighiero, G., et al. 2013, ApJ, 777, L8
- Kauffmann et al. (2003) Kauffmann, G., Heckman, T. M., Tremonti, C., et al. 2003, MNRAS, 346, 1055
- Kennicutt (1998) Kennicutt, Jr., R. C. 1998, ARA&A, 36, 189
- Kennicutt et al. (2000) Kennicutt, Jr., R. C., Bresolin, F., French, H., et al. 2000, ApJ, 537, 589
- Kewley et al. (2013) Kewley, L. J., Dopita, M. A., Leitherer, C., et al. 2013, ArXiv e-prints
- Kewley et al. (2001) Kewley, L. J., Dopita, M. A., Sutherland, R. S., et al. 2001, ApJ, 556, 121
- Kobulnicky & Kewley (2004) Kobulnicky, H. A., & Kewley, L. J. 2004, ApJ, 617, 240
- Kriek & Conroy (2013) Kriek, M., & Conroy, C. 2013, ApJ, 775, L16
- Kroupa (2001) Kroupa, P. 2001, MNRAS, 322, 231
- Leitherer et al. (2010) Leitherer, C., Ortiz Otálvaro, P. A., Bresolin, F., et al. 2010, ApJS, 189, 309
- Leitherer et al. (1999) Leitherer, C., Schaerer, D., Goldader, J. D., et al. 1999, ApJS, 123, 3
- Leitner (2012) Leitner, S. N. 2012, ApJ, 745, 149
- Lotz et al. (2008) Lotz, J. M., Jonsson, P., Cox, T. J., et al. 2008, MNRAS, 391, 1137
- MacArthur et al. (2004) MacArthur, L. A., Courteau, S., Bell, E., et al. 2004, ApJS, 152, 175
- Magdis et al. (2012) Magdis, G. E., Daddi, E., Béthermin, M., et al. 2012, ApJ, 760, 6
- Magdis et al. (2010) Magdis, G. E., Rigopoulou, D., Huang, J.-S., et al. 2010, MNRAS, 401, 1521
- Mancini et al. (2011) Mancini, C., Förster Schreiber, N. M., Renzini, A., et al. 2011, ApJ, 743, 86
- Marchesini et al. (2009) Marchesini, D., van Dokkum, P. G., Förster Schreiber, N. M., et al. 2009, ApJ, 701, 1765
- Martin & Kennicutt (1997) Martin, C. L., & Kennicutt, Jr., R. C. 1997, ApJ, 483, 698
- Mihos & Hernquist (1994) Mihos, J. C., & Hernquist, L. 1994, ApJ, 431, L9
- Newman et al. (2014) Newman, S. F., Buschkamp, P., Genzel, R., et al. 2014, ApJ, 781, 21
- Niemela & Bassino (1994) Niemela, V. S., & Bassino, L. P. 1994, ApJ, 437, 332
- Noeske et al. (2007) Noeske, K. G., Weiner, B. J., Faber, S. M., et al. 2007, ApJ, 660, L43
- Oey et al. (2000) Oey, M. S., Dopita, M. A., Shields, J. C., et al. 2000, ApJS, 128, 511
- Osterbrock & Ferland (2006) Osterbrock, D. E., & Ferland, G. J. 2006, Astrophysics of gaseous nebulae and active galactic nuclei
- Pannella et al. (2009) Pannella, M., Carilli, C. L., Daddi, E., et al. 2009, ApJ, 698, L116
- Patel et al. (2011) Patel, S. G., Kelson, D. D., Holden, B. P., et al. 2011, ApJ, 735, 53
- Peng et al. (2010) Peng, Y.-j., Lilly, S. J., Kovač, K., et al. 2010, ApJ, 721, 193
- Porter et al. (2005) Porter, R. L., Bauman, R. P., Ferland, G. J., et al. 2005, ApJ, 622, L73
- Porter et al. (2007) Porter, R. L., Ferland, G. J., & MacAdam, K. B. 2007, ApJ, 657, 327
- Porter et al. (2009) Porter, R. L., Ferland, G. J., MacAdam, K. B., et al. 2009, MNRAS, 393, L36
- Price et al. (2013) Price, S. H., Kriek, M., Brammer, G. B., et al. 2013, ArXiv e-prints
- Reddy et al. (2010) Reddy, N. A., Erb, D. K., Pettini, M., et al. 2010, ApJ, 712, 1070
- Rich et al. (2010) Rich, J. A., Dopita, M. A., Kewley, L. J., et al. 2010, ApJ, 721, 505
- Rich et al. (2013) Rich, J. A., Kewley, L. J., & Dopita, M. A. 2013, ArXiv e-prints
- Rich et al. (2012) Rich, J. A., Torrey, P., Kewley, L. J., et al. 2012, ApJ, 753, 5
- Richard et al. (2011) Richard, J., Jones, T., Ellis, R., et al. 2011, MNRAS, 413, 643
- Rigby & Rieke (2004) Rigby, J. R., & Rieke, G. H. 2004, ApJ, 606, 237
- Rigby et al. (2011) Rigby, J. R., Wuyts, E., Gladders, M. D., et al. 2011, ApJ, 732, 59
- Rodighiero et al. (2011) Rodighiero, G., Daddi, E., Baronchelli, I., et al. 2011, ApJ, 739, L40
- Salpeter (1955) Salpeter, E. E. 1955, ApJ, 121, 161
- Sanchez-Blazquez et al. (2013) Sanchez-Blazquez, P., Rosales-Ortega, F., Diaz, A., et al. 2013, ArXiv e-prints
- Sharon et al. (2012) Sharon, K., Gladders, M. D., Rigby, J. R., et al. 2012, ApJ, 746, 161
- Speagle et al. (2014) Speagle, J. S., Steinhardt, C. L., Capak, P. L., et al. 2014, ArXiv e-prints
- Springel et al. (2005) Springel, V., Di Matteo, T., & Hernquist, L. 2005, MNRAS, 361, 776
- Stark et al. (2013) Stark, D. P., Auger, M., Belokurov, V., et al. 2013, MNRAS, 436, 1040
- Stecher (1965) Stecher, T. P. 1965, ApJ, 142, 1683
- Szomoru et al. (2013) Szomoru, D., Franx, M., van Dokkum, P. G., et al. 2013, ApJ, 763, 73
- Takata et al. (2006) Takata, T., Sekiguchi, K., Smail, I., et al. 2006, ApJ, 651, 713
- Teng & Veilleux (2010) Teng, S. H., & Veilleux, S. 2010, ApJ, 725, 1848
- Teplitz et al. (2000) Teplitz, H. I., McLean, I. S., Becklin, E. E., et al. 2000, ApJ, 533, L65
- Tomczak et al. (2013) Tomczak, A. R., Quadri, R. F., Tran, K.-V. H., et al. 2013, ArXiv e-prints
- van Dokkum (2005) van Dokkum, P. G. 2005, AJ, 130, 2647
- Vanzi et al. (1996) Vanzi, L., Rieke, G. H., Martin, C. L., et al. 1996, ApJ, 466, 150
- Vázquez & Leitherer (2005) Vázquez, G. A., & Leitherer, C. 2005, ApJ, 621, 695
- Veilleux & Osterbrock (1987) Veilleux, S., & Osterbrock, D. E. 1987, ApJS, 63, 295
- Weingartner & Draine (2001) Weingartner, J. C., & Draine, B. T. 2001, ApJ, 548, 296
- Weisz et al. (2011) Weisz, D. R., Dalcanton, J. J., Williams, B. F., et al. 2011, ApJ, 739, 5
- Whitaker et al. (2011) Whitaker, K. E., Labbé, I., van Dokkum, P. G., et al. 2011, ApJ, 735, 86
- Whitaker et al. (2012) Whitaker, K. E., van Dokkum, P. G., Brammer, G., et al. 2012, ApJ, 754, L29
- Wuyts et al. (2010) Wuyts, E., Barrientos, L. F., Gladders, M. D., et al. 2009, ApJ, 724, 1182
- Wuyts et al. (2014) Wuyts, E., Rigby, J. R., Gladders, M. D., et al. 2014, ApJ, 781, 61
- Wuyts et al. (2013) Wuyts, S., Förster Schreiber, N. M., Nelson, E. J., et al. 2013, ApJ, 779, 135
- Wuyts et al. (2011) Wuyts, S., Förster Schreiber, N. M., van der Wel, A., et al. 2011, ApJ, 742, 96
- Yabe et al. (2014) Yabe, K., Ohta, K., Iwamuro, F., et al. 2014, MNRAS, 437, 3647
- Yabe et al. (2012) —. 2012, PASJ, 64, 60
- Yeh & Matzner (2012) Yeh, S. C. C., & Matzner, C. D. 2012, ApJ, 757, 108
- Yoshikawa et al. (2010) Yoshikawa, T., Akiyama, M., Kajisawa, M., et al. 2010, ApJ, 718, 112
- Yuan et al. (2012) Yuan, T.-T., Kewley, L. J., Swinbank, A. M., et al. 2012, ApJ, 759, 66
- Yuan et al. (2011) —. 2011, ApJ, 732, L14
- Zahid et al. (2013a) Zahid, H. J., Kashino, D., Silverman, J. D., et al. 2013a, ArXiv e-prints
- Zahid et al. (2013b) Zahid, H. J., Yates, R. M., Kewley, L. J., et al. 2013b, ApJ, 763, 92
- Zaritsky et al. (1994) Zaritsky, D., Kennicutt, Jr., R. C., & Huchra, J. P. 1994, ApJ, 420, 87