SISSA 23/2014/FISI
RM3-TH/14-7
The Daya Bay and T2K results on and Non-Standard Neutrino Interactions
I. Girardi, D. Meloni and S. T. Petcov 111Also at: Institute of Nuclear Research and Nuclear Energy, Bulgarian Academy of Sciences, 1784 Sofia, Bulgaria.
SISSA/INFN, Via Bonomea 265, 34136
Trieste, Italy.
Dipartimento di Matematica e Fisica, Università di Roma Tre,
Via della Vasca Navale 84, I-00146 Rome.
Kavli IPMU (WPI), The University
of Tokyo, Kashiwa,
Japan.
Abstract
We show that the relatively large best fit value of measured in the T2K experiment for fixed values of i) the Dirac CP violation phase , and ii) the atmospheric neutrino mixing parameters , , can be reconciled with the Daya Bay result if the effects of non-standard neutrino interactions (NSI) in the relevant and oscillation probabilities are taken into account.
1 Introduction
Recently the T2K collaboration reported a measurement of the reactor neutrino mixing angle based on their latest oscillation data [1]. Fixing the values of i) the Dirac CP violation (CPV) phase , ii) the atmospheric neutrino mixing angle , iii) , iv) and v) , the T2K collaboration found:
| (1) |
where the value (the value in brackets) corresponds to neutrino mass spectrum with normal (inverted, IO) ordering (NO). The best fit value of reported by the T2K collaboration is significantly larger than that measured in the reactor neutrino experiments Daya Bay, RENO and Double Chooz [2, 3, 4]. The most precise determination of was reported by the Daya Bay collaboration [2]:
| (2) |
Given the uncertainty in the T2K result, Eq. (1), the
difference between the values of obtained
in the T2K and Daya Bay experiments does not seem to be irreconcilable
and the most natural explanation of this difference can be attributed
to setting and .
Indeed, the global analyses of the neutrino oscillation data,
including the data from T2K and Daya Bay,
performed in [5, 6] found
a hint for non-zero value of and for a deviation of
from :
for the best fit values of and
the authors of [5] obtained
and .
Similar results were obtained in [6].
On-going and future neutrino experiments [1, 7, 8] have the physics potential to improve the
data on the leptonic CP violation phase and thus to test the indications
for found in the global analyses [5, 6].
In this letter we would like to entertain a different possibility, namely, that the difference between the values of found in the T2K experiment for , , etc., and in the Daya Bay experiment is due to the presence of new physics in the neutrino sector. More specifically, we consider the effects of non-standard neutrino interactions (NSI) [9, 10] on the and oscillation probabilities and show how the values obtained in the two experiments can be reconciled.
2 Basic formalism
In what follows we consider the analytic treatment of Non Standard Interactions (NSI) as described in [11], where it was assumed that NSI can affect both neutrino production and detection processes. Matter effects can be safely neglected in the and oscillation probabilities, relevant for the interpretation of the Daya Bay and T2K data of interest.
Effects of NSI can appear at low energy through unknown couplings , generated after integrating out heavy degrees of freedom. These new couplings can affect neutrino production and detection [10], so the neutrino states are a superposition of the orthonormal flavor eigenstates , and [12, 13, 14]:
| (3) | |||||
| (4) |
The oscillation probability can be obtained by squaring the amplitude :
Since the parameters and receive contributions from the same higher dimensional operators, one can constrain them by the relation:
| (5) |
and being the modulus and the argument of . For there exist model independent bounds derived in [15], which at 90% C.L. read:
| (6) |
whereas for the CP violation phases no constraints have been obtained so far. These bounds can be further improved, e.g., by future reactor neutrino experiments [12] and at neutrino factories [16], especially the bounds on non-diagonal couplings which are expected to be constrained at the level of . Recently it was shown in Ref. [17] that the bound on can be improved by almost an order of magnitude by the most recent data of the Daya Bay experiment [2], i.e. at 90% confidence level.
In the case of the Daya Bay setup, the relevant features of the
survival probability at the far and near detectors can be already caught
keeping terms up to in the expansion in the small
couplings and neglecting terms of and of
.
On the other hand, for the T2K setup,
the correct dependence on the Dirac phase is reproduced keeping
the first order terms in , as discussed in [11].
In the limiting case (which is a
good approximation since
[17]),
the survival probability
can be written for as:
| (7) |
where [18]
| (8) |
The terms involving the parameters and can affect significantly the determination of the reactor angle , as pointed out in [17, 18]. Depending on the phases and , relatively large values of and can lead to smaller (for ), equal (for and ) or larger (for ) values of than those obtained in the standard case of absence of NSI.
The oscillation probability relevant for the interpretation of the T2K data on , can be written for , and taking into account the NSI as:
| (9) |
where and include respectively the zero and
the first order contributions of the NSI,
derived for
.
Indeed, for the neutrino energy
of GeV we have:
for
km, and for km.
Using the constraints given in Eq. (5) and defining
, we get:
| (10) |
| (11) |
In the previous equations, the term encodes the correlations between and the new physics parameters so, as in the Daya Bay case, we expect a significant impact of degeneracies on the determination of the reactor angle. The term is subleading, whose magnitude is controlled by .
3 Fit results
As we can see from the previous formulae, the parameter space for NSI relevant for our analysis consists of six parameters, the moduli , , and the phases , , . However, for the illustrative purposes of the present study it is sufficient to consider a smaller parameter space with just two independent NSI parameters, specified below. We consider two different scenarios: one in which a large () for NO (IO) can be reconciled with both the Daya Bay and T2K data and a second where we assume that .
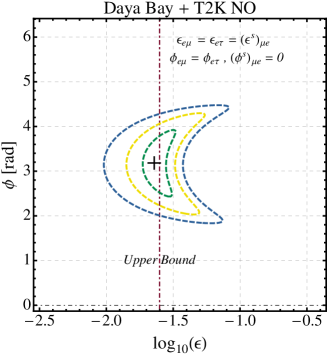
3.1 The case of
In this case we reduced the parameter space assuming:
| (12) |
The choice of the parameter space is not completely arbitrary. For the large case we need relatively large NSI effects to obtain an effective reactor angle satisfying the Daya Bay measurement.
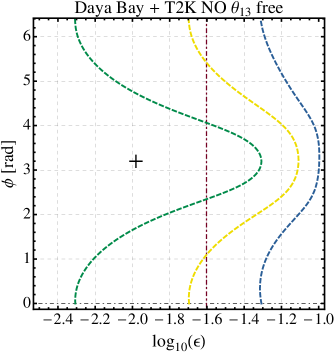
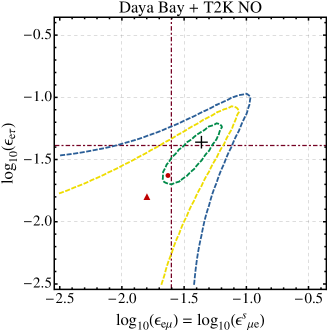
In Fig. 1 we show the best fit points and the
1, 2 and 3 confidence level regions for 1 degree of freedom (dof)
after performing a combined fit to the Daya Bay [2] and T2K [1] data
(see the Appendix A for a detailed description of the fitting procedure).
In the left panel of Fig. 1
we fixed ,
, ,
,
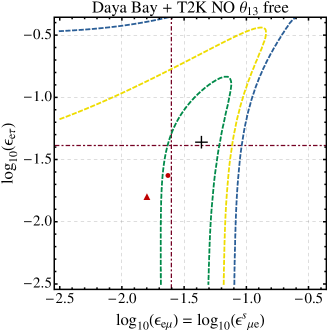
and , whereas in the right panel we allowed
to vary freely, using the mean value and the 1 error as determined in the T2K
experiment, .
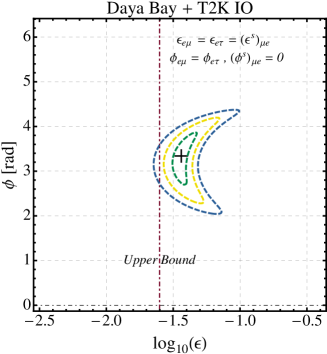
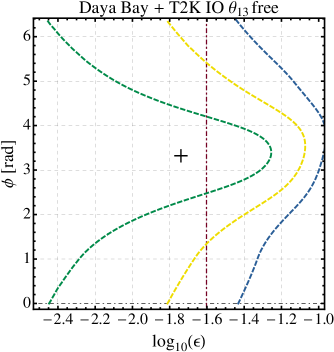
Results in the case of inverted hierarchy are shown in Fig. 2;
the procedure adopted is the same as the one
used to obtain Fig. 1, the only difference being that
the fixed value of the reactor angle is now at
and that, when is left free to vary,
we used .
As it can be seen, in the left panels of Figs. 1 and 2,
the same value of can give a good description of both
Daya Bay and T2K data under the hypothesis of relatively large
and for a phase which is almost CP conserving.
Since we are adopting the preferred T2K value of , it is necessary to allow for relatively
large NSI couplings to reconcile ()
with the Daya Bay event distribution.
On the other hand, our choice of couplings, Eq. (12), does not
lead to a significant change of the fit to the
T2K data.
In the case we vary freely (see Appendix A for details)
the sensitivity to is significantly reduced (with the smallest statistical sensitivity
at ), due to the strong correlation between
and the NSI parameters [17].
That means that there exist a vast parameter space for NSI for
which the data can be fitted simultaneously at the price of changing accordingly the value of . To give an example,
at the best fit point we get: () for the NO (IO) spectrum.
The values of at the NO(IO) best fit point are given in Table 1.
| best fit | left panel | right panel |
|---|---|---|
| NO | ||
| IO |
We notice that
the confidence level regions are slightly shifted to the left (right)
if instead of the assumption in Eq. (12)
we impose: ,
and
(,
and ).
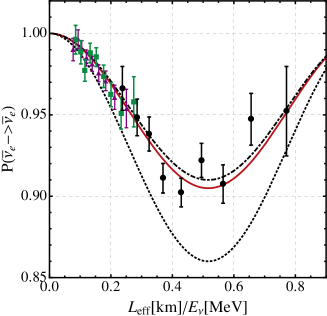
To demonstrate that for the obtained values of the NSI parameters
one can
describe both the Daya Bay and T2K
results, including the spectra,
in the Left Panel of Fig. 3 we show the oscillation probability as
a function of [2] for the NSI model (solid red line) for NO spectrum
and in the absence of NSI (”standard result” (SR)) (dotted black line); the mixing parameters are fixed as follows:
,
, ,
,
and ,
,
and .
The triangular, square and circular data points refer to the
EH1, EH2 (near detectors) and EH3 (far detector) Daya Bay locations and have been taken from [2].
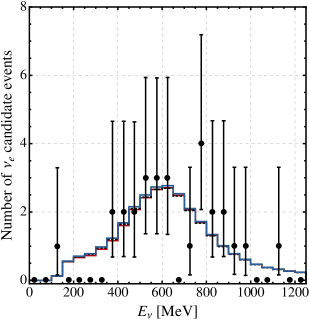
The Right Panel of Fig. 3 has been obtained using the same
values for the standard oscillation and NSI parameters and shows the
number of candidate events in the appearance channel of the T2K experiment.
The SR result with is shown with the dot-dashed line in the
left panel and the T2K best fit curve is represented with the blue line in the right panel.
As it is clear from these figures, the Daya Bay and the T2K spectral data are well reproduced.
3.2 The case of
In the case of small we reduced the parameter space assuming:
| (13) |
In the case of small
the choice in Eq. (13) is dictated by the need of
minimizing the NSI effects in the survival probability, so that the results of the Daya Bay fit remain unaffected.
In the Left Panel of Fig. 4 we show the best fit points and the
1, 2 and 3 confidence level regions for 1 dof
after performing a combined fit to the Daya Bay and to the
T2K data for NO fixing ,
, ,
,
and .
In the Right Panel of Fig. 4 we allowed
to vary freely.
We do not show the results for the IO spectrum,
because, under the assumptions made for the parameter space, Eq. 13,
they are the same as in the NO case.
In contrast to the large case,
in order to reconcile the Daya Bay and the T2K
spectral data
requires that the phase and are
related through . This ensures
that sizeable NSI effects do not spoil the Daya Bay measurement
of the reactor angle when :
in fact, is reduced essentially to the standard expression and no
significant effect has to be expected from the NSI parameters
at leading order.
On the other hand, it is clear that relatively large values of are needed to fit the T2K data.
We give in Table 2 the best fit points we obtained in our analysis for Fig. 4. Notice that they are close to the current upper limits, reported with dot-dashed lines.
| best fit | left panel | right panel |
|---|---|---|
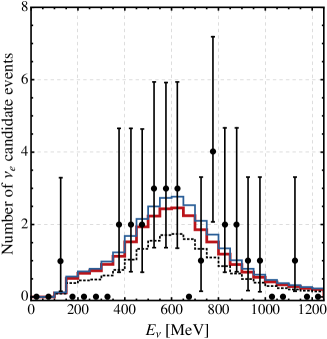
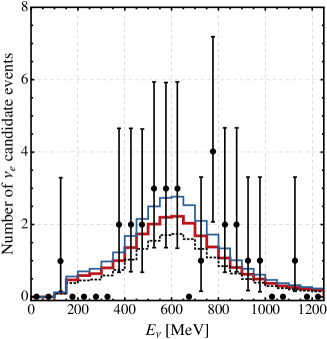
Finally, in Fig. 5 we show
the number of candidate events in the appearance channel of the T2K experiment
(with mixing parameters fixed at the values discussed below Eq. 13).
Since the best fit points are outside the current 90% C.L. bounds
on the NSI parameters, we show the spectra for two points within
the NSI bounds: one point is located in the 1 region, while
the second is located in the 2 region (see Fig. 4).
In the Left Panel of Fig. 5 we fixed
,
in the Right Panel .
The T2K best fit curve is represented with the blue line.
As it is clear from these figures, the T2K spectral data are well reproduced.
4 Conclusions
In the present paper we have analyzed the most recent data
of the Daya Bay [2] and the T2K [1] experiments with the aim to
study the possibility that NSI effects
can reconcile the different values of the reactor angle
reported by the two experiments. We recall that the best fit values of
found in the experiments, [2]
and (0.170) [1],
differ by a factor 1.6 (1.9) in the case of NO (IO) neutrino mass spectrum.
The T2K result was obtained under the assumptions: i) the Dirac CP violation phase ,
ii) the atmospheric neutrino mixing angle ,
iii) , iv)
and v) .
Given the uncertainty in the T2K result, the
difference between the values of obtained
in the T2K and Daya Bay experiments does not seem to be irreconcilable and
the most natural explanation can be attributed to setting and
.
In this Letter we have entertained a different possibility,
namely, that the difference between the values of
found in the T2K experiment for
and in the Daya Bay experiment are due to the
presence of new physics in the neutrino sector in the form
of non-standard neutrino interactions (NSI).
There are altogether six NSI parameters which can affect the
and oscillation probabilities,
relevant for the interpretation of the Daya Bay and T2K data on :
three complex, in general, NSI effective couplings, whose absolute values and phases are
, , and , , .
We have considered two extreme cases: one where the true value of is
for NO ( for IO),
and the other where the true value is .
With the aim of finding a minimal model with few new degrees of freedom
for each of the two cases, we have simplified the NSI parameter spaces,
assuming
for the large case and
for the small one.
All other mixing parameters are fixed to ,
, ,
, .
We have found that, contrary to the interpretation that is disfavoured in the
standard case, following from the global analysis of the neutrino oscillation
data [5, 6],
it is possible
to find a good agreement with both the hypothesis of large, (0.17), and
small, ,
for , in well defined regions of the NSI parameter space.
In a more general situation in which the NSI can affect the neutrino flux in
the near detector and without the restrictions we considered on the parameter space,
it will be possible to reconcile the Daya Bay and T2K data in a bigger
region of the NSI parameter space within the current upper bounds.
Given the relatively low statistics of the T2K
oscillation data, our results on the possible NSI effects should be considered
as very preliminary.
Future experiments searching the CP violation and/or NSI effects
in neutrino oscillations will certainly provide a critical test of the
possible NSI effects discussed in the present article.
Acknowledgments
We acknowledge MIUR (Italy) for financial support under the program Futuro in Ricerca 2010 (RBFR10O36O). This work was supported in part by the INFN program on “Astroparticle Physics” and by the European Union FP7-ITN INVISIBLES (Marie Curie Action PITAN-GA-2011-289442-INVISIBLES) (I.G. and S.T.P.).
Appendix A The Daya Bay and the T2K experiments
The Daya Bay experimental setup we take into account [19] consists of six antineutrino detectors (ADs) and six reactors; detailed information on the antineutrino spectra emitted by the nuclear reactors and arriving to the detectors can be found in [20, 21, 22]. For our analysis we used the data set accumulated during 217 days reported in [2], where the detected antineutrino candidates are collected in the far hall, EH3 (far detector), and in the near halls EH1, EH2 (near detectors).
The antineutrino energy is reconstructed by the prompt energy deposited by the positron using the approximated relation [19]: . We adopt a Gaussian energy resolution function of the form:
| (14) |
with that, for Daya Bay, are MeV. The antineutrino cross section for the inverse beta decay (IBD) process has been taken from [23]. The statistical analysis of the data has been performed using the GLoBES software [24] with the function defined as [19]:
| (15) |
where is a vector containing the new physics parameters, are the measured IBD events of the d-th detector ADs in the i-th bin, the corresponding background and are the theoretical prediction for the rates. The parameter is the fraction of IBD contribution of the r-th reactor to the d-th detector AD, determined by the approximated relation , where is the distance between the d-th detector and the r-th reactor. The parameter is the uncorrelated detection uncertainty (%) and is the background uncertainty of the d-th detector obtained using the information given in [2]: , , and % are the uncorrelated reactor uncertainties. The corresponding pull parameters are (). With this choice of nuisance parameters we are able to reproduce the 1, 2 and 3 confidence level results presented in Fig. 3 of Ref. [2] with high accuracy. The differences are at the level of few percent (see Tab. I and Tab. II of Ref. [17]).
The T2K experiment [1] consists of two separate detectors, both of which are 2.5 degrees off axis of the neutrino beam. The far detector is located at km from the source, the ND280 near detector is metres from the target.
In our analysis we used the public data in [1, 25]. The neutrino flux has been estimated following [26]. We fixed the fiducial mass of the near and the far detector respectively as Kg and Kton [27]; a bin to bin normalization has been fixed in order to reproduce the T2K best fit events. For the energy resolution function we adopt the same Gaussian form of Eq. (14) with GeV.
The is defined as:
| (16) |
In the previous formula, is a vector containing the new physics parameters, are the measured events, including the backgrounds (extracted from Fig. 4 of [1]), of the d-th detector in the i-th bin, are the theoretical predictions for the rates, and are respectively the mixing angles and the squared mass differences contained in the oscillation probability, is the number of bins for the d-th detector. The parameter contains the flux, the uncorrelated interaction and the final-state interactions uncertainties ( Tab. II of [1]), the fiducial mass uncertainty for the d-th detector ( has been estimated to be for the far and the near detectors similarly to [28]), are free parameters which represent the energy scale for predicted signal events with uncertainty , ( [29]).
The corresponding pull parameters are (). The measured event rates at the near detector have been estimated rescaling the non oscillated measured event rates at the far detector using the scale factor . Our definition of the allows to reproduce with high accuracy the 68% and 90% confidence level regions for as a function of the CP violation phase shown in Fig. 5 of Ref. [1].
We analysed the whole Daya Bay and T2K data sample using . We considered two different statistical analysis: i) we fixed all the standard oscillation parameters, ii) we fixed all the standard oscillation parameters except on which we imposed a gaussian prior defined through the mean value and the 1 error , and , for the different cases we have analyzed.
References
- [1] K. Abe et al. [T2K Collaboration], Phys. Rev. Lett. 112 (2014) 061802 [arXiv:1311.4750 [hep-ex]].
- [2] F. P. An et al. [Daya Bay Collaboration], Phys. Rev. Lett. 112 (2014) 061801 [arXiv:1310.6732 [hep-ex]].
- [3] J. K. Ahn et al. [RENO Collaboration], Phys. Rev. Lett. 108 (2012) 191802 [arXiv:1204.0626 [hep-ex]].
- [4] Y. Abe et al. [Double Chooz Collaboration], Phys. Rev. D 86 (2012) 052008 [arXiv:1207.6632 [hep-ex]].
- [5] F. Capozzi, G. L. Fogli, E. Lisi, A. Marrone, D. Montanino and A. Palazzo, arXiv:1312.2878 [hep-ph].
- [6] M. C. Gonzalez-Garcia, M. Maltoni, J. Salvado and T. Schwetz, JHEP 1212 (2012) 123 [arXiv:1209.3023 [hep-ph]].
- [7] D. S. Ayres et al. [NOvA Collaboration], hep-ex/0503053.
- [8] M. Bass et al. [LBNE Collaboration], arXiv:1311.0212 [hep-ex].
- [9] L. Wolfenstein, Phys. Rev. D 17 (1978) 2369; M. M. Guzzo, A. Masiero and S. T. Petcov, Phys. Lett. B 260 (1991) 154; E. Roulet, Phys. Rev. D 44 (1991) 935.
- [10] Y. Grossman, Phys. Lett. B 359, 141 (1995) [hep-ph/9507344].
- [11] J. Kopp, M. Lindner, T. Ota and J. Sato, Phys. Rev. D 77, (2008) 013007 [arXiv:0708.0152 [hep-ph]].
- [12] A. N. Khan, D. W. McKay and F. Tahir, Phys. Rev. D 88 (2013) 113006 [arXiv:1305.4350 [hep-ph]]; T. Ohlsson, H. Zhang and S. Zhou, Phys. Lett. B 728 (2014) 148 [arXiv:1310.5917 [hep-ph]].
- [13] T. Ohlsson, Rept. Prog. Phys. 76 (2013) 044201 [arXiv:1209.2710 [hep-ph]].
- [14] D. Meloni, T. Ohlsson, W. Winter and H. Zhang, JHEP 1004 (2010) 041 [arXiv:0912.2735 [hep-ph]].
- [15] C. Biggio, M Blennow and E. Fernandez-Martinez JHEP 0908, (2009) 090 [arXiv:0907.0097 [hep-ph]].
- [16] P. Coloma, A. Donini, J. Lopez-Pavon and H. Minakata, JHEP 1108, 036 (2011) [arXiv:1105.5936 [hep-ph]].
- [17] I. Girardi and D. Meloni, arXiv:1403.5507 [hep-ph].
- [18] T. Ohlsson and H. Zhang, Phys. Lett. B 671 (2009) 99 [arXiv:0809.4835 [hep-ph]].
- [19] F. P. An et al. [Daya Bay Collaboration], Chin. Phys. C 37 (2013) 011001 [arXiv:1210.6327 [hep-ex]].
- [20] T. A. Mueller, D. Lhuillier, M. Fallot, A. Letourneau, S. Cormon, M. Fechner, L. Giot and T. Lasserre et al., Phys. Rev. C 83 (2011) 054615 [arXiv:1101.2663 [hep-ex]].
- [21] P. Huber, Phys. Rev. C 84, 024617 (2011) [Erratum-ibid. C 85, 029901 (2012)] [arXiv:1106.0687 [hep-ph]].
- [22] S. Jetter, talk given at NuFact13.
- [23] P. Vogel and J. F. Beacom, Phys. Rev. D 60 (1999) 053003 [hep-ph/9903554].
- [24] P. Huber, M. Lindner and W. Winter, “Simulation of long-baseline neutrino oscillation experiments with GLoBES (General Long Baseline Experiment Simulator),” Comput. Phys. Commun. 167, 195 (2005) [hep-ph/0407333]; P. Huber, J. Kopp, M. Lindner, M. Rolinec and W. Winter, “New features in the simulation of neutrino oscillation experiments with GLoBES 3.0: General Long Baseline Experiment Simulator,” Comput. Phys. Commun. 177, 432 (2007) [hep-ph/0701187].
- [25] K. Abe et al. [T2K Collaboration], Phys. Rev. Lett. 111 (2013) 211803 [arXiv:1308.0465 [hep-ex]].
- [26] K. Abe et al. [T2K Collaboration], Phys. Rev. D 87 (2013) 092003 [arXiv:1302.4908 [hep-ex]].
- [27] Private communication of T2K collaboration to the authors of the article: D. Meloni and M. Martini, Phys. Lett. B 716 (2012) 186 [arXiv:1203.3335 [hep-ph]].
- [28] P. Huber, M. Lindner, T. Schwetz and W. Winter, Nucl. Phys. B 665 (2003) 487 [hep-ph/0303232].
- [29] P. Coloma, P. Huber, J. Kopp and W. Winter, Phys. Rev. D 87 (2013) 3, 033004 [arXiv:1209.5973 [hep-ph]].